Interplay between spin dynamics and crystal field in multiferroic compound HoMnO3
Abstract
In the multiferroic hexagonal manganite HoMnO3, inelastic neutron scattering and synchrotron based THz spectroscopy have been used to investigate the spin waves associated to the Mn order together with Ho crystal field excitations. While the Mn order sets in first below 80 K, a spin reorientation occurs below 37 K, a rare feature in the rare earth manganites. We show that several Ho crystal field excitations are present in the same energy range as the magnons, and that they are all affected by the spin reorientation. Moreover, several anomalous features are observed in the excitations at low temperature. Our analysis and calculations for the Mn spin waves and Ho crystal field excitations support Mn-Ho coupling mechanisms as well as coupling to the lattice affecting the dynamics.
pacs:
PACS 75.85.+t, 78.30.-j, 78.20.Bh, 78.70.NxI Introduction
Multiferroics continue to attract much attention in condensed matter physics, because of the promising applications in spintronics they offer, but also because these materials raise fundamental questions. One of these concerns the understanding of the microscopic origin of the coupling between magnetic and electric degrees of freedom, and how new excitations resulting from this coupling, for instance electromagnons, can emerge. Electromagnons were first reported in 2006 as magnetic excitations excitable by the electric field component of the electromagnetic wave Pimenov2006 . Since then, electromagnons have been observed in several compounds with non colinear magnetic order such as perovskites Pimenov2006 ; Sushkov2007 , hexaferrites Kida2009 or even the more simple cupric oxide Jones2014 . Various mechanisms at the origin of these excitations were invoked and identified, among which the inverse Dzyaloshinskii-Moriya interaction Katsura2007 , symmetric exchange-striction mechanism Mochizuki2010b or higher harmonics of the magnetic cycloids Mochizuki2010 . Other types of excitations involving electric and magnetic degrees of freedom have also been reported such as atomic rotation mode excited by the magnetic field component of the terahertz (THz) light Chaix2013 or hybrid excitations arising from the interplay between rare-earth crystal field (CF) excitations and 3d transition metal magnons Sirenko2008 ; Kang2010 , in particular in the hexagonal manganite ErMnO3 Chaix2014 . All these hybrid excitations often lie in the THz range and are also investigated using inelastic neutron Pailhes2009 or X ray scattering Toth2016 and Raman spectroscopy Aupiais2018 .
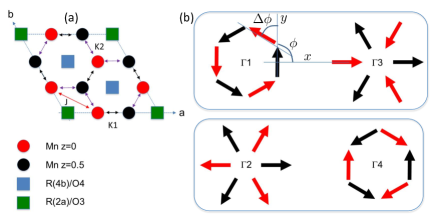
The hexagonal manganites h-RMnO3 where R= Y, Er, Ho, etc, crystallizing in the P63cm space group, have been widely studied Bertaut1963 ; Katsufuj2002 ; Cheong2007 ; Sim2016 since they combine remarkable properties associated to multiferroism and magnetic frustration. They belong to type I multiferroics, where ferroelectricity and magnetic orders occur at different temperatures: onset of an electric polarization along the c-axis at much higher temperature (TC800K) than the ordering of the Mn magnetic moments (TN80K). Despite these different energy scales, non negligible coupling between the electric and magnetic degrees of freedom are present. For instance, the Mn magnetic ordering is accompanied by ionic motions inside the unit cell Fabreges2009 ; Lee2008 giving rise to a giant magneto-elastic coupling, connected with an increase of the ferroelectric polarization. The Mn sublattice consists of triangular planes (Fig. 1) with a peculiar stacking along the c-axis, each Mn3+ ion sitting close to the middle of the triangle of Mn3+ belonging to adjacent layers. The actual materials have then in common a 120∘ spin structure for the Mn magnetic moments in the triangular planes, but the stacking and relative phase difference of these patterns depend on the R atom ((magnetic R=Ho, Yb, or not R= Y, Sc), and correspond to the four one-dimensional irreducible representations shown in Fig. 1. A key parameter tuning the sign of the exchange interaction and the Mn3+ single-ion anisotropy seems to be the shift away from 1/3 of the position of the Mn3+ ions within the triangular plane Fabreges2009 ; Solovyev2014 . The ions R3+ are situated on two Wyckoff sites 2a and 4b. For magnetic rare earths, they also order at lower temperature, either polarized by the Mn molecular field (site 4b) or from their mutual interaction in a temperature range of few K (site 2a) Fabreges2008 ; Chattopadhyay2018 .
In this study, we focus on the Ho compound, which has been intensively studied for its rich phase diagram and its strong magnetoelectric effects Cheong2007 ; Lottermoser2004 . It becomes ferroelectric at 875 K and the Mn magnetic moments order at TN=75 K in the representation (see Fig. 1). Remarkably, a spin reorientation occurs at TSR=37 K which is concomitant with the ordering of the Ho(4b) magnetic moments, while the Ho(2a) moments order around =5 K, both along the c-axis Munoz2001 ; Fiebig2002 ; Brown2006 ; Brown2008 ; Nandi2008 ; Fabreges2009 . This Mn reorientation transition, unique in the hexagonal manganites, shows up also in the electric properties with a drop in the electric polarisation below TSR which is further recovered at Hur2009 . Signatures of the rare-earth Mn coupling in the spin dynamics in an applied magnetic field have also been reported Talbayev2008 ; Laurita2017 , although no rare-earth CF-Mn magnon hybridization has yet been observed.
We report here a detailed study on the dynamical properties of this compound in the THz range using both electromagnetic waves and neutrons as complementary probes. We show that the THz dynamics is particularly complex in HoMnO3 due to the presence of several Ho CF excitations in addition to the Mn spin waves that surprisingly become non-dispersive along the c-axis at low temperature. To interpret the observed spectra and their remarkable temperature dependence through the spin reorientation transition and below, we have performed calculations both for Mn and Ho dynamics. Our work brings new insight on the complex spin dynamics of this compound including possible signatures of the couplings between the different magnetic ions, but also with their lattice surroundings.
II Experimental details
Single crystals have been grown using the floating zone method, yielding rods of about 7 mm in diameter and 4 cm long. From these crystals, two small plaquettes were cut for the THz measurements (Typically 2 mm in diameter and 300 m in thickness): one with the c-axis perpendicular to the plaquette, the other one with the c-axis within the plaquette. The polarized THz emission of the synchrotron at SOLEIL was used to probe the THz properties similarly to the study on ErMnO3 Chaix2014 .
Inelastic neutron scattering (INS) measurements were performed at the thermal spectrometer IN8 (ILL) as well as at the 4F1 and 4F2 cold triple-axes spectrometers installed at LLB. The final wave vector used was = 2.662, 1.55 or 1.3 Å-1 depending on the desired energy resolution (0.8, 0.25 and 0.12 meV respectively). Higher order reflections were removed using a PG (IN8) or nitrogen cooled Beryllium filter (4F). The sample was mounted to have access to scattering wave-vectors and attached to the cold finger of an orange cryostat. Several Energy-scans taken along were collected to construct the maps shown in Fig. 2 and 3.
III Inelastic neutron scattering
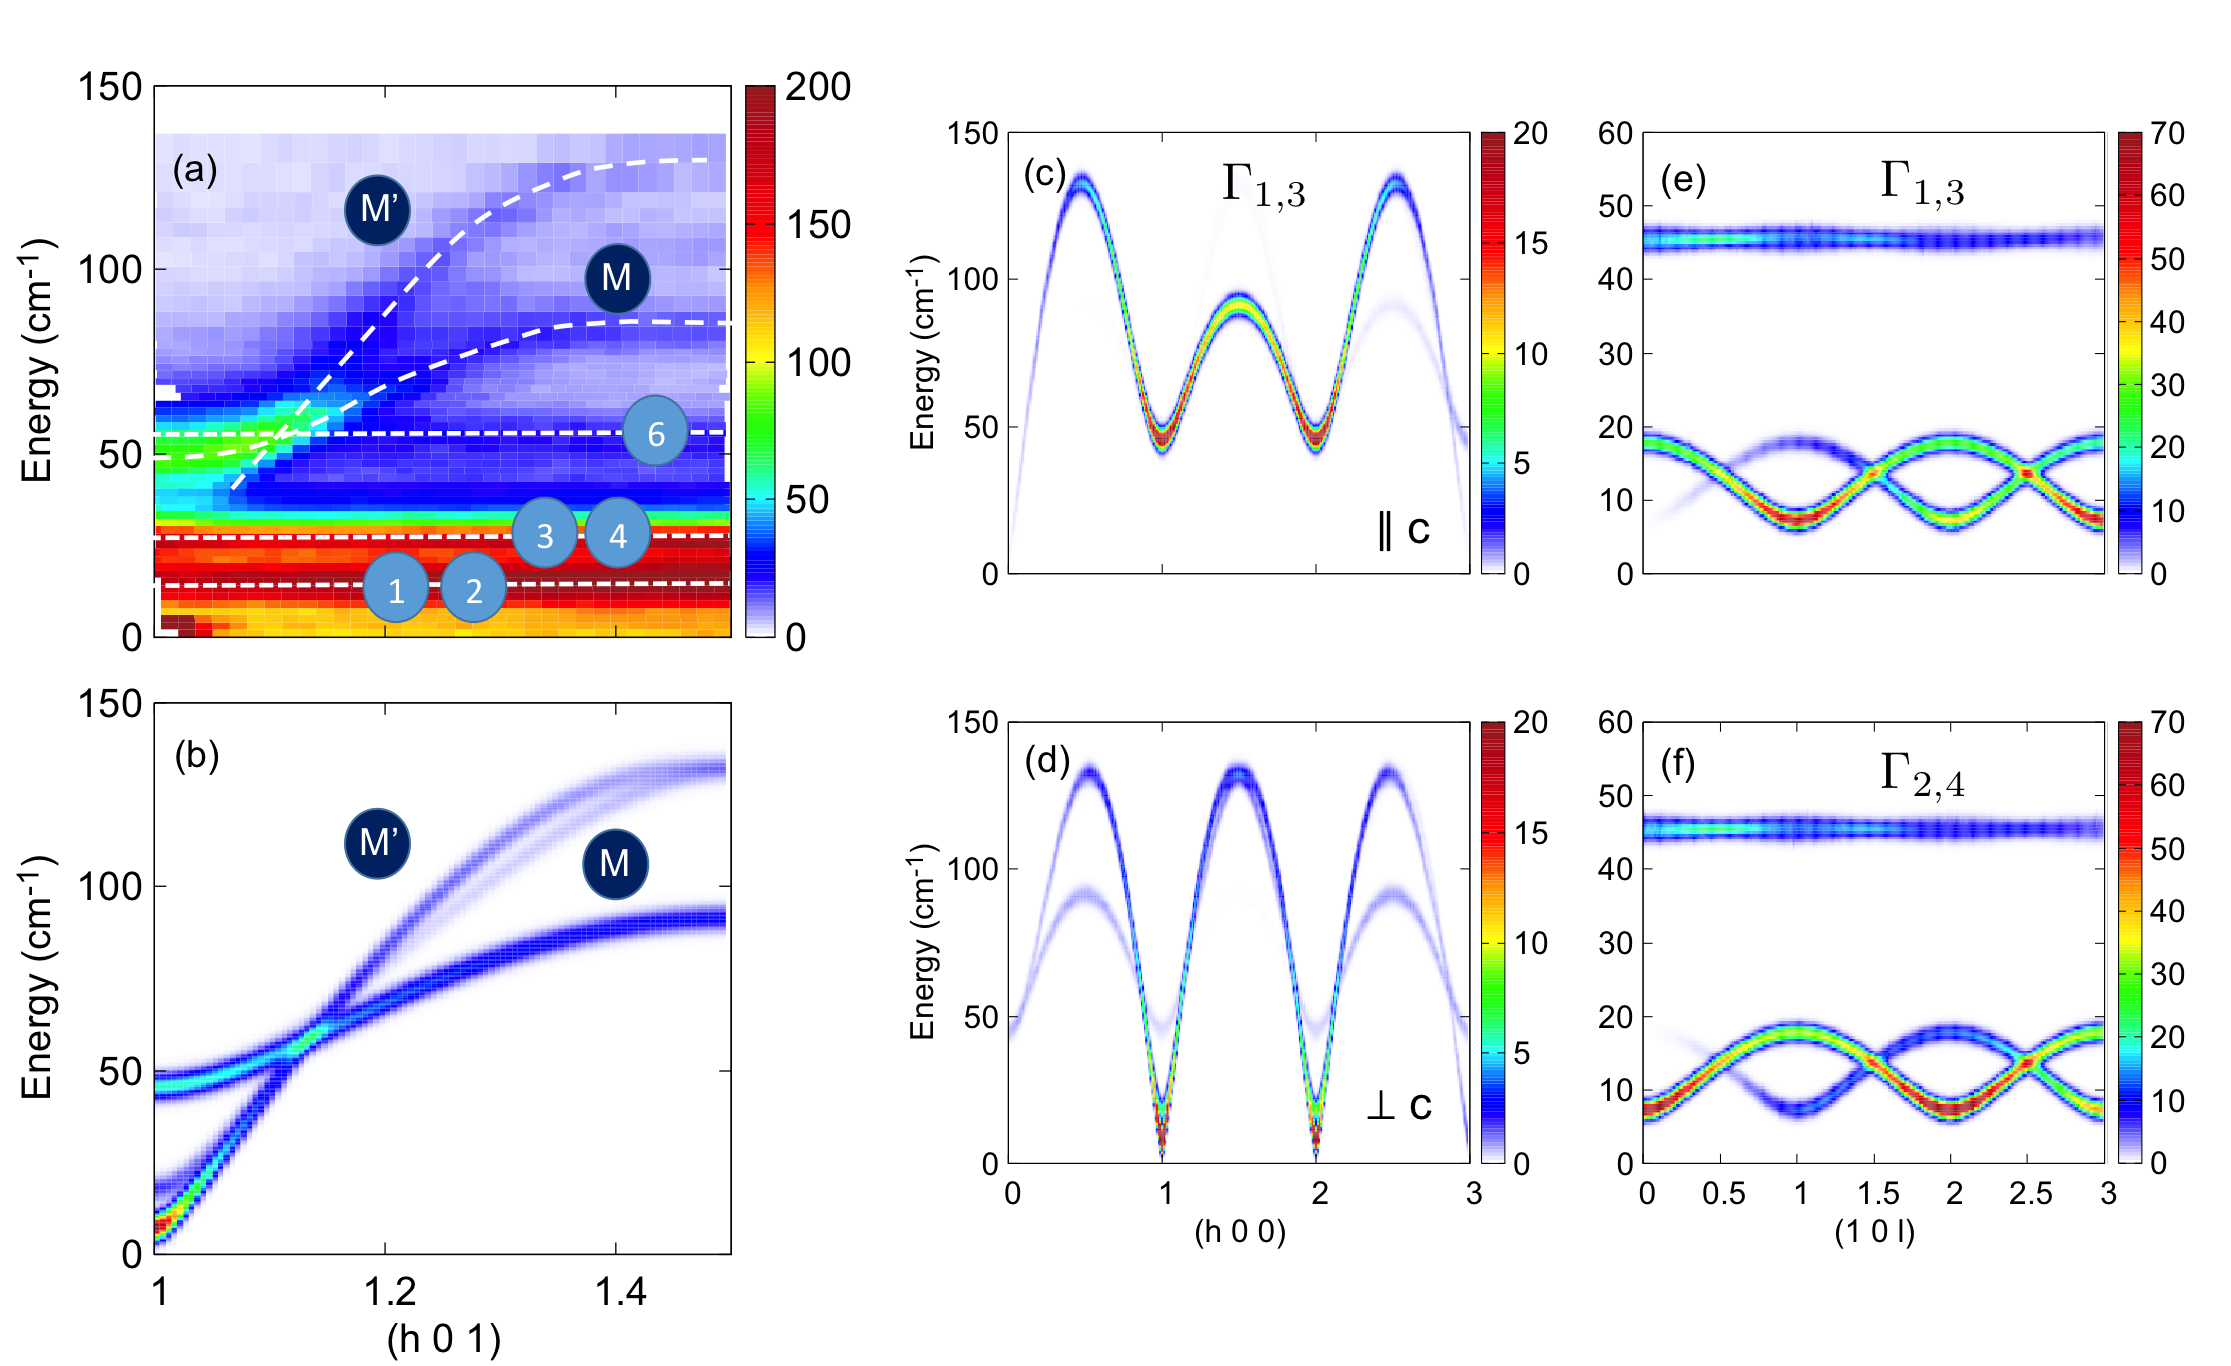
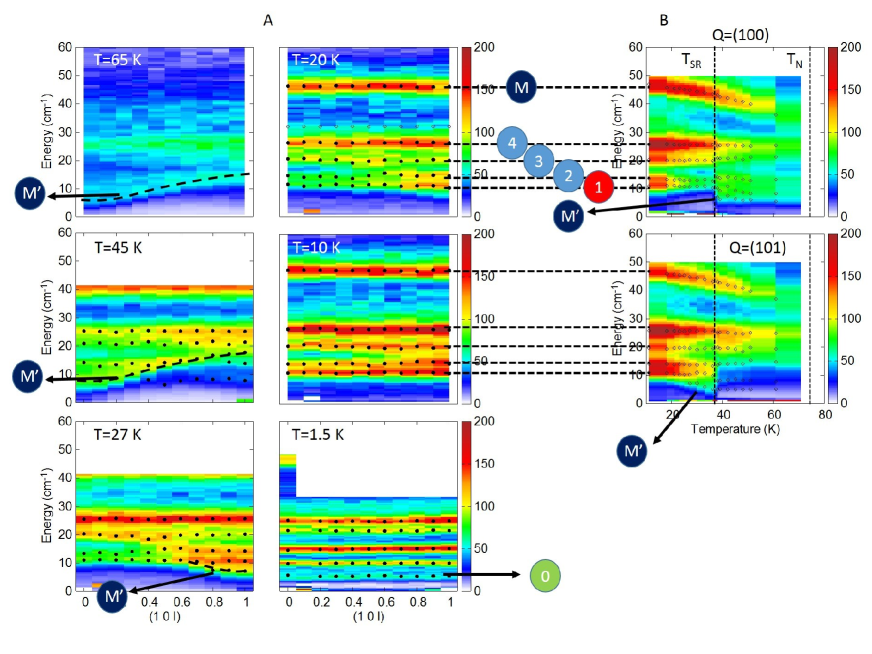
The magnetic excitations have been first investigated by INS. Figures 2a and 3 give an overview of those results, showing the spectra along , along , and the temperature dependence measured at the zone centers (1, 0, 0) and (1, 0, 1). Dispersive spin waves are clearly visible along with a maximum of the branches around 17 meV (140 cm-1) while the amplitude of dispersion along is much weaker, reflecting the hierarchy of the magnetic interactions much stronger within the ab-planes than in between. In addition to the spin waves, non-dispersive excitations are visible corresponding to transition between CF levels of the two Ho3+ ions on 4b and 2a sites. Remarkably, a significant temperature dependence of the magnetic excitations is visible at TSR as shown at the zone centers (1, 0, 0) and (1, 0, 1) in Fig.3 where changes of spectral weight are observed for all the excitations below 30 cm-1. More surprisingly, along , the spin waves dispersion disappears gradually below TSR and finally the corresponding branches remain flat below 10 K.
The coexistence of both spin waves and CF transitions, along with a subtle temperature evolution, make however the interpretation of those spectra quite complex. Fortunately, previous studies Sato2003 ; Park2003 ; Vajk2005 ; Petit2007 ; Fabreges2008 ; Fabreges2009 ; Pailhes2009 ; Kim2018 performed for several members of the RMnO3 provide valuable assistance. They especially concluded to the relevance of the following Hamiltonian to describe the Mn spin waves:
| (1) | |||||
In this expression, is the Mn spin at site , is an index that labels the two Mn planes in the unit cell, is an easy plane anisotropy (), and are effective easy axis anisotropies, forcing the spins to point along the or directions (see Fig.1). is the antiferromagnetic coupling between neighboring spins in the same plane, and the antiferromagnetic coupling between neighboring spins in adjacent planes. As shown in Fig. 1a, the position allows to distinguish two different paths for , a long and a short one, labeled hereafter as and . To proceed, we first assume and . Straightforward classical minimization of shows that the ground state structures are planar 120∘ spin configurations. Using the convention of Figure 1, the moments are given by :
| (2) |
and the classical energy writes:
| (3) |
The value of along with the relative phase difference between two adjacent planes fully determine the final structure. These structures can be classified using the irreducible representations listed in Table 1. Note that two 2-dimensional irreducible representations are also allowed in the P63cm space group but were not considered in this work. The sign of determines the stability of each phase: are stabilized for , while are stabilized for .
| Conditions | |||
|---|---|---|---|
| 1 | |||
| 2 | 0 | ||
| 3 | 0 | 0 | |
| 4 | 0 |
In principle, six spin wave branches are expected in this model. However, since , these branches should be considered as three almost doubly degenerate modes. Moreover, due to the hexagonal symmetry, these three branches can be described by a single one, stemming from and going soft at . The two other branches are identical but stem from and and go soft respectively at and . As shown in Fig.2(c,d), spin wave calculations indicate that the former corresponds mostly to correlations between spin components along the c-axis (Fig.2c), while the two latter correspond mostly to in-plane correlations (Fig.2d). As a result, two acoustic-like and one optical-like spin wave emerge from each zone center. The gap of the latter occurs at around 40 cm-1 (5 meV) and is related to the easy-plane anisotropy by .
As explained above, the degeneracy is lifted as soon as . This becomes especially clear when looking at the dispersion along . This point is illustrated in Fig.2e-f, showing the calculated spin wave dispersions for the different magnetic configurations. We notice that the spectral weight of the lowest energy mode is strong at for , and at in the case of . This change has been put forward in Ref. Fabreges2009, to explain that the spin reorientation process in HoMnO3 involves a symmetry change from below TN to below TSR with a 180∘ rotation of the spins in one of the triangular layer. This change was attributed to a change of sign of induced by the change in position of the Mn ions from above TSR to below. In Ref. Fabreges2009, , the authors assumed to be the ground state. Actually, non linear optical measurements as well as other probes suggest rather a magnetic order below TSR Fiebig2002 ; Brown2006 ; Nandi2008 . Since the and pairs are homometric, i.e. they cannot be distinguished by unpolarized neutron scattering if is strictly equal to 1/3, we will assume that is the actual ground state in the following.
With these results in hand, we come back to the analysis of the experimental results. Fig.2b displays the calculated inelastic neutron intensity for Q wave vectors along . Using 2.5 meV and 0.65 meV, the high energy behavior of the spectrum is well reproduced. For instance, the spin wave labeled M originates from the optical-like mode at . It is clearly visible on Figure 2. In Fig.3 (panel A), it looks like a flat band along due to the weakness of the interplane couplings and . Finally, as shown in panel B, hardens towards 45 cm-1 when decreasing temperature. Note that some renormalisation of the Mn excitations has been reported in HoMnO3 as due to magnon-phonon coupling Kim2018 .
The second dispersive spin wave labeled M’ is the acoustic-like spin wave mode stemming from the zone center and consisting of two interlaced branches. It can be also identified in Fig.3, thanks to the strong intensity expected for structures at (1, 0, 0). Below TSR, this spectral weight jumps to (1, 0, 1), as a result of the transition to . From panel B in Figure 3, the change of spectral weight from (1,0,0) to (1,0,1) at TSR can also be noticed. The bandwidth of M’ is well captured for meV. The gap of this mode originates from small single-ion anisotropies of the Mn3+ (terms and ). An additional origin of anisotropy is expected to come from the Ho molecular field that should lead to a scaling of the gap with the Ho(4b) ordered moment. Indeed, at the mean field level, the coupling between the 3d and 4f magnetic species writes:
where is the coupling tensor, and are indices that label the unit cell and the atom for the 3d and rare earth sublattices. is the average magnetic moment at the rare earth site. Combined with the exchange Hamiltonian described in Eq. 1, polarizes the Mn spins, hence plays the role of anisotropy. In principle, this should result in a gap in the spin wave spectrum as observed in YbMnO3 Fabreges2010 . However, in the present case, the expected scaling seems not to fully operate probably due to the coupling of the Mn spin waves with Ho CF excitations.
Indeed, in addition to the spin waves, non-dispersive excitations are also visible in Fig.2 and 3. These features correspond to CF transitions of the Ho3+ ions on 4b and 2a sites and are labeled 0-6. As we shall see in the next part, those labels are also used to describe the THz data (see Figure 4). Note that the mode 5 is not visible in our neutron scattering experiments probably because it overlaps with the magnon M or because its neutron cross section is intrinsically weak. Panel B of Figure 3 shows the temperature dependence of CF transition modes 1 to 4. The intensity of those modes gradually increases with decreasing temperature while their positions slightly change, but the most remarkable feature is the formation of an additional line labeled 1 just below TSR. Note that the line labeled 0 appears at very low temperature only, hence probably due to the Ho ordering on site 2a. In addition, quite strikingly, the dispersion of M’ eventually merges gradually below TSR into those CF lines (at least into those below 30 cm-1). Finally, the spectrum encompasses only flat bands below 10 K.
We point out that this very peculiar temperature evolution of M’ shows that this branch crosses several Ho crystal field excitations, which makes very likely hybridization mechanisms (via a resonant process) between the Mn spin wave dispersion and the CF lines at low temperature.
IV Synchrotron based THz spectroscopy
To get a better insight into the spin dynamics, we have used THz spectroscopy as a complementary probe of both Mn spin waves and Ho Crystal field excitations. In this electromagnetic absorption technique, due to the high velocity of photons in the material, the measurements are considered in the long wave length limit and comparison with neutron data is therefore relevant for the (0, 0, 0) center of the Brillouin zone. There, all Ho crystal field excitations should be present. As for the the Mn spin waves, calculations similar to those presented in the previous section show that the four different spin configurations have the same signature at (0,0,0). It consists of a high energy branch (M) expected around 45 cm-1 which involves correlations between spin components perpendicular to the c-axis, and a single low energy branch M’ corresponding to spin correlations along the c-axis that is pushed to finite energy when some spin anisotropy is present (see above and Fig.2).
The THz spectrum of HoMnO3 was first studied in Talbayev2008 where the Mn (M) magnon mode as well as several Ho crystal field excitations were observed as a function of external magnetic field. The Mn magnon was more recently investigated under light irradiation Bowlan2016 while its dependence on the Ho-Mn interaction is reported in Laurita2017 . Here, thanks to synchrotron based spectroscopy, we are able to measure with great precision the whole spectra from 0.3 to 1.8 THz (10 to 60 cm-1).
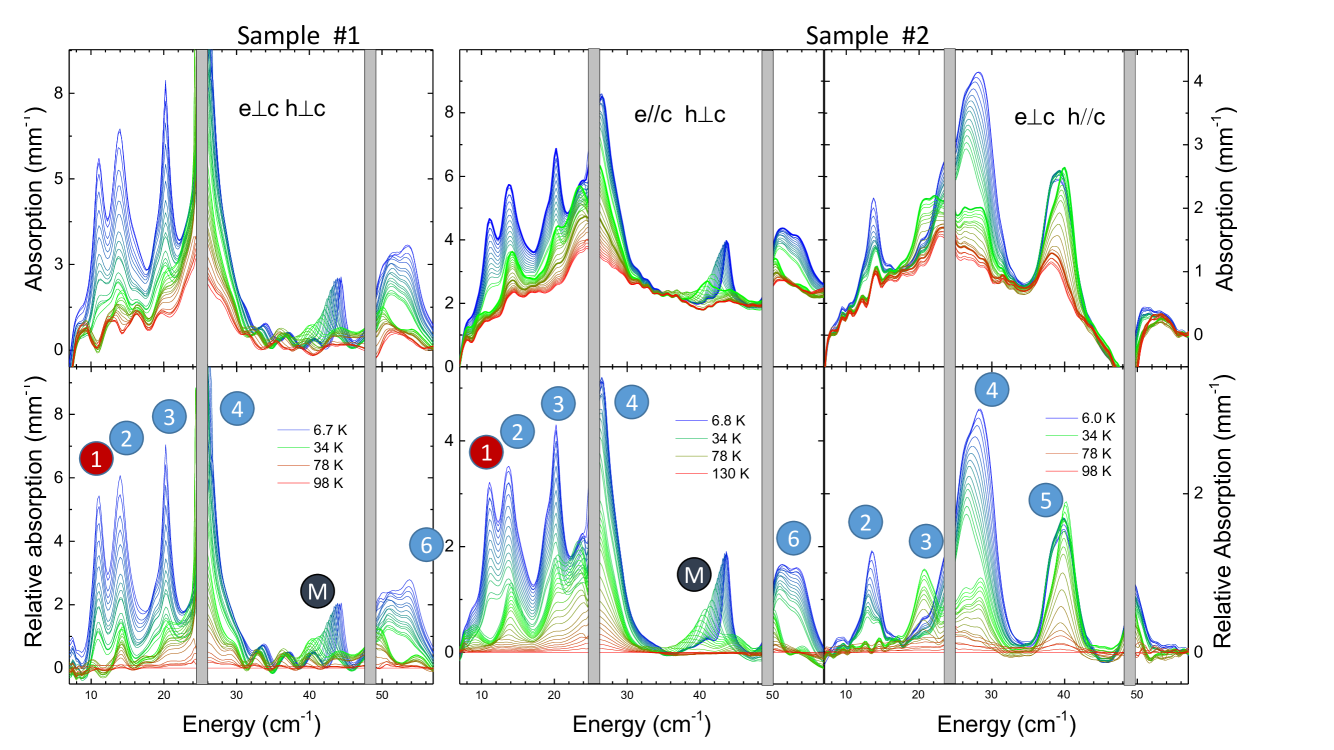
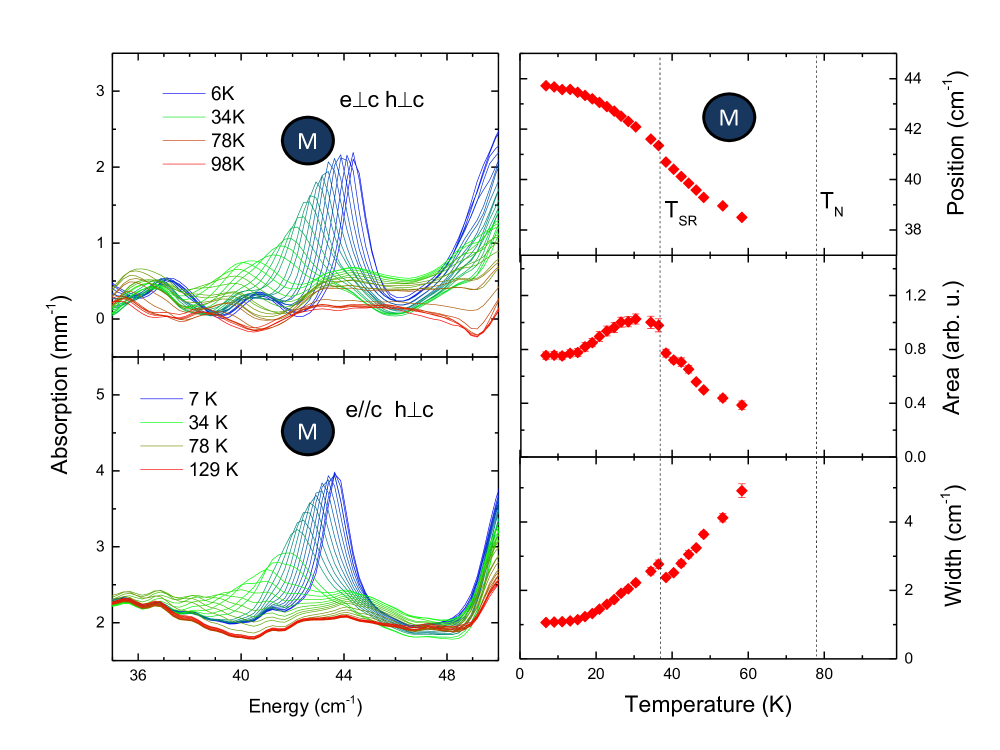
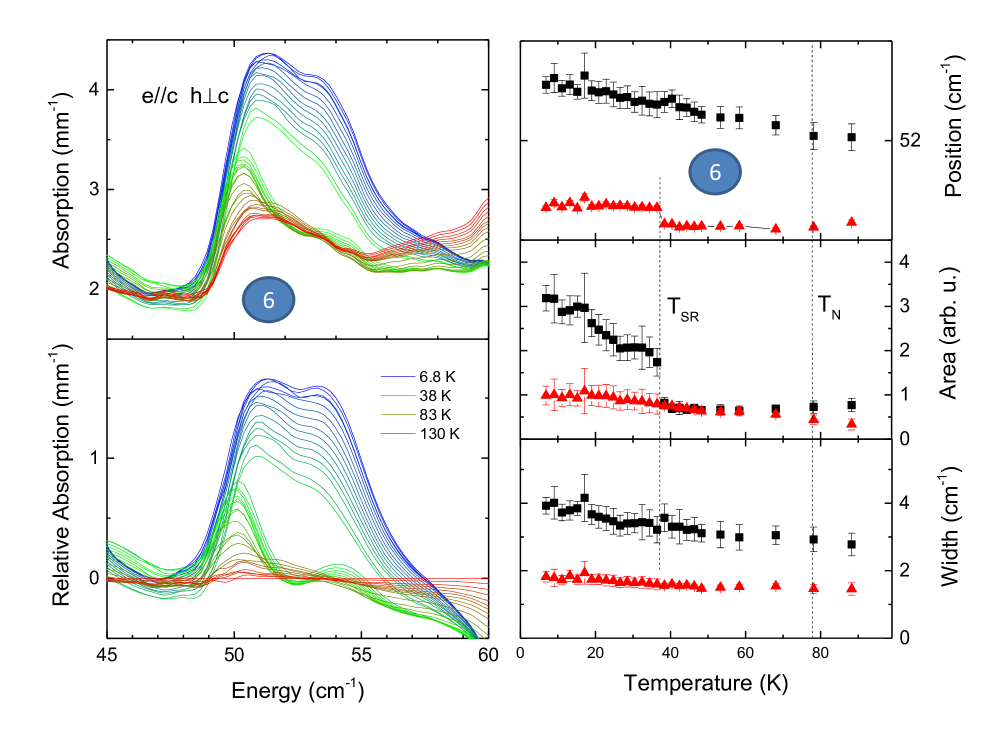
All the spectra recorded at different temperatures from 130 K or 100 K down to 6 K are shown in Fig.4 for the three possible orientations (as regards the c-axis) of the THz electric e and magnetic h fields. Several absorption bands are observed from 11 cm-1 up to 55 cm-1, quite differently from other hexagonal manganites such as YMnO3 or ErMnO3, suggesting the influence of Ho ions in these THz spectra. Further inspection shows that, for the two different THz polarizations with the same magnetic field direction hc, the spectra are very similar and differ substantially from the case where . This is a strong indication that all the observed excitations are of magnetic origin. The Mn magnon (M) expected around 45 cm-1 is clearly observed for hc and seems to behave as expected for a conventional magnon by emerging below TN. It shifts to higher energies when the temperature is lowered (see Fig.5). This magnon involves spin components perpendicular to this axis, in agreement with the THz magnetic selection rule hc. The other Mn magnon (M’) involving the spin component along the c-axis is expected at lower energies for but is not easily distinguishable. All the other observed bands are specific to the Ho compound and should be related to Ho crystal field excitations. Quite surprisingly, all spectra are strongly affected by the spin reorientation process at TSR.
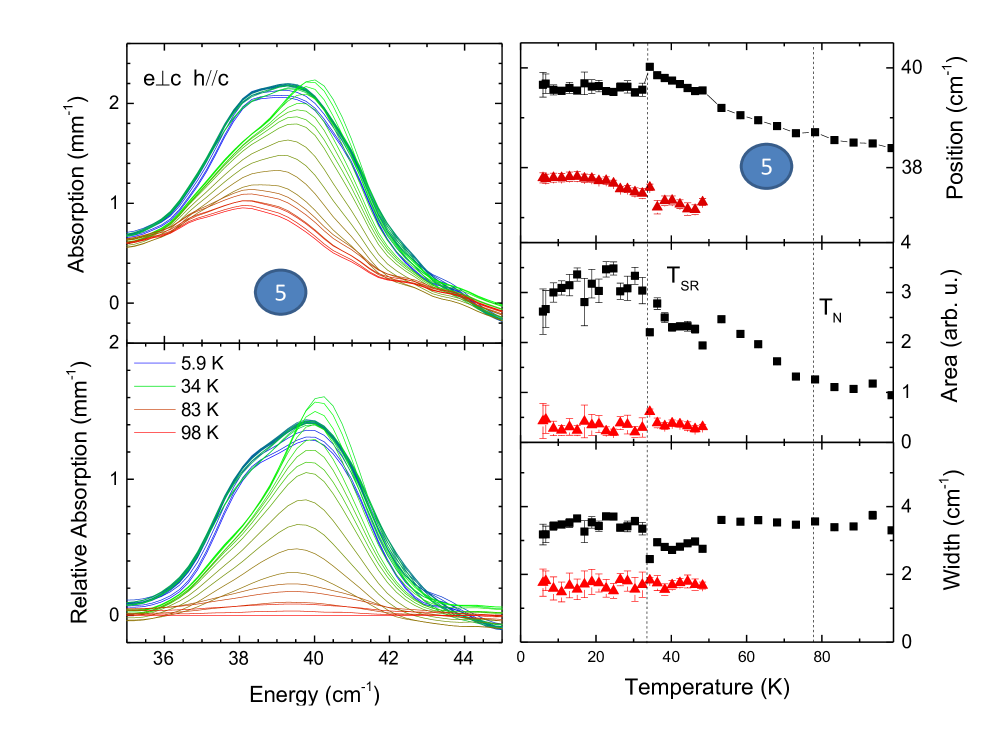
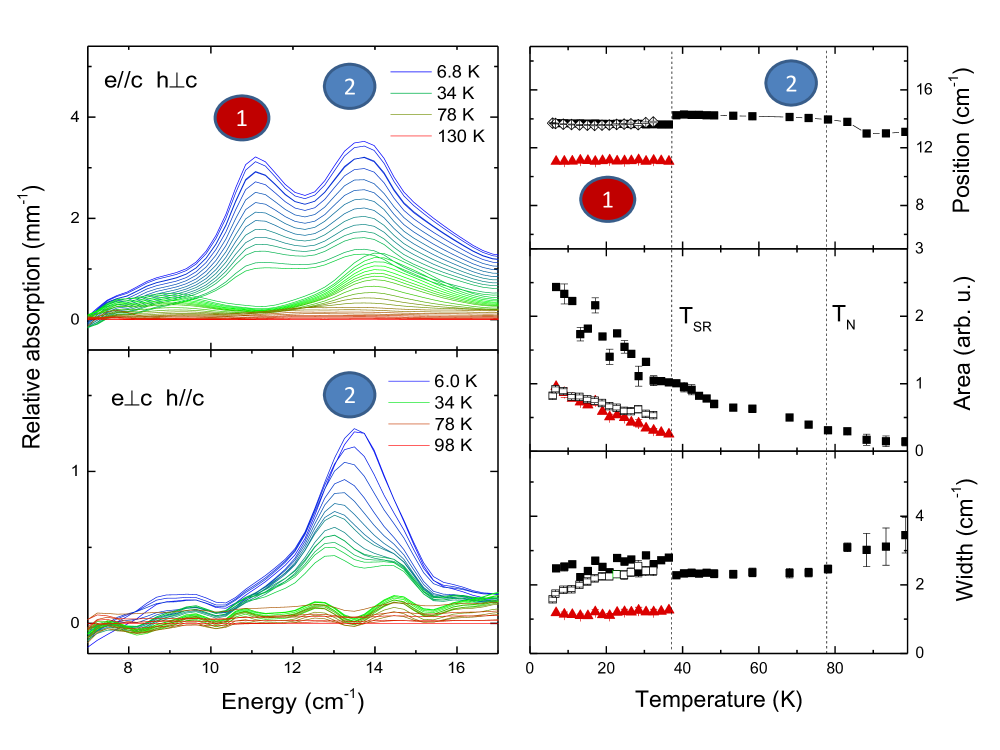
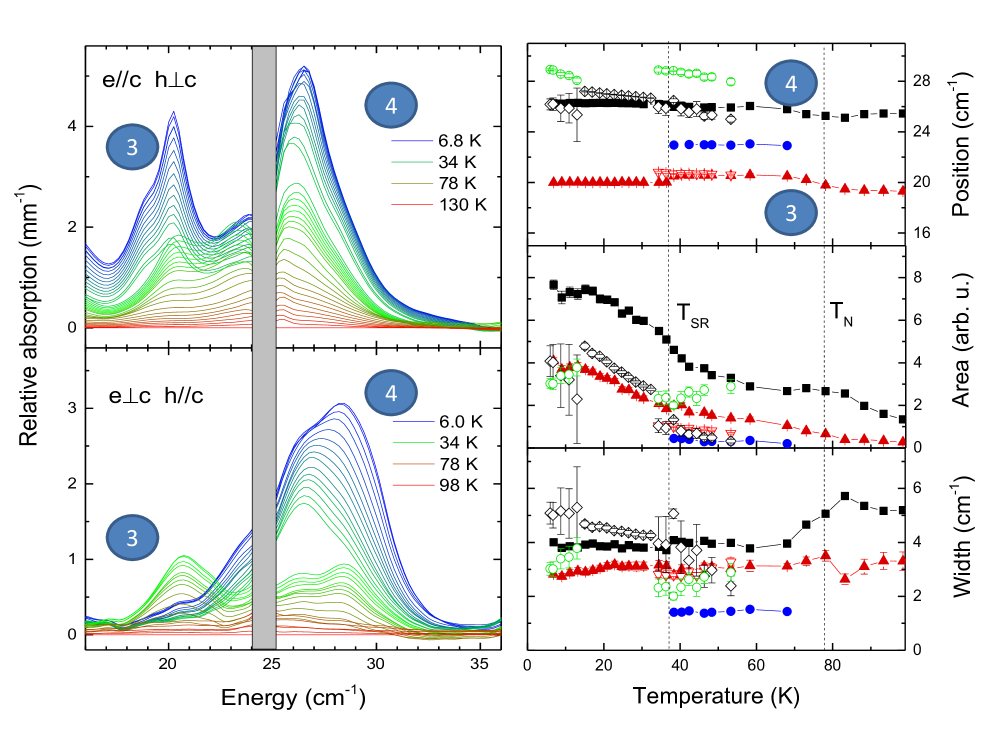
A detailed description of the temperature dependence of the spectra are given in Fig.5 to Fig.9. Six different bands (each possibly including several excitations) are clearly visible together with the Mn magnon. The absorption peaks have been fitted with gaussian profile and their position, spectral weight (area) and lifetime (width) are reported. They all show, at the reorientation transition TSR, a slight change of their position in energy and more or less pronounced change of spectral weight. In particular band 1 is observable only below TSR and for hc (see Fig.6). Band 2, always present for hc, is observable only below TSR when (see Fig.6). Band 3, always present for hc, disappears below TSR when , while band 4 has a strong increase below TSR (see Fig.7). Note that band 3 below TSR might have a shoulder and that band 4 encompasses certainly several modes. Finally, band 6 and maybe also band 5 have a side band that increases below TSR (see Figs.8 and 9). The Mn magnon (M) is also affected by the spin reorientation at TSR: an abrupt change, although weak, occurs in its position and line width while its area, which was increasing below TN, starts to decrease and becomes temperature independent below 10 K (see Fig.5).
A comparison with the neutron data can be made keeping in mind that neutron scattering measures the imaginary part of the dynamical susceptibility that is equal to the THz absorption divided by the energy. Both techniques show remarkable agreement: At 20 K, below TSR, the observed five flat bands along ) in the neutron data (see Fig.3) correspond nicely to band 1 - 4 and to the magnon M observed in THz spectroscopy. The band 6 is also visible as a non dispersive branch at low temperature in the neutron data of Fig.2. At 45 K, above TSR, five branches are visible in the neutron spectra, three of them correspond to bands 2-3-4 in THz, while the dispersive magnon M’ is not distinguishable in THz, probably because it is below the energy window of the THz spectroscopy or mixed inside bands 3-4 (see Fig.3). To go further into the analysis of the different magnon/crystal field contributions and their possible hybridization, we propose additional modeling of the complex Mn and Ho dynamics. We first focus on the crystal field excitations associated to the Ho ions.
V CRYSTAL FIELD CALCULATIONS
Crystal field effects were calculated in a point charge model taking into account the whole oxygen coordination shell of the Ho3+ ions (4) for site 4b in C3 symmetry and site 2a in C3v symmetry Stevens1952 ; Hutchings1965 ; Chaix2014 . The atomic coordinates were obtained from a refinement of neutron diffraction data at 10 K Fabreges2009 . The associated Hamiltonian for each Ho3+ ion in the ground multiplet =8 can be expressed as:
| (4) | |||
| (5) | |||
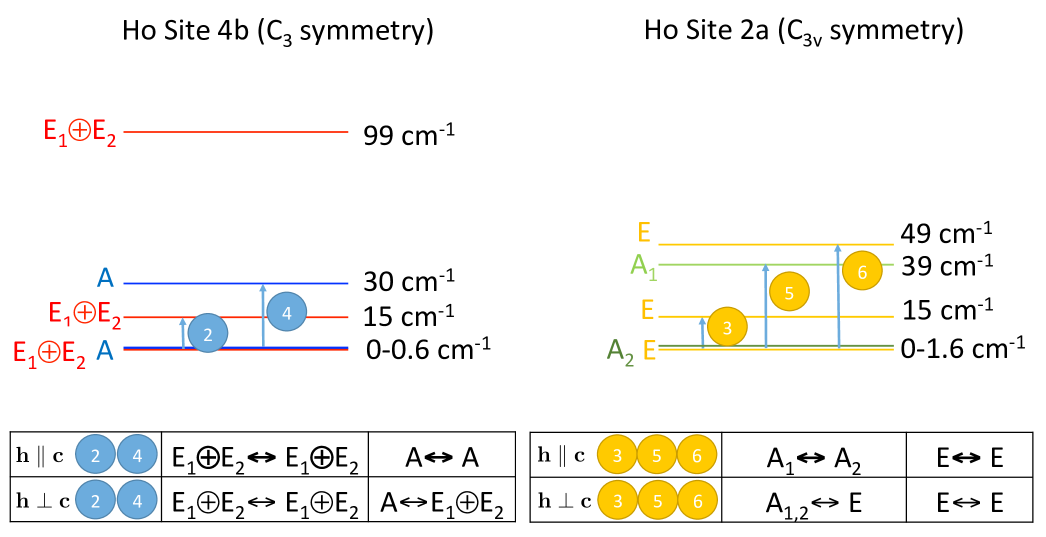
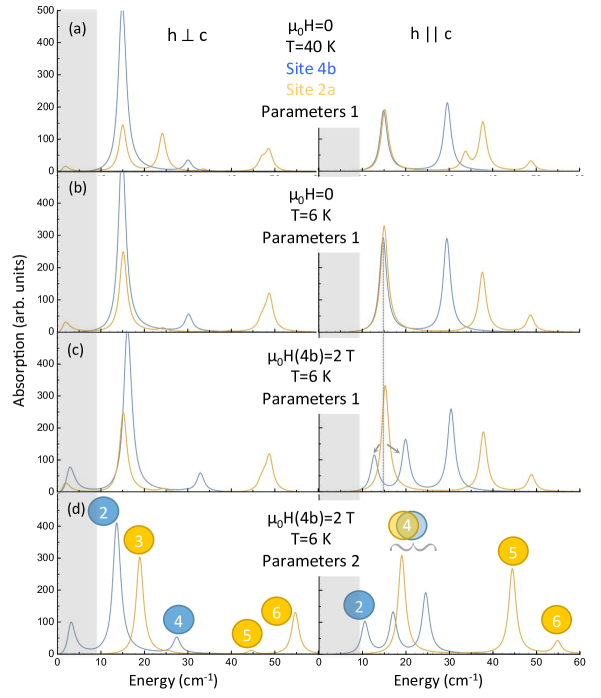
for sites 4b and 2a, in terms of Racah operators. A global screening factor of 20% was estimated in order to obtain the transition between the CF levels in the experimental energy range. The CF parameters resulting from this calculation, labeled set 1, are given in Table 2. The deduced energy scheme and selection rules are given in Fig.10. For Ho 4b, the energy scheme contains singlet () and degenerate doublets (). Four different energy levels are calculated below 100 cm-1. For Ho 2a, two singlets (, ) and one doublet () are present with four different energy levels in the same energy range. They are all allowed to occur for any orientation of the THz magnetic field. The calculated absorption is shown in Fig. 13(a) and (b) for both orientations of the THz magnetic field at 40 K and 6 K respectively. The energy and relative intensities of the highest energy bands 5 and 6 are correctly reproduced. However the agreement between the calculations and the observed complex set of mixed excitations below 30 cm-1 is less accurate.
| set 1 | Ho (4b) | Ho (2a) |
|---|---|---|
| 0.392332 | -0.664753 | |
| 0.000747 | -0.000978 | |
| -0.037963+i 0.008016 | -0.039276 | |
| -0.000776 | -0.000848 | |
| 0.000337-i 0.000075 | 0.000219 | |
| -0.000492 | -0.000531 | |
| set 2 | Ho (4b) | Ho (2a) |
| 0.392332 | -0.531802 | |
| 0.000747 | -0.000978 | |
| -0.037963+i 0.008016 | -0.039276 | |
| -0.000705 | -0.000917 | |
| 0.000306-i 0.000068 | 0.000237 | |
| -0.000448 | -0.000574 |
To go further, we took into account the coupling of the Ho 4b magnetic moments with the Mn ones expected to occur below TSR (discarding a possible magnetic coupling of the Ho 2a with Mn) Nandi2008 . This was achieved by including in the calculations the influence of the local magnetic field produced by the Mn moments on the Ho 4b site, similarly to the case of ErMnO3 Chaix2014 . This field was chosen along the c-axis according to the observed c-direction of the Ho ordered magnetic moments. Its value was adjusted at 2 T so that the ordered Ho 4b magnetic moment extracted from the neutron diffraction data is reproduced at low temperature (see Appendix I). The influence of this magnetic field is to change slightly the energy of some peaks and to produce additional splitting of some CF levels (see Fig.11b and c for the parameter set 1). We can notice in particular that the lowest energy CF peak corresponding to Ho 4b (in blue) in zero field splits into two peaks under magnetic field. However, experimentally, there are abrupt changes at TSR for all the THz bands, both on their position and their intensity, which cannot be accounted for by the sole effects of temperature and molecular field. This is a strong indication that electric effects with modification of electric charge screening are at play at TSR. This is further corroborated by the observation simultaneously of a sharp anomaly in the dielectric constant as well as a jump in the electric polarisation along the c-axis Hur2009 .
With little additional changes of some CF parameters (set 2 in Table 2), we can reproduce qualitatively most of the observed features in the THz spectra (see Fig. 13d for T=6 K and a field of 2 T). In particular, bands 2, 3, 4, 5 and 6 are predicted at energies closer to the measured ones, although there are still some discrepancies with the calculated intensities. The presence of peak 3 above TSR for and its disappearance below TSR while a new peak labeled 2 appears at lower energy could be due to the field splitting ascribed to the Ho-Mn coupling. Band 4 for below TSR could then result from a mixture of several peaks including the higher energy mode from the split peak (see horizontal bracket in Fig. 13d).
Strikingly, for , band 1 appearing at TSR in the measurements is missing in the calculations and therefore cannot be accounted for by the effect of a magnetic field. This discrepancy between calculations and experiment is another indication that hybridization is at play between Ho CF excitations and the lowest energy Mn magnon (M’).
VI Discussion
Our analysis and calculations for the Mn magnetic order and associated spin waves, using the spin Hamiltonian of eq.1, can account for most of the experimental data. Mainly, two spin branches M and M’ are observed with INS that are correctly calculated (Fig.2 and 3). In particular, the spin reorientation at TSR is clearly seen as a change in the spin wave dispersion along for the branch M’ and is correctly captured when the change of Mn spin configuration from to is introduced. The second branch M is also observed with THz spectroscopy (Fig.5), in agreement with the model. As for the non dispersive Ho CF excitations observed with INS and THz spectroscopy, our calculations using the CF hamiltonian described by eq.4 and 5 is able to reproduce the experimental data qualitatively when two ingredients are included: first, a change in charge screening at TSR that explains the observed shifts and changes in intensity of the whole CF spectrum, and second, a molecular field along the c-axis produced by the Mn order. Similarly, a molecular field produced by the Ho 4b order may be introduced to account for the increased anisotropy gap in the Mn spin wave branch M’. However our calculations do not agree quantitatively with the whole experimental data: they cannot describe properly how the Mn spin branch M’ become non dispersive along and seems to merge into Ho CF excitations below 20 K. Moreover, they cannot explain the THz band 1 that appears at TSR and is locked at 3 cm-1 below band 2 (Fig.6). Additional ingredients should be at play there, that couple the 3d and 4f magnetic species dynamically.
It is possible for Mn Magnons and Ho crystal field excitations to hybridize, if they are close in energy, which is the case for the Ho manganite where 6 different Ho crystal field excitations lie in the energy range of the Mn spin waves (see Fig.LABEL:INS2-V4). They also should not be forbidden by symmetry. This can be checked using a group representation analysis for both the Mn spin waves and the Ho crystal field excitations : if they contain at least one common irreducible representation, the coupling is allowed. The details are given in appendix II. According to Sikora1988 , for the Mn magnetic orders with zero propagation vector corresponding to the four different one dimensionnal , the spin wave representation may be decomposed into where we use the irreducible representations of the C6v (6mm) point group. For Ho 4b and 2a crystal field excitations, their decompositions are already given in Fig.10, in the local point groups associated to the two different sites: C3 (3) for Ho 4b, and C3v (3m) for Ho 2a. Their energy scheme contains singlets ( for Ho 4b, , for Ho 2a) and doublets (, for Ho 4b, for Ho 2a). To infer compatibility with those of the Mn magnons, we must consider their decomposition into the irreducible representations of the C6v point group. For Ho 4b, singlets are decomposed into {} and degenerate doublets ( are decomposed into {}. As for the Ho 2a, singlets and are decomposed into {} and {} respectively, and doublets into {} as for Ho 4b. It can be easily seen that they all have in common at least one irreducible representation contained in the Mn spin wave representation except for Ho 2a singlet that is calculated around 40-45 cm-1 and corresponds to band 5.
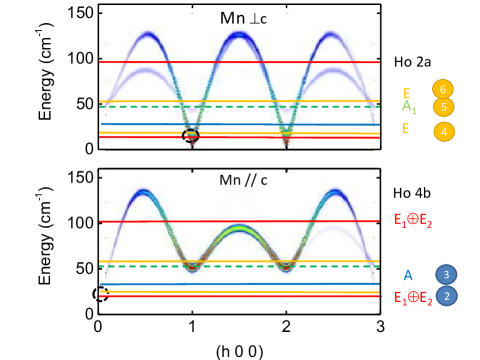
We conclude then that, in the energy range relevant for the experimental data reported in this study, all the CF excitations, except one (band 5 associated to Ho 2a), are allowed to couple to Mn spin waves. Looking back at neutron experiments and the spin wave calculations reproduced in Fig.12, it can be seen that, when the temperature is lowered close to TSR, the magnon M’ with small gaps at the zone centers (1,0,0) and (1,0,1) become close in energy to Ho (4b) CF excitations (bands 2 and 3-4), with different spectral weight for the magnons depending on the magnetic order or . A coupling mechanism may be at play here that contributes to the spin reorientation process and the lost of dispersion for M’ along .
It is worth noting that Ho and Mn ordered magnetic moments below TSR are orthogonal. This suggests that, in the Mn - Ho coupling Hamiltonian of eq.III, the coupling tensor shows non diagonal terms, as it is the case for instance for the pseudo dipolar, the Dzyaloshinkii-Moriya interaction Fabreges2010 or the highest order trigonal anisotropy Plumer2010 . Furthermore, the 2 T effective magnetic field experienced by the 4b Ho suggests a coupling strength 0.1 K. In this context and given the neutron scattering data and the CF analysis detailed above, we may to consider a possible dynamical coupling between i) in plane Mn spin wave modes with Ho CF transitions polarized along the c-axis and ii) out of plane Mn spin wave modes with Ho CF transitions polarized in the (a,b) plane. In this view, it is tempting to assign band 1 to the Mn spin wave hybridized with band 2 (and also likely with band 3). In this scenario, the in plane character of the CF transitions would be transferred to the hybrid mode which would now appear in the hc channel as observed experimentally in the THz measurements. This hybridisation occurs only below TSR when the spectral weight of these excitations is enhanced and their energy matches. The energy difference between band 1 and 2, around 3 cm-1 experimentally, is in agreement with the coupling strength when all the Ho-Mn links are considered (12 of them).
VII CONCLUSION
To summarize, we have reexamined the THz dynamics present in the multiferroic compound HoMnO3. The peculiarity of this Ho compound in the hexagonal manganites is the occurrence of a spin reorientation below TSR=37 K. Remarkably, several Ho CF excitations are present in the same energy range as the Mn spin waves. Thanks to the complementary neutron and electromagnetic wave probes, we have identified five Ho 4b and Ho 2a CF excitations and shown how Mn spin waves as well as Ho CF are affected by the reorientation process at TSR. Using spin wave and CF calculations, we are able to reproduce qualitatively most of the observed features. At TSR, the Mn spin configuration switches from the high temperature configuration to . A change in the spectral weight is observed along the direction that is correctly calculated in a simple hamiltonian for the Mn win waves. At the same time, changes occur in the CF excitations that can be accounted for when coupling to the lattice and surrounding oxygen charges are introduced. Then, Ho CF excitations start to match in energy the Mn branch at different Brillouin zone centers. Further inspection of the neutron and THz data points towards additional Ho-Mn coupling mechanisms that show up below TSR in two different ways : first as an additional excitation observed in THz spectroscopy that is locked 3 cm-1 below a CF excitation and secondly the progressive disappearance of the Mn dispersion along . Our detailed study on HoMnO3 gives finally new insight on the very rich rare earth - transition metal dynamical couplings that show up in the THz range.
Acknowledgements.
This work was financially supported by the ANR-13-BS04-0013-01.Appendix A APPENDIX I
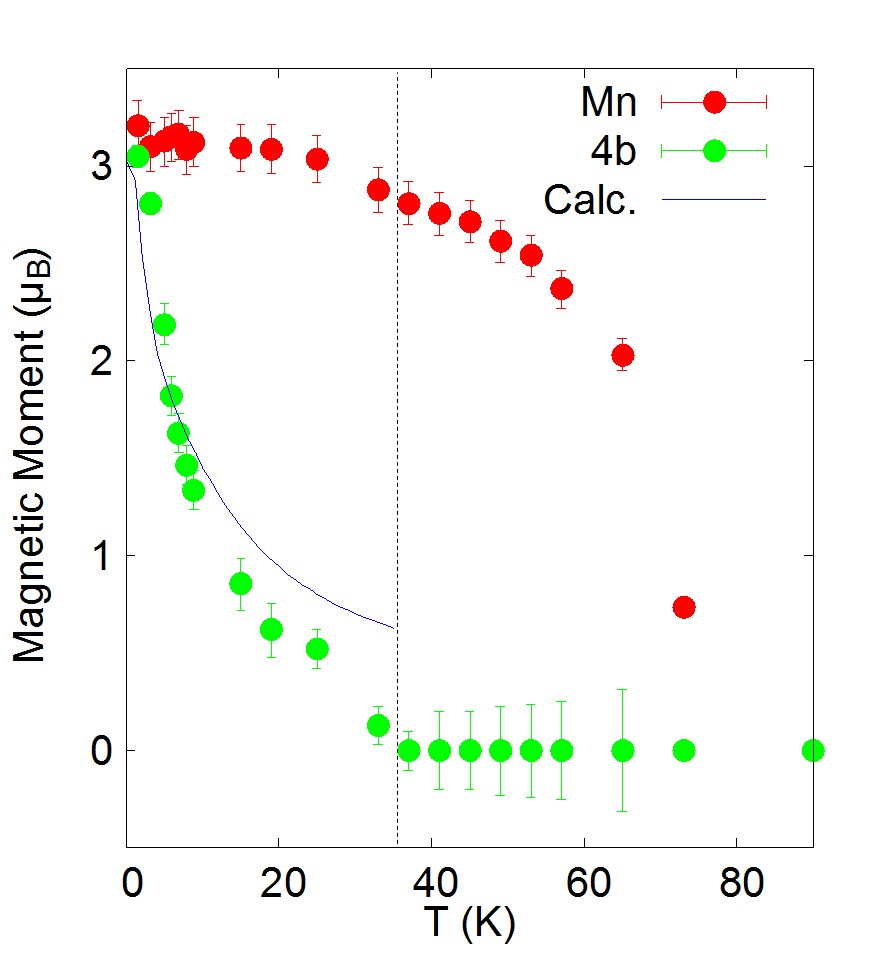
In the Ho CF calculations, we introduce a constant magnetic field to simulate the effect of the Ho-Mn coupling. We used the measured Ho 4b and Mn ordered moment extracted from neutron diffraction data Fabreges2010 : Ho 4b moments are observed along the c-axis; a molecular field of 2 T along this direction is able to polarize Ho spins with the correct magnitude and temperature dependence at least below 10 K (see Fig.13). The Mn moment varies only slightly below TSR thus validating the assumption of a constant molecular field.
Appendix B APPENDIX II
For Mn Magnons and Ho crystal field excitations to hybridize, there may be symmetry requirements that can be derived through a group representation analysis for the Mn spin waves and the Ho crystal field excitations. The Mn order with zero propagation vector is described by the isomorphic space group C. The Mn spin wave representations can be reduced into representations of the associated point group C6v (6mm). This group contains the lower symmetric C3 (3) and C3v (3m)that are best describing the Ho CF shemes. In the present analysis, to look at possible coupling mechanisms with the Mn spin waves, we will rewrite the CF representations in the more symmetric C6v. Its character table is given in table 3.
The symmetry of the different Mn spin waves have been reported in Sikora1988 with Kovalev notation. We will rather use Mulliken notation. To simplify calculations, the spin wave analysis has been performed in a more symmetric space group than C, namely D, which means neglecting some oxygen displacements and therefore some weak magnetic anisotropies. From Sikora1988 , it follows that the spin wave representation can be decomposed into A. Going back to the lower symmetric C space group, gerade und ungerade modes are no longer relevant so that the spin wave decomposition becomes A. When spin anisotropies are introduced, the degeneracy of the low energy branches is lifted as can be seen in our spin wave calculations (Fig.2), dictating the use of magnetic Shubnikov groups.
For Ho CF schemes, The character tables for the associated point groups C3 (3) and C3v (3m) are reported in table 4 and 5. Their correlations to the more symmetric C6v group that we will use are given in table 6. For Ho 4b, in its local C3 symmetry, two different kind of symmetry are present for the crystal field states: singlets are described by the irreducible representation and degenerate doublets described by E. These irreducible representations induce, in the higher symmetric C6v group, states that are decomposed into linear combinations of {A} for the singlets and {E} for the degenerate doublets. For the Ho 2a, in the local C3v symmetry, three different symmetries are present: singlets A1 and A2, and doublets E. They induce, in C6v symmetry, states that are decomposed into {A} and {A} respectively for the singlets and {E} for the doublets.
From these considerations, we can now look at possible coupling between the Mn spin waves and the Ho 4b and 2a crystal field excitations that are allowed by symmetry, that is if their representations contain at least one common irreducible representation. This is the case fot all CF excitations except for the Ho 2a A1 singlets.
| 6mm | 1 | 2 | 3 | 6 | functions | |||
|---|---|---|---|---|---|---|---|---|
| Multiplicity | - | 1 | 1 | 2 | 2 | 3 | 3 | . |
| 1 | 1 | 1 | 1 | 1 | 1 | z, , | ||
| 1 | 1 | 1 | 1 | -1 | -1 | |||
| 1 | -1 | 1 | -1 | 1 | -1 | . | ||
| 1 | -1 | 1 | -1 | -1 | 1 | . | ||
| 2 | 2 | -1 | -1 | 0 | 0 | z, , xy | ||
| 2 | -2 | -1 | 1 | 0 | 0 | x, y, xz, yz , |
| 3 | 1 | functions | |||
|---|---|---|---|---|---|
| 1 | 1 | 1 | z, , | ||
| 1 | |||||
| x, y, xz, yz, , xy, , | |||||
| 1 |
| 3m | 1 | 3 | m | functions | |
|---|---|---|---|---|---|
| Multiplicity | - | 1 | 2 | 3 | |
| 1 | 1 | 1 | z, , | ||
| 1 | 1 | -1 | |||
| E | 2 | -1 | 0 | x, y, xz, yz, , xy, , |
All the tables reproduced here where established thanks to Aroyo2006 .
| 6mm | 3 | 3m |
| A | ||
| A | ||
| A | ||
| A | ||
| E | ||
| E |
References
- (1) A. Pimenov, A. A. Mukhin, V. Yu. Ivanov, V. D. Travkin, A. M. Balbashov, A. Loidl, Nat. Phys. 2 97 (2006).
- (2) A. B. Sushkov, R. V. Aguilar, S. Park, S-W. Cheong, and H. D. Drew, Phys. Rev. Lett. 98, 027202 (2007).
- (3) N. Kida, D. Okuyama, S. Ishiwata, Y. Taguchi, R. Shimano, K. Iwasa, T. Arima, and Y. Tokura Phys. Rev. B 80, 220406(R)(2009).
- (4) S.P.P. Jones, S.M. Gaw, K.I. Doig, D. Prabhakaran, E.M. Hétroy Wheeler, A.T. Boothroyd, and J. Lloyd-Hughes, Nature Com. 5, 3787 (2014).
- (5) H. Katsura, A.V. Balatsky,and N. Nagaosa, Phys. Rev. Lett. 98, 027203 (2007).
- (6) M. Mochizuki, N. Furukawa,and N. Nagaosa, Phys. Rev. Lett. 105, 037205 (2010).
- (7) M. Mochizuki, N. Furukawa,and N. Nagaosa, Phys. Rev. Lett. 104, 177206 (2010).
- (8) L. Chaix, S. de Brion, F. Lévy-Bertrand, V. Simonet, R. Ballou, B. Canals, P. Lejay, J. B. Brubach, G. Creff, F. Willaert, P. Roy, and A. Cano, Phys. Rev. Lett. 110, 157208 (2013).
- (9) A. A. Sirenko, S. M. OMalley, K. H. Ahn, S. Park, G. L. Carr, and S.-W. Cheong, Phys. Rev. B 78, 174405 (2008).
- (10) T. D. Kang, E. Standard, K. H. Ahn, A. A. Sirenko, G. L. Carr, S. Park, Y. J. Choi, M. Ramazanoglu, V. Kiryukhin, and S.-W. Cheong, Phys. Rev. B 82, 014414 (2010).
- (11) L. Chaix, S. de Brion, S. Petit, R. Ballou, L.-P. Regnault, J. Ollivier, J.-B. Brubach, P. Roy, J. Debray, P. Lejay, A. Cano, E. Ressouche and V. Simonet, Phys. Rev. Lett. 112, 137201 (2014).
- (12) S. Pailhès, X. Fabrèges, L. P. Régnault, L. Pinsard-Godart, I. Mirebeau, F. Moussa, M. Hennion, and S. Petit, Phys. Rev. B 79, 134409 (2009).
- (13) S. Tóth, B. Wehinger, K. Rolfs, T. Birol, U. Stuhr, H. Takatsu, K.Kimura,T. Kimura, H.M. Rønnow, and C.Rüegg, Nature Com. Y,13547 (2016).
- (14) I. Aupiais, M. Mochizuki, H. Sakata, R. Grasset, Y. Gallais, A. sacuto, and M. Cazayous, npj Quantum Materials 3, 60 (2018).
- (15) E. F. Bertaut, F. Forrat, and P. Fang, Compt. Rend. Acad. Sci.(Paris) 256, 1958 (1963).
- (16) T. Katsufuji, M. Masaki, A. Machida, M. Moritomo, K. Kato, E. Nishibori, M. Takata, M. Sakata, K. Ohoyama, K. Kitazawa, and H. Takagi, Phys. Rev. B 66, 134434 (2002).
- (17) S.W. Cheong, M. Mostovoy, Nature materials, 6, 13 (2007).
- (18) H. Sim, J. Oh, J. Jeong, M. Duc Le, and J.-G. Park, Acta Crystallogr., Sect. B 72, 3 (2016).
- (19) X. Fabrèges, S. Petit, I. Mirebeau, S. Pailhès, L. Pinsard, A. Forget, M. T. Fernandez-Diaz, and F. Porcher, Phys. Rev. Lett. 103, 067204 (2009).
- (20) S. Lee, A. Pirogov, M. Kang, K.-H. Jang, M. Yonemura, T. Kamiyama, S.-W. Cheong, F. Gozzo, N. Shin, H. Kimura, Y. Noda and J.-G. Park, Nature 451, 805 (2008).
- (21) I. V. Solovyev, and S.A. Nikolaev, Phys. Rev. B 90, 184425 (2014).
- (22) X. Fabrèges, I. Mirebeau, P. Bonville, S. Petit, G. Lebras-Jasmin, A. Forget, G. André, and S. Pailhès, Phys. Rev. B 78, 214422 (2008).
- (23) S. Chattopadhyay, V. Simonet, V. Skumryev, A. A. Mukhin, V.Y. Ivanov, M. I. Aroyo, D. Z. Dimitrov, M. Gospodinov, and E. Ressouche, Phys. Rev. B 98, 134413 (2018).
- (24) T. Lottermoser, T. Lonkai, U. Amann, D. Hohlwein, J. Ihringer, and M. Fiebig, Nature 430, 541 (2004).
- (25) A. Munoz, J. A. Alonso, M. J. Martínez-Lope, M. T. Casáis, J. L. Martínez, and M. T. Fernández-Diaz, Chem. Mater. 13, 1497 (2001).
- (26) M. Fiebig, C. Degenhardt, R. V. Pisarev, J. App. Phys. 91, 8867 (2002).
- (27) P. J. Brown and T. Chatterji, J. Phys. Condens. Matter 18, 10085 (2006).
- (28) P. J. Brown and T. Chatterji, Phys. Rev. B 77, 104407 (2008).
- (29) S. Nandi, A. Kreyssig, L. Tan, J. W. Kim, J. Q. Yan, J. C. Lang, D. Haskel, R. J. McQueeney, and A. I. Goldman, Phys. Rev. Lett. 100, 217201 (2008).
- (30) N. Hur, I.K. Jeong,M .F. Hundley, S.B. Kim and S.-W. Cheong, Phys. Rev. B 79, 134120 (2009).
- (31) D. Talbayev, A.D. LaForge, S.A. Trugman, N. Hur, A.J. Taylor, R.D. Averitt and D.N. Basov, Phys. Rev. 101, 247601 (2008).
- (32) N.J. Laurita, Yi Luo, Rongwei Hu,, Meixia Wu, S.W. Cheong, O. Tchernyshyov and N.P. Armitage, Phys. Rev. Lett. 119, 227601 (2017).
- (33) T. J. Sato, S. -H. Lee, T. Katsufuji, M. Masaki, S. Park, J. R. D. Copley, and H. Takagi, Phys. Rev. B 68, 014432 (2003).
- (34) J. Park, J.-G. Park, Gun Sang Jeon, Han-Yong Choi, Changhee Lee, W. Jo, R. Bewley, K. A. McEwen, and T. G. Perring, Phys. Rev. B 68, 104426 (2003).
- (35) O. P. Vajk, M. Kenzelmann, J. W. Lynn, S. B. Kim, and S.-W. Cheong, Phys. Rev. Lett. 94, 087601 (2005).
- (36) S. Petit, F. Moussa, M. Hennion, S. Pailhès, L. Pinsard-Gaudart, and A. Ivanov, Phys. Rev. Lett. 99, 266604 (2007).
- (37) T. Kim, J. Leiner, K. Park, J. Oh, H. Sim, K. Iida, K. Kamazawa, and J.-G. Park, Phys. Rev. B 97, 201113(R) (2018).
- (38) http://www-llb.cea.fr/logicielsllb/SpinWave/SW.html
- (39) X. Fabrèges, PhD thesis, Université Paris Sud -Paris XI (2010)
- (40) P. Bowlan, S.A. Trugman, J. Bowlan, J.-X. Zhu, N.J. Hur, A.J. Taylor, D.A. Yarotski and R.P. Prasankumar, Phys. Rev. B 94, 100404(R) (2016).
- (41) K. W. H. Stevens, Proc. Roy. Soc. (London) A65, 209 (1952).
- (42) M. T. Hutchings, Solid State Physics: Advances in Research and Applications, ed. F.Seitz and B.Turnbull (New York: Academic) 16, 227 (1965).
- (43) W. Sikora, O.V. Gurin and V.N. Syromyatnikov, Journal of Magnetism and Magnetic Materials 71, 225 (1988).
- (44) S.G. Condran and M.L. PLumer, J. Phys.: Condens. Matter 22, 162201 (2010).
- (45) M. I. Aroyo, A. Kirov, C. Capillas, J. M. Perez-Mato and H. Wondratschek, Acta Cryst. A62, 115-128 (2006).