Compact multi-fringe interferometry with sub-picometer precision
Abstract
Deep frequency modulation interferometry combines optical minimalism with multi-fringe readout. Precision however is key for applications such as optical gradiometers for satellite geodesy or as dimensional sensor for ground-based gravity experiments. We present a single-component interferometer smaller than a cubic inch. Two of these are compared to each other to demonstrate tilt and displacement measurements with a precision of less than and at frequencies below .
pacs:
I Introduction
Heterodyne laser interferometry, as used very successfully in the LISA Pathfinder mission Armano et al. (2018), provides sub-picometer test mass displacement and sub-nanoradian tilt sensing sensitivities, at readout frequencies, between 1 Hz and 1 mHz, while operating over a large dynamic range (multiple fringes). Many applications and experiments would benefit from incorporating multiple sensors with this precision, such as future satellite geodesy missions with multiple test masses Drinkwater et al. (2006), accelerometers Cooper et al. (2018) and gravitational wave detectors Danzmann et al. (2017); Dahl et al. (2012); Abbott et al. (2017). Further applications can also make use of this precision to measure any other derived quantity at low readout frequencies, either as core part of larger instruments or as auxiliary sensors to monitor, for example, thermal expansion or parasitic motions, without requiring sub-fringe stability of the objects under test. Currently though, the availability and usability of such interferometric sensors is limited by their optical complexity. The need for intricate design, the construction of ultra-stable optical benches with multiple components, many of which need individual alignment and bonding, and multiple fiber connections make their application very elaborate. These factors drive the instrument size, mass, construction effort and lead time and limit the current range of deployment significantly.
Hence, alternative interferometer techniques that require simpler optical set-ups with fewer optical components Watchi et al. (2018) have the potential to reach a wider scope. Self-homodyning interferometers with phase-shift keying methods like digitally enhanced interferometry Sutton et al. (2012), deep phase modulation Schwarze et al. (2014); Heinzel et al. (2010) or deep frequency modulation interferometry (DFMI) Gerberding (2015); Isleif et al. (2016a, b) are attractive techniques that reduce the optical complexity at the expense of more sophisticated phase extraction algorithms. In recent years many proof-of-principle studies Shaddock (2007); Sutton et al. (2012); Isleif et al. (2014, 2016b); Kissinger et al. (2013, 2015); De Vine et al. (2009) have revealed greatly simplified optical readout schemes that rely on such hybrid approaches. Effectively they combine continuous-wave laser sources with specific modulations to create pulsed- or comb-like fields that enable optical simplification, phase readout and sometimes even multiplexing. However, probing and achieving the low-frequency displacement noise, required for example for future gravity experiments, has remained rare for these techniques De Vine et al. (2009).
We have focused on studying DFMI, a technique that has recently gained wide interest Akbarzadeh-Jahromi and Shahabadi (2017); Ni et al. (2017); Zhang et al. (2017); Arablu and Smith (2018). Compared with the classic heterodyne scheme or Homodyne Quadrature Interferometry Cooper et al. (2018), DFMI requires less optical components which allows for more compact layouts without giving up the multi-fringe capabilities. Previous studies have verified this functionality Isleif et al. (2016b) and here we present an experiment that demonstrates the actual displacement sensing performance of DFMI on the 1 pm/-level, making it an attractive alternative to heterodyne interferometry even for the most sensitive gravity experiments.
II Experiment
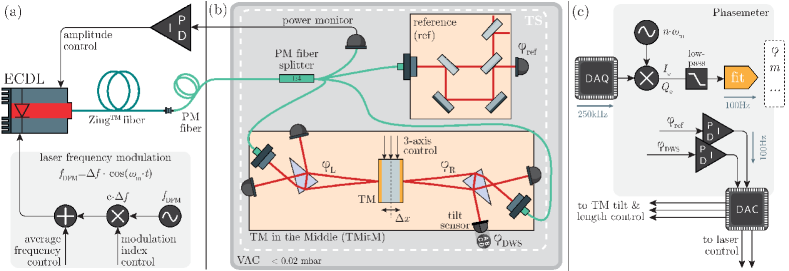
DFMI uses a single laser beam that is strongly modulated sinusoidally in its frequency. By injecting this light into an interferometer with unequal arms as shown in Fig. 1, we generate an output pattern that contains complex amplitudes at the modulation frequency and its harmonics. The essence of DFMI, as we use it, is the phase extraction algorithm: We employ a non-linear fit algorithm based on a Levenberg-Marquardt (least squares) routine. It uses a Bessel function decomposition of the complex amplitudes at the modulation frequency and its first, about ten, harmonics Heinzel et al. (2010). This allows us to extract four fundamental measurement parameters in real-time: the interferometric phase and amplitude, the modulation index and the modulation phase as shown in Fig. 1(c). The effective modulation index depends on the frequency modulation (FM) deviation, , and on the interferometer arm length mismatch, . It is given by the relation , with the speed of light . By increasing the FM deviation the size of the optical set-ups can be reduzed. Estimates of absolute distances are also possible with this readout scheme by tracking the modulation index Gerberding (2015).
II.1 Laser
As illustrated in Fig. 1(a), the laser source is a fiber-coupled external cavity diode laser (ECDL) with a center wavelength of that is modulated by with a rate of . It provides 15 mW optical power that is routed into a vacuum chamber (shown in inset (b)). A polarization maintaining fiber splitter equally distributes the light inside the chamber via four ports to a power monitor, the so-called Test Mass in the Middle (TMitM) experiment and another quasi-monolithic interferometer which is used as frequency reference. This optical reference allows us to measure the FM deviation and the laser frequency noise accumulated over 7 cm arm length mismatch and to stabilise both Gerberding et al. (2017). Amplitude fluctuations, caused by the strong frequency modulation and polarisation fluctuations in the fibers, are actively stabilised by a closed loop control of the laser diode current with unity gain frequency.
II.2 Test Mass in the Middle (TMitM)
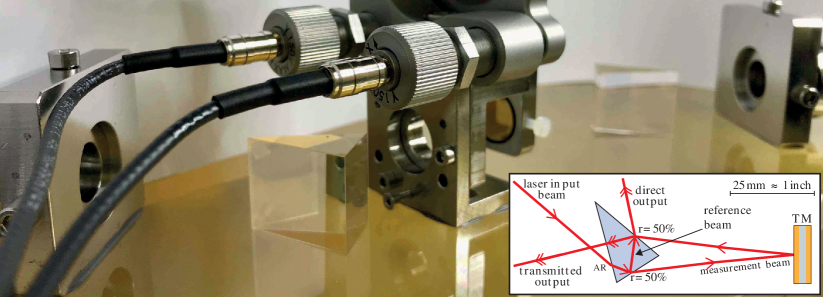
The TMitM is the key part of this experiment to test DFMI. A photograph of the interferometers is shown in Fig. 2. It consists of a 4 mm thick mirror that is gold-coated on both sides and mounted on a three-axis piezo-transducer (PZT) that is glued in the center of an optical bench (OB). The OB is made of the glass-ceramic Clearceram with a low coefficient of thermal expansion of . Two interferometers, one on each TM side, allow us to perform two redundant interferometric measurements of the same TM motion.
For this, a single-component, prism-shaped, interferometer was designed by using the optical simulation tool ifocad Wanner et al. (2012). It has a triangular base surface with two equal sides of about 25 mm length. The dimensions are chosen such that commercially available prisms made of Fused Silica can be used. Only the perpendicularity between the optical surfaces and base is critical. It must be better than 2” to ensure a sufficient vertical alignment of a monolithic interferometer. The internal prism angles are compensated during alignment by prism rotation and input beam tilts, requiring no stringent production tolerances or excessive alignment procedures. Tolerable TM rotations before loss of heterodyne efficiency are also comparable to classic interferometers with the same beam parameters. In our case this corresponds to a heterodyne efficiency of more than 30% for tip and tilt angles and TM displacement. A sketch of the component with laser propagation and coatings is shown in inset of Fig. 2. The reference beam travels a short distance inside the medium while the measurement beam leaves the medium and is reflected by the TM. The interferometer is designed for an angle of incidence of , an arm-length mismatch of 83.3 mm and it provides two redundant optical output ports which we call direct and transmitted. The transmitted port contains the interference signal with a phase shift of with respect to the direct one. The transmitted beams also leave the medium without compensating the previous refraction which leads to beam profile distortions in the transmitted port and an effective ellipticity of about 0.7 for both interfering beams.
Two prisms are glued with UV cured adhesive onto the OB of the TMitM. Two adjustable fiber collimators provide the light for the prisms. Both interferometers are aligned such that after vacuum chamber evacuation we achieve maximum contrast (more than 95%), taking into account a small alignment change due to the refractive index of air.
II.3 Readout and control
We count three interferometers inside the vacuum chamber which must be read out. Each interferometer has a slightly different modulation index due to its individual arm length mismatch. The reference interferometer’s modulation index is (stabilised). The two prims interferometers in the TMitM show an index of about in the left and in the right one.
The readout algorithm of DFMI is briefly illustrated in Fig. 1(c). The extraction of the desired fit parameters is done in real-time in the phasemeter which is implemented in a c-program running on a PC. An 8-channel data acquisition card with 250 kHz sampling rate is used to digitise the photodiode voltages, which were generated from the photo currents via transimpedance amplifiers. A digital-to-analogue converter provides actuation signals from the phasemeter via a USB interface. Five digital feedback control loops (proportional-integral controllers) are integrated in software: The tilt of the TM in horizontal and vertical direction can be controlled by actuating on the three-axis PZT mount. As error signal we use a differential wavefront sensing (DWS) measurement which is provided by quadrant photodiodes (QPDs). The limited number of readout channels allowed us to only use one QPD during displacement performance measurements, which we used to actively suppress TM tilts. The coupling factor between optical tilt and DWS signal of about was calculated by means of optical simulations for an assumed beam waist radius of 0.5 mm and a waist position of 100 mm; lenses with 25.4 mm focal length produced a spot size radius of 0.12 mm on the diodes’ active area. The experimental data verified this coupling factor. The pathlength of the TM is controlled by actuating on all three PZT axes simultaneously. The two remaining feedback loops control the average laser frequency and its applied FM deviation by tuning the modulation DC voltage and AC amplitude, respectively. The software phasemeter restricts the bandwidths of all control loops to about 10 Hz.
III Results
The TMitM measures two interferometric phases, and , on the left and on the right side of the TM. The wavenumber converts the phases into displacements, , and we can define and for both sides, and equivalent for the reference interferometer. A TM motion, , is monitored redundantly in both prism interferometers except for an opposite sign. We introduce the parameter which adds an additional noise term that is not common mode in the two interferometers. If one also includes laser frequency noise, , it couples into all interferometers scaled by their arm length difference, given by , , , as extracted by the phasemeter. The displacement noise for each interferometer can be described by:
| (1) | |||||
| (2) | |||||
| (3) |
The test mass displacement, , occurs amplified by a factor of 2 in each prism measurement due to the reflection set-up. With an angle of incidence of about 4.1∘ this results in a coupling factor of nearly 2 which is inserted in the equations above. The measurement of the reference interferometer contains an additional phase noise term, , that is driven by e.g. wrong polarizations or other noise influences unique to this interferometer Gerberding et al. (2017). Eqs. (1)-(3) can be combined to two expressions:
| (4) | |||||
| (5) |
with . Eq. (4) contains the actual TM motion and the noise term . A minor coupling of residual frequency noise, , is present but was found to be negligible here. Eq. (5) combines all three measurements to reveal the total residual phase noise (RPN), containing the two noise terms and . The RPN can be used to analyse any residual noise in the testbed or of the readout technique itself. A further signal combination is the opto-electronic noise (OEN), , that shows the difference of two redundant outputs of a recombination beam splitter, e.g. , which is a useful quantity for the evaluation of readout or stray light noise in the experiment.
The result of the TM displacement noise is plotted in Fig. 3. By applying all control schemes (laser frequency/modulation and TM stabilization) we are able to sense TM displacements with precision between 300 mHz and 10 Hz (). The TM motion, , shows artefacts at higher harmonics that are induced by acoustic and seismic noise. The peak at 25 Hz was identified to be the oscillation of the vacuum pump running during this measurement. At frequencies below 30 mHz the noise increases with a -behaviour. The reasons for this are to some extent temperature fluctuations that cause beam jitter, or other non-linear effects.
III.1 Non-linearities
Amplitude fluctuations couple into the opto-electronic noise, , and might be caused by the laser source itself or due to polarisation fluctuations. The amplitude stabilisation reduces this noise up to a bandwidth of 100 kHz. Digitisation noise limits at down to 30 mHz, as shown in Fig. 3. We assume that polarisation fluctuations caused by refractive index changes in the fiber components are the main reason for the increasing noise level below 30 mHz. A residual amplitude modulation caused by the applied strong frequency modulation, and not sufficiently suppressed by the stabilisation, cannot be excluded either.
The reference interferometer is used as sensor to stabilise the laser frequency noise and to lock the modulation index to a constant value, here . The stabilisation of the modulation index is useful to lock the operation point of the laser. While the control of the modulation index did not show any significant improvements in the phase performance, we are able to reduce laser frequency noise drifts below the unity gain frequency of 10 Hz. By subtracting the remaining laser frequency noise in data post-processing, we are able to further improve the performance between 100 mHz and 50 Hz by one order of magnitude at 1 Hz. The resulting residual phase noise is given by in Fig. 3. It is limited by OEN above 1 Hz and by some unexplained non-common mode noise source below this frequency. Despite this excess noise the measurement shows that DFMI with single-component interferometers is able to achieve 1 pm-level precision comparable to, and partly better than, previous breadboard experiments for LISA and LPF Heinzel et al. (2004); de Vine et al. (2010); Schuldt et al. (2012); Watchi et al. (2018).
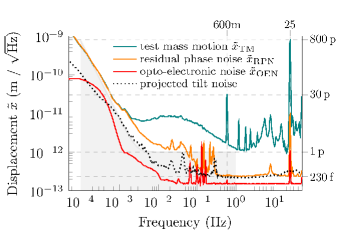
The measurement also shows a dynamic range of more than two orders of magnitude at 600 mHz and 25 Hz between and . This is compliant with gravity missions that use some form of feedback control such as LISA, LISA Pathfinder or GOCE-type instruments. Residual readout non-linearities might be caused by the strong frequency modulation itself that could limit the dynamic range capabilities, as discussed in previous studies Isleif et al. (2016b); Gerberding (2015). Possible reasons are harmonic distortions of the modulation caused by the function generator or the laser itself via the external cavity excitation. In the current range these effects do not seem to be limiting, however, they might become dominant for higher dynamics if no further compensation is applied. The influence of non-flat transfer functions of the photo-receivers was also measured and corrected and is most probably not the limiting factor at this point. Other geometrical effects, like non-parallel incidence or a wedge of the TM, can also lead to non-linear couplings. The current noise limitations are however more likely explained by undesired tilts as described in the following.
III.2 Tilt-to-length noise
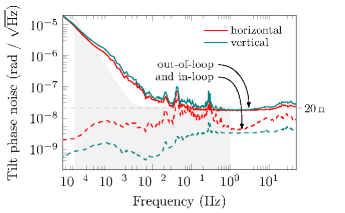
In a subsequent measurement we used a second QPD in the other prism interferometer and monitored the out-of-loop behaviour of TM tilts. Due to the limited number of readout channels we were not able to stabilise the laser frequency and modulation nor the TM pathlength during this additional measurement. Only the TM tilt noise was monitored and the according in- and out-of-loop measurements are shown in Fig. 4. We are able to stabilise the TM tilt down to noise levels on the order of above 40 mHz, as the out-of-loop measurements indicate. The projected TM displacement noise can be determined by combining the in-loop and out-of-loop tilt measurements. The DWS and tilt-to-length coupling factors for beam jitter were determined by optical simulations and are about 5000 rad/rad and 4 pm/rad, including some initial interferometric misalignment of about . The projected tilt noise is shown by the dotted black line plotted in Fig. 3. It matches the residual phase noise, , above 200 mHz and might explain some of the noise increase below 200 mHz. Not measured here are beam pointing fluctuations of the reference interferometer which likely also drive the performance of by coupling into the measurement via residual noise of the laser frequency stabilisation Gerberding et al. (2017). This could explain the missing correlation between projected tilt noise and residual phase noise measurement at low frequencies.
IV Summary
The usage of deep frequency modulation interferometry (DFMI) allows simpler interferometer set-ups in comparison to heterodyne interferometry. Especially it scales more easily to multiple TM displacement and tilt readouts on the same or adjacent ultra-stable benches. It can further maintain multi-fringe capabilities that are required, for example, for a TM readout in space. Only one frequency reference interferometer is required per laser source. The so-prepared laser light can be distributed into many optical set-ups whose number is finally constrained by the minimal optical power required not to be limited by shot noise.
Using a compact, single-component beam splitting and recombination optic specifically designed for DFMI we conducted a prototype test mass experiment in which we were able to reach displacement sensing levels of around 300 mHz and tilt noise readouts with sensitivities of about at 40 mHz. The current performance limitation at low frequencies is most probably caused by beam pointing fluctuations which can be reduced by using ultra-stable, monolithic fiber collimators in future experiments. At high frequencies we are currently limited by the digitisation noise of our data acquisition system. The required strong frequency modulation causes non-linearities which were discussed and found not to be limiting in the dynamic range regime probed here. Future work will concentrate on the development of scalable phasemeters with many channels and on optimising the readout and laser control algorithms to further test and increase the phase readout linearity. The experiment represented here is a well-suited testbed for these future investigations.
To conclude, the simplicity of the compact interferometric setup and the achieved LISA-like performance make deep frequency modulation interferometry attractive for future experiments and metrology applications.
Acknowledgements.
The authors would like to thank the DFG Sonderforschungsbereich (SFB) 1128 Relativistic Geodesy and Gravimetry with Quantum Sensors (geo-Q) and the International Max-Planck Research School (IMPRS) for financial support.References
- Armano et al. (2018) M. Armano, H. Audley, J. Baird, P. Binetruy, M. Born, D. Bortoluzzi, E. Castelli, A. Cavalleri, A. Cesarini, A. Cruise, et al., Beyond the Required LISA Free-Fall Performance: New LISA Pathfinder Results down to , Physical Review Letters 120, 061101 (2018).
- Drinkwater et al. (2006) M. R. Drinkwater, R. Haagmans, D. Muzi, A. Popescu, R. Floberghagen, M. Kern, and M. Fehringer, The GOCE gravity mission: ESA’s first core Earth explorer, in Proceedings of the 3rd international GOCE user workshop (European Space Agency Noordwijk, The Netherlands, 2006) pp. 6–8.
- Cooper et al. (2018) S. Cooper, C. Collins, A. Green, D. Hoyland, C. Speake, A. Freise, and C. Mow-Lowry, A compact, large-range interferometer for precision measurement and inertial sensing, Classical and Quantum Gravity 35, 095007 (2018).
- Danzmann et al. (2017) K. Danzmann et al., Laser interferometer space antenna, arXiv preprint arXiv:1702.00786 (2017).
- Dahl et al. (2012) K. Dahl, G. Heinzel, B. Willke, K. A. Strain, S. Goßler, and K. Danzmann, Suspension platform interferometer for the AEI 10 m prototype: concept, design and optical layout, Classical and Quantum Gravity 29, 095024 (2012).
- Abbott et al. (2017) B. P. Abbott, R. Abbott, T. Abbott, F. Acernese, K. Ackley, C. Adams, T. Adams, P. Addesso, R. Adhikari, V. Adya, et al., GW170814: a three-detector observation of gravitational waves from a binary black hole coalescence, Physical review letters 119, 141101 (2017).
- Watchi et al. (2018) J. Watchi, S. Cooper, B. Ding, C. M. Mow-Lowry, and C. Collette, Contributed Review: A review of compact interferometers, Review of Scientific Instruments 89, 121501 (2018).
- Sutton et al. (2012) A. J. Sutton, O. Gerberding, G. Heinzel, and D. A. Shaddock, Digitally enhanced homodyne interferometry, Optics express 20, 22195 (2012).
- Schwarze et al. (2014) T. S. Schwarze, O. Gerberding, F. G. Cervantes, G. Heinzel, and K. Danzmann, Advanced phasemeter for deep phase modulation interferometry, Optics express 22, 18214 (2014).
- Heinzel et al. (2010) G. Heinzel, F. Guzmán Cervantes, A. F. Garcia Marin, J. Kullmann, W. Feng, and K. Danzmann, Deep phase modulation interferometry, Optics express 18, 19076 (2010).
- Gerberding (2015) O. Gerberding, Deep frequency modulation interferometry, Optics Express 23, 14753 (2015).
- Isleif et al. (2016a) K.-S. Isleif, O. Gerberding, M. Mehmet, T. S. Schwarze, G. Heinzel, and K. Danzmann, Comparing interferometry techniques for multi-degree of freedom test mass readout, Journal of Physics: Conference Series 716, 012008 (2016a).
- Isleif et al. (2016b) K.-S. Isleif, O. Gerberding, T. S. Schwarze, M. Mehmet, G. Heinzel, and F. G. Cervantes, Experimental demonstration of deep frequency modulation interferometry, Opt. Express 24, 1676 (2016b).
- Shaddock (2007) D. A. Shaddock, Digitally enhanced heterodyne interferometry, Optics letters 32, 3355 (2007).
- Isleif et al. (2014) K.-S. Isleif, O. Gerberding, S. Köhlenbeck, A. Sutton, B. Sheard, S. Goßler, D. Shaddock, G. Heinzel, and K. Danzmann, Highspeed multiplexed heterodyne interferometry, Optics express 22, 24689 (2014).
- Kissinger et al. (2013) T. Kissinger, T. O. H. Charrett, and R. P. Tatam, Fibre segment interferometry using code-division multiplexed optical signal processing for strain sensing applications, Measurement Science and Technology 24, 094011 (2013).
- Kissinger et al. (2015) T. Kissinger, T. O. Charrett, and R. P. Tatam, Range-resolved interferometric signal processing using sinusoidal optical frequency modulation, Optics express 23, 9415 (2015).
- De Vine et al. (2009) G. De Vine, D. S. Rabeling, B. J. Slagmolen, T. T. Lam, S. Chua, D. M. Wuchenich, D. E. McClelland, and D. A. Shaddock, Picometer level displacement metrology with digitally enhanced heterodyne interferometry, Optics express 17, 828 (2009).
- Akbarzadeh-Jahromi and Shahabadi (2017) S. A. Akbarzadeh-Jahromi and M. Shahabadi, Low-Cost Highly Sensitive Refractive Index Measurement Based on Deep Frequency Modulation Interferometry, IEEE Sensors Journal 17, 5460 (2017).
- Ni et al. (2017) C. Ni, M. Zhang, Y. Zhu, C. Hu, S. Ding, and Z. Jia, Sinusoidal phase-modulating interferometer with ellipse fitting and a correction method, Appl. Opt. 56, 3895 (2017).
- Zhang et al. (2017) M. Zhang, C. Ni, Y. Zhu, L. Wang, C. Hu, and J. Hu, Large-range displacement measurement using sinusoidal phase-modulating laser diode interferometer, Chin. Opt. Lett. 15, 101201 (2017).
- Arablu and Smith (2018) M. Arablu and S. T. Smith, Polydyne displacement interferometer using frequency-modulated light, Review of Scientific Instruments 89, 055007 (2018).
- Gerberding et al. (2017) O. Gerberding, K.-S. Isleif, M. Mehmet, K. Danzmann, and G. Heinzel, Laser-frequency stabilization via a quasimonolithic Mach-Zehnder interferometer with arms of unequal length and balanced dc readout, Physical Review Applied 7, 024027 (2017).
- Wanner et al. (2012) G. Wanner, G. Heinzel, E. Kochkina, C. Mahrdt, B. S. Sheard, S. Schuster, and K. Danzmann, Methods for simulating the readout of lengths and angles in laser interferometers with Gaussian beams, Optics Communications 285, 4831 (2012).
- Heinzel et al. (2004) G. Heinzel, V. Wand, A. Garcia, O. Jennrich, C. Braxmaier, D. Robertson, K. Middleton, D. Hoyland, A. Rüdiger, R. Schilling, et al., The LTP interferometer and phasemeter, Classical and Quantum Gravity 21, S581 (2004).
- de Vine et al. (2010) G. de Vine, B. Ware, K. McKenzie, R. E. Spero, W. M. Klipstein, and D. A. Shaddock, Experimental demonstration of time-delay interferometry for the laser interferometer space antenna, Physical review letters 104, 211103 (2010).
- Schuldt et al. (2012) T. Schuldt, M. Gohlke, H. Kögel, R. Spannagel, A. Peters, U. Johann, D. Weise, and C. Braxmaier, Picometre and nanoradian heterodyne interferometry and its application in dilatometry and surface metrology, Measurement Science and Technology 23, 054008 (2012).
- Cervantes et al. (2013) F. G. Cervantes, R. Flatscher, D. Gerardi, J. Burkhardt, R. Gerndt, M. Nofrarias, J. Reiche, G. Heinzel, K. Danzmann, L. G. Boté, et al., LISA technology package flight hardware test campaign, in APS Conf Ser, Vol. 467 (2013) pp. 141–150.