11email: ducci@astro.uni-tuebingen.de 22institutetext: ISDC Data Center for Astrophysics, Université de Genève, 16 chemin d’Écogia, 1290 Versoix, Switzerland 33institutetext: INAF – Istituto di Astrofisica Spaziale e Fisica Cosmica, Via E. Bassini 15, 20133 Milano, Italy 44institutetext: Nicolaus Copernicus Astronomical Center, Polish Academy of Sciences, Bartycka 18, 00-716 Warsaw, Poland 55institutetext: INAF – Osservatorio Astronomico di Brera, via Bianchi 46, 23807 Merate (LC), Italy
Exploring the role of X-ray reprocessing and irradiation in the anomalous bright optical outbursts of A053866
Abstract
Context. In 1981, the Be/X-ray binary A053866 showed outbursts characterized by high peak luminosities in the X-ray ( erg s-1) and optical ( erg s-1) bands. The bright optical outbursts were qualitatively explained as X-ray reprocessing in a gas cloud surrounding the binary system.
Aims. Since then, further important information about the properties of A053866 have been obtained, and sophisticated photoionization codes have been developed to calculate the radiation emerging from a gas nebula illuminated by a central X-ray source. In the light of the new information and tools available, we considered it was worth studying again the enhanced optical emission displayed by A053866 to understand the mechanisms responsible for these unique events among the class of Be/X-ray binaries.
Methods. We performed about simulations of a gas envelope surrounding the binary system photoionized by an X-ray source. We assumed for the shape of the gas cloud either a sphere or a circumstellar disc observed edge-on. We studied the effects of varying the main properties of the envelope (shape, density, slope of the power law density profile, size) and the influence of different input X-ray spectra and X-ray luminosity on the optical/UV emission emerging from the photoionized cloud. We determined the properties of the cloud and the input X-ray emission by comparing the computed spectra with the IUE spectrum and photometric measurements obtained during the outburst of 29 April 1981. We also explored the role played by the X-ray heating of the surface of the donor star and the accretion disc irradiated by the X-ray emission of the neutron star.
Results. We found that reprocessing in a spherical cloud with a shallow radial density distribution and size of about cm can reproduce the optical/UV emission observed on 29 April 1981. To our knowledge, this configuration has never been observed either in A053866 during other epochs or in other Be/X-ray binaries. We found, contrary to the case of most other Be/X-ray binaries, that the optical/UV radiation produced by the X-ray heating of the surface of the donor star irradiated by the neutron star is non-negligible, due to the particular orbital parameters of this system that bring the neutron star very close to its companion.
Key Words.:
accretion – stars: neutron – X-rays: binaries – X-rays: individuals: 1A 0538661 Introduction
Be/X-ray binaries (Be/XRBs), first recognized as an independent class of X-ray sources by Maraschi et al. (1976), are the most conspicuous members of high-mass X-ray binaries (HMXBs; for a review, see e.g. Reig 2011). They consist of a Be star and, usually, a neutron star (NS). Most of them show a weak persistent X-ray emission sporadically interrupted by outbursts lasting from a few to several weeks. The X-ray outbursts are caused by the accretion onto the NS of the matter captured from the circumstellar disc around the Be star. Optical properties of Be/XRBs have been studied since their discovery (e.g. Tarenghi et al. 1981), recently by using the extensive photometric observations of the Magellanic Clouds obtained by the MACHO and OGLE projects (e.g. Rajoelimanana et al. 2011; Bird et al. 2012; Schmidtke et al. 2013). The optical emission of Be/XRBs is dominated by the radiation emitted at the surface of the Be star and by the circumstellar disc. Some Be/XRBs show long-term ( d) irregular or quasi-periodic variations, with amplitudes (Rajoelimanana et al., 2011). This variability is likely linked to the formation and depletion of the circumstellar disc. The pattern of variability changes from source to source, and also depends on the inclination angle of the circumstellar disc with respect to the line of sight (see e.g. Haubois et al. 2012). A small group of Be/XRBs also shows orbital periodicities in the optical band with lower amplitudes (). This type of variability is usually attributed to the circumstellar disc perturbed by the orbiting NS. Unfortunately, a detailed model to explain the optical variability on orbital timescales is still missing.
JD 2448623.5
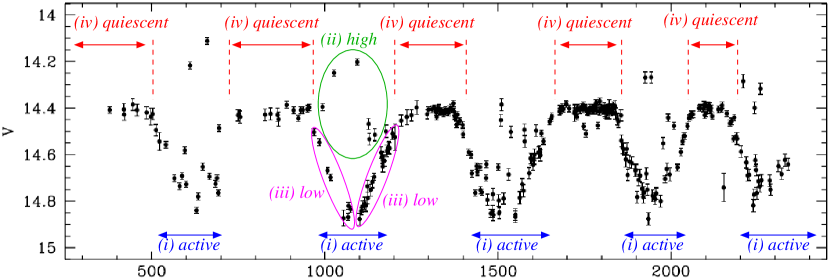
A remarkable exception to the typical low-amplitude optical variability observed in Be/XRBs is 1A 053866 (hereafter A053866), which in 1981 showed recurrent optical outbursts with an increase of the optical brightness of 2.3 magnitudes (Charles et al., 1983). A053866, located in the Large Magellanic Cloud (LMC), hosts a NS with a pulse period of 69 ms and orbital period of d (Skinner et al., 1982), which corresponds to the recurrence period of the optical outbursts. It was discovered in 1977 (White & Carpenter, 1978) during an X-ray outburst that reached a peak luminosity of erg s-1. Other super-Eddington outbursts were subsequently observed. ROSAT, BeppoSAX, ASCA, and XMM-Newton (Campana et al., 2002; Kretschmar et al., 2004) revealed outbursts with lower luminosities ( erg s-1). The outbursts of A053866 show a wide range of durations, from a few hours to days, and a high dynamical range spanning five orders of magnitude. As mentioned above, A053866 displays a unique optical behaviour when compared with other Be/X-ray transients. Skinner (1980, 1981) discovered bright and recurrent optical outbursts (up to erg s-1; Charles et al. 1983) with period of d in phase with the X-ray outbursts. A photometric light curve from 1915 to 1998, based on MACHO data and UK Schmidt and Harvard photographic B-band plates revealed, in addition to the recurrent outbursts with period d, a long-term modulation at days, with a reddening at low fluxes, in agreement with the formation of a circumstellar disc (Alcock et al., 2001; McGowan & Charles, 2003). Alcock et al. (2001) and McGowan & Charles (2003) suggested that the long-term modulation is caused by the depletion and formation of a circumstellar disc around the Be star, observed nearly edge-on. The orbital modulation is seen only at certain phases of the 421-day cycle, suggesting that is caused by variations in the Be star envelope. When the NS is embedded in the high-density wind of the circumstellar disc (see active state in Fig. 1), it accretes material which leads to X-ray and optical outbursts (see high state in Fig. 1). This scenario is consistent with the observation of Balmer emission lines during the active state, testifying the presence of a circumstellar disc. When the optical flux is high for a long period (the quiescent state, see Fig. 1), the optical/UV spectrum does not show any Balmer emission, suggesting the absence of the circumstellar disc. Therefore, during the quiescent state, only the naked B star is observed. The exceptionally bright optical outbursts of A053866 observed until about 1981, were relatively long ( days, see figure 1 in Densham et al. 1983). Subsequently, the source showed a different type of outbursts, faster ( d) and fainter (), associated with X-ray outbursts with lower luminosity ( erg s-1; Corbet et al. 1997; Alcock et al. 2001). Recently, it has been shown that A053866 still shows fast optical outbursts (Ducci et al., 2016; Rajoelimanana et al., 2017).
Densham et al. (1983), Maraschi et al. (1983), and Howarth et al. (1984), proposed a qualitative scenario to explain the bright optical outbursts observed in 1980 and 1981. The scenario requires that a dense gas cloud forms around the binary system from the material tidally displaced by the NS from the outer layers of the donor star over many orbits. The bright optical outbursts are then powered by the X-ray photons produced by the accreting NS which are reprocessed in the envelope. Maraschi et al. (1983) considered the models of high-density clouds illuminated by a central X-ray source proposed by Hatchett et al. (1976) and Kallman & McCray (1982). Scaling the model calculations presented by these authors, Maraschi et al. (1983) found that the effective temperature of the optical radiation emitted during the optical outburst ( K) could be obtained assuming an X-ray luminosity of erg s-1 and a homogeneous sphere of gas with density cm-3 and size of cm. Apparao & Tarafdar (1988) used a similar approach to show that the enhanced continuum and emission lines of the optical outbursts are produced by a disc of gas around the Be star ionized by the X-ray radiation emitted by the NS during the periastron passage, when it crosses the circumstellar disc. Apparao & Tarafdar (1988) used a model developed by Kallman & McCray (1982), which consists of an X-ray source with a 10 keV bremsstrahlung spectrum that ionizes a sphere with uniform density surrounding it. On the basis of this model, Apparao & Tarafdar (1988) considered the ionized states of H, He, and C IV to calculate the continuum emission produced by an irradiated disc with height cm, a uniform density, and a given size. They calculated the continuum emission for different values of the input X-ray luminosity, density, and disc radius, assuming that the distance of the NS from the Be star at periastron is cm. Apparao & Tarafdar (1988) found the best agreement between the computed emission and the observed ultraviolet and optical continuum of A053866 during an outburst for erg s-1, cm-3, and cm.
The calculations presented by Maraschi et al. (1983) and Apparao & Tarafdar (1988) were based on a simplified general class of models computed by Kallman & McCray (1982) and Hatchett et al. (1976) proposed for a wide variety of astrophysical objects. Although they could be rescaled, they were not tailored for the specific case of A053866. In particular, we refer to the input X-ray spectrum, the geometry of the system, and the density properties of the nebula and the abundances, which were all fixed in the Kallman & McCray (1982) model to values not suitable for the case of A053866. Therefore, we used the photoionization code CLOUDY (v17.01) to compute the emission spectrum of a cloud ionized by the X-ray radiation produced by the accreting pulsar of A053866. CLOUDY is designed to simulate the physical conditions and emission spectra of a photoionized gas. It can be used to describe a wide variety of astrophysical situations (Ferland et al., 2017). The code requires as input the spectrum and luminosity of the X-ray source, the geometry of the cloud (we assume different sizes, shapes, and density profiles) and gas composition (we assume the typical metallicity of the LMC). The ionization and temperature structure are found by CLOUDY assuming a local balance between heating and cooling and between ionization and recombination. The processes taken into account include photoionization, Auger effect, Compton heating, charge transfer, collisional de-excitation, radiative and dielectronic recombination, bremsstrahlung, collisional ionization, and collisional excitation of bound levels. The radiation field is determined by solving the radiative transfer equation for both the continuum and line components (for further details see the documentation of CLOUDY,111http://www.nublado.org/ and e.g. Ferland et al. 2017).
2 Calculations
We assumed that A053866 consists of a B1 III star with mass M⊙ and radius R⊙ and a NS with mass M⊙. The M⊙ value corresponds to the upper limit for the mass of the donor star derived by Rajoelimanana et al. (2017) from the mass function assuming M⊙ and from the absence of an X-ray eclipse. Because of the lack of information needed to determine the mass function of the X-ray pulsar, the two masses cannot be measured separately. Therefore, the values we assumed for and may slightly deviate from the real values of the system. For the orbital parameters we assumed d and eccentricity (Rajoelimanana et al., 2017).
Simulations are divided into three main groups. In each group, we considered a different input spectrum:
-
•
bremsstrahlung, with temperature keV;
-
•
black body, with temperature keV;
- •
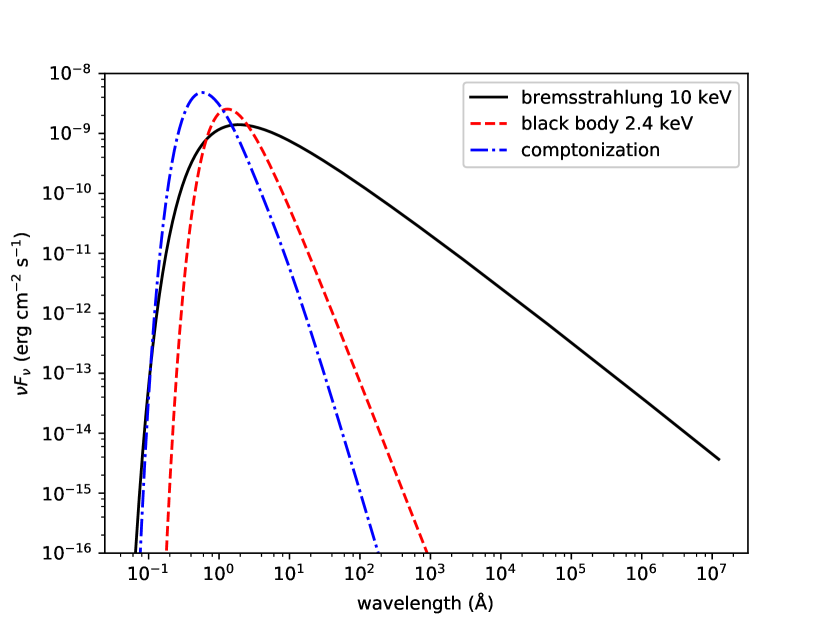
For the first group, we considered a bremsstrahlung model with temperature keV to allow us to compare our results with those obtained by Apparao & Tarafdar (1988), although the results from this model should be taken with caution because of the large fraction of soft X-ray and UV photons it produces compared to more physical models (see Fig. 2). For the second group of simulations, we considered the model found by Ponman et al. (1984) that best fits the X-ray emission from A053866 during a bright outburst observed by the Einstein satellite. For the third group, we considered a physical model with properties similar to those observed in other Be/XRBs observed during high-luminosity states. For each of these groups, we considered two geometries for the envelope: a sphere or a disc with uniform height cm (similarly to Apparao & Tarafdar 1988).
We considered for our calculations the closed geometry used in CLOUDY because we expect that the covering factor of the cloud seen by the X-ray source is large for the spherical and for the disc case. On the basis of previous findings, we assumed that the circumstellar disc is observed edge-on. We adopted for all the simulations a metallicity of Z⊙, according to the average values of LMC reported in Zhukovska & Henning (2013) and Russell & Dopita (1992). The ionization parameter inside the cloud (according to the definition of Tarter et al. 1969) in our simulations is erg cm s-1.
Optical and near-infrared studies showed that the disc density of all Be stars (isolated or in Be/XRBs) follows a power-law density distribution,
| (1) |
where is the number density of atoms at and is the density slope (Waters et al., 1989). We used Eq. 1 to describe the density distribution also in the case of clouds with spherical symmetry.
For each group and geometry (bremmstrahlung, black body, Comptonization; sphere or disc) we ran simulations varying , the size of the cloud (), and in the ranges cm-3, cm, in a grid . The assumed values of and were uniformly distributed in a space in the ranges defined above, while values were uniformly distributed in a linear space. Although the X-ray luminosity at the peak of the outbursts is reasonably well constrained from the observations (Ponman et al., 1984), A053866 was not observed in X-rays during the outburst of 29 April 1981. Therefore, similarly to Apparao & Tarafdar (1988), we also left this parameter free to vary in the range erg s-1.
As mentioned above, we compared each spectrum computed with CLOUDY with the IUE spectrum and UBV magnitudes of the outburst of 29 April 1981 reported in Charles et al. (1983). The intensities of all spectral lines provided by CLOUDY are calculated correctly, although the default code does not compute spectral line profiles222https://www.nublado.org/wiki/FaqPage. In addition, CLOUDY does not take into account the wind velocity; therefore, effects like broadening of the line width or wavelength shift caused by the outflowing motion of the gas in the wind are not reproduced in the computed spectrum. We thus decided to compare the computed and observed continuum in the region of the spectrum above Å, which has few prominent emission lines. Then we compared the luminosities of the emission lines C IV 1550 and He II 1640 computed by CLOUDY with the values reported in Apparao & Tarafdar (1988): erg s-1; erg s-1. For the comparison between the computed and observed continuum, we used the test. The value is computed at each grid point for all the parameters (, , , ). Then the global minimum over the grid is found at the grid point with the lowest value. The corresponding , , , and , are assumed to be the best solutions. We do not use interpolation between grid points in the process.
| Input spectrum | C IV 1550 | He II 1640 | ||||
|---|---|---|---|---|---|---|
| [cm] | [cm] | (13 d.o.f.) | (erg s-1) | (erg s-1) | ||
| Bremmstrahlung | 2.12 | 35.8 | 36.1 | |||
| Black body | 1.32 | 36.2 | 35.9 | |||
| Comptonization | 1.44 | 36.2 | 36.2 |
Notes. The best fit parameters were obtained assuming erg s-1 (1–20 keV) and a spherical geometry.
3 Results and discussion
3.1 Optical/UV emission from a gas cloud ionized by the X-rays from the NS
We first consider the bright outbursts of A053866 under the assumption that they are caused by reprocessing of X-rays radiation in the envelope surrounding the binary system. When we assumed a circumstellar disc for the gas cloud, we found that the luminosities of the lines C IV 1550 and He II 1640 were 100-1000 times fainter than those observed, and therefore this geometry was discarded. Instead, for a spherical shell we found more acceptable values. The difference between the luminosities of these lines in the spherical and disc cases probably arises because a sphere absorbs more energy from the source than a disc, and thus can reradiate it more in the form of lines. Therefore, we list in Table 1 only the best fit solutions obtained for a spherical gas shell. Errors in Table 1 are at the 1 confidence level and are calculated for each parameter independently according to the method described, for example, in Avni (1976). Uncertainties in Table 1 are comparable with the grid cell size, and as such should be taken with caution. Although the reduced value () for the bremsstrahlung case is greater than two, the null hypothesis probability is 0.0104. Hence, for this case, the data and model are consistent, though only at the 99% confidence level. For the black body case there are two additional solutions with (but worse than the best fit solution shown in Table 1) for two sets of parameters: , , (, 13 d.o.f.); , , (, 13 d.o.f.; errors at 1 confidence level). In both cases, erg s-1 (1–20 keV).
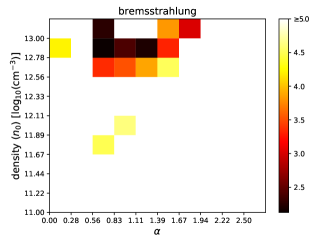
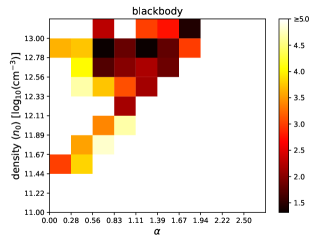
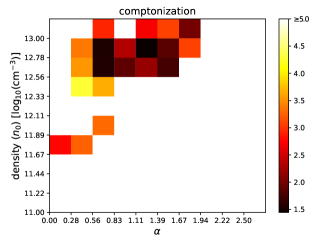
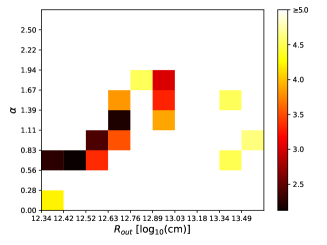
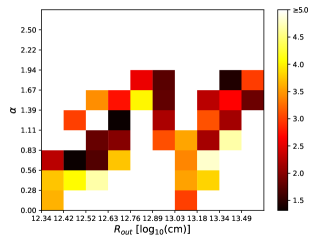
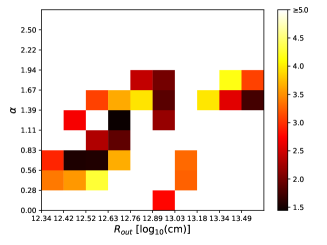
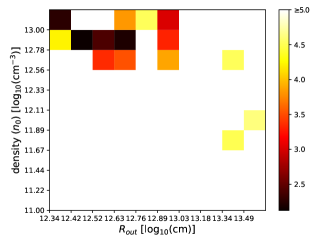
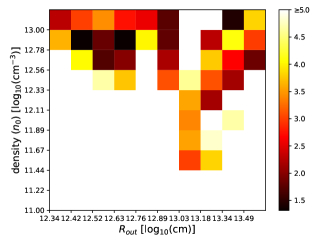
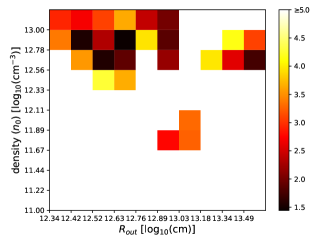
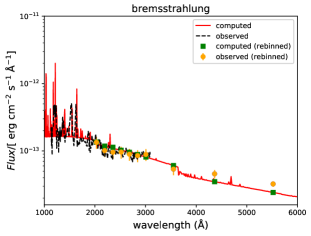
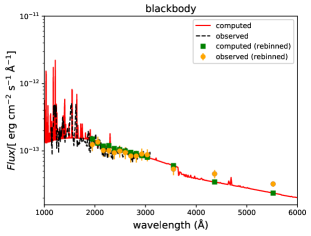
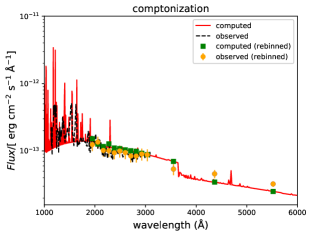
Figure 3 shows the values as a function of the fit parameters , , and for each input spectrum (column 1: bremsstrahlung; column 2: black body; column 3: Comptonization). Each panel shows the lowest values of the as a function of two of the three parameters mentioned above. In all cases, is fixed to the best fit value erg s-1. Figure 4 shows, for each type of input spectrum, the computed spectra which best fit the observed spectrum (see Table 1). These best fit spectra seem to underestimate the observed flux at Å. The mismatch for the V magnitude corresponds to about 2.5 . This discrepancy might indicate that the models we assumed for our calculations are too simple. Further considerations that can be taken into account in future works are the degree of inhomogeneity of the cloud and the presence of other radiation fields in the system, such as the intrinsic radiation emission by the donor star, possibly modified by the irradiation flux from the pulsar impinging the donor star surface (see Sect. 3.2), and the circumstellar disc itself, which emits radiation caused by viscosity (Lee et al., 1991).
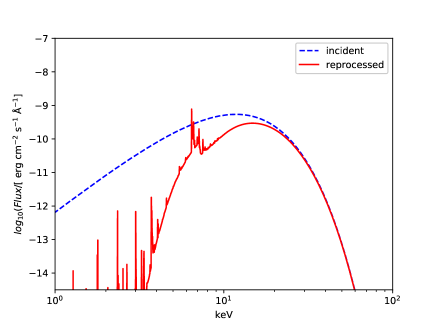
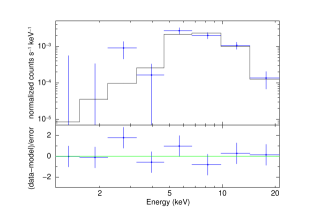
The gas cloud around the system and the X-ray reprocessing caused by it also affect the emerging (observable) spectrum in the X-ray band. As an example, we show in Fig. 5 a comparison between the keV black-body spectrum (Fig. 5, top panel, dashed blue line) used as input in the CLOUDY simulations, and the X-ray spectrum emerging from the ionized nebula (top panel, solid red line) for the best fit parameters in Table 1. To check whether the distortion of the emerging spectrum could have been detected by the previous observations performed by the Monitor Proportional Counter (MPC) on board the Einstein satellite, we simulated the emerging X-ray spectrum of A053866 computed with CLOUDY (solid red line in the top panel of the same figure) using the available Einstein/MPC detection redistribution matrices333ftp://legacy.gsfc.nasa.gov/caldb/data/einstein/mpc/cpf, with an exposure time of 4328 s (see Ponman et al. 1984). We obtained a good fit ( d.o.f.) assuming an absorbed ( cm-2) black body ( keV; errors at 1 confidence level). The result is shown in Fig. 5. The output temperature of the black body is only marginally different from the input temperature, while the column density is about a factor of five higher than that measured by Ponman et al. (1984), but we note that the latter is subject to a large uncertainty due to the limited energy range of the Einstein/MPC.
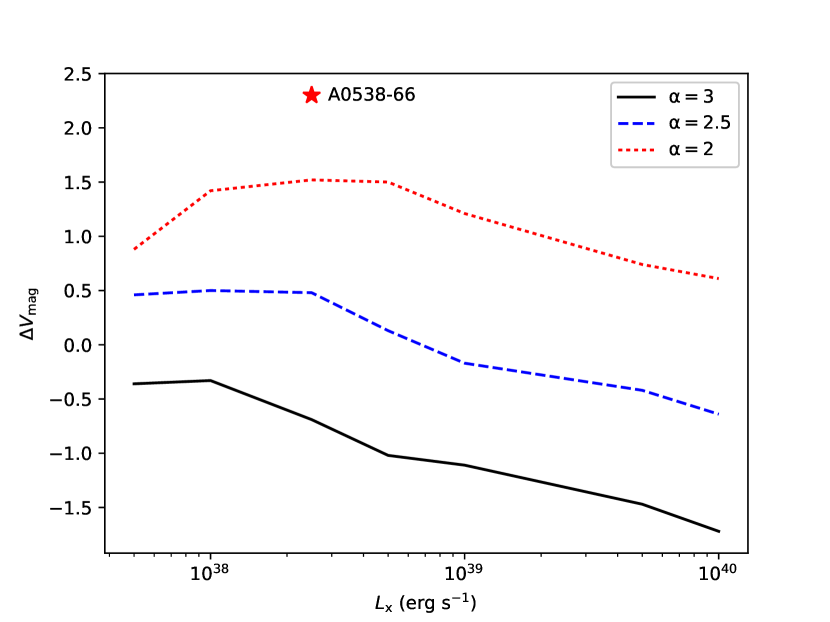
In the years following the bright optical outbursts studied in this work, A053866 showed fainter and shorter optical outbursts, while the H line profiles and the long-term photometric variability indicated the presence of a circumstellar disc. To check whether the properties of these weaker optical outbursts can be explained by a photoionized circumstellar disc illuminated by an X-ray source, we assumed the same orbital and stellar parameters described in Sect 2. For the gas cloud, we assumed the typical values reported in Rivinius et al. (2013) for the circumstellar discs in Be/XRBs, namely cm-3 ( g cm-3) and R cm. Typically, in Be stars is in the range 3–4. However, in Be/XRBs the circumstellar disc can be truncated by tidal interactions with the NS. This leads to a shallower density profile. Therefore, we assumed the conservative value of found in other Be/XRBs (Rivinius et al., 2013). For the input spectrum we used a black body with temperature keV and 120 keV luminosity ranging from erg s-1 to erg s-1. We considered the case of a disc seen edge-on in agreement with the results from Alcock et al. (2001) and McGowan & Charles (2003). The results are shown in Fig. 6 where the difference in magnitude between the active low state (, i.e. we assumed the lowest magnitude from Fig. 1) and outburst is plotted for each input X-ray luminosity. Also shown in the figure are two unusual scenarios for Be/XRBs, having density profiles with extreme slopes, and . For comparison, we plotted observed on 29 April 1981 (Charles et al., 1983). Figure 6 shows that for a density profile of , the increase in the magnitude during the outburst is negligible compared to the magnitude of the system star plus circumstellar disc observed during the active-low state. This reinforces our previous findings that the gas cloud around the system on 29 April 1981 was not a classical circumstellar disc and, albeit indirectly, supports the lack of bright optical outbursts associated with the X-ray outbursts in the other Be/XRBs. For and there is an increase of , similar to that seen in the low-luminosity optical outbursts displayed by A053866 (see Fig. 1 and Ducci et al. 2016). Although these steep density profiles are not observed in Be/XRBs, it is important to note that a value of was measured by Waters et al. (1988) in A053866 during an infrared observation on 9 October 1981 carried out during an outburst not observed in the optical bands. Nonetheless, Waters et al. (1988) were able to extrapolate an expected magnitude during the outburst of , which is in good agreement with the value at the peak of the red line () in Fig. 6.
3.2 X-ray irradiation of the surface of the donor star
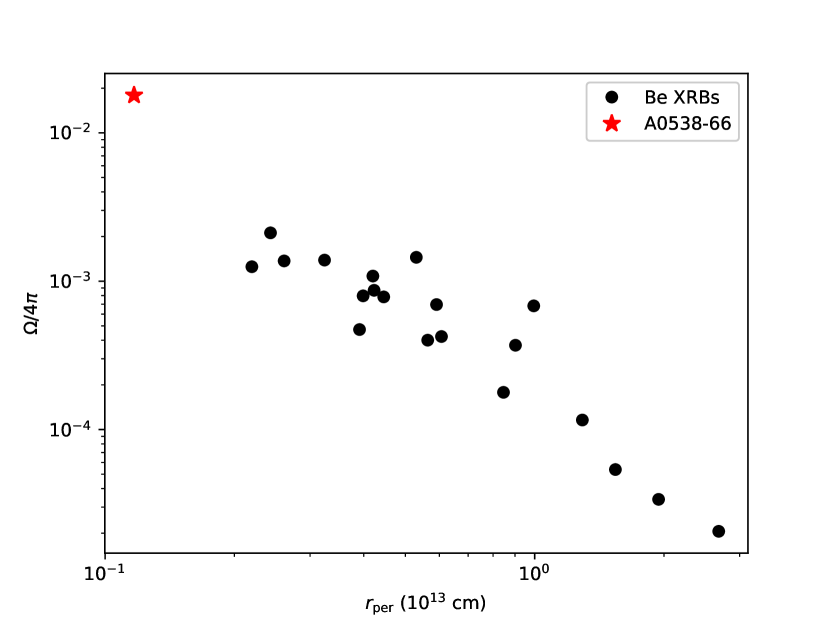
In the previous section, we considered the case of optical outbursts powered by the reprocessing of X-ray radiation in the envelope surrounding the binary system. However, as already noticed by Charles et al. (1983), other mechanisms could cause the optical outbursts. Here we consider the effects of the irradiation of the surface of the Be star by X-ray photons emitted by the accreting NS. Because of the high eccentricity and small orbital period of A053866, the separation between the two stars at periastron is such that the fraction of X-ray radiation emitted by the NS (assuming isotropic emission) intercepted by the companion star is higher than in the other Be/XRBs with known orbital parameters. This characteristic can be seen in Fig. 7, where we show—for a sample of Be/XRBs with known system parameters (orbital period, eccentricity, mass, and radius of the donor star or its spectral type)—the fraction of NS radiation intercepted by the donor star at periastron as a function of the separation of the stars at periastron. We considered for this plot the binary systems with OBe stars reported in the catalogue of Liu et al. (2006) and Table 2 of Klus et al. (2014) with known orbital period and eccentricity, spectral type, and luminosity class of the donor star. In some cases the masses and radii of the donor stars were reported in Okazaki & Negueruela (2001). In the other cases, we derived them from the spectral and luminosity class using the Catalogue of Apparent Diameters and Absolute Radii of Stars (CADARS) (Pasinetti Fracassini et al., 2001) and the catalogue of Hohle et al. (2010).
We calculated the expected optical/UV spectrum emitted by the surface of the donor star irradiated by the NS at the periastron passage using a model developed to study these effects in binary systems that hosts a bright accreting X-ray source (e.g. Beech 1985 and Tjemkes et al. 1986). In this model, the X-rays emitted by the compact object are absorbed by the atmosphere of the companion star and then reradiated at lower energy. For each surface element of the Be star, the local effective temperature increases according to
| (2) |
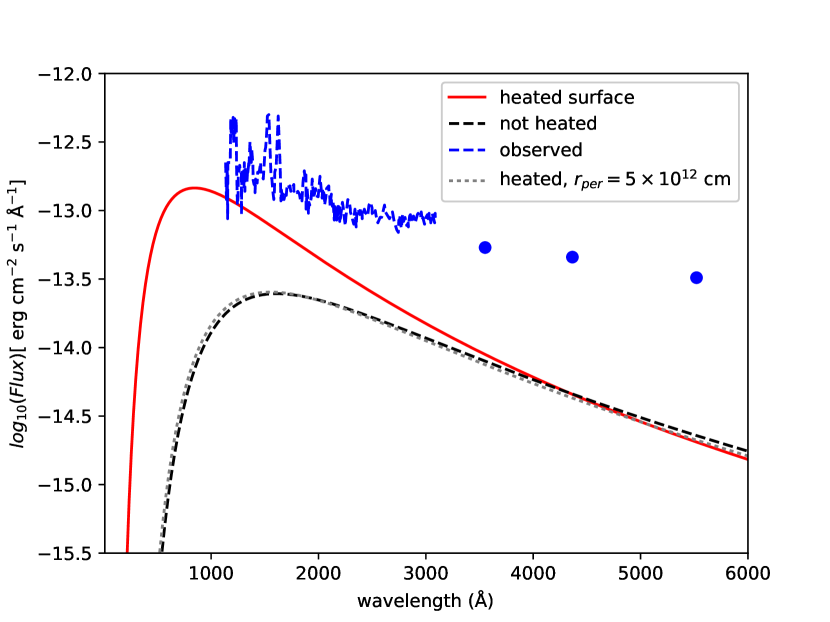
where is the effective temperature of the surface element in the absence of X-ray irradiation, is the fraction of reflected X-rays (albedo), is the luminosity of the X-ray source (assumed to be emitted isotropically from the NS), is the Stefan-Boltzmann constant, is the angle between the normal to the surface element and the direction to the X-ray source, and is the distance from the X-ray source to the surface element. In our calculations, we neglect gravity darkening effects and we assume a spherically symmetric donor star and . The same value for the albedo was assumed by Charles et al. (1983) to calculate the effects of X-ray heating on the Be star of A053866. In our calculations, the total spectrum and luminosity of the heated side of the companion is then determined by the sum of the black-body spectra emitted by each surface element. Figure 8 shows the spectrum irradiated (red line) by the heated side of the donor star during the periastron passage of the NS emitting at erg s-1 compared to the undisturbed spectrum of the donor star ( K, erg s-1, from Maraschi et al. 1983) and the IUE+UBV spectrum. We also show in the same figure that the X-ray heating would be negligible if the NS were located at a greater distance, for example, cm, which is the average periastron separation of the Be/NS binaries (dotted grey line). In conclusion, the X-ray heating of the surface of the donor star of A053866 is non-negligible, but it is not enough to explain alone the IUE+UBV spectrum observed during the bright optical outburst of 29 April 1981.
3.3 X-ray heating of the surface of an accretion disc
Charles et al. (1983) ruled out the possibility that the UV and optical emission of A053866 during the outburst was produced by a Shakura-Sunyaev disc, for which the known relation is expected. However, the spectral shape of an accretion disc irradiated by the X-ray photons from the accreting NS is significantly different from (see e.g. the review by Hynes 2010). Although it is not clear whether an accretion disc was actually present during the optical outburst studied in this work, it has recently been argued that an accretion disc might be present during the most recent periastron passages (Rajoelimanana et al., 2017). It is therefore worth examining this case. We followed the calculations proposed by Vrtilek et al. (1990) to model the spectrum of an irradiated disc. In their model, the temperature of the irradiated disc at a radius is given by
| (3) |
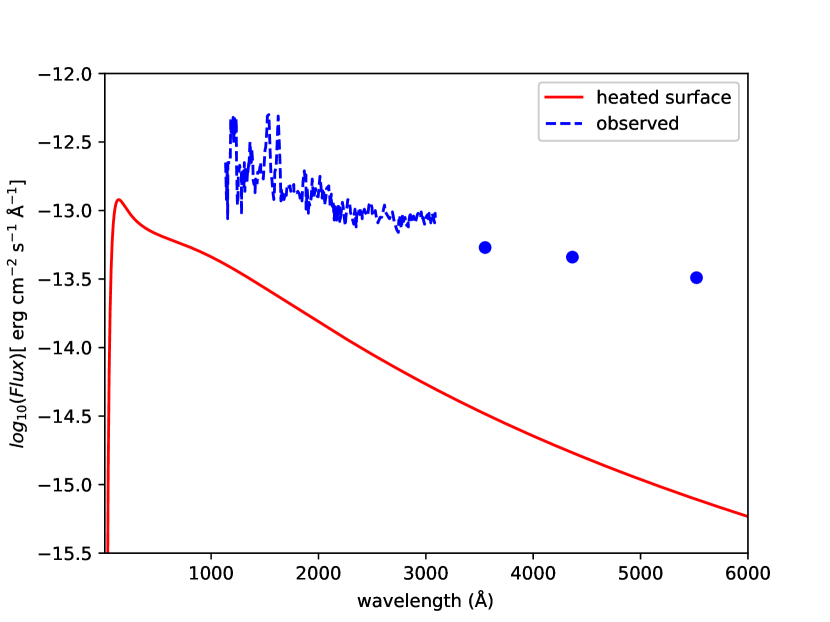
where is the fraction of the X-ray radiation absorbed by the disc surface, is the Boltzmann constant, is the mean molecular weight, is the proton mass, is the X-ray luminosity of the NS, is the gravitational constant, and is the mass of the NS. We assume that the spectrum of the ring of the accretion disc at radius is described by a black body with temperature given by Eq. 3. The spectrum of the entire accretion disc is then given by the sum of all the ring spectra. We calculated the emission from an irradiated disc assuming different values of the input X-ray luminosity, without finding an appropriate solution. As an example, Fig. 9 shows a comparison between the observed UV and optical emission of A053866 during the outburst and the calculated continuum emission of an accretion disc with size cm irradiated by a NS emitting at erg s-1.
4 Conclusions
We examined different mechanisms to explain the bright optical outbursts shown by A053866. We found, through CLOUDY simulations, that the X-ray photoionization of a spherical shell around the binary system can explain reasonably well the observed IUE spectrum and the UBV magnitudes taken during the outburst of 29 April 1981. We found the best fit between the computed and observed spectra by assuming for the input X-ray spectrum a black body with temperature of keV and a keV luminosity of erg s-1 (i.e. the spectrum observed by Ponman et al. (1984) during another outburst that reached similar X-ray luminosities). On the basis of our simulations, the properties of the gas cloud of A053866 during the bright optical outbursts seem consistent with the qualitative scenario proposed by Densham et al. (1983), Howarth et al. (1984), and Maraschi et al. (1983), where a spherical gas cloud forms around the binary system from the material tidally displaced by the NS from the outer layers of the donor star over many orbits. The bright optical outbursts are then powered by the X-ray photons produced by the accreting NS, which are reprocessed in the envelope. We found that our simulations can explain the density profile and magnitude measured by Waters et al. (1988) during the outburst of 9 October 1981. Nonetheless, there are some points in our results that need to be clarified:
-
•
the column density value obtained from the fit of the X-ray spectrum (1–20 keV) emerging from the photoionized nebula with an absorbed black body (see Sect. 3.1 and Fig. 5) is about five times larger than the highest value measured by Ponman et al. (1984). However, Ponman et al. (1984) noted that the column density of A053866 was highly variable during the outburst. In addition, we note that the (3 d.o.f.) reported in Table 1 of Ponman et al. (1984) shows that the assumed fitting model (absorbed black body) does not describe well the Einstein/MPC data, and the uncertainties on the spectral parameters were not reported;
-
•
the luminosities of the UV lines C IV 1550 and He II 1640 reported in Table 1 are, within an order of magnitude, in agreement with those observed; however, their luminosity is systematically lower than that observed;
-
•
the best fit spectra shown in Fig. 4 seem to underestimate the observed flux at Å.
These issues could indicate either that the photoionization of a cloud surrounding the system is not the correct explanation for the observed optical outbursts, or that our model is incomplete. In this regard, we have shown that another peculiarity of A053866 with respect to the other Be/XRBs is that the radiation produced by the X-ray heating of the surface of the donor star is non-negligible during the bright X-ray outbursts (Sect. 3.2). Although this mechanism cannot explain alone the observed UV/optical emission during the bright outbursts, we cannot exclude, for example, that the reprocessing in the gas cloud around the system of the radiation emitted by the heated surface of the donor may account for the missing optical emission mentioned above. Future investigations based on more complex models will help to explain the cause of the small discrepancies with the observations that we have reported here.
Acknowledgements.
We thank the anonymous referee for the useful comments that helped to improve the paper. We acknowledge support from the High Performance and Cloud Computing Group at the Zentrum für Datenverarbeitung of the University of Tübingen, the state of Baden-Württemberg through bwHPC, and the German Research Foundation (DFG) through grant No. INST 37/935-1 FUGG. SM and PR acknowledge financial contribution from the agreement ASI-INAF n.2017-14-H.0. PR acknowledges contract ASI-INAF I/004/11/0. KH is grateful to the Polish National Science Center for support under grant No. 2015/17/B/ST9/03422.References
- Alcock et al. (2001) Alcock, C., Allsman, R. A., Alves, D. R., et al. 2001, MNRAS, 321, 678
- Apparao & Tarafdar (1988) Apparao, K. M. V. & Tarafdar, S. P. 1988, ApJ, 335, 147
- Arnaud (1996) Arnaud, K. A. 1996, in Astronomical Society of the Pacific Conference Series, Vol. 101, Astronomical Data Analysis Software and Systems V, ed. G. H. Jacoby & J. Barnes, 17
- Avni (1976) Avni, Y. 1976, ApJ, 210, 642
- Beech (1985) Beech, M. 1985, Ap&SS, 117, 69
- Bird et al. (2012) Bird, A. J., Coe, M. J., McBride, V. A., & Udalski, A. 2012, MNRAS, 423, 3663
- Campana et al. (2002) Campana, S., Stella, L., Israel, G. L., et al. 2002, ApJ, 580, 389
- Charles et al. (1983) Charles, P. A., Booth, L., Densham, R. H., et al. 1983, MNRAS, 202, 657
- Corbet et al. (1997) Corbet, R. H. D., Charles, P. A., Southwell, K. A., & Smale, A. P. 1997, ApJ, 476, 833
- Densham et al. (1983) Densham, R. H., Charles, P. A., Menzies, J. W., van der Klis, M., & van Paradijs, J. 1983, MNRAS, 205, 1117
- Doroshenko et al. (2017) Doroshenko, V., Tsygankov, S. S., Mushtukov, A. A., et al. 2017, MNRAS, 466, 2143
- Ducci et al. (2016) Ducci, L., Covino, S., Doroshenko, V., et al. 2016, A&A, 595, A103
- Ferland et al. (2017) Ferland, G. J., Chatzikos, M., Guzmán, F., et al. 2017, Rev. Mexicana Astron. Astrofis., 53, 385
- Hatchett et al. (1976) Hatchett, S., Buff, J., & McCray, R. 1976, ApJ, 206, 847
- Haubois et al. (2012) Haubois, X., Carciofi, A. C., Rivinius, T., Okazaki, A. T., & Bjorkman, J. E. 2012, ApJ, 756, 156
- Hohle et al. (2010) Hohle, M. M., Neuhäuser, R., & Schutz, B. F. 2010, Astronomische Nachrichten, 331, 349
- Howarth et al. (1984) Howarth, I. D., Prinja, R. K., Roche, P. F., & Willis, A. J. 1984, MNRAS, 207, 287
- Hynes (2010) Hynes, R. I. 2010, ArXiv e-prints: 1010.5770
- Kallman & McCray (1982) Kallman, T. R. & McCray, R. 1982, ApJS, 50, 263
- Klus et al. (2014) Klus, H., Ho, W. C. G., Coe, M. J., Corbet, R. H. D., & Townsend, L. J. 2014, MNRAS, 437, 3863
- Kretschmar et al. (2004) Kretschmar, P., Wilms, J., Staubert, R., Kreykenbohm, I., & Heindl, W. A. 2004, in ESA Special Publication, Vol. 552, 5th INTEGRAL Workshop on the INTEGRAL Universe, ed. V. Schoenfelder, G. Lichti, & C. Winkler, 329
- Lee et al. (1991) Lee, U., Osaki, Y., & Saio, H. 1991, MNRAS, 250, 432
- Liu et al. (2006) Liu, Q. Z., van Paradijs, J., & van den Heuvel, E. P. J. 2006, A&A, 455, 1165
- Maraschi et al. (1983) Maraschi, L., Traversini, R., & Treves, A. 1983, MNRAS, 204, 1179
- Maraschi et al. (1976) Maraschi, L., Treves, A., & van den Heuvel, E. P. J. 1976, Nature, 259, 292
- McGowan & Charles (2003) McGowan, K. E. & Charles, P. A. 2003, MNRAS, 339, 748
- Okazaki & Negueruela (2001) Okazaki, A. T. & Negueruela, I. 2001, A&A, 377, 161
- Pasinetti Fracassini et al. (2001) Pasinetti Fracassini, L. E., Pastori, L., Covino, S., & Pozzi, A. 2001, A&A, 367, 521
- Ponman et al. (1984) Ponman, T. J., Skinner, G. K., & Bedford, D. K. 1984, MNRAS, 207, 621
- Rajoelimanana et al. (2017) Rajoelimanana, A. F., Charles, P. A., Meintjes, P. J., et al. 2017, MNRAS, 464, 4133
- Rajoelimanana et al. (2011) Rajoelimanana, A. F., Charles, P. A., & Udalski, A. 2011, MNRAS, 413, 1600
- Reig (2011) Reig, P. 2011, Ap&SS, 332, 1
- Rivinius et al. (2013) Rivinius, T., Carciofi, A. C., & Martayan, C. 2013, A&A Rev., 21, 69
- Russell & Dopita (1992) Russell, S. C. & Dopita, M. A. 1992, ApJ, 384, 508
- Schmidtke et al. (2013) Schmidtke, P. C., Cowley, A. P., & Udalski, A. 2013, MNRAS, 431, 252
- Skinner (1980) Skinner, G. K. 1980, Nature, 288, 141
- Skinner (1981) Skinner, G. K. 1981, Space Sci. Rev., 30, 441
- Skinner et al. (1982) Skinner, G. K., Bedford, D. K., Elsner, R. F., et al. 1982, Nature, 297, 568
- Tarenghi et al. (1981) Tarenghi, M., Tanzi, E. G., Treves, A., et al. 1981, A&AS, 43, 353
- Tarter et al. (1969) Tarter, C. B., Tucker, W. H., & Salpeter, E. E. 1969, ApJ, 156, 943
- Titarchuk (1994) Titarchuk, L. 1994, ApJ, 434, 570
- Tjemkes et al. (1986) Tjemkes, S. A., Zuiderwijk, E. J., & van Paradijs, J. 1986, A&A, 154, 77
- Vrtilek et al. (1990) Vrtilek, S. D., Raymond, J. C., Garcia, M. R., et al. 1990, A&A, 235, 162
- Waters et al. (1989) Waters, L. B. F. M., de Martino, D., Habets, G. M. H. J., & Taylor, A. R. 1989, A&A, 223, 207
- Waters et al. (1988) Waters, L. B. F. M., van den Heuvel, E. P. J., Taylor, A. R., Habets, G. M. H. J., & Persi, P. 1988, A&A, 198, 200
- White & Carpenter (1978) White, N. E. & Carpenter, G. F. 1978, MNRAS, 183, 11P
- Zhukovska & Henning (2013) Zhukovska, S. & Henning, T. 2013, A&A, 555, A99