Morphology and dynamics of Venus’s middle clouds with Akatsuki/IR1111Original here: https://agupubs.onlinelibrary.wiley.com/doi/full/10.1029/2018GL081670.
Abstract
The Venusian atmosphere is covered by clouds with super-rotating winds whose accelerating mechanism is still not well understood. The fastest winds, occurring at the cloud tops (70 km height), have been studied for decades thanks to their visual contrast in dayside ultraviolet images. The middle clouds (50-55 km) can be observed at near-infrared wavelengths (800-950 nm), although with very low contrast. Here we present the first extensive analysis of their morphology and motions at lower latitudes along 2016 with 900-nm images from the IR1 camera onboard Akatsuki. The middle clouds exhibit hemispherical asymmetries every 4–5 days, sharp discontinuities in elongated ”hook-like” stripes, and large contrasts (3-21%) probably associated with large changes in the optical thickness. Zonal winds obtained with IR1 images and with ground-based observations reveal mean zonal winds peaking at the equator, while their combination with Venus Express unveils long-term variations of 20 m s-1 along 10 years.
Geophysical Research Letters
Institute of Space and Astronautical Science (ISAS), Japan Aerospace Exploration Agency (JAXA), 3-1-1, Yoshinodai, Chuo-ku, Sagamihara, Kanagawa, 252-5210, Japan Tokyo 156-0044, Japan Escuela de Ingeniería de Bilbao, University of the Basque Country (UPV/EHU), Bilbao, Spain Graduate School of Frontier Sciences, The University of Tokyo, Japan Rubyvale QLD, Australia Astronomical Society of Australia, Australia Hellenic Amateur Astronomy Association, Greece Research and Information Center, Tokai University, Japan
Javier Peraltajavier.peralta@jaxa.jp
First extensive study (more than a year) of the middle clouds of Venus at low latitudes combining Akatsuki and ground-based observations.
Cloud morphologies observed at high spatial resolution and with high contrasts suggest important differences between middle and upper clouds.
Middle cloud winds peak at the equator and have long-term variations when compared with results from previous missions.
1 Introduction
Venus’s clouds are mainly composed of H2SO4 and aerosols of three main sizes or modes (1, 2 and 3) (Esposito \BOthers., \APACyear1983; McGouldrick \BOthers., \APACyear2012). The clouds form an extended vertical layer (50–70 km) that permanently covers the planet and is divided into three decks –upper, middle and lower clouds– shrouded by haze (Knollenberg \BOthers., \APACyear1980). At the upper and middle clouds of Venus, the zonal superrotation exhibits the largest speeds and vertical shear (Sánchez-Lavega \BOthers., \APACyear2017) and is also where most of the solar energy is deposited (Titov \BOthers., \APACyear2013). The upper clouds’ top at 70 km (Ignatiev \BOthers., \APACyear2009) can be observed with ultraviolet (UV) and violet wavelengths (360–480 nm), with their morphology and dynamics been extensively studied for decades (Belton \BOthers., \APACyear1976; Rossow \BOthers., \APACyear1980, \APACyear1990; Titov \BOthers., \APACyear2012; Khatuntsev \BOthers., \APACyear2013; Limaye \BOthers., \APACyear2018; Horinouchi \BOthers., \APACyear2018) thanks to the strong contrasts caused by an unknown absorber (Lee \BOthers., \APACyear2015; Pérez-Hoyos \BOthers., \APACyear2018).
Since photons with longer wavelengths can penetrate the Venusian clouds deeper before being reflected (Sánchez-Lavega \BOthers., \APACyear2008; Takagi \BBA Iwagami, \APACyear2011), the middle-lower clouds of Venus can be observed on the dayside at 570–680 and 900–1000 nm, although with weaker contrast (Belton \BOthers., \APACyear1991; Hueso \BOthers., \APACyear2015). The altitude of these contrasts is not well constrained and different estimates have been obtained with radiative transfer calculations (51–55 km from Iwagami \BOthers. \APACyear2018 based on Takagi \BBA Iwagami \APACyear2011; 58–68 km from Khatuntsev \BOthers. \APACyear2017) or comparing cloud-tracked speeds with vertical profiles of the wind from entry probes (55 km from Belton \BOthers. \APACyear1991; 62 km from Peralta \BOthers. \APACyear2007; 50–57 km from Khatuntsev \BOthers. \APACyear2017). First studies of these clouds came from polarized images at 935 nm during the Pioneer Venus mission (Limaye, \APACyear1984), although it was not until the analysis of Galileo in 1990 that their different morphology and slower wind speeds became evident through 986-nm images (Belton \BOthers., \APACyear1991; Peralta \BOthers., \APACyear2007). Wind measurements during the Venus Express (VEx) mission and the MESSENGER’s flyby confirmed these results, and also showed that middle clouds’ winds can be rather variable (Sánchez-Lavega \BOthers., \APACyear2008; Hueso \BOthers., \APACyear2012, \APACyear2015; Peralta \BOthers., \APACyear2017; Khatuntsev \BOthers., \APACyear2017). More recently, the middle clouds have been observed by amateur astronomers (Mousis \BOthers., \APACyear2014; Sánchez-Lavega \BOthers., \APACyear2016; Kardasis, \APACyear2017) and with higher detail with JAXA’s Akatsuki mission (Iwagami \BOthers., \APACyear2018; Limaye \BOthers., \APACyear2018).
Here we report on the first year (2016) of Akatsuki observations of the middle clouds of Venus on its dayside with the 900-nm images obtained with the 1- camera (h.a. IR1), complemented with images at similar wavelengths obtained with small telescopes from Greece and Australia in coordination with the Akatsuki mission (also “Venus Climate Orbiter” or VCO). A description of the images used in this work and the techniques to process them and measure wind speeds are included in section 2. The new cloud morphologies in images from IR1 and their contrasts are discussed in sections 3 and 4. Finally, the wind results and their long-term behaviour are discussed in section 5.
2 Methods
We inspected the full set of 984 dayside images from IR1 (calibration version ”v20170601”), covering from 2015 December 7 to 2016 December 9, when both IR1 and 2- (IR2) cameras ceased their observations (Satoh \BOthers., \APACyear2017; Iwagami \BOthers., \APACyear2018). The IR1 dataset***Available at: http://darts.isas.jaxa.jp/planet/project/akatsuki/ was complemented by ground-based observations with small telescopes using high-resolution amateur techniques (Mousis \BOthers., \APACyear2014; Sánchez-Lavega \BOthers., \APACyear2016), particularly useful when the observation phase angle from Akatsuki was large. Nineteen images were acquired from Rubyvale Observatory (Australia) using a 508-mm F4 Newtonian telescope, a CMOS camera and a 1.0–1.1 filter. These images†††Available at: http://www.acquerra.com.au/astro/gallery/venus/index.live covered 13 days from 2016 October 6 to November 9, when Venus had a solar elongation of 35∘, apparent angular diameter of about 13”, and 80% of illuminated fraction. Venus was also observed from Dimitra Observatory in Glyfada-Athens (Greece) during 2016 December 15 and 2017 January 2, 3 and 13. Ten images‡‡‡Available at: http://kardasis.weebly.com/eastelong-2016.html were taken using a 14-inch Celestron telescope and Hutech 884–900 nm bandpass filter, with Venus presenting solar elongation of 80∘, 21” diameter and 56% of illuminated disk.
Due to the low contrast (4%) of Venus within 900–1000 nm (h.a. near-infrared or NIR) (Belton \BOthers., \APACyear1991), IR1 images were selected attending to the spatial resolution, signal-to-noise ratio and phase angle, prioritizing the presence of cloud features easy to track. Uncertainties in the navigation of IR1 images was corrected using an automatic ellipse fitting (Ogohara \BOthers., \APACyear2017), while for the navigation and adjustment of size/position/orientation of the grid of ground-based images we used WinJupos (Hahn \BBA Jacquesson, \APACyear2012) or, alternatively NASA’s SPICE kernels (Acton, \APACyear1996) and the interactive software created by Peralta \BOthers. (\APACyear2018).
2.1 Wind measurements
The images selected to infer winds (83 images, 8% of the dataset) were processed as it follows:
-
1.
Image processing: we improved the visualization with a Minnaert photometric correction (see subsection 2.2) followed by an unsharp-mask to enhance subtle features and brightness/contrast adjustment.
-
2.
Geometrical projections: pairs of IR1 images were projected onto equirectangular (cylindrical) geometry, using an angular resolution consistent with the original images. Since Akatsuki’s equatorial orbit favors observing middle-to-lower latitudes, only pericenter images had enough spatial resolution to infer high-latitude winds from azimuthal equidistant (polar) projections. The angular resolution for polar projections was that of original images at 70∘ latitude. Regarding ground-based images, cylindrical projections with angular resolution ranging 5∘–8∘ per pixel were used (depending of Venus’s disk size and assuming a seeing of 0.6”). The spatial resolution of the projections varies from 16–54 km per pixel (IR1) to 530–850 km (ground-based).
-
3.
Wind measurements: winds were measured using cloud tracking in pairs of images. A semi-automatic method (Peralta \BOthers., \APACyear2018) was employed, using phase-correlation for the template matching between images and the final result being accepted/rejected by a human operator. When the phase-correlation was not effective, the classical visual method undertaken by an operator was used (Peralta \BOthers., \APACyear2007; Sánchez-Lavega \BOthers., \APACyear2008).
2.2 Photometric correction
We used 644 IR1 images solar-target-observer phase angle or simply solar phase angle ranging 2∘–154∘, 65% of the full dataset) to evaluate the best photometric correction for dayside images of Venus at 900 nm. Instead of the radiance factor (Lee \BOthers., \APACyear2017), we used the observed radiance (mW m-2sr) as , where is a disk function describing the photometric angle dependence, is the solar phase angle (degrees), and , with being the emergence angle and the incidence angle. To evaluate , we compared Minnaert and Lambert-Lommel-Seeliger laws as Lee \BOthers. (\APACyear2017), in this case with 84∘ and 84∘. The Minnaert law () was found to perform better, with the coefficient fitting the polynomial function:
| (1) |
3 Cloud morphologies at 900 nm
Figure 1 exhibits examples of the NIR albedo of Venus’s clouds during 2016, showing unseen morphologies with noticeable changes along time. When observed in UV, low and middle latitudes seem dominated by a dark equatorial band with mottled and patchy appearance (Belton \BOthers., \APACyear1976; Rossow \BOthers., \APACyear1980; Titov \BOthers., \APACyear2012; Sánchez-Lavega \BOthers., \APACyear2016). NIR images also display a slightly darker band though normally invaded by bright clouds, which sometimes have swirl-shape and mottled aspect (Figs. 1A–C and G) similar to those seen during MESSENGER’s flyby (Peralta \BOthers., \APACyear2017) and VEx mission (Markiewicz, Titov, Ignatiev\BCBL \BOthers., \APACyear2007), and suggestive of convection. Other times, the previous turbulent regime seems to evolve to a laminar one, with clouds becoming homogeneously bright and/or featureless, conforming multiple stripes with quasi-zonal orientation (Fig. 1D–F). When this apparent laminar regime seems dominant, symmetry is observed between the north and south polar regions (Fig. 1H). Clouds’ bands have lengths of 2,000-4,000 km and they are tilted relative to the parallels except for those at 11∘S during October 17 with width of 700 km and length 11,000 km (Fig. 1L). From April to May, the northern hemisphere up to 45∘N became periodically darkened (radiance decrease of 5%) every 4–5-days (Figs. 1E–F). Such strong hemispherical asymmetries have never been reported on the UV albedo, and their cause is yet to be determined although inhomogeneities in the distribution of an absorber at NIR wavelengths (Titov \BOthers., \APACyear2012) cannot be ruled out. The sharp albedo changes displayed in Fig. 1C have never been observed before Akatsuki (Limaye \BOthers., \APACyear2017), and they were recurrent during the first half of 2016 and absent on UV images of the upper clouds. They involve a 1%–4% decrease in the photometrically-corrected radiance and, since they moved with zonal speeds 10–20 m s-1 faster than other cloud features, we interpret them as atmospheric waves.
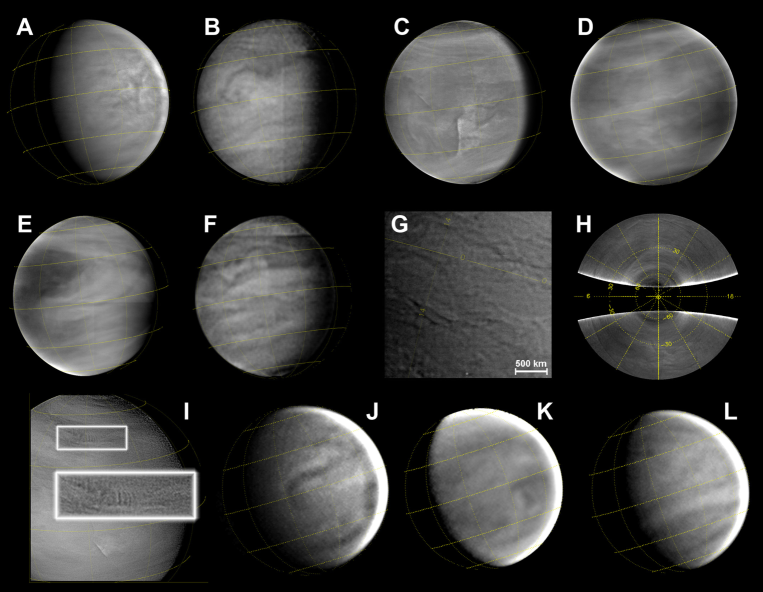
Other cloud features are infrequent, like the hook-like dark filament extending 7,300 km on the northern hemisphere in May 2 (Fig. 1B) and October 5 (Fig. 1J), suggesting the development of shear instabilities. A remarkable feature was also visible in October 10 (Fig. 1K), centered at 18∘S and with a size ranging 2,000-3,000 km. A candidate of wave packet with horizontal wavelength of 139 km was apparent during 2016 November 20 at 43∘N (see white frame and its zoom in Fig. 1I). Gravity waves were rare on NIR images during the VEx mission with one case found within 112 days of observations (Peralta \BOthers., \APACyear2008, fig. 2C therein), and Kelvin-type waves like the Y-feature (Rossow \BOthers., \APACyear1980; Kouyama \BOthers., \APACyear2012; Peralta \BOthers., \APACyear2015) are also missing. Since Kelvin-type waves require a stably stratified atmosphere, its absence in NIR imagery is consistent with the understanding that NIR images may be sensing cloud contrasts at an altitude range at which static stability is low (Piccialli, \APACyear2010, fig. 5.9 therein).
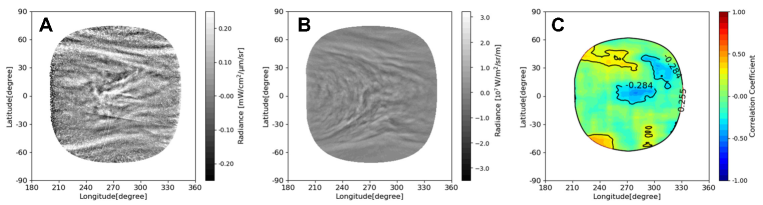
During the Galileo flyby, Belton \BOthers. (\APACyear1991) reported anti-correlated cloud patterns on the albedo at lower latitudes of violet and NIR images, while during the VEx mission cases of positive correlation were found, suggesting that the unknown absorber might also affect NIR wavelengths (Markiewicz, Titov, Limaye\BCBL \BOthers., \APACyear2007). We studied the correlation between the cloud patterns on UVI 365-nm (cloud tops) and IR1 900-nm (middle clouds) radiance using cylindrical projections of Akatsuki Level-3 data (Ogohara \BOthers., \APACyear2017). During the MESSENGER’s flyby and the Akatsuki mission (Peralta \BOthers., \APACyear2017; Limaye \BOthers., \APACyear2018), NIR and UV images seem uncorrelated in most of the cases. For instance, UV planetary-scale patterns like the Y-feature are absent in NIR images, while the sharp discontinuities in NIR (Fig. 1C) are missing in UV images. This supports the idea that contrast-forming processes may happen at different altitudes, as suggested by Belton \BOthers. (\APACyear1991). In less frequent cases, the degree of correlation can be higher, as it can be observed in 2016 May 17 (see Fig. 2). The correlation between the spiral bands at high latitudes and the lack of correlation for the fine details at low latitudes is consistent with the weaker/stronger vertical wind shear at high/low latitudes (Peralta \BOthers., \APACyear2007; Hueso \BOthers., \APACyear2015).
4 Contrasts on the 900-nm albedo and implications
Unlike the contrasts of up to 40% reported for UV (Belton \BOthers., \APACyear1991; Lee \BOthers., \APACyear2015), the NIR albedo during past missions exhibited weaker contrasts of 4% (Belton \BOthers., \APACyear1991; Hueso \BOthers., \APACyear2015; Khatuntsev \BOthers., \APACyear2017). We calculated the contrast of Venus’s NIR albedo () using 519 photometrically corrected IR1 images acquired from 2015 December 7 to 2016 December 9 and solar zenith angles (SZA) and emission angles (EA) 60∘. Unexpectedly high contrasts were found, regardless of the variable distance (850–11,700 km) between maximum and minimum radiance. After applying the photometric correction (see subsection 2.2) and considering previous limitations for SZA and EA, contrasts between two extremes on the globe range 3%–21%, presenting an average and standard deviation of 13%3. Mean contrast decreases to 10%3 when considering only latitudes within 20∘N–20∘S, and local contrasts of up to 8% can be observed in spatial scales 12∘.
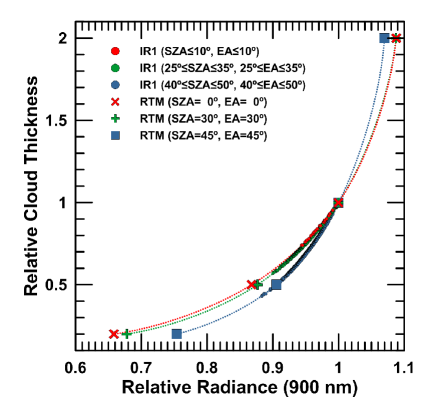
If contrasts are not caused by absorbers, the 900-nm photometrically-corrected radiance mostly depends on the cloud thickness (Takagi \BBA Iwagami, \APACyear2011), with thicker clouds being brighter and thinner clouds dimmer. This dependence is displayed for a combinations of SZA and EA in Figure 3, along with an approximate estimation of the change in cloud thickness associated to radiance contrasts from IR1 images for three combinations of ranges of [SZA,EA]. Most of the contrasts display values of relative radiance 0.9 (10%), implying changes of up to 40% in the cloud thickness that were also considered by Takagi \BBA Iwagami (\APACyear2011). Elseway, spectra from VEx/SPICAV-IR (Korablev \BOthers., \APACyear2012, fig. 15 therein) and MESSENGER/MASCS (Pérez-Hoyos \BOthers., \APACyear2018, fig. 8 therein) suggest the presence of some absorption bands that may be partially responsible for the higher contrasts observed at 900 nm. H2O (Cottini \BOthers., \APACyear2012), the controversial CH4 (Donahue \BBA Hodges, \APACyear1993) or even new candidates may be considered as potential absorbers to explain these contrasts.
5 Winds from images at 900 nm and 1
A total of 511 wind measurements were obtained with cloud tracking using NIR images from Akatsuki/IR1 and, from the first time, using ground-based observations with NIR filters. Pairs of images were selected in order to maximize both the time and spatial coverage, providing winds for 43 days (to be extended in future works) from 2015 December 7 to 2017 January 13. On average, the error of individual measurements was about 7 m s-1, ranging from 21 m s-1 down to 0.6 m s-1 in some specific cases when cloud tracers were stable enough to be unambiguously identified after 24 hours. The size of cloud tracers varies from 770 km to 4,100 km (in case of images from amateur observations), being selected depending on the spatial resolution, image signal-to-noise ratio and contrast of the observed patterns. We assume that zonal speeds do not dramatically depend on the size if the tracers, as shown for the nightside clouds (Peralta \BOthers., \APACyear2018, fig. 7A therein). The fast sharp discontinuities on the albedo (Fig. 1C) were interpreted as atmospheric waves and their speeds were discarded from this analysis.
The latitudinal profiles for the zonally-averaged winds at the middle clouds during 2016 is shown in Figs. 4A and 4B. Although consistent at higher latitudes, zonal winds from IR1 peak at the equator and differ from the profile of constant zonal wind between the equator and midlatitudes reported in the past (Belton \BOthers., \APACyear1991; Sánchez-Lavega \BOthers., \APACyear2008; Peralta \BOthers., \APACyear2017; Hueso \BOthers., \APACyear2015). A similar result was obtained for the zonal winds at the nightside lower clouds with IR2 images (Peralta \BOthers., \APACyear2018, fig. 5A therein), suspected to be originated by the sporadic jets forming at the equator (Horinouchi \BOthers., \APACyear2017). Confirming previous findings from VEx (Hueso \BOthers., \APACyear2015) no clear trend is observed on the meridional winds (Fig. 4B) and the zonal winds seem to lack of a local time dependence (Fig. 4C).
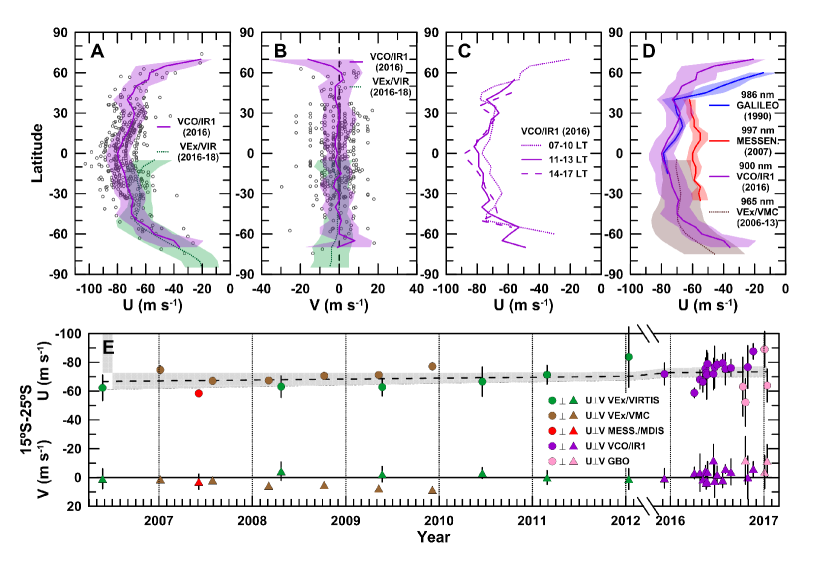
A comparison among zonal winds’ profiles in 1990 (Galileo’s flyby), 2007 (MESSENGER’s flyby), 2006–2013 (VEx/VMC and VEx/VIRTIS) and 2016–2017 (Akatsuki/IR1 and ground-based) (Fig. 4D) suggests that the latitude where winds begin their poleward decay may be variable, and that speeds at lower latitudes can vary (20 m s-1) along the years. Differences in the vertical sensing for each filter might be another cause for these effects, although similar temporal changes were observed from VEx/VIRTIS images (Sánchez-Lavega \BOthers., \APACyear2008, figs. 2a,3a therein).
Fig. 4E shows zonal and meridional winds on the middle clouds during the MESSENGER flyby (Peralta \BOthers., \APACyear2017) and the VEx and Akatsuki missions (Hueso \BOthers., \APACyear2015; Khatuntsev \BOthers., \APACyear2017). Data points from VEx/VIRTIS and Akatsuki/IR1 correspond to time averages of about 10 days or more, while those of VEx/VMC and MESSENGER/MDIS correspond to single days. To perform a coherent comparison with published data from VEx/VMC images at 965 nm, only winds between 15∘S and 25∘S were considered. Full data spans along 11 years and show that during the VEx mission zonal winds could vary in up to 15 m s-1 for timescales of 6 months and even shorter (3 months, Sánchez-Lavega \BOthers. \APACyear2008) during the Akatsuki mission. Contrarily to zonal winds at cloud tops (Hueso \BOthers., \APACyear2012; Khatuntsev \BOthers., \APACyear2013; Kouyama \BOthers., \APACyear2013; Sánchez-Lavega \BOthers., \APACyear2017), no steady increase is apparent at middle clouds along the years. Mean meridional winds from VMC 965-nm images were reported to be polewards (Khatuntsev \BOthers., \APACyear2017), although time averages on different time ranges from both VIRTIS (Hueso \BOthers., \APACyear2015) and IR1 display a variable sense of circulation with time.
6 Conclusions
The 900-nm images acquired by Akatsuki/IR1 during 2016 have revealed unexpected features of the middle clouds on the dayside of Venus, with cloud morphologies not previously observed –such as strong hemispherical asymmetries, sharp albedo discontinuities or long hook-like stripes– subject to rapid changes and unrelated to the patterns at the cloud tops. The 900-nm albedo exhibits unexpected high contrasts ranging 3%–21%, what may be caused by a variation of up to 40% in the optical thickness of the clouds when there are no absorbers. Finally, we provide measurements of the winds at the middle clouds using IR1 images and, for the first time, Earth-based observations. Mean zonal winds are found to weakly peak at the equator, while combined data from VEx and Akatsuki missions along 10 years reveals long-term variations of the zonal winds of up to 20 m s-1.
Acknowledgements.
J.P. acknowledges JAXA’s International Top Young Fellowship (ITYF). N.I. acknowledges partial support by JSPS KAKENHI Grant Number JP16H02225. A.S.-L. and R.H. were supported by the Spanish MINECO project AYA2015-65041-P with FEDER, UE support and Grupos Gobierno Vasco IT-765-13. All authors acknowledge the members of the L3 team for the correction in the navigation of the Akatsuki images. Albedo calculations were performed on a Supermicro SuperServer Intel(R) Xeon(R) CPU E5-2620 v4 funded through JAXA’s IYTF. We are also grateful to the anonymous reviewers for their useful comments to improve the manuscript.References
- Acton (\APACyear1996) \APACinsertmetastarActon1996{APACrefauthors}Acton, C\BPBIH. \APACrefYearMonthDay1996\APACmonth01. \BBOQ\APACrefatitleAncillary data services of NASA’s Navigation and Ancillary Information Facility Ancillary data services of NASA’s Navigation and Ancillary Information Facility.\BBCQ \APACjournalVolNumPagesPlanetary and Space Science4465-70. {APACrefDOI} 10.1016/0032-0633(95)00107-7 \PrintBackRefs\CurrentBib
- Belton \BOthers. (\APACyear1991) \APACinsertmetastarBelton1991{APACrefauthors}Belton, M\BPBIJ\BPBIS., Gierasch, P\BPBIJ., Smith, M\BPBID., Helfenstein, P., Schinder, P\BPBIJ., Pollack, J\BPBIB.\BDBLPilcher, C\BPBIB. \APACrefYearMonthDay1991\APACmonth09. \BBOQ\APACrefatitleImages from Galileo of the Venus cloud deck Images from Galileo of the Venus cloud deck.\BBCQ \APACjournalVolNumPagesScience2531531-1536. \PrintBackRefs\CurrentBib
- Belton \BOthers. (\APACyear1976) \APACinsertmetastarBelton1976a{APACrefauthors}Belton, M\BPBIJ\BPBIS., Smith, G\BPBIR., Schubert, G.\BCBL \BBA del Genio, A\BPBID. \APACrefYearMonthDay1976\APACmonth08. \BBOQ\APACrefatitleCloud patterns, waves and convection in the Venus atmosphere Cloud patterns, waves and convection in the Venus atmosphere.\BBCQ \APACjournalVolNumPagesJournal of Atmospheric Sciences331394-1417. \PrintBackRefs\CurrentBib
- Cottini \BOthers. (\APACyear2012) \APACinsertmetastarCottini2012{APACrefauthors}Cottini, V., Ignatiev, N\BPBII., Piccioni, G., Drossart, P., Grassi, D.\BCBL \BBA Markiewicz, W\BPBIJ. \APACrefYearMonthDay2012\APACmonth02. \BBOQ\APACrefatitleWater vapor near the cloud tops of Venus from Venus Express/VIRTIS dayside data Water vapor near the cloud tops of Venus from Venus Express/VIRTIS dayside data.\BBCQ \APACjournalVolNumPagesIcarus217561-569. {APACrefDOI} 10.1016/j.icarus.2011.06.018 \PrintBackRefs\CurrentBib
- Donahue \BBA Hodges (\APACyear1993) \APACinsertmetastarDonahue1993{APACrefauthors}Donahue, T\BPBIM.\BCBT \BBA Hodges, R\BPBIR. \APACrefYearMonthDay1993\APACmonth04. \BBOQ\APACrefatitleVenus methane and water Venus methane and water.\BBCQ \APACjournalVolNumPagesGeophysical Research Letters20591-594. {APACrefDOI} 10.1029/93GL00513 \PrintBackRefs\CurrentBib
- Esposito \BOthers. (\APACyear1983) \APACinsertmetastarEsposito1983{APACrefauthors}Esposito, L\BPBIW., Knollenberg, R\BPBIG., Marov, M\BPBII., Toon, O\BPBIB.\BCBL \BBA Turco, R\BPBIP. \APACrefYearMonthDay1983. \BBOQ\APACrefatitleThe clouds are hazes of Venus The clouds are hazes of Venus.\BBCQ \BIn D\BPBIM. Hunten, L. Colin, T\BPBIM. Donahue\BCBL \BBA V\BPBII. Moroz (\BEDS), \APACrefbtitleVenus Venus (\BPG 484-564). \PrintBackRefs\CurrentBib
- Hahn \BBA Jacquesson (\APACyear2012) \APACinsertmetastarHahn2012{APACrefauthors}Hahn, G.\BCBT \BBA Jacquesson, M. \APACrefYearMonthDay2012. \APACrefbtitleWinJUPOS-Database for object positions on planets and the Sun. WinJUPOS-Database for object positions on planets and the Sun. \APAChowpublishedhttp://jupos.privat.t-online.de. \PrintBackRefs\CurrentBib
- Horinouchi \BOthers. (\APACyear2018) \APACinsertmetastarHorinouchi2018{APACrefauthors}Horinouchi, T., Kouyama, T., Lee, Y\BPBIJ., Murakami, S\BHBIy., Ogohara, K., Takagi, M.\BDBLWatanabe, S. \APACrefYearMonthDay2018\APACmonth01. \BBOQ\APACrefatitleMean winds at the cloud top of Venus obtained from two-wavelength UV imaging by Akatsuki Mean winds at the cloud top of Venus obtained from two-wavelength UV imaging by Akatsuki.\BBCQ \APACjournalVolNumPagesEarth, Planets, and Space7010. {APACrefDOI} 10.1186/s40623-017-0775-3 \PrintBackRefs\CurrentBib
- Horinouchi \BOthers. (\APACyear2017) \APACinsertmetastarHorinouchi2017NatGeo{APACrefauthors}Horinouchi, T., Murakami, S., Satoh, T., Peralta, J., Ogohara, K., Kouyama, T.\BDBLYoung, E\BPBIF. \APACrefYearMonthDay2017\APACmonth09. \BBOQ\APACrefatitleEquatorial jet in the lower to middle cloud layer of Venus revealed by Akatsuki Equatorial jet in the lower to middle cloud layer of Venus revealed by Akatsuki.\BBCQ \APACjournalVolNumPagesNature Geoscience10646-651. {APACrefDOI} 10.1038/ngeo3016 \PrintBackRefs\CurrentBib
- Hueso \BOthers. (\APACyear2015) \APACinsertmetastarHueso2015{APACrefauthors}Hueso, R., Peralta, J., Garate-Lopez, I., Bandos, T\BPBIV.\BCBL \BBA Sánchez-Lavega, A. \APACrefYearMonthDay2015\APACmonth08. \BBOQ\APACrefatitleSix years of Venus winds at the upper cloud level from UV, visible and near infrared observations from VIRTIS on Venus Express Six years of Venus winds at the upper cloud level from UV, visible and near infrared observations from VIRTIS on Venus Express.\BBCQ \APACjournalVolNumPagesPlanetary and Space Science11378-99. {APACrefDOI} 10.1016/j.pss.2014.12.010 \PrintBackRefs\CurrentBib
- Hueso \BOthers. (\APACyear2012) \APACinsertmetastarHueso2012{APACrefauthors}Hueso, R., Peralta, J.\BCBL \BBA Sánchez-Lavega, A. \APACrefYearMonthDay2012\APACmonth02. \BBOQ\APACrefatitleAssessing the long-term variability of Venus winds at cloud level from VIRTIS-Venus Express Assessing the long-term variability of Venus winds at cloud level from VIRTIS-Venus Express.\BBCQ \APACjournalVolNumPagesIcarus217585-598. {APACrefDOI} 10.1016/j.icarus.2011.04.020 \PrintBackRefs\CurrentBib
- Ignatiev \BOthers. (\APACyear2009) \APACinsertmetastarIgnatiev2009{APACrefauthors}Ignatiev, N\BPBII., Titov, D\BPBIV., Piccioni, G., Drossart, P., Markiewicz, W\BPBIJ., Cottini, V.\BDBLManoel, N. \APACrefYearMonthDay2009\APACmonth08. \BBOQ\APACrefatitleAltimetry of the Venus cloud tops from the Venus Express observations Altimetry of the Venus cloud tops from the Venus Express observations.\BBCQ \APACjournalVolNumPagesJournal of Geophysical Research (Planets)114E00B43. {APACrefDOI} 10.1029/2008JE003320 \PrintBackRefs\CurrentBib
- Iwagami \BOthers. (\APACyear2018) \APACinsertmetastarIwagami2018{APACrefauthors}Iwagami, N., Sakanoi, T., Hashimoto, G\BPBIL., Sawai, K., Ohtsuki, S., Takagi, S.\BDBLKouyama, T. \APACrefYearMonthDay2018\APACmonth01. \BBOQ\APACrefatitleInitial products of Akatsuki 1-m camera Initial products of Akatsuki 1-m camera.\BBCQ \APACjournalVolNumPagesEarth, Planets, and Space706. {APACrefDOI} 10.1186/s40623-017-0773-5 \PrintBackRefs\CurrentBib
- Kardasis (\APACyear2017) \APACinsertmetastarKardasis2017{APACrefauthors}Kardasis, E. \APACrefYearMonthDay2017\APACmonth09. \BBOQ\APACrefatitleDigital amateur observations of Venus at 0.9m Digital amateur observations of Venus at 0.9m.\BBCQ \APACjournalVolNumPagesEuropean Planetary Science Congress11EPSC2017-405. \PrintBackRefs\CurrentBib
- Khatuntsev \BOthers. (\APACyear2017) \APACinsertmetastarKhatuntsev2017{APACrefauthors}Khatuntsev, I\BPBIV., Patsaeva, M\BPBIV., Titov, D\BPBIV., Ignatiev, N\BPBII., Turin, A\BPBIV., Fedorova, A\BPBIA.\BCBL \BBA Markiewicz, W\BPBIJ. \APACrefYearMonthDay2017\APACmonth11. \BBOQ\APACrefatitleWinds in the Middle Cloud Deck From the Near-IR Imaging by the Venus Monitoring Camera Onboard Venus Express Winds in the Middle Cloud Deck From the Near-IR Imaging by the Venus Monitoring Camera Onboard Venus Express.\BBCQ \APACjournalVolNumPagesJournal of Geophysical Research (Planets)1222312-2327. {APACrefDOI} 10.1002/2017JE005355 \PrintBackRefs\CurrentBib
- Khatuntsev \BOthers. (\APACyear2013) \APACinsertmetastarKhatuntsev2013{APACrefauthors}Khatuntsev, I\BPBIV., Patsaeva, M\BPBIV., Titov, D\BPBIV., Ignatiev, N\BPBII., Turin, A\BPBIV., Limaye, S\BPBIS.\BDBLMoissl, R. \APACrefYearMonthDay2013\APACmonth09. \BBOQ\APACrefatitleCloud level winds from the Venus Express Monitoring Camera imaging Cloud level winds from the Venus Express Monitoring Camera imaging.\BBCQ \APACjournalVolNumPagesIcarus226140-158. {APACrefDOI} 10.1016/j.icarus.2013.05.018 \PrintBackRefs\CurrentBib
- Knollenberg \BOthers. (\APACyear1980) \APACinsertmetastarKnollenberg1980clouds{APACrefauthors}Knollenberg, R., Travis, L., Tomasko, M., Smith, P., Ragent, B., Esposito, L.\BDBLBeer, R. \APACrefYearMonthDay1980\APACmonth12. \BBOQ\APACrefatitleThe clouds of Venus - A synthesis report The clouds of Venus - A synthesis report.\BBCQ \APACjournalVolNumPagesJournal of Geophysical Research858059-8081. {APACrefDOI} 10.1029/JA085iA13p08059 \PrintBackRefs\CurrentBib
- Korablev \BOthers. (\APACyear2012) \APACinsertmetastarKorablev2012{APACrefauthors}Korablev, O., Fedorova, A., Bertaux, J\BHBIL., Stepanov, A\BPBIV., Kiselev, A., Kalinnikov, Y\BPBIK.\BDBLNeefs, E. \APACrefYearMonthDay2012\APACmonth05. \BBOQ\APACrefatitleSPICAV IR acousto-optic spectrometer experiment on Venus Express SPICAV IR acousto-optic spectrometer experiment on Venus Express.\BBCQ \APACjournalVolNumPagesPlanetary and Space Science6538-57. {APACrefDOI} 10.1016/j.pss.2012.01.002 \PrintBackRefs\CurrentBib
- Kouyama \BOthers. (\APACyear2012) \APACinsertmetastarKouyama2012{APACrefauthors}Kouyama, T., Imamura, T., Nakamura, M., Satoh, T.\BCBL \BBA Futaana, Y. \APACrefYearMonthDay2012\APACmonth01. \BBOQ\APACrefatitleHorizontal structure of planetary-scale waves at the cloud top of Venus deduced from Galileo SSI images with an improved cloud-tracking technique Horizontal structure of planetary-scale waves at the cloud top of Venus deduced from Galileo SSI images with an improved cloud-tracking technique.\BBCQ \APACjournalVolNumPagesPlanetary and Space Science60207-216. {APACrefDOI} 10.1016/j.pss.2011.08.008 \PrintBackRefs\CurrentBib
- Kouyama \BOthers. (\APACyear2013) \APACinsertmetastarKouyama2013{APACrefauthors}Kouyama, T., Imamura, T., Nakamura, M., Satoh, T.\BCBL \BBA Futaana, Y. \APACrefYearMonthDay2013\APACmonth01. \BBOQ\APACrefatitleLong-term variation in the cloud-tracked zonal velocities at the cloud top of Venus deduced from Venus Express VMC images Long-term variation in the cloud-tracked zonal velocities at the cloud top of Venus deduced from Venus Express VMC images.\BBCQ \APACjournalVolNumPagesJournal of Geophysical Research (Planets)11837-46. {APACrefDOI} 10.1029/2011JE004013 \PrintBackRefs\CurrentBib
- Lee \BOthers. (\APACyear2015) \APACinsertmetastarLee2015Icar{APACrefauthors}Lee, Y\BPBIJ., Imamura, T., Schröder, S\BPBIE.\BCBL \BBA Marcq, E. \APACrefYearMonthDay2015\APACmonth06. \BBOQ\APACrefatitleLong-term variations of the UV contrast on Venus observed by the Venus Monitoring Camera on board Venus Express Long-term variations of the UV contrast on Venus observed by the Venus Monitoring Camera on board Venus Express.\BBCQ \APACjournalVolNumPagesIcarus2531-15. {APACrefDOI} 10.1016/j.icarus.2015.02.015 \PrintBackRefs\CurrentBib
- Lee \BOthers. (\APACyear2017) \APACinsertmetastarLee2017{APACrefauthors}Lee, Y\BPBIJ., Yamazaki, A., Imamura, T., Yamada, M., Watanabe, S., Sato, T\BPBIM.\BDBLMurakami, S. \APACrefYearMonthDay2017\APACmonth08. \BBOQ\APACrefatitleScattering Properties of the Venusian Clouds Observed by the UV Imager on board Akatsuki Scattering Properties of the Venusian Clouds Observed by the UV Imager on board Akatsuki.\BBCQ \APACjournalVolNumPagesThe Astronomical Journal15444. {APACrefDOI} 10.3847/1538-3881/aa78a5 \PrintBackRefs\CurrentBib
- Limaye (\APACyear1984) \APACinsertmetastarLimaye1984{APACrefauthors}Limaye, S\BPBIS. \APACrefYearMonthDay1984\APACmonth03. \BBOQ\APACrefatitleMorphology and movements of polarization features on Venus as seen in the Pioneer Orbiter Cloud Photopolarimeter data Morphology and movements of polarization features on Venus as seen in the Pioneer Orbiter Cloud Photopolarimeter data.\BBCQ \APACjournalVolNumPagesIcarus57362-385. {APACrefDOI} 10.1016/0019-1035(84)90124-6 \PrintBackRefs\CurrentBib
- Limaye \BOthers. (\APACyear2017) \APACinsertmetastarLimaye2017{APACrefauthors}Limaye, S\BPBIS., Lebonnois, S., Mahieux, A., Pätzold, M., Bougher, S., Bruinsma, S.\BDBLZasova, L. \APACrefYearMonthDay2017\APACmonth09. \BBOQ\APACrefatitleThe thermal structure of the Venus atmosphere: Intercomparison of Venus Express and ground based observations of vertical temperature and density profiles? The thermal structure of the Venus atmosphere: Intercomparison of Venus Express and ground based observations of vertical temperature and density profiles?.\BBCQ \APACjournalVolNumPagesIcarus294124-155. {APACrefDOI} 10.1016/j.icarus.2017.04.020 \PrintBackRefs\CurrentBib
- Limaye \BOthers. (\APACyear2018) \APACinsertmetastarLimaye2018{APACrefauthors}Limaye, S\BPBIS., Watanabe, S., Yamazaki, A., Yamada, M., Satoh, T., Sato, T\BPBIM.\BDBLOcampo, A\BPBIC. \APACrefYearMonthDay2018\APACmonth01. \BBOQ\APACrefatitleVenus looks different at different wavelengths: morphology from Akatsuki multispectral images Venus looks different at different wavelengths: morphology from Akatsuki multispectral images.\BBCQ \APACjournalVolNumPagesEarth, Planets, and Space7038. {APACrefURL} https://link.springer.com/article/10.1186/s40623-018-0789-5 {APACrefDOI} 10.1186/s40623-018-0789-5 \PrintBackRefs\CurrentBib
- Markiewicz, Titov, Ignatiev\BCBL \BOthers. (\APACyear2007) \APACinsertmetastarMarkiewicz2007a{APACrefauthors}Markiewicz, W\BPBIJ., Titov, D\BPBIV., Ignatiev, N., Keller, H\BPBIU., Crisp, D., Limaye, S\BPBIS.\BDBLMatz, K\BPBID. \APACrefYearMonthDay2007\APACmonth10. \BBOQ\APACrefatitleVenus Monitoring Camera for Venus Express Venus Monitoring Camera for Venus Express.\BBCQ \APACjournalVolNumPagesPlanetary and Space Science551701-1711. {APACrefDOI} 10.1016/j.pss.2007.01.004 \PrintBackRefs\CurrentBib
- Markiewicz, Titov, Limaye\BCBL \BOthers. (\APACyear2007) \APACinsertmetastarMarkiewicz2007b{APACrefauthors}Markiewicz, W\BPBIJ., Titov, D\BPBIV., Limaye, S\BPBIS., Keller, H\BPBIU., Ignatiev, N., Jaumann, R.\BDBLRusso, P. \APACrefYearMonthDay2007\APACmonth11. \BBOQ\APACrefatitleMorphology and dynamics of the upper cloud layer of Venus Morphology and dynamics of the upper cloud layer of Venus.\BBCQ \APACjournalVolNumPagesNature450633-636. {APACrefDOI} 10.1038/nature06320 \PrintBackRefs\CurrentBib
- McGouldrick \BOthers. (\APACyear2012) \APACinsertmetastarMcGouldrick2012{APACrefauthors}McGouldrick, K., Momary, T\BPBIW., Baines, K\BPBIH.\BCBL \BBA Grinspoon, D\BPBIH. \APACrefYearMonthDay2012\APACmonth02. \BBOQ\APACrefatitleQuantification of middle and lower cloud variability and mesoscale dynamics from Venus Express/VIRTIS observations at 1.74 m Quantification of middle and lower cloud variability and mesoscale dynamics from Venus Express/VIRTIS observations at 1.74 m.\BBCQ \APACjournalVolNumPagesIcarus217615-628. {APACrefDOI} 10.1016/j.icarus.2011.07.009 \PrintBackRefs\CurrentBib
- Mousis \BOthers. (\APACyear2014) \APACinsertmetastarMousis2014{APACrefauthors}Mousis, O., Hueso, R., Beaulieu, J\BHBIP., Bouley, S., Carry, B., Colas, F.\BDBLWidemann, T. \APACrefYearMonthDay2014\APACmonth11. \BBOQ\APACrefatitleInstrumental methods for professional and amateur collaborations in planetary astronomy Instrumental methods for professional and amateur collaborations in planetary astronomy.\BBCQ \APACjournalVolNumPagesExperimental Astronomy3891-191. {APACrefDOI} 10.1007/s10686-014-9379-0 \PrintBackRefs\CurrentBib
- Narita \BBA Imamura (\APACyear2018) \APACinsertmetastarNarita2018{APACrefauthors}Narita, M.\BCBT \BBA Imamura, T. \APACrefYearMonthDay2018\APACmonth05. \APACrefbtitleMulti-wavelength Analysis of Venusian Cloud by Correlation Coefficient Mapping. Multi-wavelength Analysis of Venusian Cloud by Correlation Coefficient Mapping. \APACaddressPublisherMakuhari Messe, Chiba, Japan. \PrintBackRefs\CurrentBib
- Ogohara \BOthers. (\APACyear2017) \APACinsertmetastarOgohara2017{APACrefauthors}Ogohara, K., Takagi, M., Murakami, S\BHBIy., Horinouchi, T., Yamada, M., Kouyama, T.\BDBLAbe, T. \APACrefYearMonthDay2017\APACmonth12. \BBOQ\APACrefatitleOverview of Akatsuki data products: definition of data levels, method and accuracy of geometric correction Overview of Akatsuki data products: definition of data levels, method and accuracy of geometric correction.\BBCQ \APACjournalVolNumPagesEarth, Planets, and Space69167. {APACrefDOI} 10.1186/s40623-017-0749-5 \PrintBackRefs\CurrentBib
- Peralta \BOthers. (\APACyear2007) \APACinsertmetastarPeralta2007b{APACrefauthors}Peralta, J., Hueso, R.\BCBL \BBA Sánchez-Lavega, A. \APACrefYearMonthDay2007\APACmonth10. \BBOQ\APACrefatitleA reanalysis of Venus winds at two cloud levels from Galileo SSI images A reanalysis of Venus winds at two cloud levels from Galileo SSI images.\BBCQ \APACjournalVolNumPagesIcarus190469-477. {APACrefDOI} 10.1016/j.icarus.2007.03.028 \PrintBackRefs\CurrentBib
- Peralta \BOthers. (\APACyear2008) \APACinsertmetastarPeralta2008{APACrefauthors}Peralta, J., Hueso, R., Sánchez-Lavega, A., Piccioni, G., Lanciano, O.\BCBL \BBA Drossart, P. \APACrefYearMonthDay2008\APACmonth12. \BBOQ\APACrefatitleCharacterization of mesoscale gravity waves in the upper and lower clouds of Venus from VEX-VIRTIS images Characterization of mesoscale gravity waves in the upper and lower clouds of Venus from VEX-VIRTIS images.\BBCQ \APACjournalVolNumPagesJournal of Geophysical Research113E00B18-+. {APACrefDOI} 10.1029/2008JE003185 \PrintBackRefs\CurrentBib
- Peralta \BOthers. (\APACyear2017) \APACinsertmetastarPeralta2017GRL{APACrefauthors}Peralta, J., Lee, Y\BPBIJ., Hueso, R., Clancy, R\BPBIT., Sandor, B\BPBIJ., Sáchez-Lavega, A.\BDBLPeach, D. \APACrefYearMonthDay2017. \BBOQ\APACrefatitleVenus’s winds and temperatures during the MESSENGER’s flyby: An approximation to a three-dimensional instantaneous state of the atmosphere Venus’s winds and temperatures during the messenger’s flyby: An approximation to a three-dimensional instantaneous state of the atmosphere.\BBCQ \APACjournalVolNumPagesGeophysical Research Letters4483907–3915. {APACrefURL} http://dx.doi.org/10.1002/2017GL072900 \APACrefnote2017GL072900 {APACrefDOI} 10.1002/2017GL072900 \PrintBackRefs\CurrentBib
- Peralta \BOthers. (\APACyear2018) \APACinsertmetastarPeralta2018ApJS{APACrefauthors}Peralta, J., Muto, K., Hueso, R., Horinouchi, T., Sánchez-Lavega, A., Murakami, S\BHBIy.\BDBLLuz, D. \APACrefYearMonthDay2018dec. \BBOQ\APACrefatitleNightside Winds at the Lower Clouds of Venus with Akatsuki/IR2: Longitudinal, local time and decadal variations from comparison with previous measurements Nightside Winds at the Lower Clouds of Venus with Akatsuki/IR2: Longitudinal, local time and decadal variations from comparison with previous measurements.\BBCQ \APACjournalVolNumPagesThe Astrophysical Journal Supplement Series2392917. {APACrefURL} http://iopscience.iop.org/article/10.3847/1538-4365/aae844/meta {APACrefDOI} 10.3847/1538-4365/aae844 \PrintBackRefs\CurrentBib
- Peralta \BOthers. (\APACyear2015) \APACinsertmetastarPeralta2015{APACrefauthors}Peralta, J., Sánchez-Lavega, A., López-Valverde, M\BPBIA., Luz, D.\BCBL \BBA Machado, P. \APACrefYearMonthDay2015. \BBOQ\APACrefatitleVenus’s major cloud feature as an equatorially trapped wave distorted by the wind Venus’s major cloud feature as an equatorially trapped wave distorted by the wind.\BBCQ \APACjournalVolNumPagesGeophysical Research Letters423705–711. {APACrefURL} http://dx.doi.org/10.1002/2014GL062280 \APACrefnote2014GL062280 {APACrefDOI} 10.1002/2014GL062280 \PrintBackRefs\CurrentBib
- Pérez-Hoyos \BOthers. (\APACyear2018) \APACinsertmetastarPerez-Hoyos2018{APACrefauthors}Pérez-Hoyos, S., Sánchez-Lavega, A., García-Muñoz, A., Irwin, P\BPBIG\BPBIJ., Peralta, J., Holsclaw, G.\BDBLSanz-Requena, J\BPBIF. \APACrefYearMonthDay2018\APACmonth01. \BBOQ\APACrefatitleVenus Upper Clouds and the UV Absorber From MESSENGER/MASCS Observations Venus Upper Clouds and the UV Absorber From MESSENGER/MASCS Observations.\BBCQ \APACjournalVolNumPagesJournal of Geophysical Research (Planets)123145-162. {APACrefDOI} 10.1002/2017JE005406 \PrintBackRefs\CurrentBib
- Piccialli (\APACyear2010) \APACinsertmetastarPiccialli2010{APACrefauthors}Piccialli, A. \APACrefYear2010. \APACrefbtitleCyclotrophic wind in the mesosphere of Venus from Venus Express observations Cyclotrophic wind in the mesosphere of Venus from Venus Express observations \APACtypeAddressSchool\BUPhD. \APACaddressSchoolESA, ESTEC, Keplerlaan 1, 2201 AZ Noordwijk, The Netherlands. \PrintBackRefs\CurrentBib
- Rossow \BOthers. (\APACyear1990) \APACinsertmetastarRossow1990{APACrefauthors}Rossow, W\BPBIB., del Genio, A\BPBID.\BCBL \BBA Eichler, T. \APACrefYearMonthDay1990\APACmonth09. \BBOQ\APACrefatitleCloud-tracked winds from Pioneer Venus OCPP images Cloud-tracked winds from Pioneer Venus OCPP images.\BBCQ \APACjournalVolNumPagesJournal of Atmospheric Sciences472053-2084. \PrintBackRefs\CurrentBib
- Rossow \BOthers. (\APACyear1980) \APACinsertmetastarRossow1980{APACrefauthors}Rossow, W\BPBIB., del Genio, A\BPBID., Limaye, S\BPBIS.\BCBL \BBA Travis, L\BPBID. \APACrefYearMonthDay1980\APACmonth12. \BBOQ\APACrefatitleCloud morphology and motions from Pioneer Venus images Cloud morphology and motions from Pioneer Venus images.\BBCQ \APACjournalVolNumPagesJournal of Geophysical Research858107-8128. \PrintBackRefs\CurrentBib
- Sánchez-Lavega \BOthers. (\APACyear2008) \APACinsertmetastarSanchez-Lavega2008{APACrefauthors}Sánchez-Lavega, A., Hueso, R., Piccioni, G., Drossart, P., Peralta, J., Pérez-Hoyos, S.\BDBLLebonnois, S. \APACrefYearMonthDay2008\APACmonth07. \BBOQ\APACrefatitleVariable winds on Venus mapped in three dimensions Variable winds on Venus mapped in three dimensions.\BBCQ \APACjournalVolNumPagesGeophysical Research Letters3513204-+. {APACrefDOI} 10.1029/2008GL033817 \PrintBackRefs\CurrentBib
- Sánchez-Lavega \BOthers. (\APACyear2017) \APACinsertmetastarSanchez-Lavega2017{APACrefauthors}Sánchez-Lavega, A., Lebonnois, S., Imamura, T., Read, P.\BCBL \BBA Luz, D. \APACrefYearMonthDay2017\APACmonth11. \BBOQ\APACrefatitleThe Atmospheric Dynamics of Venus The Atmospheric Dynamics of Venus.\BBCQ \APACjournalVolNumPagesSpace Science Reviews2121541-1616. {APACrefDOI} 10.1007/s11214-017-0389-x \PrintBackRefs\CurrentBib
- Sánchez-Lavega \BOthers. (\APACyear2016) \APACinsertmetastarSanchez-Lavega2016{APACrefauthors}Sánchez-Lavega, A., Peralta, J., Gomez-Forrellad, J\BPBIM., Hueso, R., Pérez-Hoyos, S., Mendikoa, I.\BDBLWatanabe, S. \APACrefYearMonthDay2016\APACmonth12. \BBOQ\APACrefatitleVenus Cloud Morphology and Motions from Ground-based Images at the Time of the Akatsuki Orbit Insertion Venus Cloud Morphology and Motions from Ground-based Images at the Time of the Akatsuki Orbit Insertion.\BBCQ \APACjournalVolNumPagesThe Astrophysical Journal Letters833L7. {APACrefDOI} 10.3847/2041-8205/833/1/L7 \PrintBackRefs\CurrentBib
- Satoh \BOthers. (\APACyear2017) \APACinsertmetastarSatoh2017{APACrefauthors}Satoh, T., Sato, T\BPBIM., Nakamura, M., Kasaba, Y., Ueno, M., Suzuki, M.\BDBLOhtsuki, S. \APACrefYearMonthDay2017\APACmonth11. \BBOQ\APACrefatitlePerformance of Akatsuki/IR2 in Venus orbit: the first year Performance of Akatsuki/IR2 in Venus orbit: the first year.\BBCQ \APACjournalVolNumPagesEarth, Planets, and Space69154. {APACrefDOI} 10.1186/s40623-017-0736-x \PrintBackRefs\CurrentBib
- Takagi \BBA Iwagami (\APACyear2011) \APACinsertmetastarTakagi2011{APACrefauthors}Takagi, S.\BCBT \BBA Iwagami, N. \APACrefYearMonthDay2011\APACmonth05. \BBOQ\APACrefatitleContrast sources for the infrared images taken by the Venus mission AKATSUKI Contrast sources for the infrared images taken by the Venus mission AKATSUKI.\BBCQ \APACjournalVolNumPagesEarth, Planets, and Space63435-442. {APACrefDOI} 10.5047/eps.2011.01.007 \PrintBackRefs\CurrentBib
- Titov \BOthers. (\APACyear2012) \APACinsertmetastarTitov2012{APACrefauthors}Titov, D\BPBIV., Markiewicz, W\BPBIJ., Ignatiev, N\BPBII., Song, L., Limaye, S\BPBIS., Sanchez-Lavega, A.\BDBLMoissl, R. \APACrefYearMonthDay2012\APACmonth02. \BBOQ\APACrefatitleMorphology of the cloud tops as observed by the Venus Express Monitoring Camera Morphology of the cloud tops as observed by the Venus Express Monitoring Camera.\BBCQ \APACjournalVolNumPagesIcarus217682-701. {APACrefDOI} 10.1016/j.icarus.2011.06.020 \PrintBackRefs\CurrentBib
- Titov \BOthers. (\APACyear2013) \APACinsertmetastarTitov2013{APACrefauthors}Titov, D\BPBIV., Piccioni, G., Drossart, P.\BCBL \BBA Markiewicz, W\BPBIJ. \APACrefYearMonthDay2013. \BBOQ\APACrefatitleRadiative Energy Balance in the Venus Atmosphere Radiative Energy Balance in the Venus Atmosphere.\BBCQ \BIn L. Bengtsson, R\BHBIM. Bonnet, D. Grinspoon, S. Koumoutsaris, S. Lebonnois\BCBL \BBA D. Titov (\BEDS), \APACrefbtitleTowards Understanding the Climate of Venus Towards understanding the climate of venus (\BPG 23). {APACrefDOI} 10.1007/978-1-4614-5064-1_4 \PrintBackRefs\CurrentBib