Influence of petroleum and gas trade on EU economies from the reduced Google matrix analysis of UN COMTRADE data
Abstract
Using the United Nations COMTRADE database comtrade we apply the reduced Google matrix (REGOMAX) algorithm to analyze the multiproduct world trade in years 2004-2016. Our approach allows to determine the trade balance sensitivity of a group of countries to a specific product price increase from a specific exporting country taking into account all direct and indirect trade pathways via all world countries exchanging 61 UN COMTRADE identified trade products. On the basis of this approach we present the influence of trade in petroleum and gas products from Russia, USA, Saudi Arabia and Norway determining the sensitivity of each EU country. We show that the REGOMAX approach provides a new and more detailed analysis of trade influence propagation comparing to the usual approach based on export and import flows.
1 Introduction
The statistical data of UN COMTRADE comtrade and the World Trade Organization (WTO) Statistical Review 2018 wto2018 demonstrate the vital importance of the international trade between world countries for their development and progress. Also the whole world economy deeply depends on the world trade krugman2011 . At present the UN COMTRADE database contains data for UN countries with up to trade products. Thus the whole matrix of trade monetary flows reaches a large size . In fact for each year the commercial exchange between countries represents the directed network with transactions of various commodities (products) expressed in their US dollar (USD) values of the given year.
It is clear that the recent research developments in the field of complex networks (see e.g. dorogovtsev ) should find useful applications for analysis of this multiproduct World Trade Network (WTN). In wtn1 ; wtn2 it was proposed to use the methods of the Google matrix , PageRank and CheiRank algorithms for analysis of the WTN. The PageRank algorithm had been invented by Brin and Page brin for the ranking of nodes of the World Wide Web (WWW) being at the foundation grounds of the Google search engine brin ; meyer . The applications of these methods to a variety of real directed networks are described in rmp2015 . In contrast to the usual economy approach based on bilateral import and export flows, the Google matrix analysis treats all world countries on equal grounds (since all columns with outgoing country flows of are normalized to unity so that rich and poor countries have equal consideration) and also the PageRank and CheiRank algorithms take into account the whole chain of transactions incorporating the importance of specific network nodes. This is drastically different from the simple bilateral transactions of import and export.
Usually in directed networks, like WWW or Wikipedia, the PageRank vector of the Google matrix plays the dominant role since its components are on average proportional to the number of ingoing links. For the WTN the ingoing flows are related to import. However, the outgoing flows, related to export, are also important for trade. Thus we also use the Google matrix , constructed from the inverted transaction flows, with its PageRank eigenvector, called CheiRank vector linux ; wikizzs . The components of this vector are on average proportional to the number of outgoing links in the original WTN. The construction rules of and for the case of multiproduct WTN are described in detail in wtn2 .
In many cases it is important to know the effective interactions of trade transactions for a specific region (i.e., for selected nodes of the global network) on which one wants to focus the analysis. This requires to know not only direct links between nodes but also the indirect (or hidden) links which connect the selected nodes via the remaining part of the global network. Recently the reduced Google matrix (REGOMAX) algorithm has been invented in greduced and tested with various directed networks of Wikipedia politwiki ; wrwu2017 and protein-protein interactions proteinplos showing its efficiency. This algorithm originates from the scattering theory of nuclear and mesoscopic physics and the field of quantum chaos. In this work, using the COMTRADE data, we apply the REGOMAX algorithm to analyze the influence on European Union (EU) countries of petroleum and gas trade from Russia (RU), USA (US), Saudi Arabia (SA) and Norway (NO). With this approach we are able to measure the sensitivity of EU countries to the supply of petroleum and gas from one of these four countries taking into account the global WTN, i.e., taking into account all direct and indirect transactions of 61 major products with the rest of the world.
We note that there is a variety of papers with network methods applied to financial and trade networks (see e.g. vespignani ; fagiolo1 ; hedeem ; fagiolo2 ; garlaschelli2010 ; japan1 ). However, the applications of the PageRank algorithm to the WTN is rarely used (see e.g. one of the first cases in benedictis ) but the outgoing flows with the CheiRank analysis were not considered apart from wtn1 ; wtn2 . The analysis of hubs and authorities is performed in plosjapan but in our opinion this approach has lower performance comparing to the Google matrix methods. Thus for the bitcoin transaction network the Google matrix methods demonstrate the existence of oligarchy type structure bitcoin . Till present the matrix methods are rather rarely used in the field of transactions even if it was shown that the Random Matrix Theory finds useful applications for financial and credit risk analysis bouchaud ; guhr . The methods of statistical mechanics also demonstrated their efficiency for analysis of market economies marsili . However, the flows considered in bouchaud ; guhr are non-directional while the WTN typically describes directed flows. Due to these reasons we hope that the REGOMAX algorithm will find further useful application for the treatment of trade and financial transactions.
The paper is constructed as follows: in Section 2, we construct the Google matrix for the World Trade Network and introduce the REGOMAX method. In Section 3, we present the network structure of petroleum and gas trade in EU exhibiting direct and indirect effects of petroleum and gas trade between EU economies and non EU major actors as Russia, Saudi Arabia and USA. We also investigate the EU countries trade balance sensitivity to Russian, Saudi Arabian, and US petroleum and to Russian and Norwegian gas over the time period 2004-2016.
2 Methods
We collected the multiproduct (multicommodities) trade data from UN COMTRADE database comtrade for countries, products given by 2 digits from the Standard International Trade Classification (SITC) Rev. 1, and for years , , , . Following the approach developed in wtn2 , for a given year, we build money matrices of the WTN defined as
| (1) |
with country indexes and product index . For future notation we also define
| (2) |
which are the volume of imports () and exports () for a given country and a given product . The global import and export volumes are given by and . Thus the ImportRank () and ExportRank () vector probabilities are given by the normalized import and export volumes
| (3) |
where is the index associated to the country – product couple, and the total trade volume is .
The list of 61 products and 227 countries are given in wtn2 .
2.1 Google matrix construction for the WTN
The Google matrices for the direct trade flow and for the inverted trade flow have the size and are constructed as it is described in wtn2 . By the definition the sum of elements in each column is equal to unity. The Google matrices have the form
| (4) |
where is the damping factor, and and are components of positive column vectors called personalization vectors with meyer . In this work we fix , its variation in the range does not significantly affect the results. The PageRank and CheiRank vectors have each an eigenvalue since and . According to the Perron-Frobenius theorem the components and are positive and give probabilities to find a random surfer (seller) traveling on the network of nodes. The PageRank and CheiRank indexes are defined from the decreasing ordering of probabilities of PageRank vector and of CheiRank vector as and with . A similar definition of ranks from import and export trade volume can be also done via probabilities , , , , , and corresponding indexes , , , , , .
The matrices and are built from money matrices as
| (5) |
where ; ; ; ; and therefore .
Following wtn2 we defined the personalized vectors in (4) via the relative import and export product volume per country
| (6) |
using the definitions (2) and the relation . In this way we obtain the first iteration for PageRank and CheiRank vectors keeping the democracy in countries and proportionality of products to their trade volume. Then in the second iteration we use the personalized vectors from the results of the first iteration
| (7) |
Here we use the tracing over product or countries getting respectively and with their corresponding and indexes. Also after tracing over countries we obtain and with their corresponding product indexes and (, are used in (7)). This second iteration is used for further construction of and matrices with which we work in the following.
2.2 Reduced Google matrix for the WTN
The REGOMAX algorithm, invented in greduced , is described in detail in politwiki . Here we give the main elements of this method keeping the notations of politwiki .
The reduced Google matrix is constructed for a selected subset of nodes. The construction is based on concepts of scattering theory used in different fields including mesoscopic and nuclear physics, and quantum chaos. It captures, in a -by- Perron-Frobenius matrix, the full contribution of direct and indirect interactions happening in the full matrix between selected nodes of interest. In addition the PageRank probabilities of the nodes are the same as for the global network with nodes, up to a constant factor taking into account that the sum of PageRank probabilities over nodes is unity. The -element of can be interpreted as the probability for a random surfer starting at node to arrive in node using direct and indirect interactions. Indirect interactions refer to pathways composed in part of nodes different from the ones of interest. The intermediate computation steps of offer a decomposition of into matrices that clearly distinguish direct from indirect interactions: politwiki . Here is given by the direct links between selected nodes in the global matrix with nodes, is usually rather close to the matrix in which each column is given by the PageRank vector . Due to that does not provide much information about direct and indirect links between selected nodes. The interesting role is played by , which takes into account all indirect links between selected nodes appearing due to multiple pathways via the global network nodes (see greduced ; politwiki ). The matrix has diagonal () and non-diagonal () parts where describes indirect interactions between nodes. The explicit formulas with the mathematical and numerical computation methods of all three matrix components of are given in greduced ; politwiki . We discuss the properties of these matrix components below for the multiproduct WTN.
2.3 WTN datasets
With the REGOMAX approach we consider EU countries dated by 2008 and presented in Table 1 and Table 2; countries are marked by their country code ISO 3166-1 alpha-2 wikicc . The Table of products is given in wtn2 .
In Table 1 in addition to 27 EU countries (marked by blue) we also take best non-EU petroleum (SITC Rev.1 code for petroleum and petroleum products) exporters in 2016 (marked by red) showing their PageRank, CheiRank, ImportRank and ExportRank in 2016. Here the PageRank and CheiRank are given by the local order of and with fixed with highest probabilities at index being (probability in decreasing order). In the same way ImportRank and ExportRank are obtained from and at fixed .
For petroleum we see in Table 1 that in 2016 the top position is taken by Russia in CheiRank and ExportRank while USA is the first in PageRank and ImportRank. We also see that for CheiRank not only the trade volume counts but also the broad trade network of a given country. Thus Saudi Arabia (SA) is 2nd in ExportRank but it has only 6th position in CheiRank since its trade is mainly oriented towards US. Another example is Singapore (SG) which goes from 4th position in ImportRank to 2nd position in PageRank demonstrating the importance of broad trade relations of SG. Among EU countries the first place in all 4 ranks is taken by Netherlands (NL) due to its broad commercial maritime connections.
For gas in Table 2 we have similar observations. Although France (FR), Italy (IT) and UK (GB) occupy the first ImportRank places for EU countries, i.e., they are the top EU importer by volume trade of gas, NL and Belgium (BE) supersede them in PageRank top positions, indicating that NL and BE import gas from more diverse and important sources than FR, IT and GB. Also Qatar (QA) is first in ExportRank but is only at the 4th position in CheiRank due to its rather specific trade orientation.
| PageRank | CheiRank | ImportRank | ExportRank | |
|---|---|---|---|---|
| 1 | US | RU | US | RU |
| 2 | SG | US | NL | SA |
| 3 | NL | AE | IN | US |
| 4 | IN | IN | SG | AE |
| 5 | FR | SG | DE | NL |
| 6 | DE | SA | IT | CA |
| 7 | ES | NL | FR | IQ |
| 8 | GB | BE | GB | SG |
| 9 | IT | GR | BE | KW |
| 10 | BE | NG | ES | NG |
| 11 | CA | IT | CA | IN |
| 12 | AE | DE | SE | GB |
| 13 | NG | CA | PL | BE |
| 14 | PL | IQ | NG | DE |
| 15 | SI | KW | AE | IT |
| 16 | CZ | GB | GR | ES |
| 17 | AT | ES | FI | FR |
| 18 | SE | FR | AT | GR |
| 19 | HU | FI | PT | SE |
| 20 | PT | SE | LV | FI |
| 21 | RO | PT | MT | LT |
| 22 | BG | RO | CZ | DK |
| 23 | SK | DK | DK | PL |
| 24 | GR | BG | LT | PT |
| 25 | MT | LT | RO | RO |
| 26 | SA | PL | IE | BG |
| 27 | RU | HU | HU | SK |
| 28 | LT | AT | SK | AT |
| 29 | IE | SK | SA | LV |
| 30 | CY | LV | BG | MT |
| 31 | DK | MT | SI | HU |
| 32 | FI | CZ | RU | CZ |
| 33 | LV | SI | EE | EE |
| 34 | LU | CY | LU | SI |
| 35 | IQ | EE | CY | IE |
| 36 | EE | IE | IQ | CY |
| 37 | KW | LU | KW | LU |
| PageRank | CheiRank | ImportRank | ExportRank | |
|---|---|---|---|---|
| 1 | NL | US | FR | QA |
| 2 | BE | CA | IT | NO |
| 3 | FR | RU | GB | RU |
| 4 | IT | QA | US | US |
| 5 | GB | NO | DE | AU |
| 6 | ES | AU | BE | DZ |
| 7 | HU | NL | ES | MY |
| 8 | US | GB | NL | BE |
| 9 | DE | DZ | AE | CA |
| 10 | PT | AE | CA | AE |
| 11 | BG | BE | ID | ID |
| 12 | SK | DE | CZ | NL |
| 13 | PL | IT | SK | GB |
| 14 | SI | FR | PT | DE |
| 15 | CA | SE | HU | FR |
| 16 | RO | ID | PL | ES |
| 17 | ID | DK | MY | AT |
| 18 | GR | MY | IE | SK |
| 19 | RU | GR | GR | CZ |
| 20 | MY | PL | SE | IT |
| 21 | CZ | ES | BG | PL |
| 22 | SE | AT | LT | SE |
| 23 | AU | PT | RO | HU |
| 24 | IE | HU | LV | DK |
| 25 | AE | IE | SI | RO |
| 26 | LT | SK | AU | SI |
| 27 | NO | LT | RU | PT |
| 28 | AT | RO | DK | GR |
| 29 | DK | CZ | EE | LT |
| 30 | CY | SI | NO | LU |
| 31 | EE | LV | LU | LV |
| 32 | MT | BG | FI | FI |
| 33 | LV | FI | AT | MT |
| 34 | LU | LU | CY | IE |
| 35 | FI | MT | MT | EE |
| 36 | QA | EE | QA | BG |
| 37 | DZ | CY | DZ | CY |
2.4 Sensitivity of trade balance
As in wtn2 , we determine the trade balance of a given country with PageRank and CheiRank probabilities as and in a similar way via ImportRank and ExportRank probabilities as . The sensitivity of trade balance to the price of petroleum or gas can be obtained by the change of the corresponding money volume flow related to code or by multiplying it by , computing all rank probabilities and then the derivative .
This approach was used in wtn2 . However, in this way there we had the effect of global price change of petroleum or gas for all countries. Here, we want to determine the sensitivity of country balance to a flow of petroleum from a specific country (e.g. RU, US, or SA). Thus we first compute all 4 matrix components of the reduced Google matrix , , , and then we recompute these matrices with the price modification factor applied only for the trade of a given EU country with Russia (or with US, or SA).
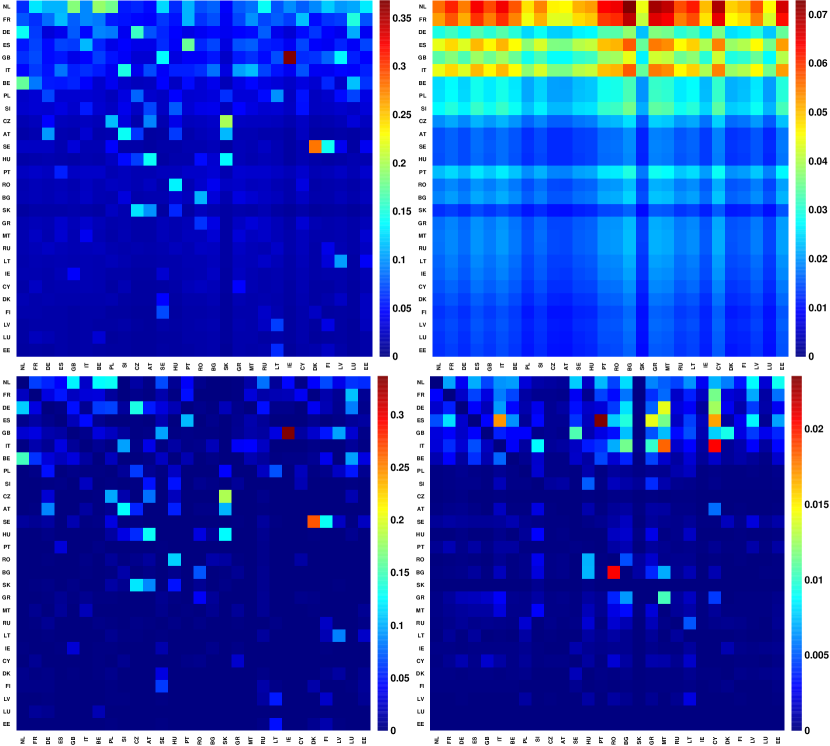
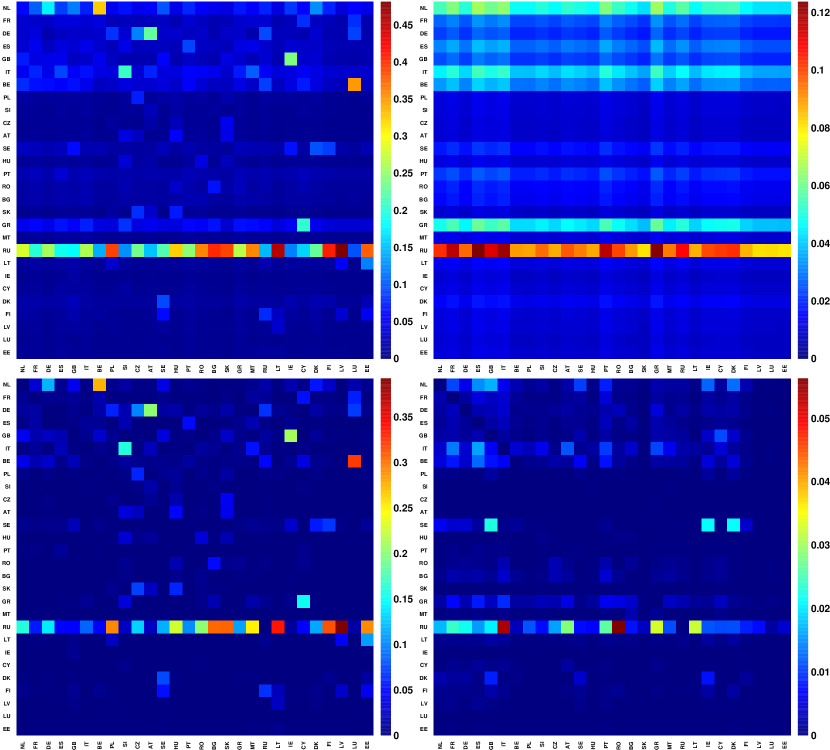
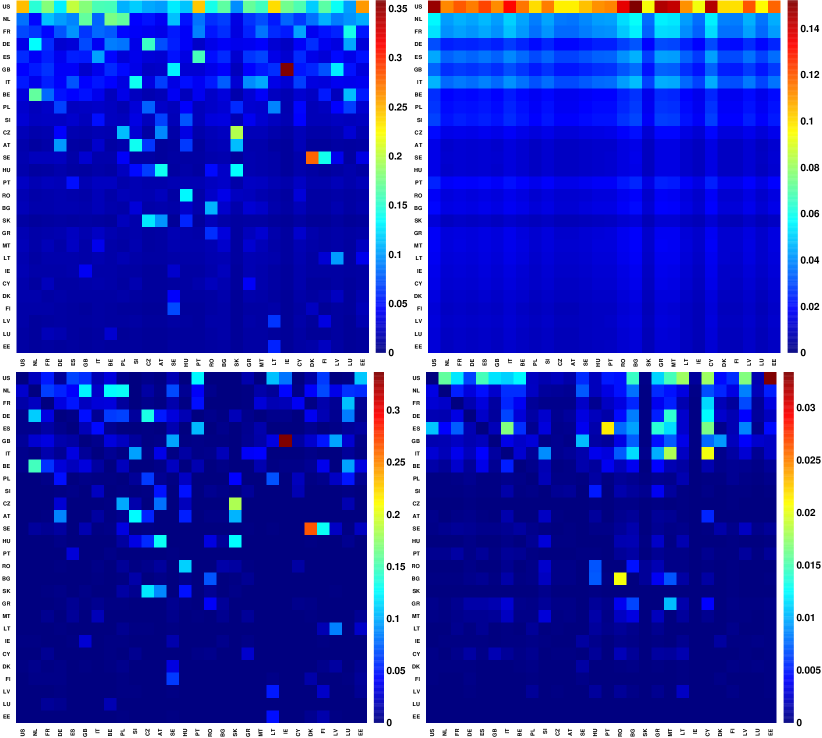
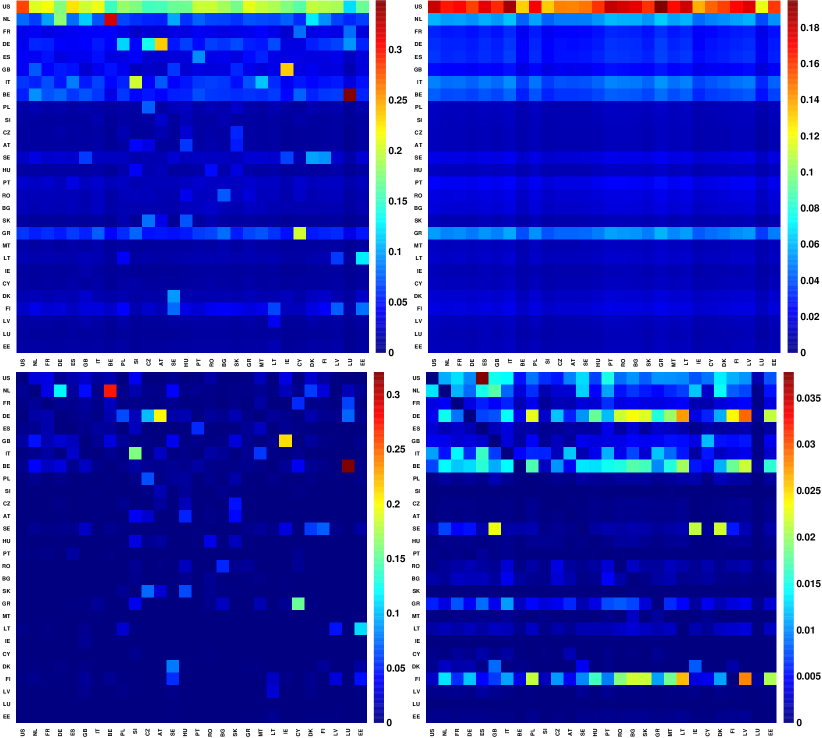
Examples of and its 3 matrix components are shown in Fig. 1 for 27 EU countries with code (27 nodes) plus petroleum of Russia, i.e., a total of 28 nodes for (from the global network with nodes). The same matrix but for gas from Russia is shown in Fig. 2.
We discuss the properties of these matrix components shown in Figs. 1, 2 in the next Section. Here we only note that for selected countries this matrix captures only trade in petroleum (or gas). This can be interesting in itself but in this way we cannot obtain the country balance and its sensitivity. Thus we follow another approach. We take 27 EU countries with all their products (that gives us nodes) and we add to these nodes the node of RU-petroleum. In this way we obtain matrix with the size of nodes (from the total size of being ). In this matrix we have all direct and indirect links of all products of 27 EU countries with petroleum of RU. In this matrix we can change the petroleum price using the multiplier for links from RU petroleum to other nodes with the renormalization of all matrix elements in this column to unity. Then we obtain the probabilities for all countries. The same procedure is done for the CheiRank matrix getting and then the balance sensitivity of country (including all its products) to Russian petroleum. The same procedure is used to obtain the sensitivity to Russian gas (or US or other country gas). The sensitivity computed in this way gives us the real sensitivity of country balance taking into account all direct and indirect links present in the WTN.
3 Results
Here we present the results for EU trade obtained with the reduced Google matrix algorithm.
3.1 Examples of reduced Google matrices and
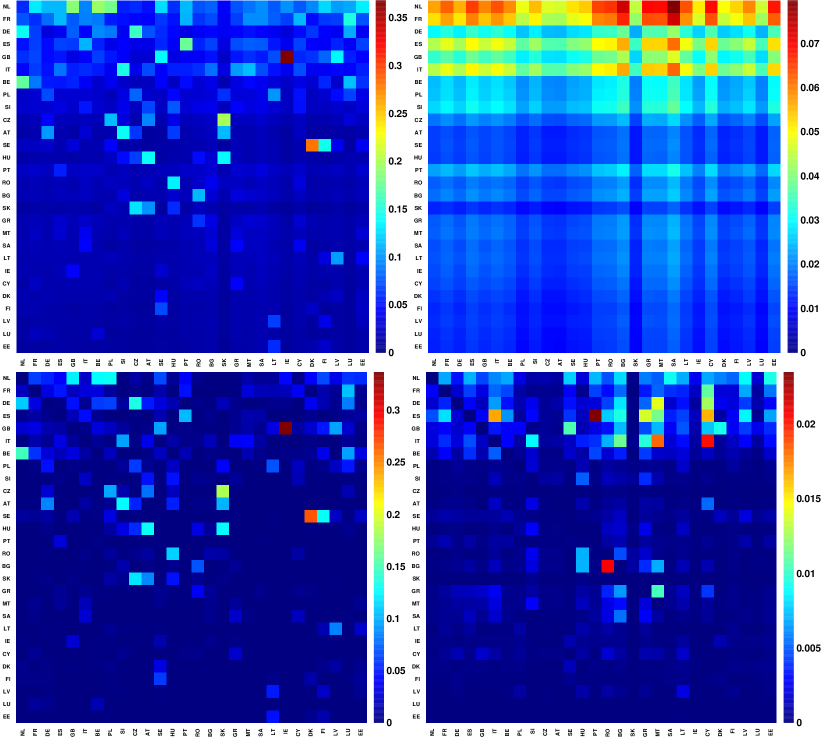
In Fig. 1 we show the reduced Google matrices and and their 3 matrix components for EU petroleum trade with Russia 2016. The matrix size of selected nodes is , the direct and indirect link contributions from other network nodes are taken into account by the REGOMAX algorithm. The nodes are ordered by the PageRank index of countries given in Table 1.
We characterize the weight , , , of and its 3 matrix components , , by the sum of all its elements divided by the matrix size ( for ). By definition we have . It is usual for Wikipedia networks that the weight (see e.g. politwiki ; wrwu2017 ) is rather close to unity since is approximately composed from identical columns of PageRank vector, while the remaining weight of about is approximately equally distributed between and . We find that for the WTN the situation is different. We have , , and so that the weight of is significantly reduced and the weight of is significantly larger than the weight of . We attribute this to the fact that the global matrix of WTN contains many links (about links per node for matrix elements with amplitude being larger than ) in contrast with the very sparsed Wikipedia matrix. Hence, for WTN the importance of direct links is significantly higher. For and its 3 matrix components we obtain the following weights , , and which are similar to the case.
In Fig. 1 (left 4 panels) we show matrix with its 3 matrix components for petroleum product (code ) trade of 27 EU countries with Russia. For and the dominant matrix elements correspond to trade flow from Republic of Ireland (IE) to UK (GB). Indeed, since UK and IE both have territories on island of Ireland the trade flow between two countries is very high. The next by the amplitude is the trade flow from Denmark (DK) to Sweden (SE) both in and . Among the indirect links in we find as the strongest the flow from Portugal (PT) to Spain (ES) and from Romania (RO) to Bulgaria (BG) and Cyprus (CY) to Italy (IT). However, the amplitude of these transitions is relatively small. In the matrix component the dominant transitions points to top PageRank countries NL, FR, DE, ES, GB, IT. In all the matrix components the contribution of petroleum from RU is not very pronounced. We see the similar features for the petroleum trade from US and SA shown in Figs. A1 and A2 of Appendix. These results show that the contribution of petroleum trade is masked by the active trade between EU countries with other products.
The reduced Google matrix and its 3 matrix components are presented in Fig. 1 (right 4 panels). Here, we keep in mind that the flow directions have been inverted to compute CheiRank probabilities. Thus to obtain the highest petroleum exports from Russia we have to focus on the largest matrix elements on the RU horizontal line. Contrarily to the case, here RU exports of petroleum clearly dominate the matrix and its 3 matrix components; this is mainly due to the fact that RU is the petroleum top exporter (see CheiRank and ExportRank in Table 1). From we observe that the strongest petroleum flows from RU point (in decreasing importance) to Latvia (LV), Lithuania (LT), Finland (FI), BG, Poland (PL), Estonia (EE), … which are countries peripheral to RU. We also note non negligible petroleum flows from NL to Belgium (BE), and from BE to Luxembourg (LU).
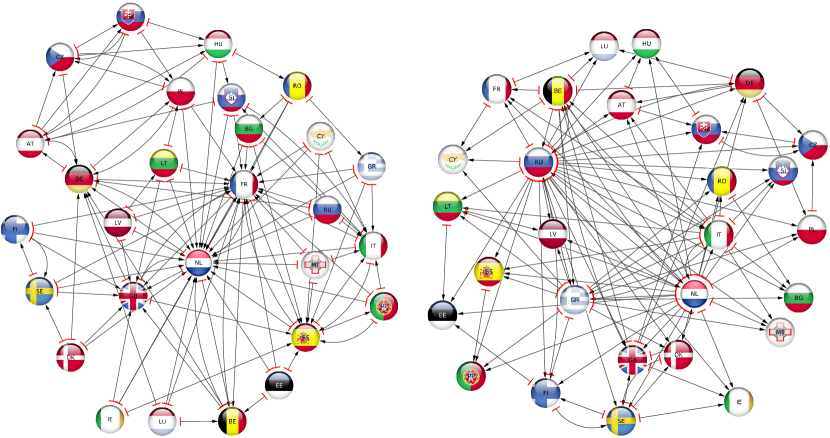
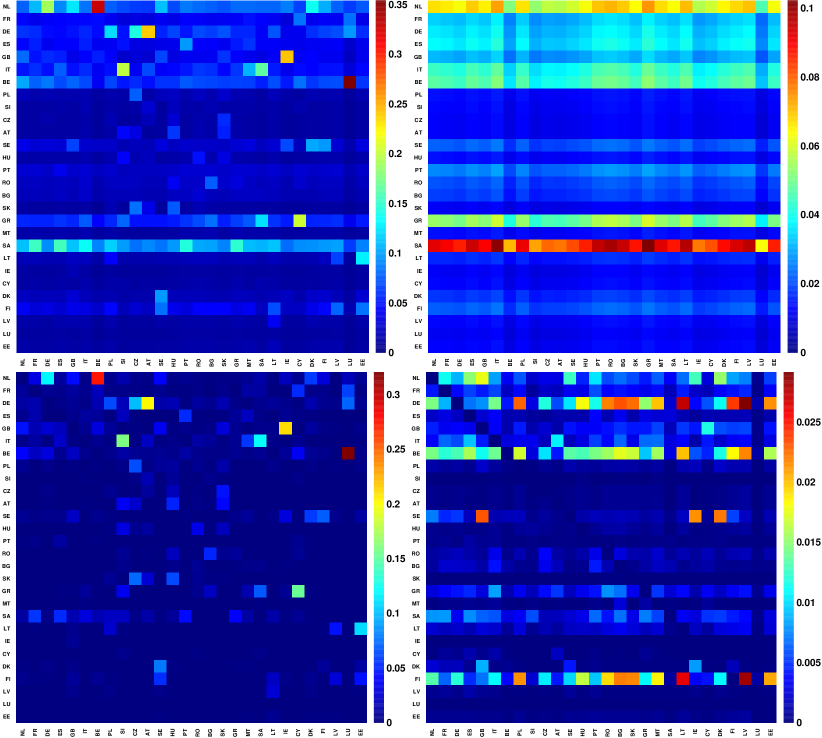
Fig. 2 presents reduced Google matrices and for EU gas trade with Russia. The weights of the and matrix components , , , and , , , , are similar to those of EU petroleum trade with Russia. In Fig. 2 (left 4 panels), the matrix gives the strongest gas import flows which are, by decreasing importance, from CY to IT, IE to GB, DK to SE, BE to FR, LT to PL, ES to PT, … The matrix component shows that the main importer for gas in EU is NL. Indeed import flows toward NL are at least about one order of magnitude more important than toward the other EU states and in particular FR which is nonetheless the top importer according to ImportRank (see Table 2). For the case of gas trade between EU countries and RU, we note that the maximum matrix elements in have the same magnitude than the maximum matrix elements of the other matrix components. In particular, hidden indirect import flows from LU and PL toward Hungary (HU) are clearly visible from . In Fig. 2 (right 4 panels), from , the strongest gas export flows emanate mainly from RU toward (by decreasing importance) Latvia (LV), EE, FI, BG, RO, … Besides this Russian gas export, the second and third most important gas export flows are in fact from GB to IE and from BE to LU. From we see that gas export flows from NL, which is the top EU gas exporter according to CheiRank (see Table 2), although weaker than the ones from RU are nonetheless of the same order of magnitude. Among EU countries and Russia, NL and RU compete for the best gas supplier. Although the weight of is weaker than the weight of the other matrix components, hidden indirect gas export flows can be seen in from, SE and RU, to DE.
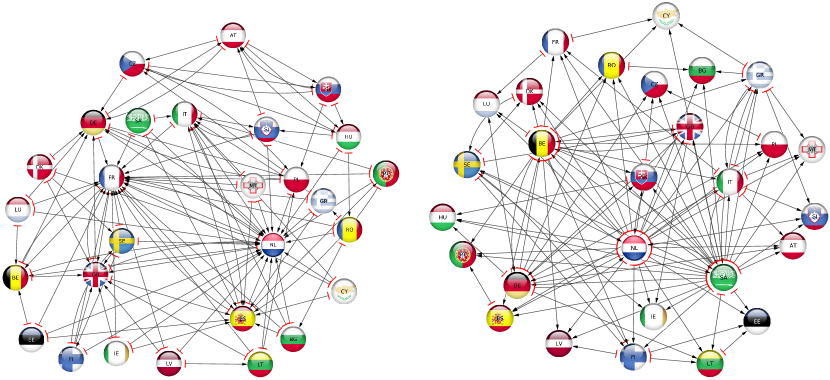
3.2 Network structure of petroleum and gas EU trade
From and matrices shown in Fig. 1, we are able to extract the network structure of the petroleum trade between EU countries and RU. Fig. 3 left panel shows the petroleum import trade network between EU and RU. The top 6 EU economies by nominal GDP (i.e. DE, GB, FR, IT, ES, NL in 2016 wikigdpEU ) are the main petroleum importers, NL and FR being the more central. The performances of these economies are consequently correlated to their abilities to efficiently import petroleum. The four main direct and/or indirect EU gates for RU petroleum are DE, FR, NL, IT. We note closed loop petroleum exchange between (almost) neighboring countries, e.g. DE-AT, CZ-SK, DE-PL, AT-HU, AT-SK, PT-ES, ES-IT, SE-FI. Fig. 3 right panel shows the petroleum export trade network between EU and RU. We clearly retrieve the fact that RU is the first petroleum supplier of EU and that NL is the top EU exporter of petroleum (see CheiRank and ExportRank in Table 1). From both of the petroleum trade networks shown in Fig. 3 we observe that NL constitutes the main European hub for petroleum exchanges. Secondary petroleum exporters are GR, IT, BE, GB, SE, and DE.
We also construct the reduced Google matrices and associated to petroleum import and export between EU countries and Saudi Arabia (SA). Fig. 4 shows the petroleum trade network between EU countries and SA. The EU+SA petroleum import trade network (Fig. 4 left panel) is similar to the one obtain for EU+RU (see Fig. 3 left panel). This illustrate the robustness of the EU intramarket in regards to petroleum import. The main entrances in EU for SA petroleum are FR, IT, ES, and NL. Fig. 4 right panel shows that besides SA the main EU petroleum exporters are NL, BE, DE, IT, GR. From both of the EU+SA petroleum trade networks shown in Fig. 4 we observe a situation different from the EU+RU case (Fig. 3) as not only NL but also DE, IT, GB, constitute each one a hub for petroleum exchanges. Although SA is the top petroleum exporter worldwide, RU is the main supplier for EU, this is the reason why trade networks with SA allows also to unveil secondary petroleum exchange hubs.
3.3 Sensitivity of EU to petroleum price
Above we have considered the reduced Google matrices and with related networks only for petroleum or gas flows of 27 EU countries plus Russia (or SA, US). However, this approach does not capture the global influence of petroleum or gas trade on the all products trade balance of a given EU country. Therefore we extend our REGOMAX analysis taking into account the matrix size for and (see Section 2.4). As the main characteristic we analyze the sensitivity of country global trade balance in respect to small petroleum price increase (from unit price to price ) expressed by the derivative . As described in section 2.4 we express the country balance via CheiRank and PageRank probabilities and also via ExportRank and ImportRank probabilities.
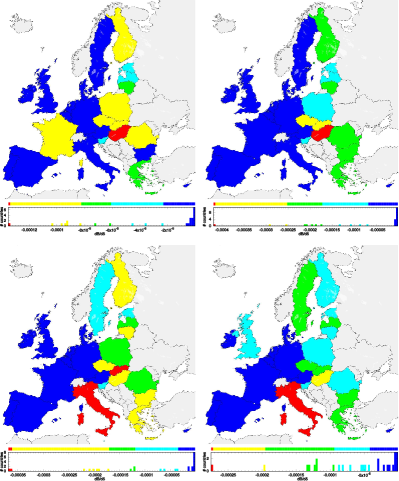
In Fig. 5 we present the sensitivity , shown by color, to petroleum trade with RU, US and SA on the EU political map for year 2016. The sensitivity to petroleum from Russia is shown in Fig. 5 top left panel. We see that the strongest negative effect is produced on NL which is on at the top PageRank position (see Table 1) due to its strong maritime relations which bring a lot of petroleum to NL and then redistributed to other EU countries. The next most sensitive EU countries are Italy (IT), Greece (GR), Bulgaria (BG), Poland (PL), Lithuania (LT) and Latvia (LV). We note that here the sensitivity is defined via CheiRank and PageRank probabilities taking into account the multiplicity of WTN links. The result is very different (see Fig. 5 top right panel) if the sensitivity is defined by ExportRank and ImportRank probabilities, which are usually used in economy for the trade analysis. This crude Export-Import analysis gives the most strong negative sensitivity for Latvia (LV). The next is Lithuania (LT) which as LV keeps close trade relations with RU being ex-USSR republics. Moreover the Export-Import analysis gives a rigid component of Western EU countries almost not sensitive to RU petroleum. The drastic global difference between REGOMAX analysis and the simple standard Import-Export analysis is that the first considers the multilateral cascade of direct or indirect trades between two countries and the second only considers the direct bilateral trade between two countries. We consider that the REGOMAX algorithm provides much more detailed and realistic information on sensitivity to petroleum price compared to the usual Export-Import consideration. We attribute this advantage of REGOMAX analysis to its deep mathematical properties that allows to take into account all direct and hidden links between selected nodes of the WTN. Due to these reasons below we focus mainly on results obtained with the REGOMAX analysis.
The sensitivity of EU to petroleum price from SA and US are shown in the bottom panels of Fig. 5. For SA the most sensitive countries are Spain (ES) and NL while for US the most sensitive is NL. However, for EU the sensitivity to petroleum of SA is by a factor 3-4 smaller than for those from RU. Thus the sensitivity of Germany to Russian petroleum is by a factor 5 stronger than of SA petroleum. In contrast the maximum EU sensitivity to US petroleum is by a factor 2 stronger than to those of RU. The sensitivity of Germany is comparable for US and RU. Let us note that GR is not affected and even benefit from SA petroleum price increase. The same for FI benefiting from RU petroleum price increase. Also we observe a rigid component of Eastern EU countries from Sweden to Greece and from Baltic countries to Germany which are almost insensitive to US petroleum (Fig. 5 bottom right panel).
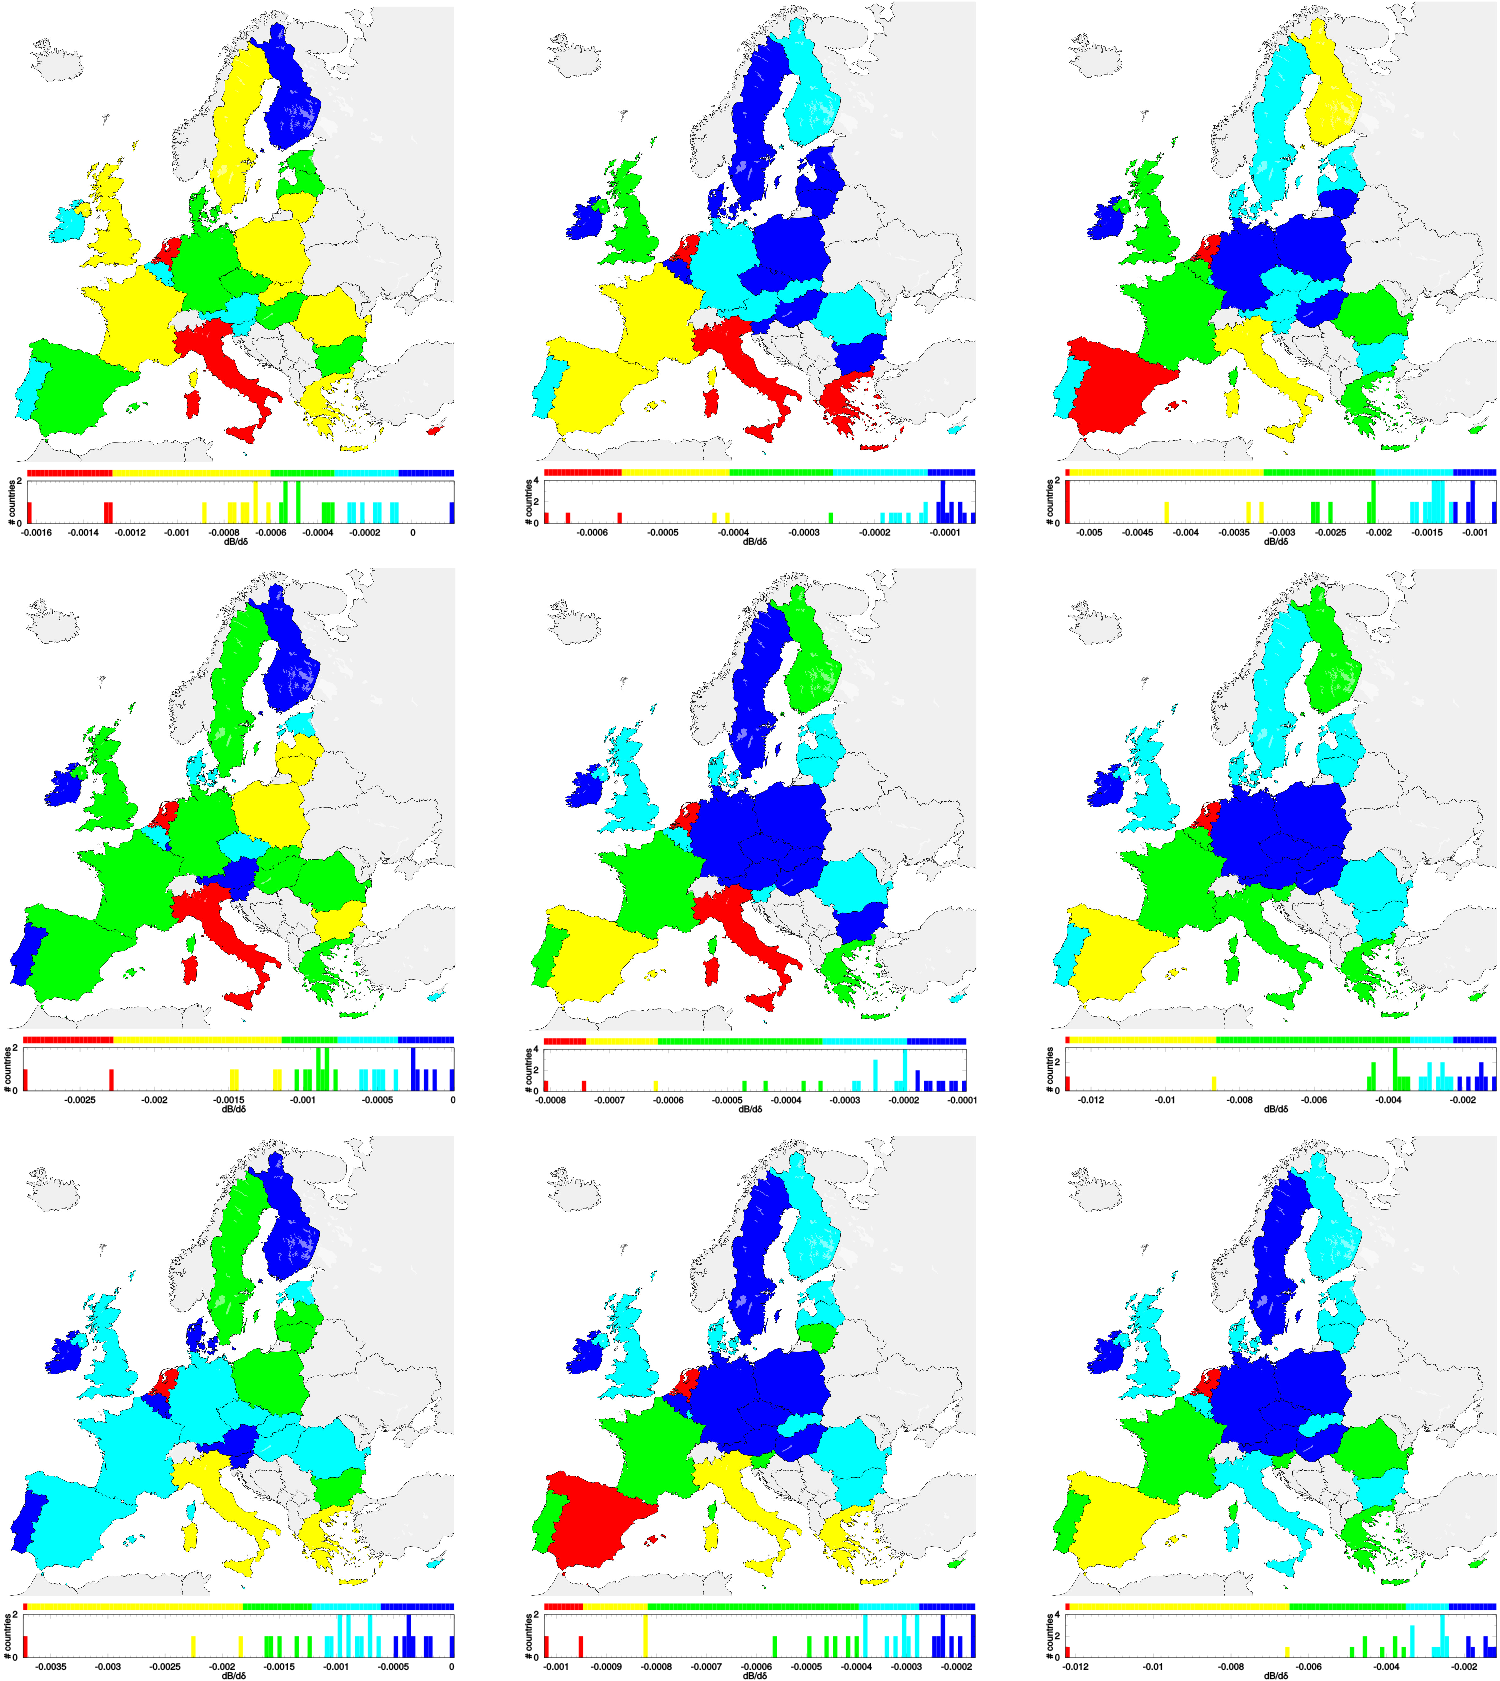
The time evolution of EU sensitivity to petroleum from RU, SA, and US is shown in Fig. 6 for years 2004, 2008, 2012 (for year 2016 see previous Fig. 5). For RU petroleum the most sensitive country are Netherlands (NL), Italy (IT), Cyprus (CY) in 2004, NL and IT in 2008 and NL in 2012 and 2016. Also the maximal negative sensitivity is changing from in 2004 to in 2008, in 2012 and in 2016. From these maximal sensitivities and also from the distribution of sensitivities among EU countries, we observe an overall increase of the balance trade sensitivity to RU petroleum until 2012, then we remark that EU trade sensitivities in 2016 decreases being comparable back to those in 2004. We attribute this to a significant drop of petroleum price happened in the world after the financial crisis of 2007-2008. A similar tendency is visible for SA and US petroleum sensitivity.
For SA petroleum the most sensitive countries are NL, IT and Greece (GR) in 2004, NL, IT in 2008, NL, Spain (ES) in 2012 and 2016 with the maximal negative sensitivity changing from in 2004, in 2008, in 2012 and in 2016. As in the RU case, trade balance sensitivities of EU countries to SA petroleum increases until 2012 and then decreases in 2016 to attain values comparable to year 2004.
For US petroleum the most sensitive countries are NL and ES in 2004 and NL in 2008, 2012 and 2016 with the maximal negative sensitivity changing from in 2004, in 2008, in 2012 and in 2016.
Globally, the ancient USSR satellites and more globally central EU economies are less affected by the increase of petroleum from US or SA. We also observe that due to NL central position in petroleum import and export for EU, the performance of NL economy is the most affected by petroleum price increases. This strong indirect feature is absolutely not captured by the standard Import-Export analysis picture (see e.g. Fig. 5 top right panel). In global we see that EU countries are more sensitive to US petroleum that is by a factor 2-3 stronger comparing to those of RU. We relate this to the fact that US is the world top PageRank country so that it has more global world influence on other countries.
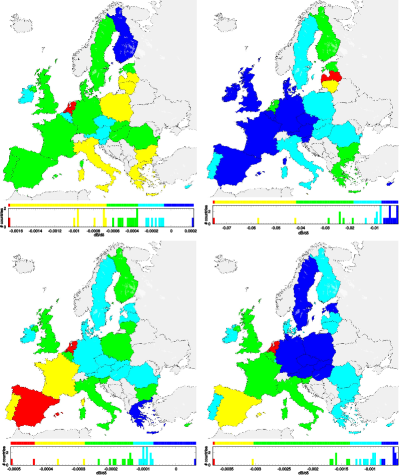
3.4 Sensitivity of EU to gas price
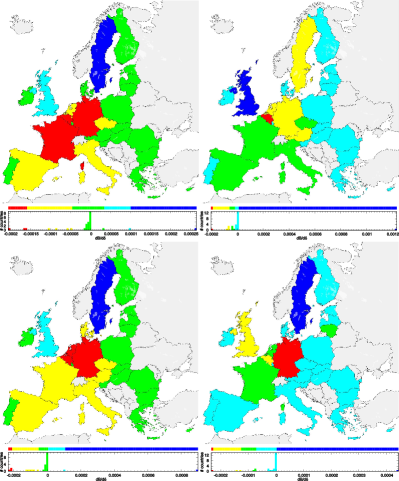
We present in Fig. 7 EU trade balance sensitivity to gas from RU and Norway (NO) in 2016. EU sensitivities to RU gas is one order of magnitude weaker for gas than petroleum. The price increase of the RU gas mainly affects Italy (IT) while other Western EU countries being relatively not sensitive. Again RU neighboring countries are the most sensitives to RU gas import. The most sensitive EU economies to Norwegian gas are DE economy (and to a lesser extent GB and BE economies) which would be affected by NO gas price increase and SE economy which would benefit from it. The positive balance trade sensitivity for SE is certainly due to the entanglement of NO-SE economies. The others economies are insensitive to NO gas (see peak of fourteen EU countries with balance trade around 0 in Fig. 7 right panel).
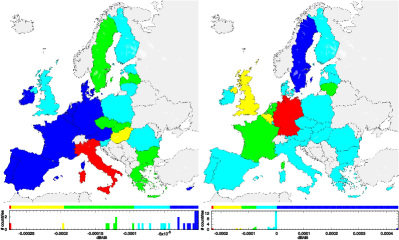
Figs. 8 and 9 show from 2004 to 2016 time evolution of EU economies trade balance sensitivity to RU and NO gas. In Fig. 8 we observe that during this time period the Western EU bloc from PT to DE remained insensitive to RU gas with the exception of IT economy which became the most affected since 2012 (also FR economy were temporarily sensitive to RU gas around 2004). In Fig. 9 we observe that during the same period EU east end countries are insensitive to NO gas. The most affected countries by NO gas volume import and/or price increase are FR, BE, DE in 2004, BE in 2008, BE, NL, DE in 2012 and DE in 2016. SE economy always benefit from volume increase of NO gas excepting in 2008, at that time SE was relatively affected and GB was benefiting from NO gas.
4 Discussion
In this work we developed the reduced Google matrix (REGOMAX) analysis of the multiproduct world trade network with a specific accent to sensitivity of EU country trade balance to petroleum and gas prices from Russia, USA, Saudi Arabia and Norway. In particular we observe that, during the 2004-2016 time period, most of the EU countries are sensitive to price increase of Russian petroleum and petroleum products. The situation is different for Saudi Arabia and US petroleum price influence for which east and central EU countries are relatively less affected. The Netherlands, which is the best EU petroleum importer and exporter, is during this time period the most affected EU country by the price increase of either Russia, Saudi Arabia, or USA. The influence of Russian gas is mostly exerted to Eastern EU countries among which ancient USSR satellites, Western EU countries being insensitive with the exception of Italy. Although Norway is the second gas supplier for EU, the Norway price increase influences only few EU countries, affecting Germany during the whole 2004-2016 time period, France in 2004, Belgium in 2004 and 2012, and The Netherlands in 2012, but benefiting to Sweden (excepting around 2008).
We show that comparing to the usual export-import consideration this REGOMAX approach takes into account the cascade of chain influence propagation via all nontrivial pathways of trade relations between countries. Due to this feature this approach is more powerful compared to only nearby link analysis considered in the import-export approach. Thus the REGOMAX method allows to recover indirect influence of petroleum or gas price from a specific country on EU trade. We argue that the further investigation of such indirect influence will play an important role in petroleum or gas crisis contamination propagation in EU trade.
Acknowledgments
We thank the representatives of UN COMTRADE comtrade for providing us with the friendly access to this database. This work was supported in part by the Pogramme Investissements d’Avenir ANR-11-IDEX-0002-02, reference ANR-10-LABX-0037-NEXT (project THETRACOM); it was granted access to the HPC resources of CALMIP (Toulouse) under the allocation 2017-P0110. This work was also supported in part by the Programme Investissements d’Avenir ANR-15-IDEX-0003, ISITE-BFC (project GNETWORKS) and by Bourgogne Franche-Comté region (project APEX).
Appendix
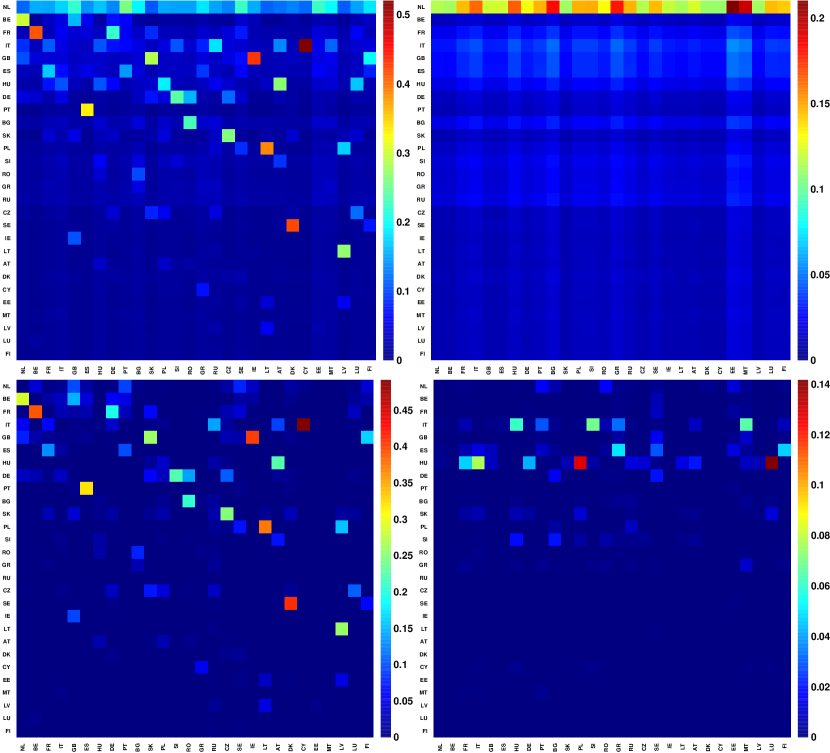
Here we present some additional figures of the reduced Google matrix analysis of EU trade. Fig. A1 shows the reduced Google matrices and for petroleum product associated to 27 EU countries and Saudi Arabia. Fig. A2 shows the reduced Google matrices and for petroleum product associated to 27 EU countries and US.
References
- (1) United Nations Commodity Trade Statistics Database Available: http://comtrade.un.org/db/. Accessed January 2019.
-
(2)
World Trade Organization (2018)
World Trade Statistical Review 2018
Available:
https://www.wto.org/english/res_e/statis_e/wts2018_e/
wts18_toc_e.htm. Accessed January 2019. - (3) P.R. Krugman, M. Obstfeld and M. Melitz, International economics: theory & policy, Prentic Hall, New Jersey (2011)
- (4) S. Dorogovtsev, Lectures on complex networks, Oxford University Press, Oxford (2010)
- (5) L.Ermann and D.L. Shepelyansky, Google matrix of the world trade network, Acta Physica Polonica A 120, A158 (2011)
- (6) L.Ermann and D.L.Shepelyansky, Google matrix analysis of the multiproduct world trade network, Eur. Phys. J. B 88, 84 (2015)
- (7) S.Brin and L.Page, The anatomy of a large-scale hypertextual Web search engine, Computer Networks and ISDN Systems 30, 107 (1998)
- (8) A.M. Langville and C.D. Meyer, Google’s PageRank and beyond: the science of search engine rankings, Princeton University Press, Princeton (2006)
- (9) L.Ermann, K.M. Frahm and D.L. Shepelyansky Google matrix analysis of directed networks, Rev. Mod. Phys. 87, 1261 (2015)
- (10) A.D. Chepelianskii, Towards physical laws for software architecture, arXiv:1003.5455 [cs.SE] (2010)
- (11) A.O.Zhirov, O.V.Zhirov and D.L. Shepelyansky, Two-dimensional ranking of Wikipedia articles, Eur. Phys. J. B 77, 523 (2010)
- (12) K.M. Frahm and D.L. Shepelyansky, Reduced Google matrix, arXiv:1602.02394[physics.soc] (2016)
- (13) K.M. Frahm, K. Jaffrès-Runser and D.L. Shepelyansky, Wikipedia mining of hidden links between political leaders, Eur. Phys. J. B 89, 269 (2016)
- (14) C. Coquide, J. Lages and D.L. Shepelyansky, World influence and interactions of universities from Wikipedia networks, Eur. Phys. J. B 92, 3 (2019)
- (15) J. Lages, D.L. Shepelyansky and A. Zinovyev, Inferring hidden causal relations between pathway members using reduced Google matrix of directed biological networks, PLoS ONE 13(1), e0190812 (2018)
- (16) M.A. Serrano, M. Boguna and A. Vespignani, Patterns of dominant flows in the world trade web, J. Econ. Interac. Coor. 2, 111 (2007)
- (17) G. Fagiolo, J. Reyes and S. Schiavo, World-trade web: topological properties, dynamics, and evolution, Phys. Rev. E 79, 036115 (2009)
- (18) J. He and M.W. Deem, Structure and response in the world trade network, Phys. Rev. Lett. 105, 198701 (2010)
- (19) G. Fagiolo, J.Reyes and S. Schiavo, The evolution of the world trade web: a weighted-network analysis, J. Evol. Econ. 20, 479 (2010)
- (20) M. Barigozzi, G. Fagiolo and D. Garlaschelli, Multinetwork of international trade: a commodity-specific analysis, Phys. Rev. E 81, 046104 (2010)
- (21) A. Chakraborty, Y. Kichikawa, T. Iino, H. Iyetomi, H. Inoue, Y. Fujiwara and H. Aoyama, Hierarchical communities in the walnut structure of the Japanese production network, PLoS ONE 13(8), e0202739 (2018)
- (22) L. De Benedictis and L. Tajoli, The world trade network, World Economy 34(8), 1417 (2011)
- (23) T. Deguchi, K.Takahashi, H.Takayasu and M. Takayasu, Hubs and authorities in the world trade network using a Weighted HITS algorithm, PLoS ONE 9(7), e1001338 (2014)
- (24) L. Ermann, K.M. Frahm and D.L. Shepelyansky, Google matrix of Bitcoin networks, Eur. Phys. J. B 91, 127 (2018)
- (25) J.-P. Bouchaud and M. Potters, Theory of financial risk and derivative pricing, Cambridge University Press, Cambridge UK (203)
- (26) M.C. Munnix, R. Schaefer and T. Guhr, A random matrix approach to credit risk, PLoS ONE 9(5), e98030 (2014)
- (27) M. Bardoscia, G. Livan, and M. Marsili, Statistical mechanics of complex economies, J. Stat. Mech.: Theo. Exp. 2017, 043402 (2017)
-
(28)
ISO 3166-1 alpha-2,
https://en.wikipedia.org/w/index.php
?title=ISO_3166-1_alpha-2&oldid=881234177. Accessed January 2019. -
(29)
List of sovereign states in Europe by GDP (nominal), https://en.wikipedia.org/w/index.php?title=List_of_
sovereign_states_in_Europe_by_GDP_(nominal)&
oldid=864980281. Accessed January 2019.