Direct observation of the Broad Line Region in X-rays during the low state of NGC 4051
Abstract
NGC 4051 is one of the X-ray brightest and most variable Seyfert galaxies. During 2009 NGC 4051 was caught at its lowest state ever observed by XMM-Newton. The low source continuum emission allows a clear measurement of the He-like emission lines of N+5 and O+6. The exceptionally high intercombination line flux is a direct measurement of either a high density or a UV irradiated photoionized plasma. Either way, this provides an unambiguous distance diagnostic. We find that the line emitting region has a density of cm-3 and distance of a few cm from the continuum source, placing it within the UV-optical Broad Line Region of NGC 4051. Both N+5 and O+6 independently result in similar measurements for density and distance. In addition, we find the kinematics of the broad O+7 Ly match those of the He Å line, which is associated with the NGC 4051 Broad Line Region. This is the first direct X-ray measurement of a Seyfert Broad Line Region.
1 Introduction
Optical and UV emission lines with velocity broadening are ubiquitously observed in spectra of Active Galactic Nuclei (AGN). This broadening is attributed to a virial Keplerian velocity around a black hole (BH), . When km the emitting region at distances has been termed the Broad Line Region. The spectral lines are commonly seen in lower ionization species such as H, H, He+1, and C+3 as broad spectral features. These lines often react to changes in the UV and optical continuum within a few light days for low mass Seyferts, placing the BLR at cm from the continuum source.
While the BLR is commonly observed in the longer wavelengths, in X-rays it has not been measured directly. The BLR was known to absorb X-rays, initially serving as a probe for BLR parameters (e.g. Reichert et al., 1986). With the advent of the X-ray spectrometers on board XMM-Newton and Chandra observations of broad emission features were made, such as Kaastra et al. (2002) and Blustin & Fabian (2009), though these are always measured tentatively in the residuals, with the distances only inferred through line width estimates and velocities weakly constrained. Another possibility of observing the BLR in X-rays is through obscuration of the X-ray source (Risaliti et al., 2011a, b), where the timescale of obscuration is translated into the . Svoboda et al. (2015) associated the variability timescale of ionized absorbers with the BLR, though it is unclear if these are just unrelated outflows at similar distances or an intrinsic part of the UV-optical BLR.
A more complex analysis is the ”locally optimally emitting clouds” (Baldwin et al., 1995) model. Costantini et al. (2007) find that in Mrk 279 this estimate is enough to account for the observed X-ray line luminosities, though results were more ambiguous in Costantini et al. (2016).
Finally, Miller et al. (2018) observed line flux variations in the Fe K line of NGC 4151 on time scales of s. This places the emitting region at , within the inner BLR or X-ray BLR, though this may not be what is commonly referred to as the UV-optical BLR, which is considered to be further out. These observations may reveal that the BLR extends more towards the inner part of the accretion system than previously thought.
In this paper we present the first direct diagnostic of an AGN BLR seen in X-ray emission lines, using the O+6 and N+5 He-like lines, considering both effects of collisional excitation and UV pumping on the line intensity ratios. In addition we compare the broad spectral O+7 line to other broad lines in the optical and UV spectra of NGC 4051.
2 NGC 4051 and previous works
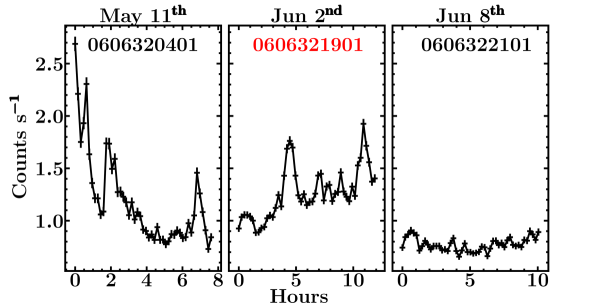
NGC 4051 is a nearby Seyfert 1 at redshift , distance Mpc, mass of , with a bolometric luminosity of erg s-1. In addition it is highly variable in X-rays, with the flux changing drastically on timescales of minutes (See Fig. 1). As such it has been observed with the Reflection Grating Spectrometer (RGS) on-board XMM-Newton 17 times, 3 times with the Chandra transmission gratings, and even more with RXTE and Swift. The broadband spectral variability of NGC 4051 has been extensively discussed by Uttley et al. (2004), who correlate different spectral components in an XMM-Newton observation from 2002.
The physics of NGC 4051 has been examined by X-ray gratings several times. First were Collinge et al. (2001) who measured several outflowing ionized components, comparing to UV spectra and showing the most ionized X-ray components are not seen in the UV. Mason et al. (2004) find evidence for a broad, possibly relativistic O line.
Lobban et al. (2011) examined Chandra transmission grating spectra and found several outflowing ionization components, with possible significant feedback to the host galaxy. More recently, Silva et al. (2016) modeled NGC 4051, and measured timing lags consistent with ionized absorber distances of a few cm.
The present paper is not the first to examine the possibility of the BLR in X-rays. Steenbrugge et al. (2009) examined this possibility by comparing the broad emission wings of O+6 and He+1 from the UV spectrum of Peterson et al. (2000), finding consistent velocities and concluding, as did Costantini et al. (2007), that the BLR is stratified.
The O+6 emission line fluxes have been used previously as a density diagnostic for NGC 4051. Pounds et al. (2004) measure the forbidden to intercombination ratio () in the same observation discussed by Uttley et al. (2004), and find the gas to be in the low electron density limit. They estimate the size of the X-ray line emitting region to be cm, more extended than where the BLR is observed in the UV or optical (Peterson et al., 2000; Shemmer et al., 2003; Fausnaugh et al., 2017). Ogle et al. (2004) observing in yet another epoch also try and measure the ratio in their observation and also find the density to be below the critical density. They infer a possible observation of the BLR in X-rays from the broadening in the O and C lines.
3 Observations
| Observation | Date | Exposure | Rate |
|---|---|---|---|
| s | Counts s-1 | ||
| 0606320401 | 2009-05-11 | 28800 | |
| 0606321901 | 2009-06-02 | 44500 | |
| 0606322101 | 2009-06-08 | 37650 |
While NGC 4051 has a plethora of high resolution X-ray grating observations, we are primarily interested in the lowest states of NGC 4051 as this is when the emission lines are most prominent and absorption contamination is least. In Table 1 the three lowest-state XMM-Newton observations are listed along with their exposures and count rates. We limit the low state to be less than 0.2 counts s-1 in the RGS. The 2002 observation previously analyzed by Uttley et al. (2004) and Pounds et al. (2004) has 0.220 counts s-1.
Stacking spectra is a common practice in X-ray spectroscopy, and in particular for low flux states such as those we use in this paper. In Fig. 1 we show the XMM-Newton MOS1 (M1) light curves. It is evident that NGC 4051 is variable on timescales of less than an hour, and the benefit of added statistics may be completely annulled by time dependence of the diagnostic features. In the observations listed in Table 1, the broad wings of the intercombination and forbidden line change between the observations, and summing them creates a skewed spectral feature that impedes the narrow line flux measurement. As such, we perform our measurements on each of the observations individually.
We note the RGS spectra themselves already introduce an ambiguity as they are a result of a hour exposure. Depending on how fast the emission features react to changes in continuum flux, this uncertainty may or may not be significant. A single good measurement of requires at least 10 hours of exposure with the XMM-Newton RGS.
4 The He-like triplets
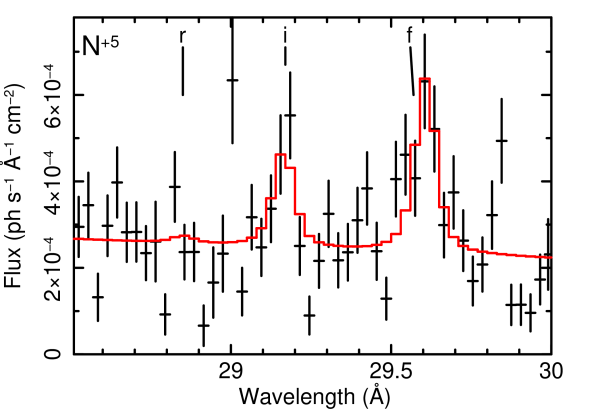
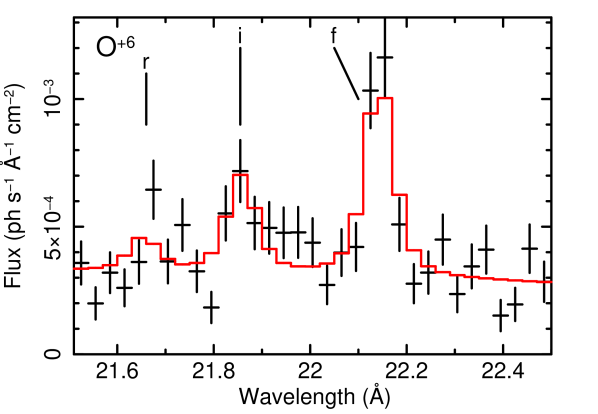
NGC 4051 provides bright He-like emission lines of N+5, O+6 and marginally Ne+9, cleanly discerned in the low states. If these are near the critical flux ratios (Porquet & Dubau, 2000), they allow for accurate density diagnostics. This is not possible in all observations, because both clean unabsorbed emission lines and high enough S/N is needed for accurate determination of the line ratios.
The method for finding densities is detailed by Porquet & Dubau (2000). In short, the ratio is sensitive to electron density, where in a critical regime, element dependent, of cm-3 it is an accurate estimator of . In Figure 2 we present the O+6 and N+5 triplets. The continuum is fit locally as to not be affected by global factors, and three Gaussians are fit with their rest-frame line centers frozen, and their redshifts tied together. The measurement of fluxes and uncertainties is done using the CFLUX convolution model within the HEASARC package XSPEC. The continuum is allowed to vary so the uncertainties include continuum uncertainty as well. As the width of the narrow lines is unresolved we freeze them as well to Å, well below the RGS resolution. When tested, the fit is completely insensitive to this parameter. Flux measurements for all three observations and both triplets are presented in Table 2. Note since CFLUX yields flux measurements in a log scale, Uncertainties on the ratios are derived directly from the exponential uncertainty.
| Observation | r | i | f | f/i | |||
|---|---|---|---|---|---|---|---|
| erg cm-2 s-1 | cm-3 | cm | |||||
| O+6 | |||||||
| 0606320401 | |||||||
| 0606321901 | |||||||
| 0606322101 | |||||||
| N+5 | |||||||
| 0606320401 | |||||||
| 0606321901 | |||||||
| 0606322101 | |||||||
4.1 Measuring and
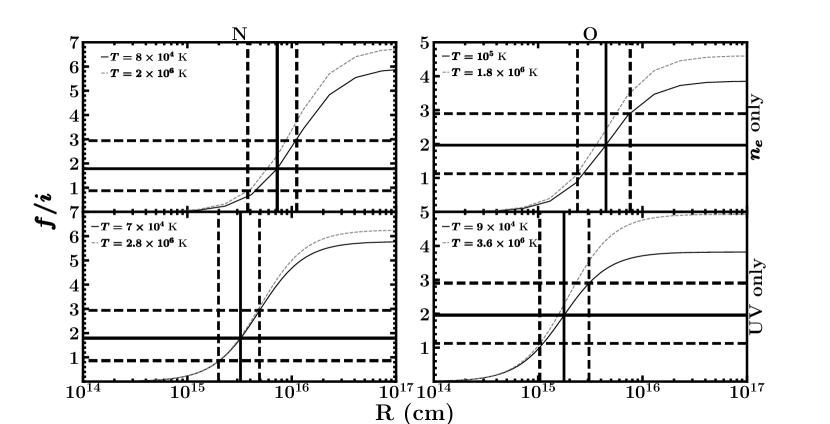
We calculate the intersections of the measured ratio with the theoretical graph (Porquet & Dubau, 2000) to obtain . The uncertainties are similarly derived from the uncertainties on the ratio. Note Porquet & Dubau (2000) provide different curves for different temperatures. For the quoted value we use the lower temperature appropriate for photoionized plasma, and the uncertainties from the temperature yielding the most conservative uncertainty (See Fig. 3). If is inferred in some other way these could be improved slightly.
To convert the electron densities to distances we use the ionization parameter:
| (1) |
For the ionizing luminosity we integrate the SED presented in Maitra et al. (2011) to get erg s-1, and use (cgs, erg cm s-1) from the photoionized component in the global fit (see Section 5). This allows us to convert the plots from Porquet & Dubau (2000) from to , the distance from the ionizing source. Observation 0606321901 provides the most constraining measurements of distance, with both N+5, cm, and O+6, cm, agreeing. Results are presented in Figure 3 (top panels), and see Table 2 for all measurements. The other observations yield consistent results as well, but do not constrain distances.
4.2
UV pumping can mimic the intercombination enhancement effect of electron collision. We solve the population equations assuming the intercombination levels are enhanced only through UV pumping, rather than collisions. We denote the populations of the upper levels of the intercombination transitions as , the population of the upper level of the forbidden line is , and is that of the ground level. The population equations are:
| (2) | ||||
| (3) |
are the rate coefficients for radiative recombination (including cascades) detailed in Tables 4 (N+5) and 5 (O+6) of Porquet & Dubau (2000), is the Einstein spontaneous decay coefficient given in Table 2 of Porquet & Dubau (2000). cancels out in the final line intensity ratios. Finally is the UV excitation rate coefficient:
| (4) |
where the line profile is assumed here to be a Dirac function centered around the transition, and is the relevant cross-section. The values for the wavelengths corresponding to the energy difference between levels are: 1623.6Å, 1638.3Å, 1639.9Å for O; and 1896.8Å, 1907.3Å, 1907.9Å for N.
The UV flux is taken from the IUE spectrum swp51045111We would like to thank Dr. Derck Massa, Dr. Nancy Oliversen, and Ms. Patricia Lawton, then members of the GSFC Astrophyics Data Facility (ADF) staff under direction of Dr. Michael Van Steenberg for providing this MAST image.. While these wavelengths fall on narrow emission lines, we take only the continuum UV flux, as the UV lines are either produced at the same place as the X-ray emission lines, or much farther out. The continuum flux between 1400Å and 2000Å is relatively flat, consequently we used erg cm-2 s-1 Å-1 for all wavelengths. Given that the spectrum was obtained during 1994, the variability of NGC 4051, and that a factor 3 in flux results in only a factor 2 change in distance, we find this assumption reasonable.
We solve the system of Eq. 2,3 in steady state:
| (5) |
for . The resulting solution provides the ratio as a function of distance given UV is the sole reason for intercombination enhancement. These are plotted in the lower panels of Figure 3.
This measurement, , implies lower distances by a factor of compared with the pure collisional analysis, , though is consistent with it and may be due to the uncertainty in . The two methods should probe the same distance, as the intensity of UV pumping is directly related to the distance to the UV source, but the density diagnostic is related to this distance as well. This is due to the fact we use to convert the density to distance, which relies on the ionizing luminosity which peaks in the UV. A lower density plasma, for example, to be at the same ionization level would have to be farther from the source. This would drive the line ratio towards the low density limit, but note this would be true for UV pumping as well, since less UV photons are available to pump the intercombination line. As such, both processes may contribute to the intercombination enhancement, and in any case we cannot discern between the two cases. The distance where one process significantly contributes also sees a significant contribution from the other.
5 Global model - a photoionized emitter
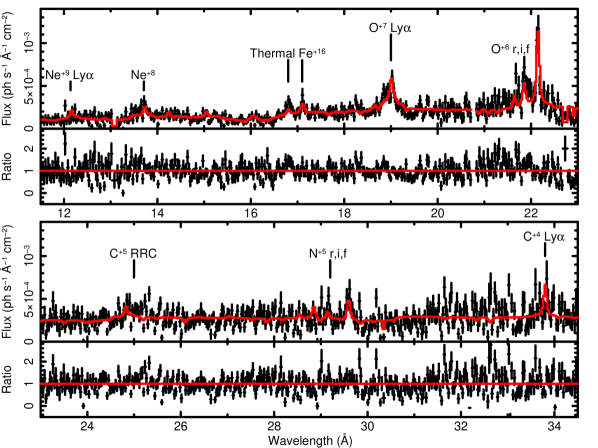
We model the full spectrum of observation 0606321901, which best constrains the distances. The data and global model are shown in Figure 4. The fit was done on the 8Å-37Å band, but featureless edges of the spectrum are clipped. Since absorption features are hard to discern in the low state, we follow the previous works listed in Section 2, and examine the high state. We find the only prominent absorption is due to an km s-1 outflow. This velocity is accurately determined in the high state, also reported by Pounds & Vaughan (2011a). This is the only absorption component clearly detected in the low state, particularly due to the O+6 edge at 16.8Å.
The Fe+16 prominent emission lines around 15 and 17Å are a clear indication of a thermal plasma of keV, as the rates of recombination to L-shells in a photoionized plasma are too low. At where the Fe+16 abundance peaks, the predicted flux of these lines by the modeled photoionized plasma are still almost 10 times less. At the best-fitted value of the photoionized component, these lines are completely non-existent.
The best fit model continuum is comprised of a powerlaw and a blackbody, as a powerlaw cannot fit the spectrum well which has been previously noted by e.g. Collinge et al. (2001). This is a phenomenological description of the continuum, and we do not derive physical parameters from it. Next, the model includes a photoionized component which produces both emission and absorption features, a highly photoionized component which produces both narrow and broad ( km s-1) emission, and a thermal emission component. The best fitted model parameters and 90% uncertainties are given in Table 3. The emitting components’ redshifts are frozen to that of NGC 4051, . The population file used for the absorption and emission photoionized models in XSPEC222https://heasarc.gsfc.nasa.gov/docs/xanadu/xspec/ within the HEASoft package333https://heasarc.gsfc.nasa.gov/lheasoft/, WARMABS and PHOTEMIS444https://heasarc.gsfc.nasa.gov/xstar/xstar.html by Tim Kallman respectively, are for cm-3 as found in Section 4.
The lower photoionized component fits most of the emission lines, and in particular the bright He-like ones. The same also produces the km s-1 absorbing outflow, and especially the O+6 edge. Another component is the more ionized , producing the narrow O+7 and the Ne+9 lines. This also produces a broad emission component, most prominent in the broad shoulder of the O+7 Ly line. Interestingly, the Emission Measure (EM) of the broad component, EM cm-3, matches that of the component which produces the He-like lines that provide the high density line diagnostics. In Section 6 we use this to estimate the size of the BLR.
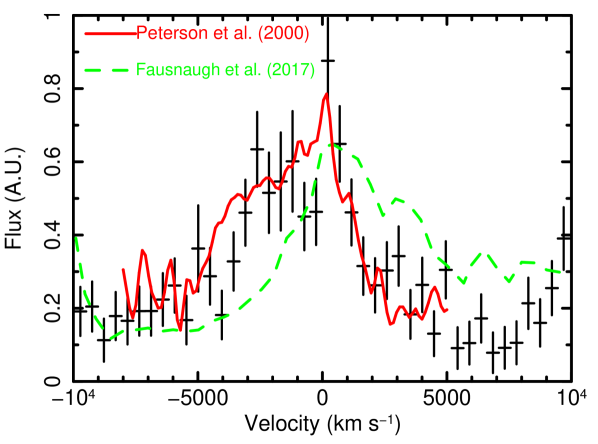
In Figure 5 we compare the O+7 line profile to the RMS He Å profiles taken from Peterson et al. (2000) and Fausnaugh et al. (2017). The similarity with these two profiles and their blue wing is remarkable, in particular that of Peterson et al. (2000), suggesting the two ions originate from the same region, or at least share kinematics. This reinforces the evidence for an X-ray component in a stratified BLR. The mean C+3 profile from Peterson et al. (2000) is similarly broad, though it is heavily absorbed, as seen in Kraemer et al. (2012).
| Component | Parameter | Units | Value |
|---|---|---|---|
| Continuum | |||
| Powerlaw | |||
| norm | ph keV-1 cm-2 s-1 | ||
| Blackbody | kT | keV | |
| Luminosity | erg s-1 | ||
| Highly | |||
| photoionized | [erg cm s-1] | ||
| Broad emission | km s-1 | 3800 | |
| EM | cm-3 | ||
| Narrow emission | km s-1 | unresolved | |
| EM | cm-3 | ||
| Photoionized | |||
| [erg cm s-1] | |||
| Asplund et al. (2009) | |||
| Absorption | column | cm-2 | |
| Velocity | km s-1 | ||
| Emission | EM | cm-3 | |
| Velocity | km s-1 | 0 (fixed) | |
| Thermal(CIE) | |||
| kT | keV | ||
| EM | cm-3 |
6 The X-ray BLR
Line profiles of the NGC 4051 BLR were analyzed in the optical and UV. From the optical He+1 line in the RMS spectrum, Peterson et al. (2000) find a FWHM velocity of km s-1, with a blue-ward asymmetry of km s-1 indicating an out-flowing wind. Similarly, in the UV they find asymmetric and broad profiles in the He+1 and C+3 lines. Shemmer et al. (2003) find the distance to the BLR to be approximately cm from reverberation mapping, and recently Fausnaugh et al. (2017) improved uncertainties and estimated cm.
Previous X-ray measurements place several of the outflow components at distances consistent with the UV and optical measurements of the BLR, with modeling indicating an X-ray BLR, e.g., by Costantini et al. (2007). In the present work we find direct evidence of cm-3 plasma consistent with BLR densities. The plasma is emitting He-like lines which indicates a distance of cm, similar to that of Fausnaugh et al. (2017). We also measure a km s-1 wide profile in the O+7 line, slightly broader than the He Å RMS profile where km s-1 (Fausnaugh et al., 2017). This suggests the X-ray BLR is slightly closer to the source despite the consistent distance measurements. The EM and resulting mass measurement below indicates the X-ray emitting plasma occupies a small fraction of the BLR, likely the inner most part.
If the BLR is radiatively compressed as in the RPC model (Baskin et al., 2014), such that the lower ionization gas has higher density and all ionization states originate at the same distance, the UV and optical BLR should be denser than the present density measurements. For example,C+3 peaks at , 25 times lower than the our component. If they originate at the same distance, then the UV plasma is 25 times denser than the X-ray plasma, that is cm-3. The H distance similar to ours (Shemmer et al., 2003; Fausnaugh et al., 2017) would imply the optical plasma is at least an additional order of magnitude denser.
Using the common EM of the broad component and the high density component cm-3 (Table 3) associated with the BLR, and the density measured in the O lines for observation 0606321901, cm-3 (Table 2) we can estimate the volume of the BLR as . Assuming the X-ray BLR is an inner shell of the BLR, its scale length, is:
| (6) |
where we take the opening angle of the X-ray BLR to be and cm. This scale length stretches , indicating this is a thin shell. This scale length along with the same density yields a column density of cm-2, consistent with the X-ray BLR being a thin absorption shell.
We can further employ our measurements to estimate the total mass of the X-ray BLR:
| (7) |
where is the proton mass. The X-ray BLR is not a very massive component, only a tiny fraction of the black hole mass, . This low mass again indicates we are observing the thin inner shell of the BLR, as it is orders of magnitude less than previous mass estimates. The dust models of Czerny et al. (2015) for example estimate a Seyfert of M⊙.
From all these we associate both the broad and low ionization emission with the BLR. This means ionization ranges from in the optical to . A stratified BLR such as proposed by Costantini et al. (2007) is possible, but the matching EM of the broad, highly ionized component and the lower ionization component suggest at least these two are co-spatial.
The high density along with the small mass indicate that the X-ray BLR could possibly be photo-driven off the accretion disk (Proga et al., 2000), though other mechanisms such as MHD winds (Fukumura et al., 2010) are not ruled out. This makes ionized outflows observed at these distances a method for the AGN system to supply mass to the BLR.
7 Conclusion
We measure for the first time directly the density, distance, size, and mass of the BLR in X-rays. The distance and density are found to be in-line with those measured in the optical and UV wavelengths of the BLR, also matching kinematics. On the other hand, the mass estimate of the X-ray BLR is orders of magnitude less than those of the UV-optical BLR, indicating we may be seeing only a fraction, the inner part, of the BLR. To sum, the currently measured X-ray BLR parameters:
| –Distance : | cm. | |
|---|---|---|
| –Density : | cm-3. | |
| –Scale length : | cm. | |
| –Mass : | M | |
| –Ionization : | (optical to X-rays). | |
In terms of predicting mass ejection mechanisms from the accretion disk and the near-BH environment, considering the entire range from the event horizon at cm to the BLR at cm, for NGC 4051, may be important to better understand the feedback of the AGN system with the host galaxy.
References
- Asplund et al. (2009) Asplund, M., Grevesse, N., Sauval, A. J., & Scott, P. 2009, ARA&A, 47, 481
- Baldwin et al. (1995) Baldwin, J., Ferland, G., Korista, K., & Verner, D. 1995, ApJ, 455, L119
- Baskin et al. (2014) Baskin, A., Laor, A., & Stern, J. 2014, MNRAS, 445, 3025
- Blustin & Fabian (2009) Blustin, A. J. & Fabian, A. C. 2009, MNRAS, 399, L169
- Collinge et al. (2001) Collinge, M. J., Brandt, W. N., Kaspi, S., et al. 2001, ApJ, 557, 2
- Costantini et al. (2007) Costantini, E., Kaastra, J. S., Arav, N., et al. 2007, A&A, 461, 121
- Costantini et al. (2016) Costantini, E., Kriss, G., Kaastra, J. S., et al. 2016, A&A, 595, A106
- Czerny et al. (2015) Czerny, B., Modzelewska, J., Petrogalli, F., et al. 2015, Advances in Space Research, 55, 1806
- Fausnaugh et al. (2017) Fausnaugh, M. M., Grier, C. J., Bentz, M. C., et al. 2017, ApJ, 840, 97
- Fukumura et al. (2010) Fukumura, K., Kazanas, D., Contopoulos, I., & Behar, E. 2010, ApJ, 715, 636
- Kaastra et al. (2002) Kaastra, J. S., Steenbrugge, K. C., Raassen, A. J. J., et al. 2002, A&A, 386, 427
- Kraemer et al. (2012) Kraemer, S. B., Crenshaw, D. M., Dunn, J. P., et al. 2012, ApJ, 751, 84
- Lobban et al. (2011) Lobban, A. P., Reeves, J. N., Miller, L., et al. 2011, MNRAS, 414, 1965
- Maitra et al. (2011) Maitra, D., Miller, J. M., Markoff, S., & King, A. 2011, ApJ, 735, 107
- Mason et al. (2004) Mason, K. O., Branduardi-Raymont, G., Ogle, P. M., et al. 2004, Advances in Space Research, 34, 2610
- Miller et al. (2018) Miller, J. M., Cackett, E., Zoghbi, A., et al. 2018, ApJ, 865, 97
- Ogle et al. (2004) Ogle, P. M., Mason, K. O., Page, M. J., et al. 2004, ApJ, 606, 151
- Peterson et al. (2000) Peterson, B. M., McHardy, I. M., Wilkes, B. J., et al. 2000, ApJ, 542, 161
- Porquet & Dubau (2000) Porquet, D. & Dubau, J. 2000, A&AS, 143, 495
- Pounds et al. (2004) Pounds, K. A., Reeves, J. N., King, A. R., & Page, K. L. 2004, MNRAS, 350, 10
- Pounds & Vaughan (2011a) Pounds, K. A. & Vaughan, S. 2011a, MNRAS, 413, 1251
- Pounds & Vaughan (2011b) Pounds, K. A. & Vaughan, S. 2011b, MNRAS, 415, 2379
- Proga et al. (2000) Proga, D., Stone, J. M., & Kallman, T. R. 2000, ApJ, 543, 686
- Reichert et al. (1986) Reichert, G. A., Mushotzky, R. F., & Holt, S. S. 1986, ApJ, 303, 87
- Risaliti et al. (2011a) Risaliti, G., Nardini, E., Elvis, M., Brenneman, L., & Salvati, M. 2011a, MNRAS, 417, 178
- Risaliti et al. (2011b) Risaliti, G., Nardini, E., Salvati, M., et al. 2011b, MNRAS, 410, 1027
- Shemmer et al. (2003) Shemmer, O., Uttley, P., Netzer, H., & McHardy, I. M. 2003, MNRAS, 343, 1341
- Silva et al. (2016) Silva, C. V., Uttley, P., & Costantini, E. 2016, A&A, 596, A79
- Steenbrugge et al. (2009) Steenbrugge, K. C., Fenovčík, M., Kaastra, J. S., Costantini, E., & Verbunt, F. 2009, A&A, 496, 107
- Svoboda et al. (2015) Svoboda, J., Beuchert, T., Guainazzi, M., et al. 2015, A&A, 578, A96
- Uttley et al. (2004) Uttley, P., Taylor, R. D., McHardy, I. M., et al. 2004, Nuclear Physics B Proceedings Supplements, 132, 240