A Machine Learning-Based Detection Technique for Optical Fiber Nonlinearity Mitigation
Abstract
We investigate the performance of a machine learning classification technique, called the Parzen window, to mitigate the fiber nonlinearity in the context of dispersion managed and dispersion unmanaged systems. The technique is applied for detection at the receiver side, and deals with the non-Gaussian nonlinear effects by designing improved decision boundaries. We also propose a two-stage mitigation technique using digital back propagation and Parzen window for dispersion unmanaged systems. In this case, digital back propagation compensates for the deterministic nonlinearity and the Parzen window deals with the stochastic nonlinear signal-noise interactions, which are not taken into account by digital back propagation. A performance improvement up to dB in terms of Q factor is observed.
Index Terms:
digital back propagation, fiber nonlinearity mitigation, machine learning, optical communication systems, Parzen window.I Introduction
Fiber nonlinearity mitigation has been considered as a key technology to increase the optical system capacity. Several digital signal processing (DSP) techniques have been proposed to compensate for the nonlinear distortions in the optical link, as reviewed in [1]–[3]. Machine learning techniques have recently received significant attention as promising approaches to deal with such effects. These techniques have been applied as detectors at the receiver side [4]–[7], and also as channel model-based compensation algorithms [8]–[10].
Machine learning-based detectors provide two main advantages. Firstly, they can partially mitigate both deterministic fiber nonlinearities and stochastic nonlinear signal-amplified spontaneous emission (ASE) noise interactions. Secondly, they do not require the knowledge of the optical link parameters, which makes them well-suited for dynamic optical networks.
Multiple machine learning-based detectors have been proposed in the context of dispersion unmanaged (DUM) and dispersion managed (DM) systems, such as support vector machines (SVM) [4], K-means clustering [5], and the K-nearest neighbors algorithm [6]. The main idea of machine learning-based detectors is to design improved nonlinear decision boundaries more adapted to the nonlinear fiber channel. Thus, the nonlinear distortions such as nonlinear non-Gaussian noise can be mitigated.
In this letter, we propose a machine learning-based classification technique, known as the Parzen window (PW) classifier [11, 12], to mitigate the non-Gaussian nonlinear effects. The PW classifier is applied as a detector at the receiver side. We show that a performance improvement in terms of the factor is observed when applying the PW classifier to both DUM and DM systems.
Furthermore, we complement the PW classifier with digital back propagation (DBP) [13], and propose a two-stage fiber nonlinearity mitigation. DBP is used to compensate for the deterministic nonlinear effects. Then, the PW-based detector is applied to deal with the nonlinear non-Gaussian signal-ASE noise interactions. In DUM systems, the two-stage nonlinearity mitigation using DBP and the PW classifier increases the performance in comparison with DBP, used with the classic minimum distance (MD)-based detector.
II Parzen Window Principle
Machine learning techniques are widely investigated in the context of optical communication systems, as discussed in [14]–[16]. In particular, machine learning-based classification techniques have been proposed as detectors to deal with the nonlinear effects. In this context, we propose the PW, which is a machine learning nonparametric classification technique based on supervised learning. It is inherently a multi-class technique and can be applied for multi-level modulation formats without adaptation. This is unlike other proposed machine learning techniques, such as SVM [6], which is a binary classifier; multiple SVMs are required for the detection of high-order modulations. In addition, PW does not require an offline training process, like SVM and artificial neural networks.
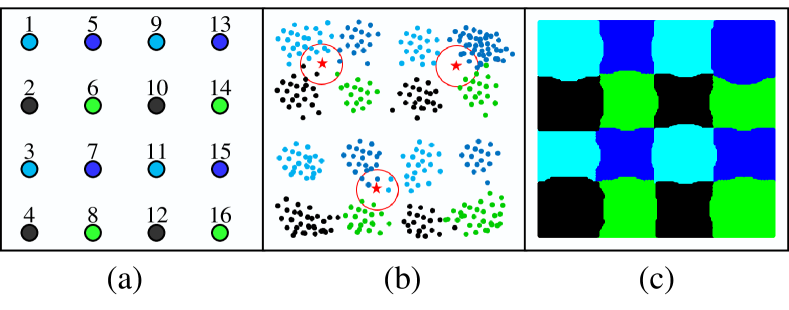
The main idea of PW is to associate a label to each symbol, and then classify it at the receiver based on labeled training data. The principle of the PW-based detection is depicted in Fig. 1, where -QAM is used as example, and the closest neighboring constellation points are represented using different colors. Fig. 1 (a) shows the transmitter side where the -QAM constellation points are labeled to clusters. We denote the label of each cluster by . At the beginning of the transmission, training symbols (and their corresponding labels ) with are generated. This training data is followed by testing data symbols . The symbols are transmitted over the optical channel. At the receiver side, for each received testing symbol , one Euclidean distance between and each received training symbol is calculated. Thus, for each , Euclidean distances denoted by , where are calculated.
The decision rule of the PW technique depends on two parameters: a window size and a window function . Both parameters should be optimized and adapted to the classification problem. Since the data is distributed in a 2-dimensional plane, a circle with radius centered around the testing symbol is employed as the window shape. This process is schematically shown in Fig. 1 (b), where three testing symbols (stars) are shown together with the labeled training symbols (colored dots). Furthermore, we use a kernelized window function, in which the closest training points to the testing data have the highest significance, namely,
| (1) |
where .
The last step in the classification process is to compute a metric for each possible transmitted symbol (cluster) . This metric is calculated by adding up all the contributions of in (1) for each training cluster, i.e.,
| (2) |
The estimated cluster is then the one with the largest metric, i.e., , and thus, the estimated symbol is , with . An example of decision regions generated by the PW-based detection is depicted in Fig. 1 (c).
The use of the inverse of the Euclidean distance as a weight for the window function improves the performance of the PW technique. It also avoids the particular case of having two clusters with the exact same metric . A similar idea was considered in [6], by using square Euclidean distances.
III Simulation Setup and Results
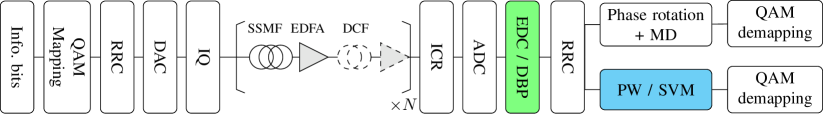
The performance of the PW classifier is investigated by numerical simulation. In this simulation, we consider a single-channel dual-polarization configuration. We focus on the intra-channel fiber nonlinear effect and neglect the stochastic laser phase noise and polarization mode dispersion. The simulation setup is shown in Fig. 2. We compare the performance of the PW-based detector in combating the fiber nonlinearity with MD and SVM-based detections.
We consider -QAM and -QAM DM and DUM systems, in which the total bit rate is Gbps. For the DUM system, the transmission link consists of multi-span standard single mode fiber (SSMF) with an attenuation coefficient , a dispersion parameter , and a nonlinear coefficient . An erbium-doped fiber amplifier (EDFA) with a dB noise figure and dB gain is used at each span of km. When a DM system is considered, an additional EDFA and a dispersion-compensated fiber, with full chromatic dispersion (CD) compensation, are deployed at each span. A root-raised cosine (RRC) filter with a roll-off factor is employed for spectrum shaping and the analog-to-digital converter (ADC) works at twice the symbol rate. symbols are used as training symbols for -QAM modulation and symbols in case of -QAM modulation. symbols are used as testing data.
The DSP at the receiver consists of CD compensation, and deterministic fiber nonlinearity mitigation via DBP (if used). After that, an RRC matched filter is applied. Finally, PW-based detection is performed before QAM demapping and error counting. When applying the PW classifier, the phase rotation compensation is not required because the signal detection is based on the labeled training symbols. However, the phase compensation is carried out by using training sequence for the minimum distance-based detection.
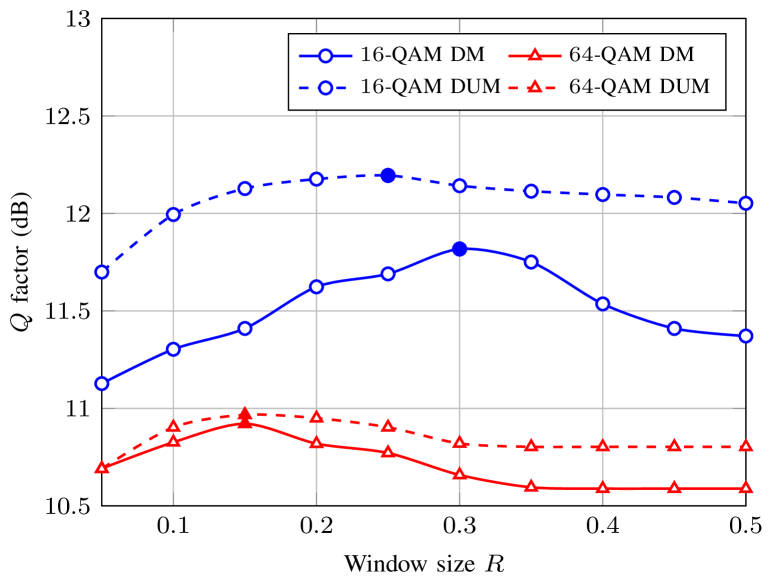
The performance of the PW depends on the window size , which should be optimized based on the transmission parameters, such as the input power and the transmission distance. For example, in Fig. 3, we plot the factor, calculated as in [3], versus the PW size for -QAM at km transmission distance, and -QAM at km, at optimal input power and for both DM and DUM systems. The optimal window sizes are and for -QAM and -QAM DM system, and and for -QAM and -QAM DUM system, respectively.
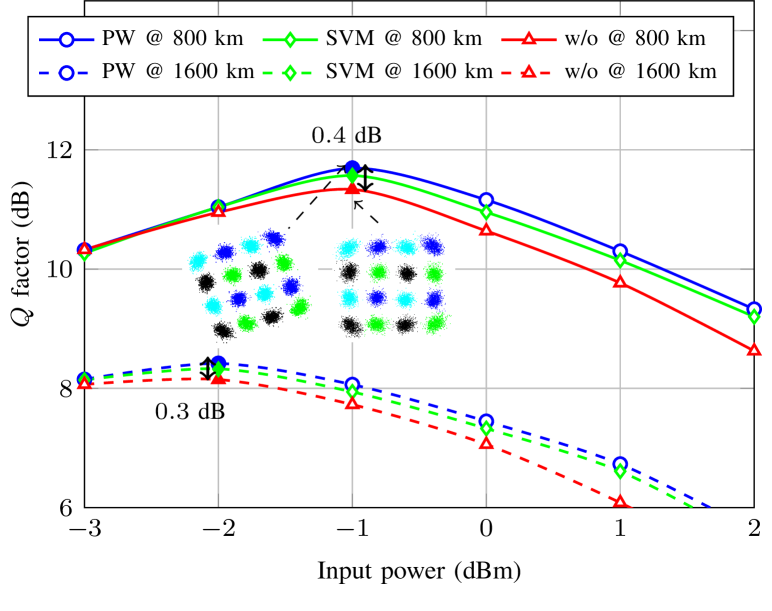
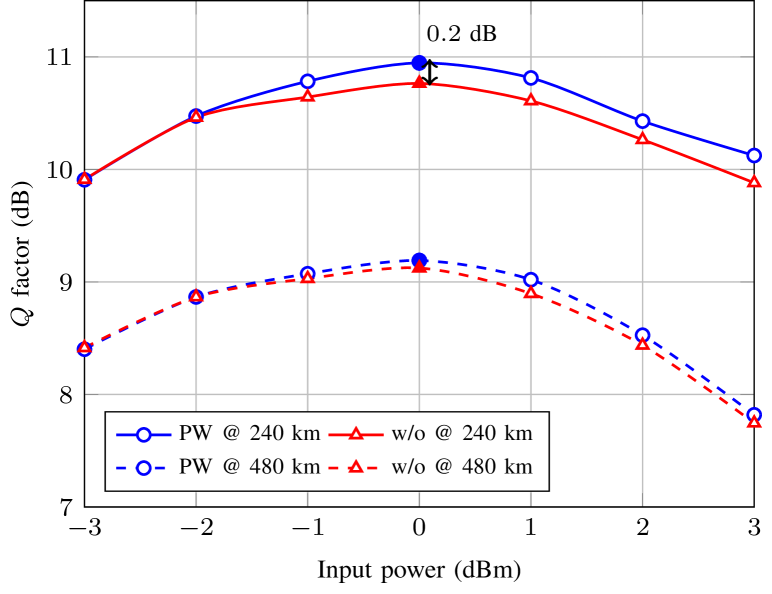
We firstly focus on the performance evaluation of the PW-based detector in the DM system. Fig. 4 shows the factor versus the input power for -QAM at km and km. We compare the performance of the PW with MD preceded by phase compensation, referred to as (w/o) in the figure, and SVM. At optimal input powers, the PW technique improves the performance by about dB and dB in comparison with MD for km and km, respectively. A Q factor increase of about dB is observed when compared to SVM. symbols are used in the training process of the SVM to determine the model parameters, which is the same as the number of training symbols for PW. Increasing the number of training symbols for both PW and SVM can increase the performance, but results in higher complexity of the algorithms.
In Fig. 4, we also show the constellation diagrams of the detected symbols at optimum input power dBm for PW and MD at km. These constellation plots emphasize that machine learning techniques, and in particular PW, can detect the signal without the need of phase rotation compensation. This is due to the design of new decision boundaries depending only on the training symbols.
In Fig. 5, we plot the factor performances for -QAM at km and km. At optimal input power, the PW-based detector increases the performance in comparison with the MD-based detector, by about dB and dB for km and km, respectively. In the linear regime, PW-based detector provides similar performance to the MD-based detector, while a significant improvement is observed in the nonlinear regime, due to the increased nonlinear non-Gaussian noise.
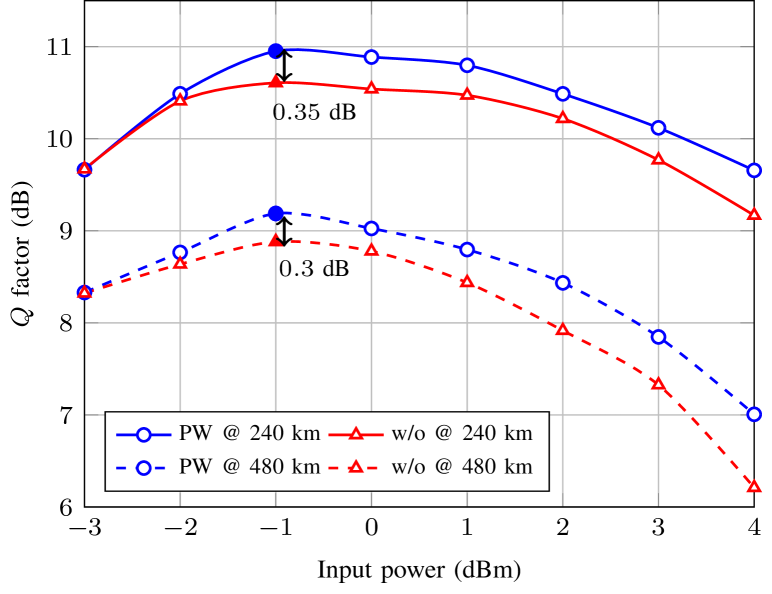
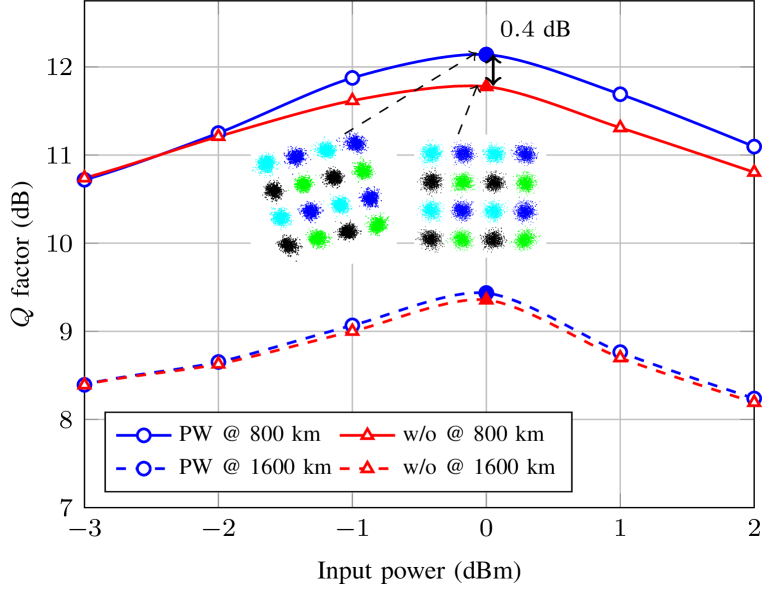
We now turn our attention to the DUM system. In Fig. 6 and Fig. 7, a Q factor increase of about dB and dB is observed for -QAM at km and -QAM at km, respectively, in comparison with MD. At high transmission distance, PW exhibits limited improvement in comparison to the MD-based detector. This is because PW efficiently mitigates the nonlinear non-Gaussian noise by designing improved decision boundaries more adapted to the nonlinear fiber channel. However, for uncompensated DUM system and at high transmission distance, the fiber nonlinearities behave like Gaussian noise, and are effectively modeled by the so-called Gaussian noise and enhanced Gaussian noise models [17, 18]. In this case, PW, and in general machine learning-based detectors, show limited performance improvement in comparison with the classic MD-based detector, which is the optimal detection technique for a channel with Gaussian noise.
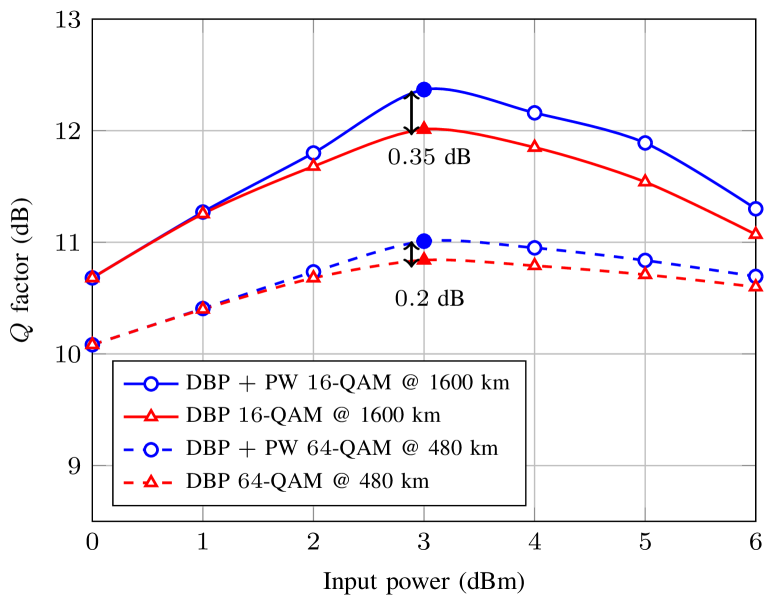
In the following, we propose a two-stage fiber nonlinearity mitigation. Firstly, DBP is applied to compensate for the deterministic nonlinear effects. Then, PW-based detection is performed to deal with the stochastic nonlinearity due to signal-ASE noise interactions. As shown in Fig. 8, for -QAM at km and -QAM at km, the two-stage compensation scheme using DBP and PW increases the performance with about dB and dB, respectively, when compared to DBP with MD detection. This confirms that the proposed PW technique also mitigates the nondeterministic nonlinear effects due to signal-noise interactions.
IV Conclusion
We have proposed to use the Parzen window (PW) classifier as a detection technique to deal with the nonlinear non-Gaussian noise in both DM and DUM systems for different QAM modulations. Performance improvement in terms of the factor is observed in DM systems and short reach DUM systems. This increase in performance is obtained without the need of phase rotation compensation because the detection relies on only the training data. We have also introduced a two-stage compensation using DBP and PW, which shows that PW can mitigate the stochastic nonlinear signal-ASE noise interactions, as well. An experimental validation of PW-based detector is left for future work.
References
- [1] R. Dar and P. J. Winzer, “Nonlinear interference mitigation: Methods and potential gain,” J. Lightw. Technol., vol. 35, no. 4, pp. 903-930, Feb. 2017.
- [2] P. Bayvel et al., “Maximizing the optical network capacity,” Philosoph. Trans. Roy. Soc., vol. 374, no. 2062, Jan. 2016, Art. no. 20140440.
- [3] A. Amari et al., “A survey on fiber nonlinearity compensation for 400 Gb/s and beyond optical communication systems,” IEEE Commun. Surveys Tuts., vol. 19, no. 4, pp. 3097-3113, 4th Quart., 2017.
- [4] M. Li, S. Yu, J. Yang, Z. Chen, Y. Han, and W. Gu, “Nonparameter nonlinear phase noise mitigation by using m-ary support vector machine for coherent optical systems,” IEEE Photonics J., vol. 5, no. 6, Dec. 2013.
- [5] J. Zhang, W. Chen, M. Gao, and G. Shen, “K-means-clustering-based fiber nonlinearity equalization techniques for 64-QAM coherent optical communication system,” Opt. Express, vol. 25, no. 22, pp. 27570-27580, Oct. 2017.
- [6] D. Wang et al., “Nonlinearity mitigation using a machine learning detector based on k-nearest neighbors,” IEEE Photon. Technol. Lett., vol. 28, no. 19, pp. 2102-2105, Oct. 2016.
- [7] E. Giacoumidis et al. “Blind nonlinearity equalization by machine-learning-based clustering for single- and multichannel coherent optical OFDM,” J. Lightwave Technol., vol. 36, no. 3, pp. 721-727, Feb. 2018
- [8] C. Häger and H. D. Pfister, “Deep learning of the nonlinear Schrodinger equation in fiber-optic communications”, arXiv:1804.02799[cs.IT] (2018).
- [9] M. A. Jarajreh et al., “Artificial neural network nonlinear equalizer for coherent optical OFDM,” IEEE Photon. Technol. Lett., vol. 27, no. 4, pp. 387-390, Feb. 2015.
- [10] M. Sorokina, S. Sygletos, and S. Turitsyn, “Sparse identification for nonlinear optical communication systems: SINO method,” Opt. Express, vol. 24, no. 26, pp. 30433-30443, Dec. 2016.
- [11] R. O. Duda, P. E. Hart, and D. G. Stork, Pattern Classification, Wiley-Interscience, 2000.
- [12] S. J. Raudys et al., “Small sample size effects in statistical pattern recognition: recommendations for practitioners,” IEEE Trans. Pattern Anal. Mach. Intell., vol 13, no. 3, pp. 252-264, Mar. 1991.
- [13] E. Ip and J. M. Kahn, “Compensation of dispersion and nonlinear impairments using digital back propagation,” J. Lightwave Technol., vol. 26, no. 20, pp.3416-3425, Oct. 2008.
- [14] D. Zibar, M. Piels, R. Jones, and C. G. Schaeffer, “Machine learning techniques in optical communication,” J. Lightw. Technol., vol. 34, no. 6, pp. 1442-1452, Mar. 2016.
- [15] F. Musumeci, et al., “A survey on application of machine learning techniques in optical networks,” arXiv:1803.07976v3 [cs.NI] (2018).
- [16] D. Rafique and L. Velasco, “Machine learning for network automation: overview, architecture, and applications [invited tutorial],” J. Opt. Commun. Netw., vol. 10, no. 10, pp. D126–D143, Oct. 2018.
- [17] P. Poggiolini, “The GN model of non-linear propagation in uncompensated coherent optical systems,” J. Lightw. Technol., vol. 30, no. 24, pp. 3857-3879, Dec. 2012.
- [18] A. Carena, et al., “EGN model of non-linear fiber propagation,” Opt. Express, vol. 22, no. 13, pp. 16335-16362, Jun. 2014.