The Milky Way’s Halo and Subhalos in Self-Interacting Dark Matter
Abstract
We perform high-resolution simulations of a MW-like galaxy in a self-interacting cold dark matter model with elastic cross section over mass of (SIDM) and compare to a model without self-interactions (CDM). We run our simulations with and without a time-dependent embedded potential to capture effects of the baryonic disk and bulge contributions. The CDM and SIDM simulations with the embedded baryonic potential exhibit remarkably similar host halo profiles, subhalo abundances and radial distributions within the virial radius. The SIDM host halo is denser in the center than the CDM host and has no discernible core, in sharp contrast to the case without the baryonic potential (core size ). The most massive subhalos (with ) in our SIDM simulations, expected to host the classical satellite galaxies, have density profiles that are less dense than their CDM analogs at radii less than 500 pc but the deviation diminishes for less massive subhalos. With the baryonic potential included in the CDM and SIDM simulations, the most massive subhalos do not display the too-big-to-fail problem. However, the least dense among the massive subhalos in both these simulations tend to have the smallest pericenter values, a trend that is not apparent among the bright MW satellite galaxies.
keywords:
cosmology: dark matter – galaxies: halos – MW1 Introduction
Self-interacting dark matter is a well-motivated idea that arises generically in hidden sector dark matter models (Spergel & Steinhardt, 2000; Kaplinghat, Tulin & Yu, 2016; Tulin & Yu, 2018). It naturally retains all the successes of the cold dark matter model on large scales (Springel, Frenk & M. (2006); Trujillo-Gomez et al. (2011); Vogelsberger et al. (2014a)), while modifying the dark matter halo density profiles within 5 to 10% of the virial radius (Davé et al., 2001; Vogelsberger, Zavala & Loeb, 2012; Rocha et al., 2013; Peter et al., 2013; Zavala, Vogelsberger & Walker, 2013; Elbert et al., 2015; Vogelsberger et al., 2014b; Fry et al., 2015; Robertson, Massey & Eke, 2017; Robles et al., 2017).
These modifications to the halo density profile are in agreement with the diverse shapes of galactic rotation curves (Ren et al., 2018; Oman et al., 2015; Kamada et al., 2017; Creasey et al., 2017) for cross section over mass, , in the range of . They also alleviate the too-big-to-fail problem in the Milky Way, Andromeda and the Local Group (Boylan-Kolchin, Bullock & Kaplinghat, 2011, 2012; Tollerud, Boylan-Kolchin & Bullock, 2014; Kirby et al., 2014; Garrison-Kimmel et al., 2014; Papastergis et al., 2015; Papastergis & Shankar, 2016).
Previous works have explored MW host properties and its response to baryons using a static potential for the baryons (Elbert et al., 2018; Sameie et al., 2018). Di Cintio et al. (2017) performed SIDM hydrodynamical simulations to study the impact of super massive black holes, stars and gas on a MW-mass halo at redshift , for . Their DM simulation particle mass was , but a study of structural changes in low-mass halos requires even higher resolution, both in CDM (Fitts et al., 2017) and SIDM (Robles et al., 2017).
In this letter we simulate CDM and SIDM MW-mass halos with an embedded time-dependent galaxy potential. We discuss the structural changes in the host and subhalo density profiles, and the implications for subhalo mass function and radial distribution. The SIDM model we simulate has ; our predictions should not be extrapolated to larger cross sections where the core sizes could be different (larger and smaller) because of the possibility of core collapse and the non-linear coupling between thermalization and tidal effects.
The use of the baryonic potential overcomes the high computational cost that is required to resolve the structure of subhalos likely to host dwarfs with stellar masses of (Zolotov et al., 2012; Sawala et al., 2016; Wetzel et al., 2016; Garrison-Kimmel et al., 2018). Garrison-Kimmel et al. (2017) show that embedding a time-dependent galaxy potential at the center of a high resolution MW-mass DMO simulation yields substructure populations in good agreement with fully hydrodynamical simulations of comparable resolution, but at substantially less CPU cost.
We describe our simulations in section 2, section 3 describes the host dark matter density profile, sections 4 and 5 discuss the radial distribution and density profiles of the subhalos, in section 6 we explain the key features of the density profiles using an analytic model, in section 7 we discuss the orbits of the satellites and we conclude in section 8.
2 Simulations
We simulate 4 cosmological MW-mass halos: CDM DMO, CDM+disk111We will refer to the simulations that have an embedded baryonic potential as ‘disk’ simulations for simplicity, however, these simulations also include a bulge component., SIDM DMO and SIDM+disk, all of them evolve in a Planck cosmology (Planck Collaboration, 2015), with , , and . We apply the ‘zoom-in’ technique (Katz & White, 1993; Oñorbe et al., 2014) to simulate a high-resolution region (with dark matter particle mass and physical Plummer equivalent softening ) of the same cosmological volume of a box length of 50 such that the region contains a single MW-mass halo () within from the selected halo at z=0.
We run all simulations using the code GIZMO (Hopkins, 2015)222http://www.tapir.caltech.edu/ phopkins/Site/GIZMO.html, we identify halos using Rockstar (Behroozi, Wechsler & Wu, 2013) and use the halo catalogs that we build from the merger trees using consistent-trees (Behroozi et al., 2013), all initial conditions were generated at using MUSIC (Hahn & Abel, 2011) with second-order Lagrangian perturbation theory. In the CDM+disk and SIDM+disk simulations, we include a baryonic disk following the same procedure described in Kelley et al. (2018) to generate initial conditions starting at from the DMO simulations. As in Kelley et al. (2018), our disks are composed of two components, gas and stellar, we additionally include a bulge component modeled by a Hernquist sphere (Hernquist, 1990) with constant bulge-to-disk mass ratio set by present values, all the baryonic components are chosen to agree with MW observations.
The stellar disk mass and disk size increase with time in the CDM+disk and SIDM+disk runs, the disk mass begins to grow at at the same rate as the halo mass following the abundance matching relation (Behroozi, Wechsler & Conroy, 2013).
The MW baryonic gas and stellar disks are modeled as exponential disks. In the simulations we achieve this, for each component, by using three overlapping Miyamoto & Nagai (1975) potentials that yield an effective exponential disk (Smith et al., 2015). The exponential radial and vertical scale lengths and total masses at z=0 of the stellar and gas disks are , , and , , , in agreement with current constraints (Bland-Hawthorn & Gerhard, 2016). The bulge mass and scale radius at are and .
The dark matter self-interaction implementation is the same as the one used in Rocha et al. (2013); Robles et al. (2017), i.e., we assume identical dark-matter particles undergoing isotropic, velocity-independent, elastic, hard-sphere scattering with a cross section . Our SIDM runs assume to maximize any difference with CDM while remaining in the range of current constraints (Kaplinghat, Tulin & Yu, 2016).


3 Density profile of the Milky Way halo
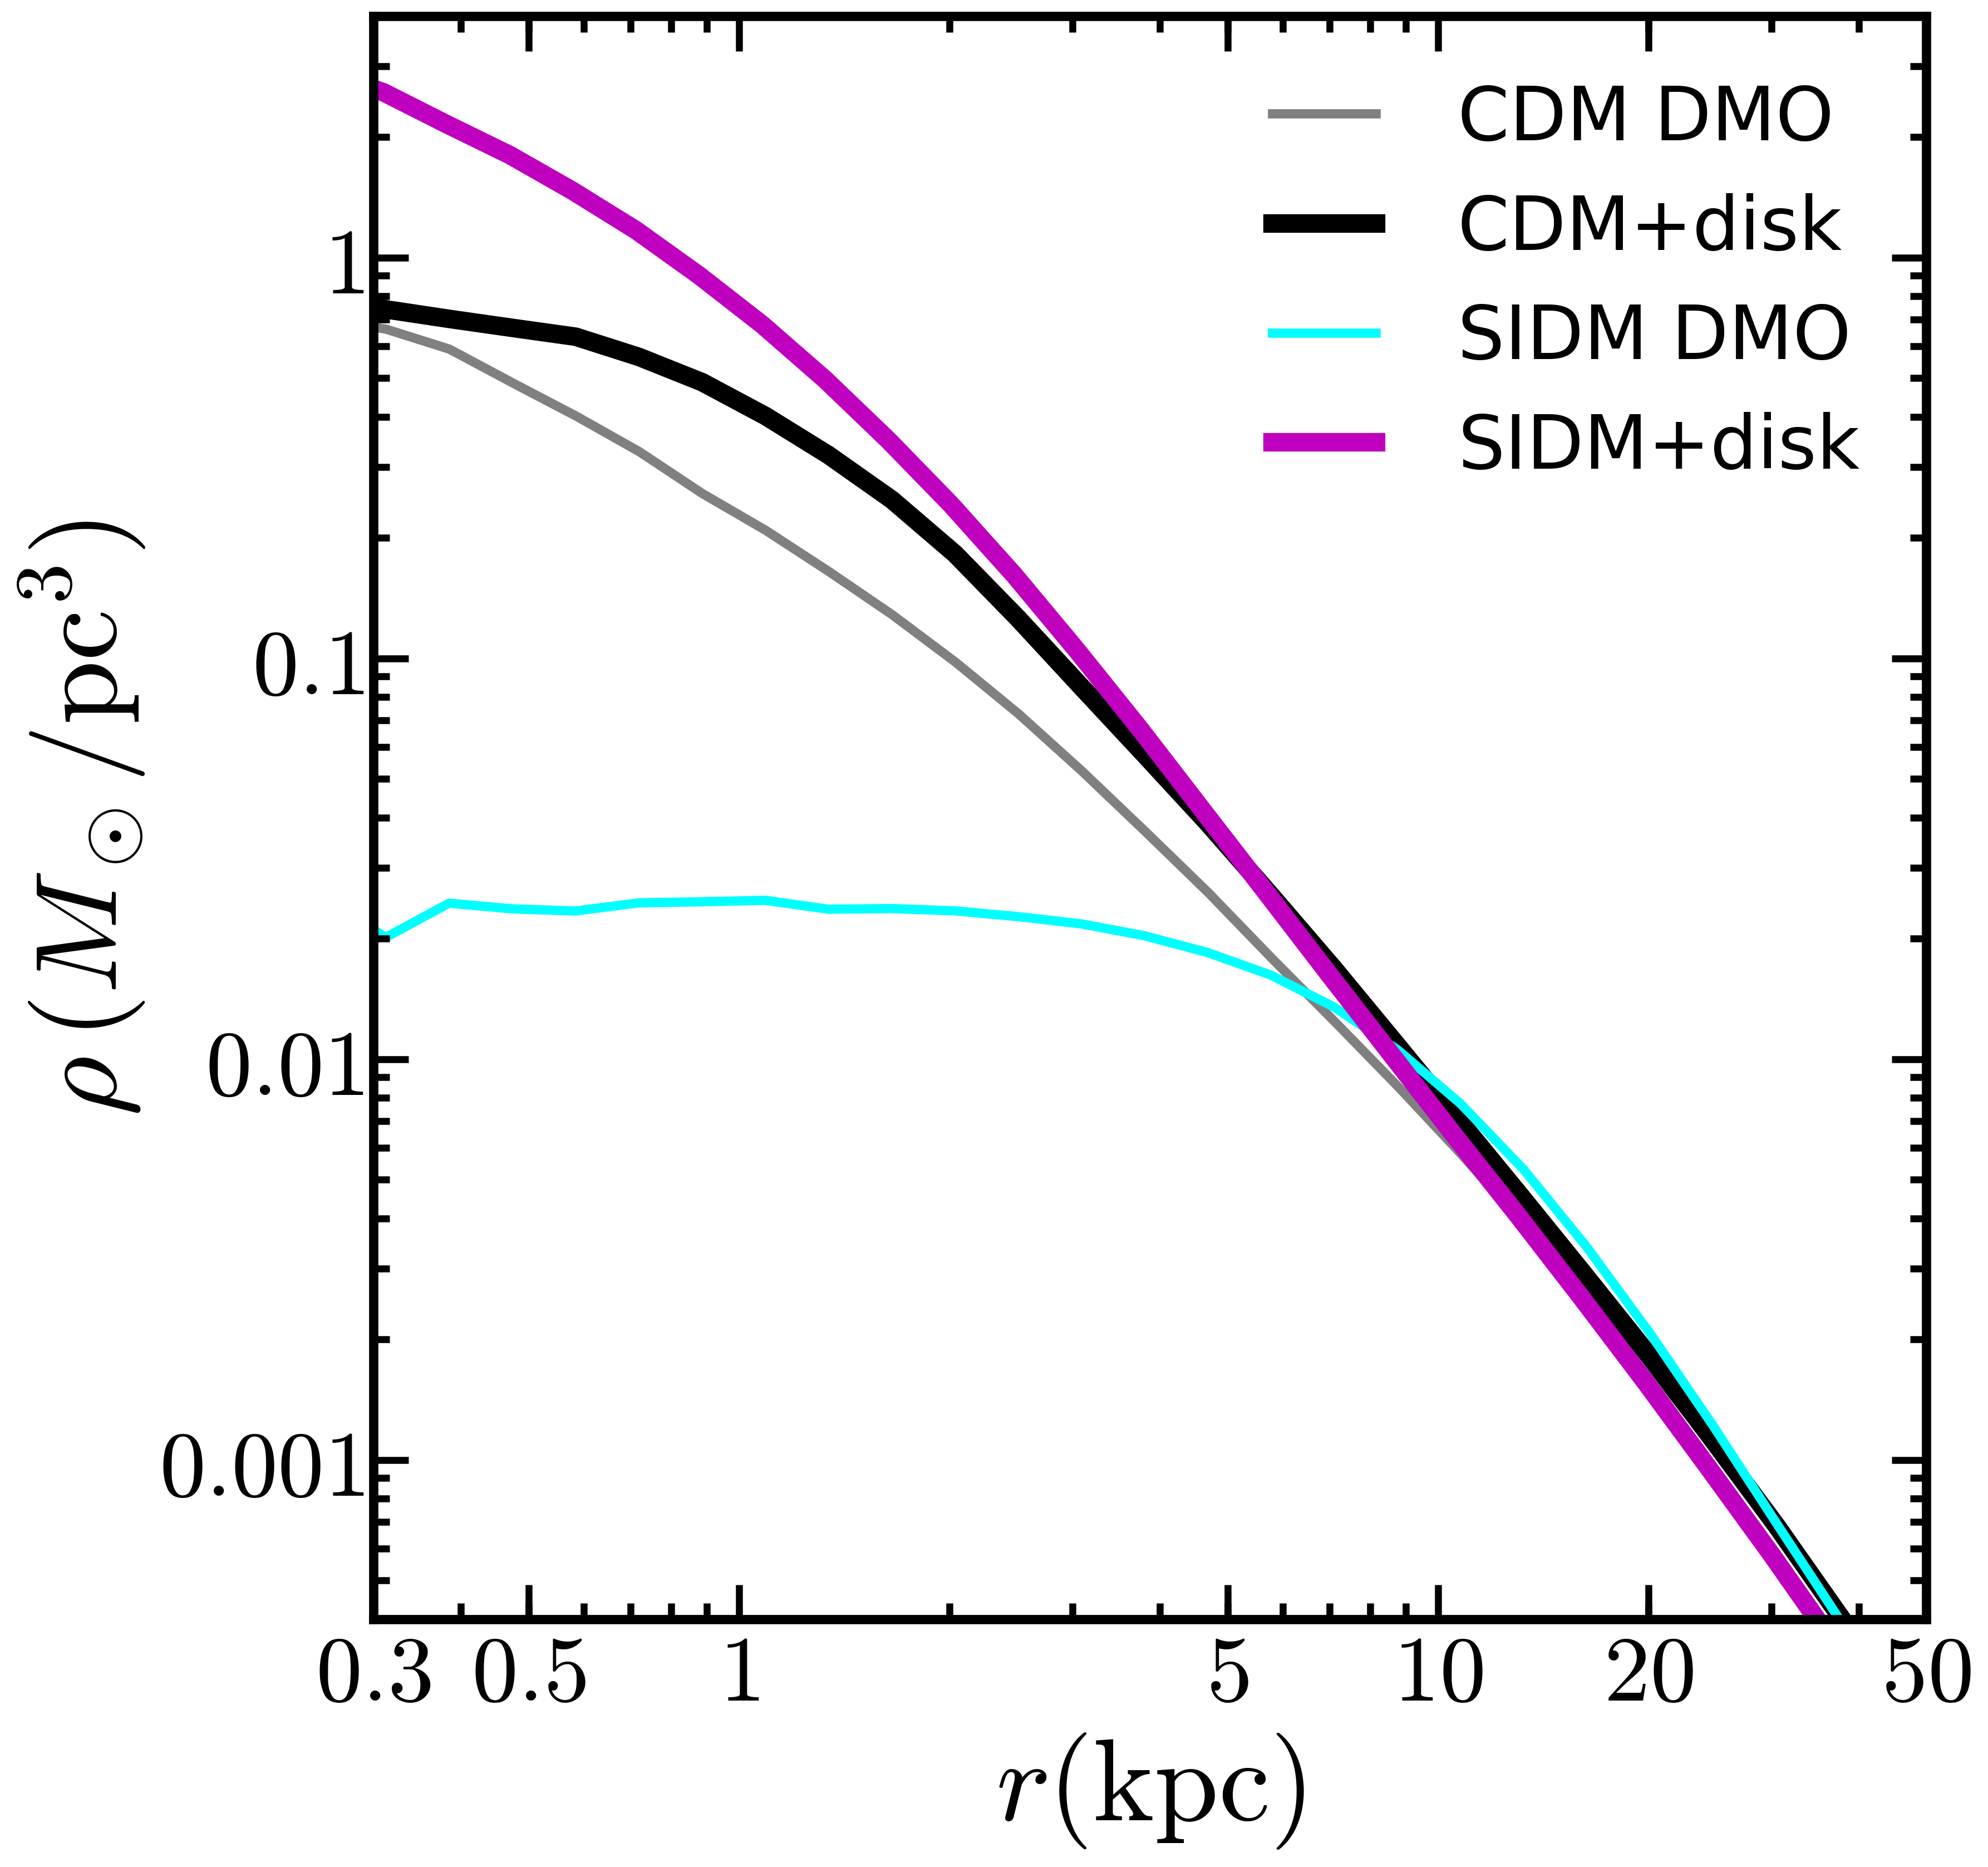
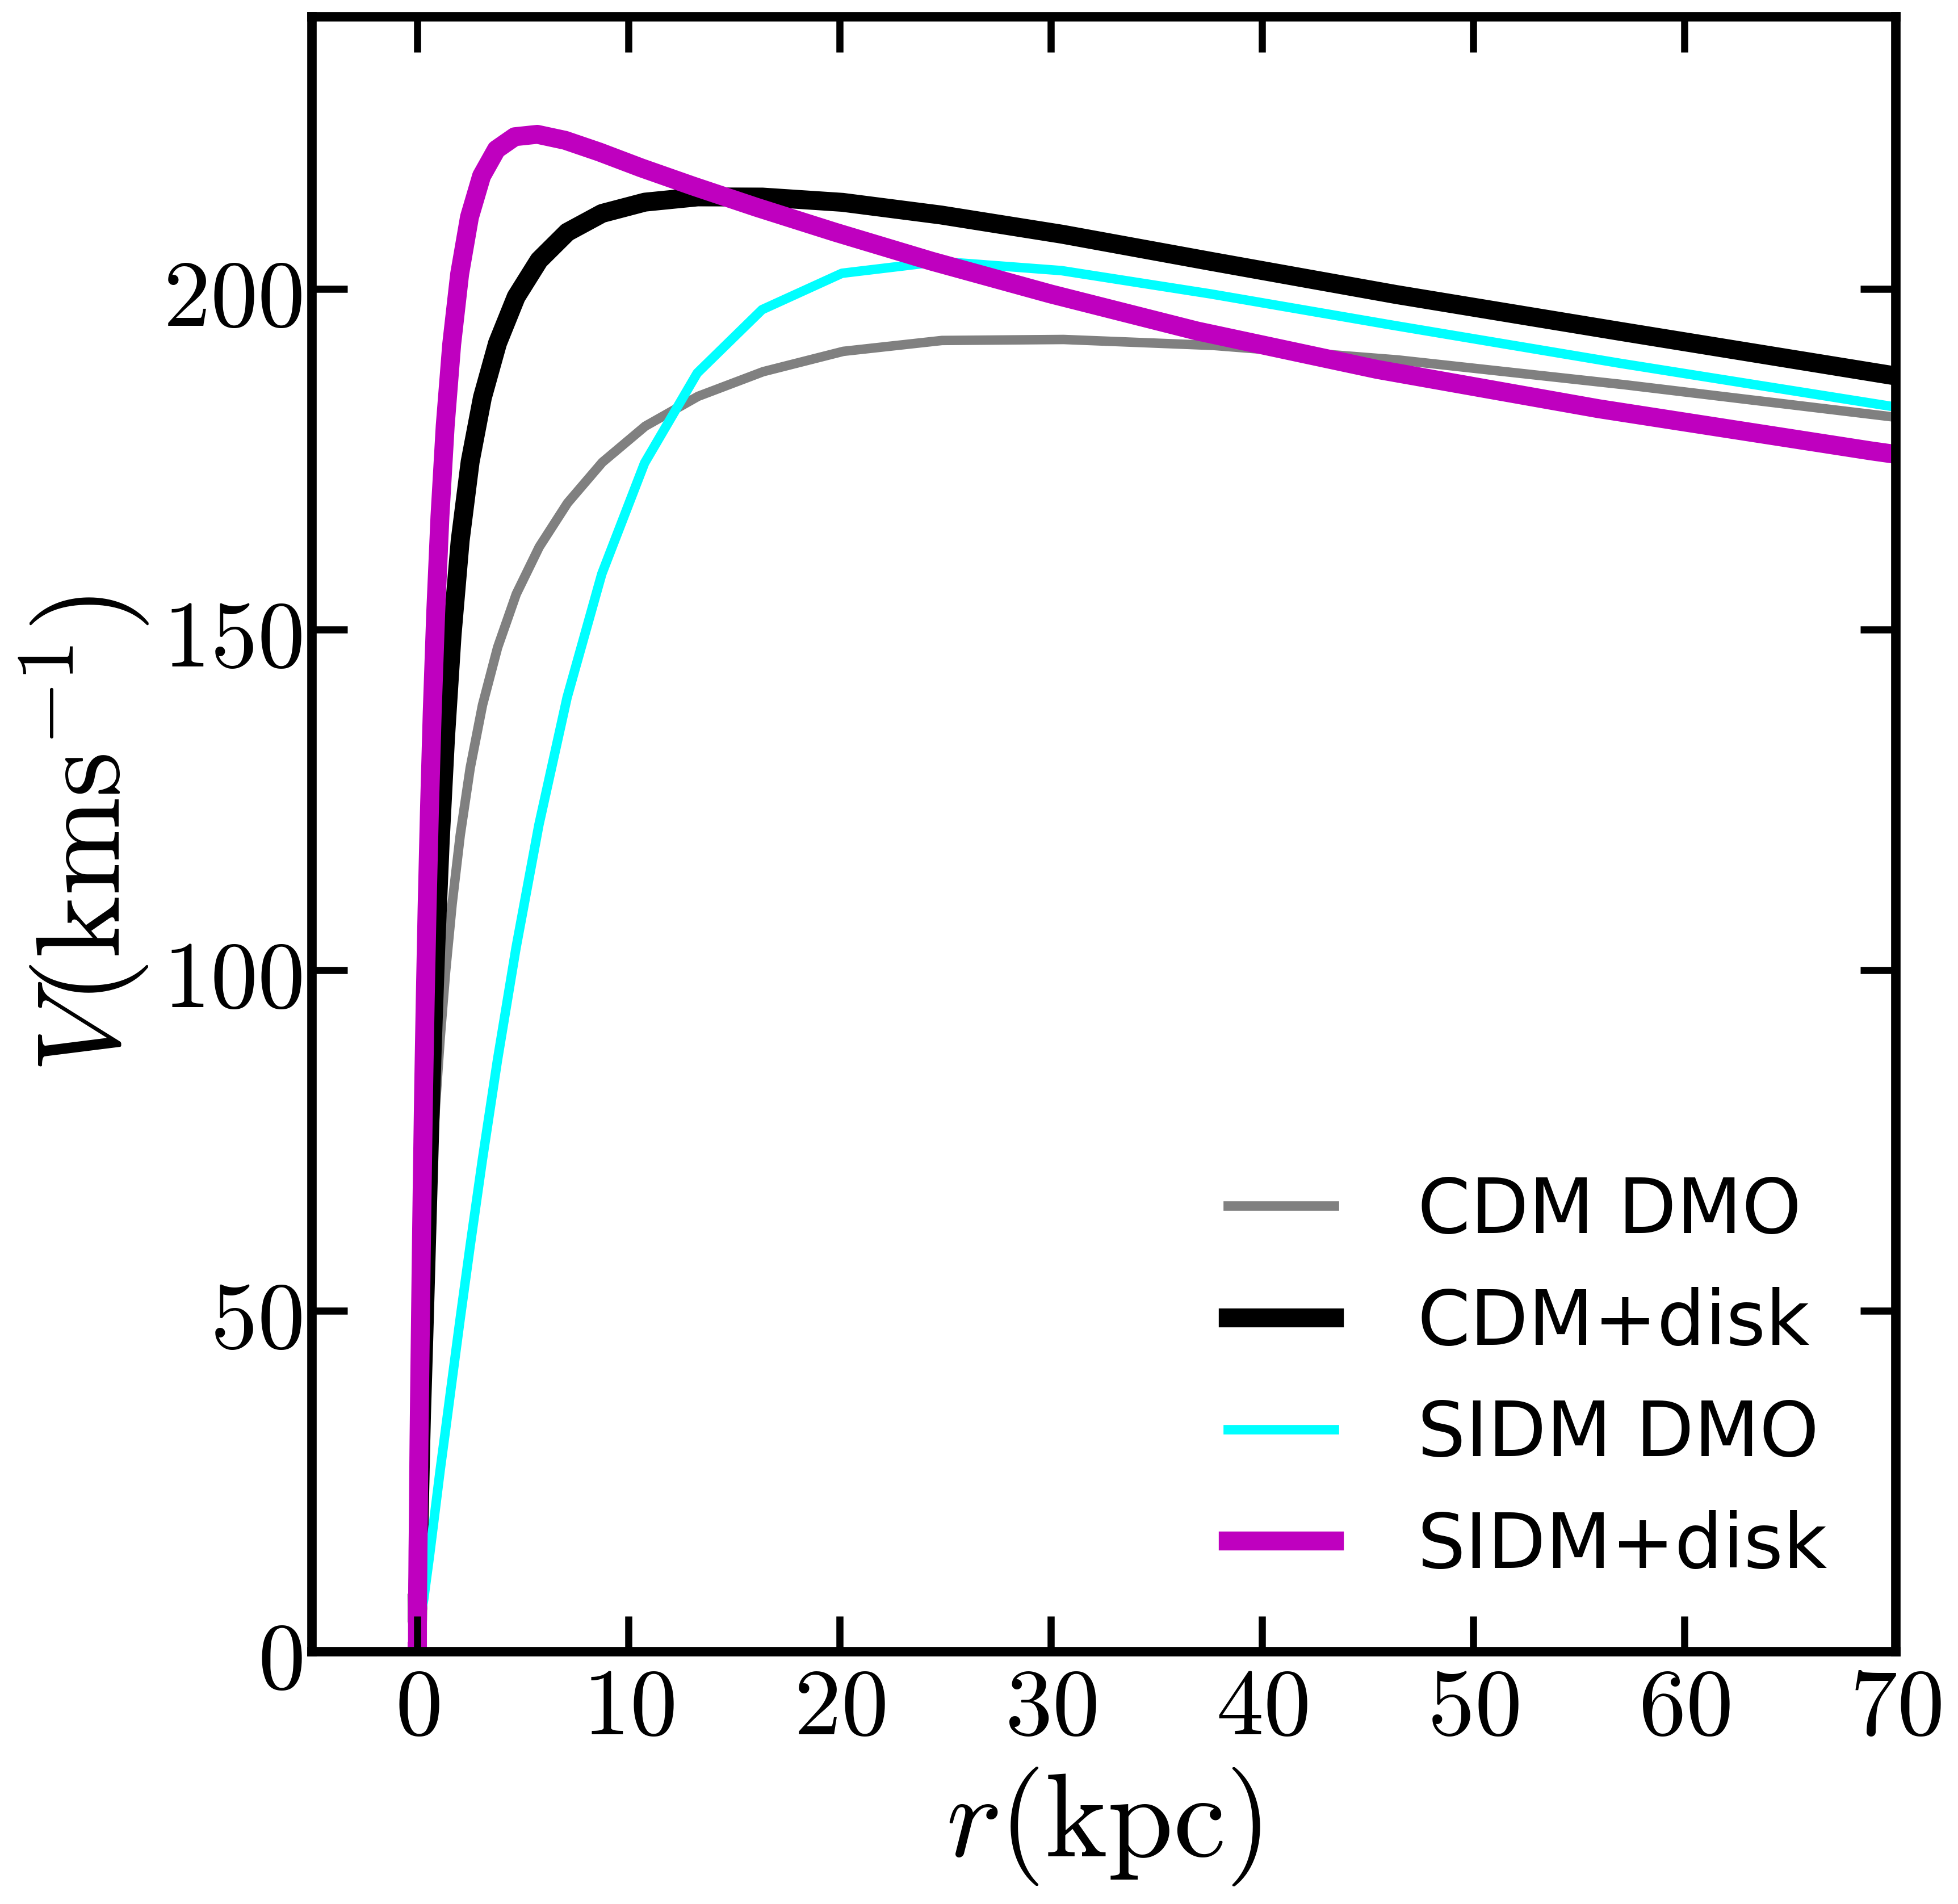
In the absence of baryons, self-interactions (SI) form a core in the Milky-Way mass halo (Figure 1), and its inner halo density is an order of magnitude smaller than the CDM DMO host density at kpc. However, we find that SIDM has no inner core and it is actually times denser within kpc than CDM (and a factor of denser than CDM DMO) when the baryonic potential is included. This was predicted by Kaplinghat et al. (2014) and is a consequence of thermalization in the presence of the baryonic gravitational potential.
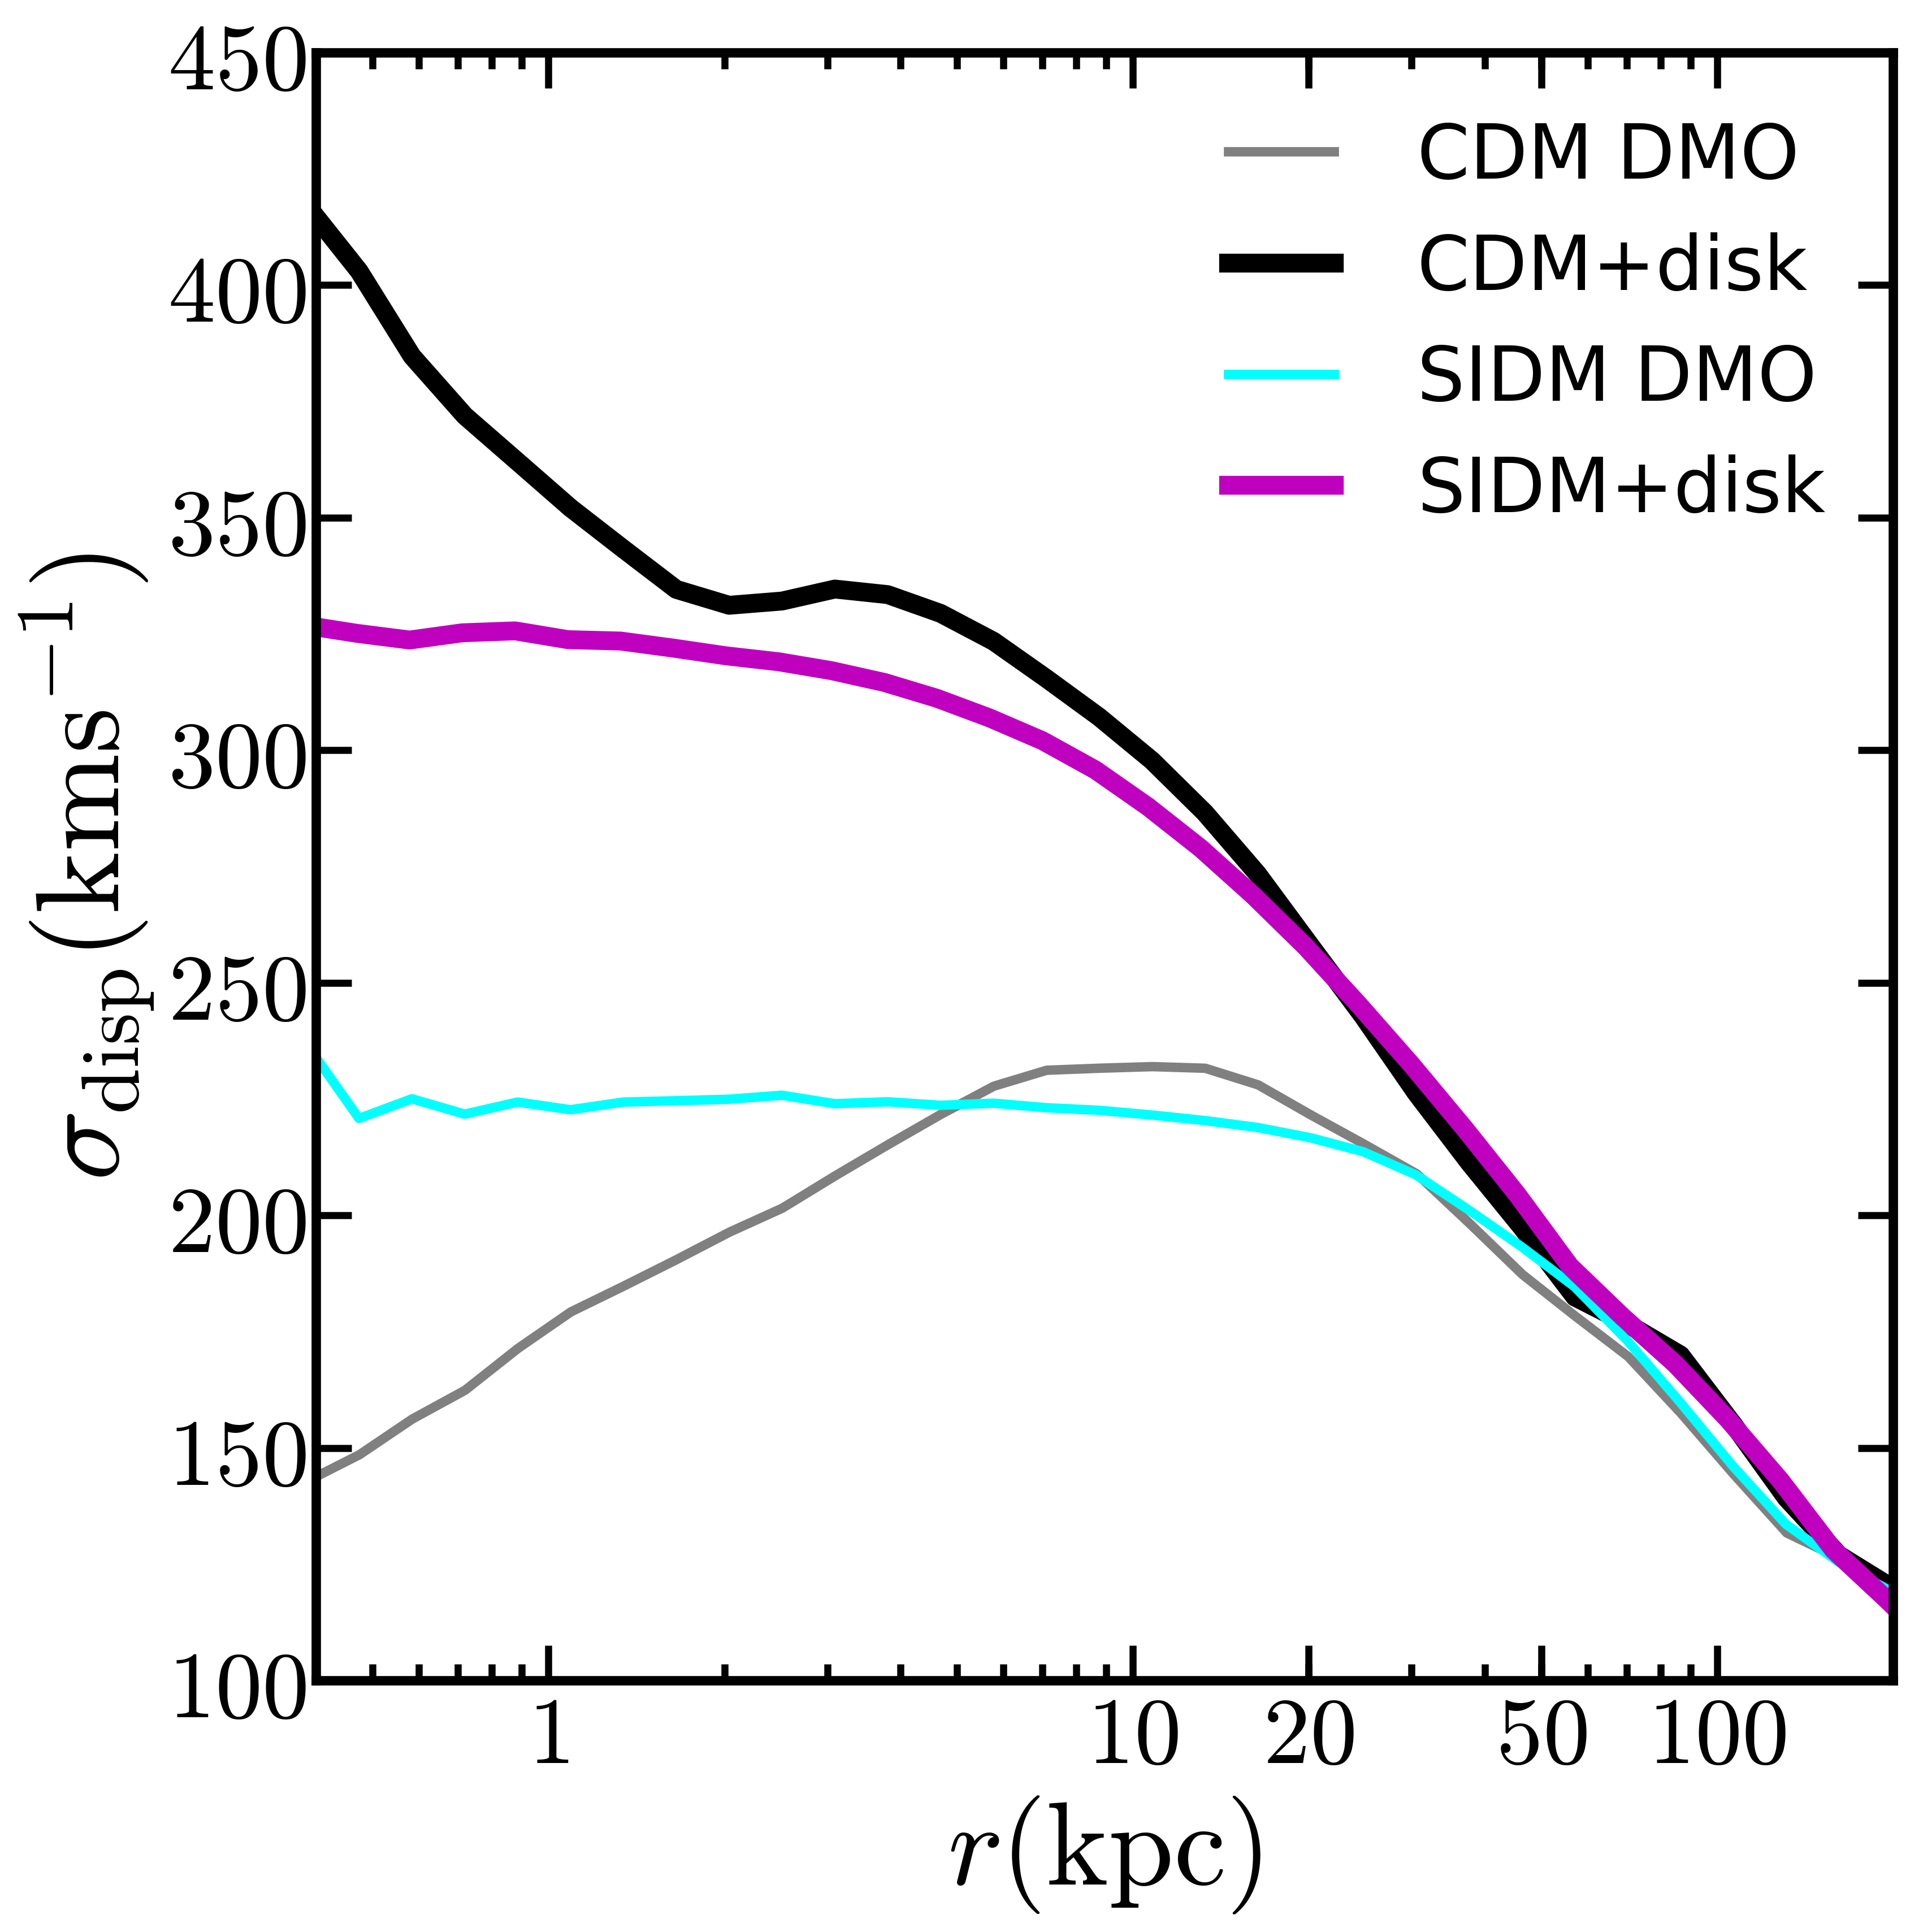
The response to the baryonic potential is shown in Fig. 1. The contraction leads to a higher rotation velocity maximum in SIDM, but the changes are too small to a detectable difference given the uncertainties in the concentration of the halo, modeling the baryons and inferring the rotation curve in the inner parts. The velocity dispersion, , shows a larger variation between the two DM models. For SIDM+disk, rises mildly within , and this negative temperature gradient leads to outward heat flow and an increasing central density (gravothermal collapse), which has been noted before (Elbert et al., 2018). Notably, we find CDM has a stronger response to the stellar contribution than SIDM; we find that the cold center observed without baryons (CDM DMO) has been dynamically heated by the presence of the stellar potential and there is a steep upturn in its velocity dispersion at . It would be interesting to compare this expectation to a full hydrodynamical CDM simulation.
4 Mass function and radial distribution of subhalos
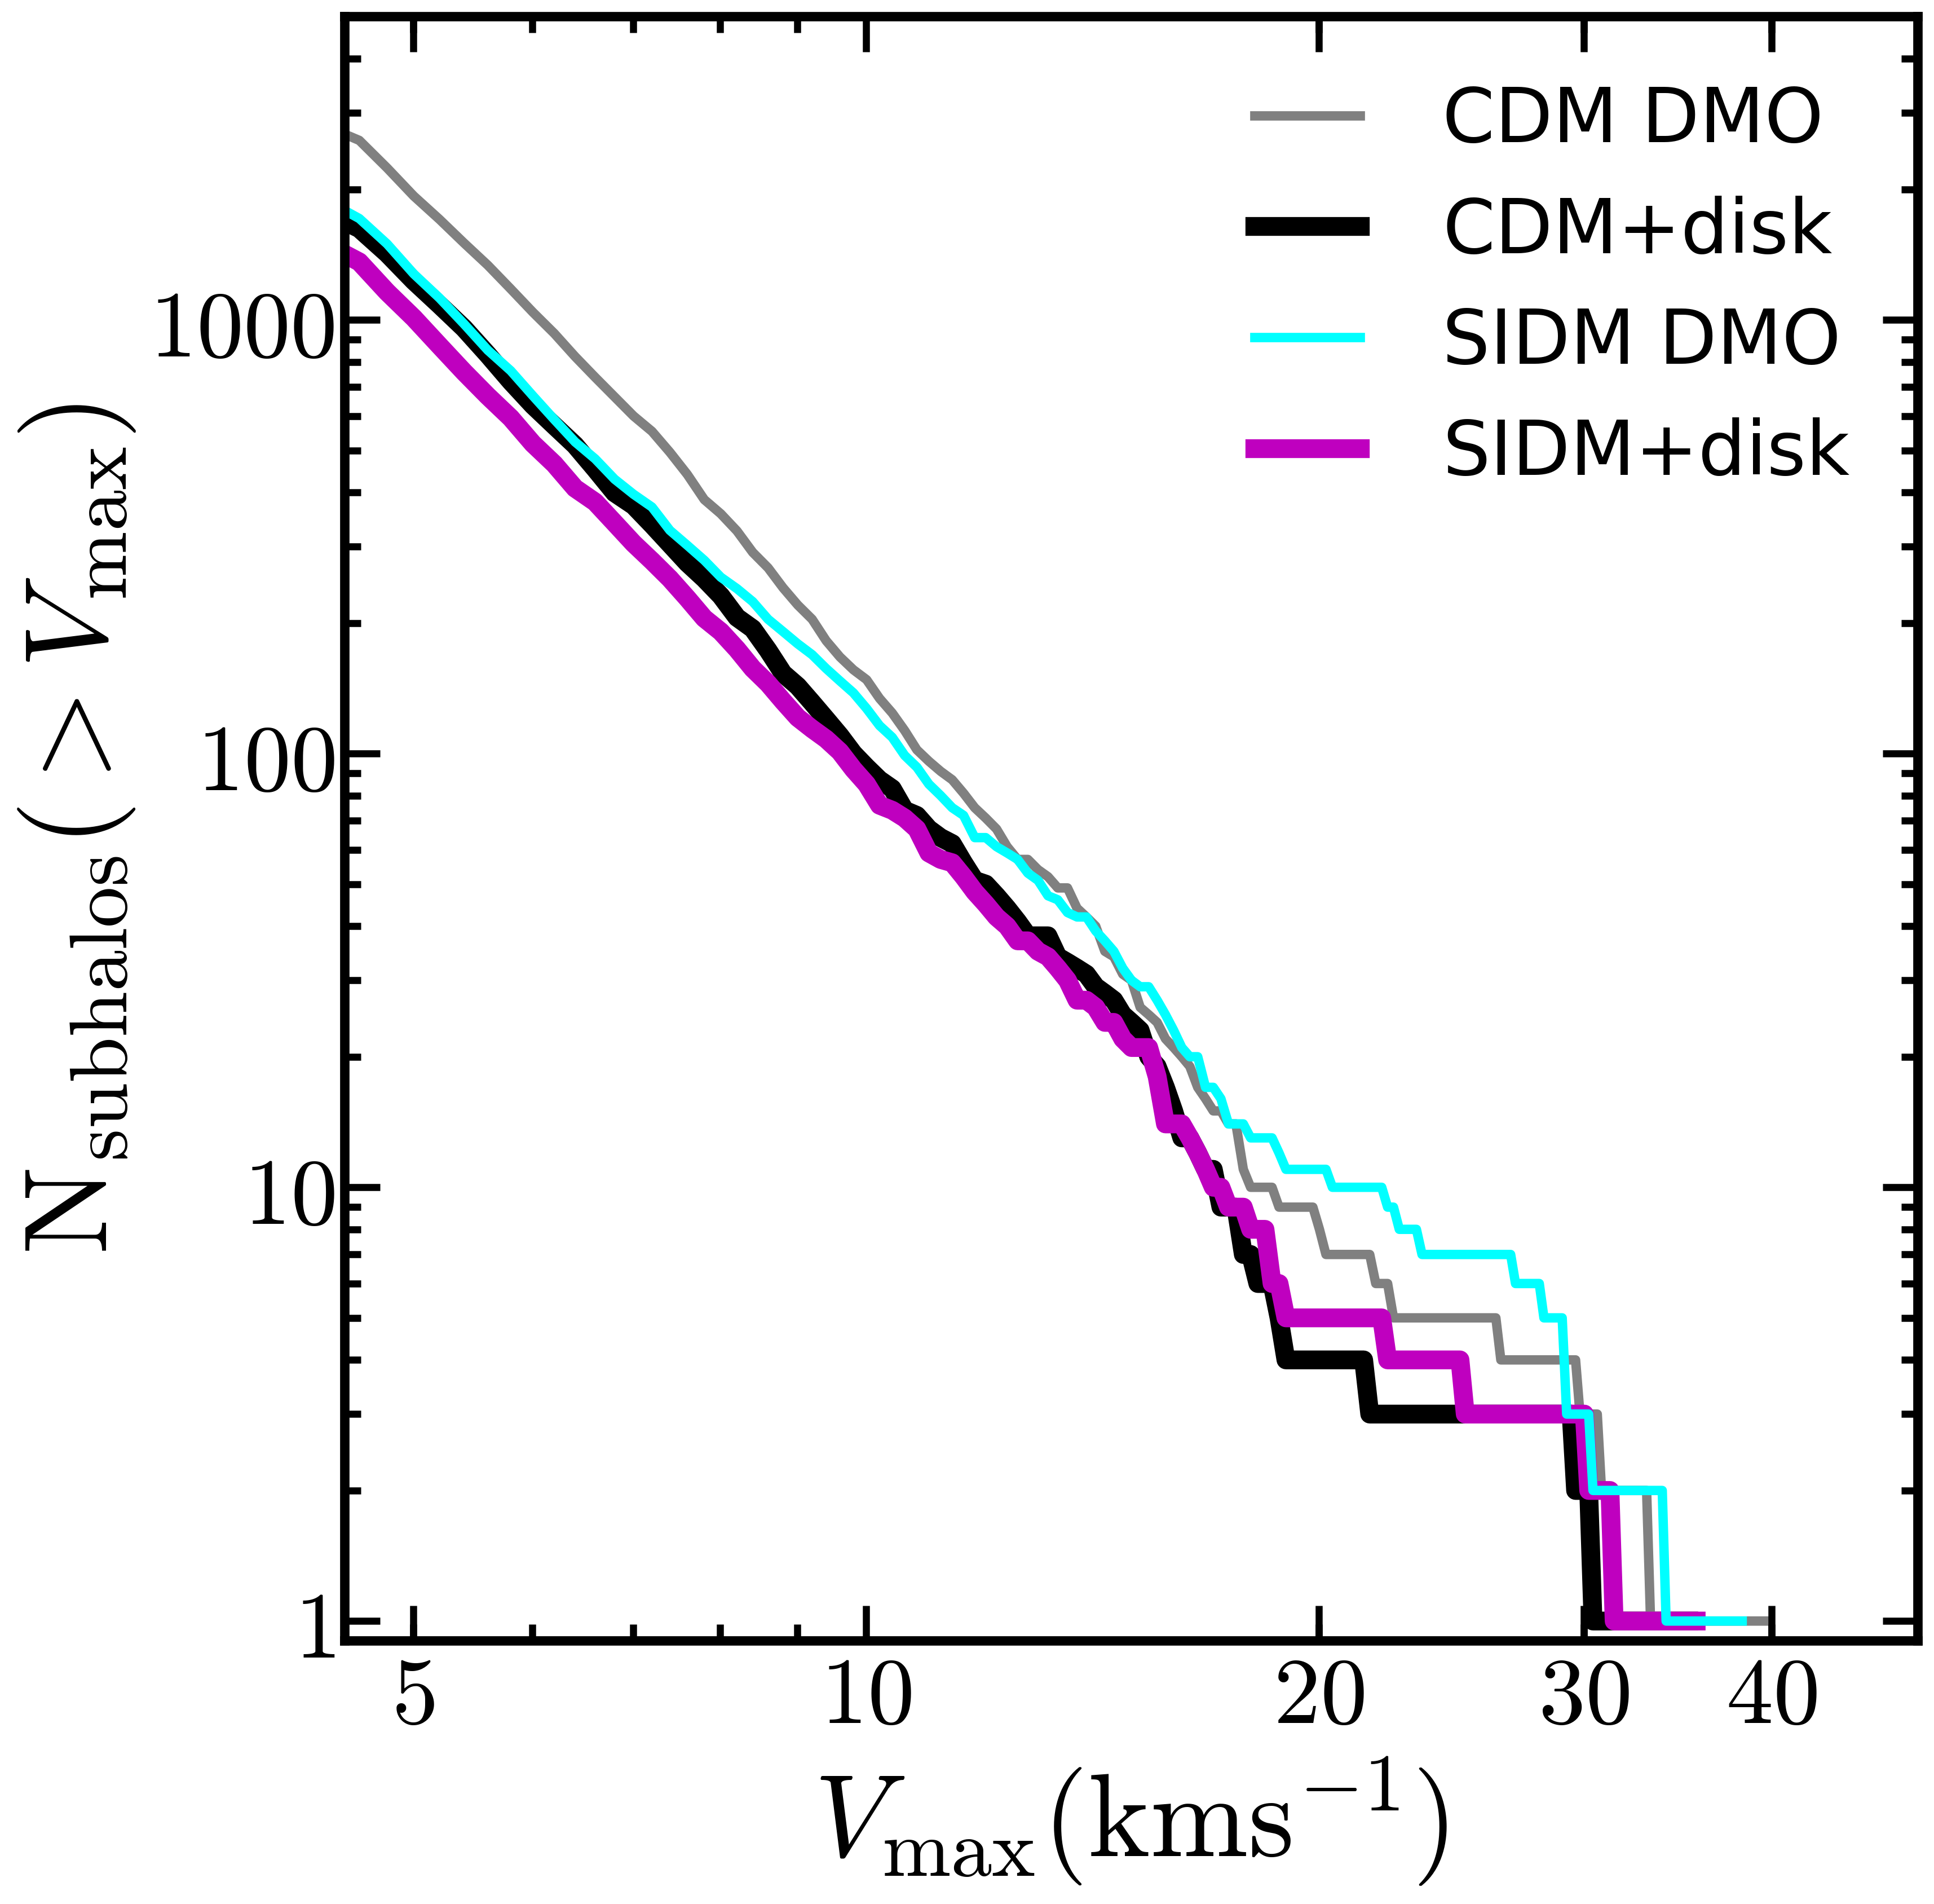
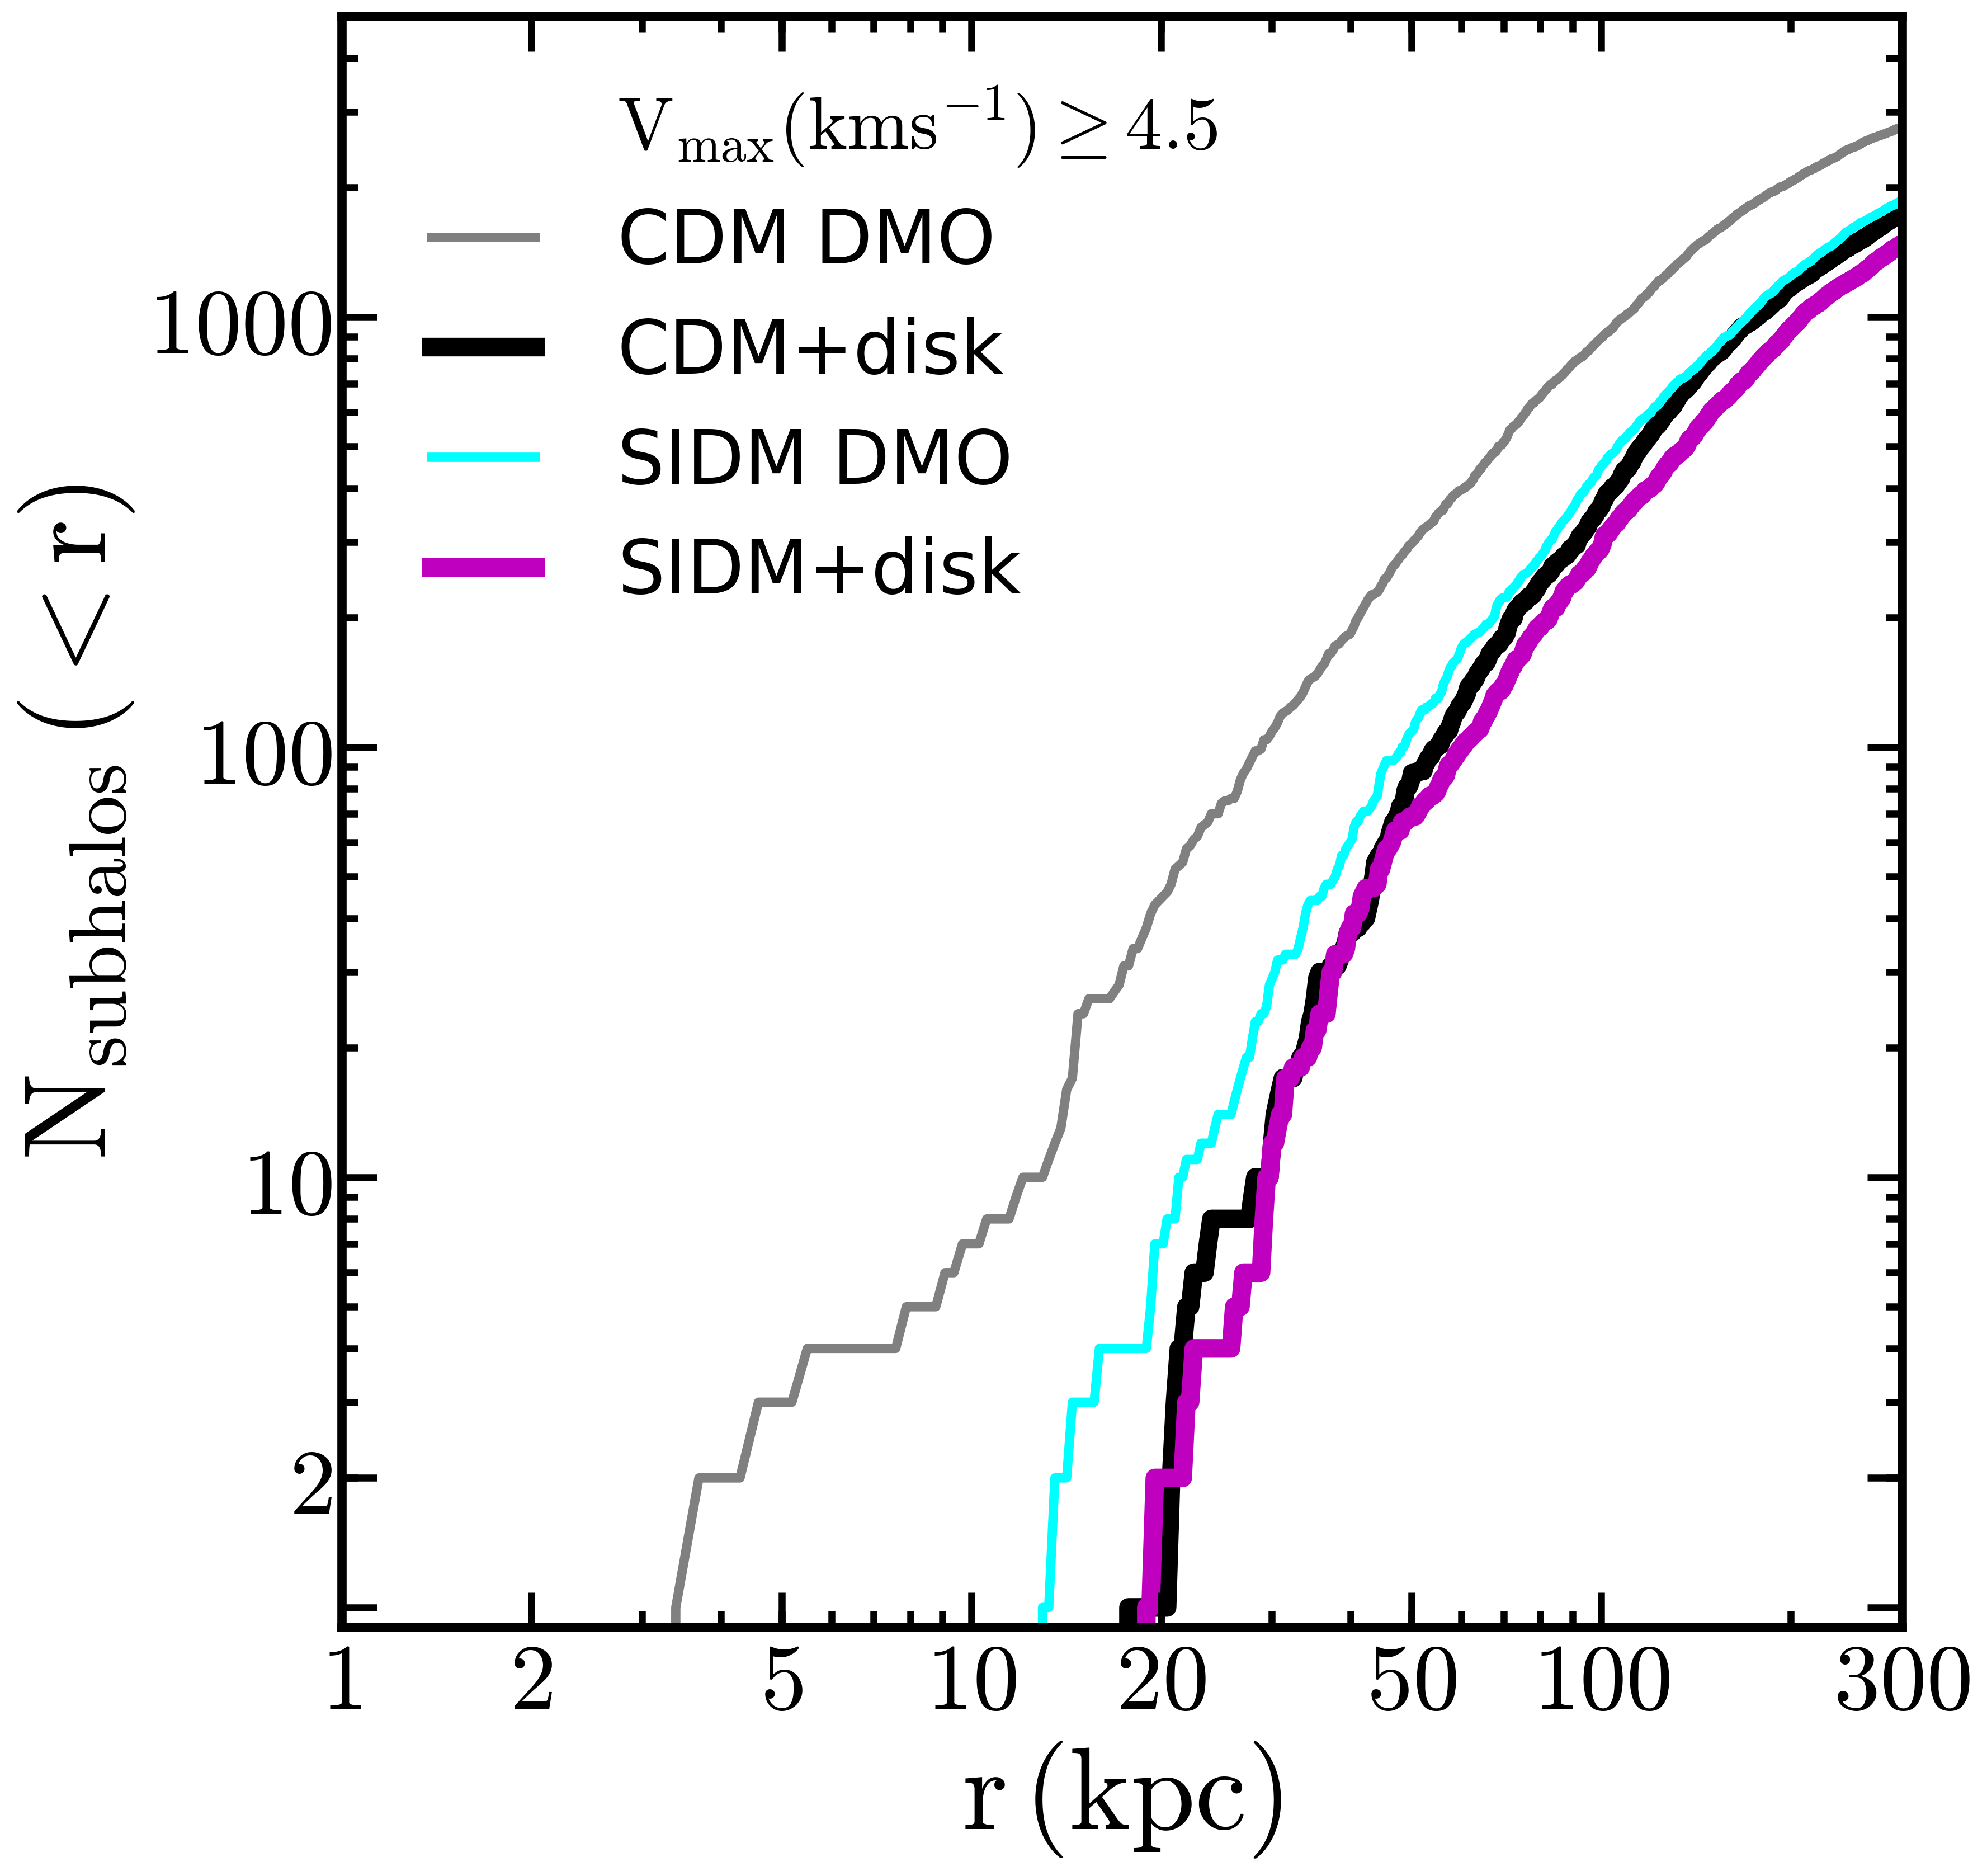
In Figure 2, we show the abundance of subhalos within (about the virial radius) of the host, as a function of the maximum subhalo circular velocity, (left panel). We observe only small differences in the total number of subhalos between the SIDM and CDM disk runs once the galaxy potential is included. A larger difference occurs in the DMO runs, where SIDM has less substructure than CDM for smaller subhalos.
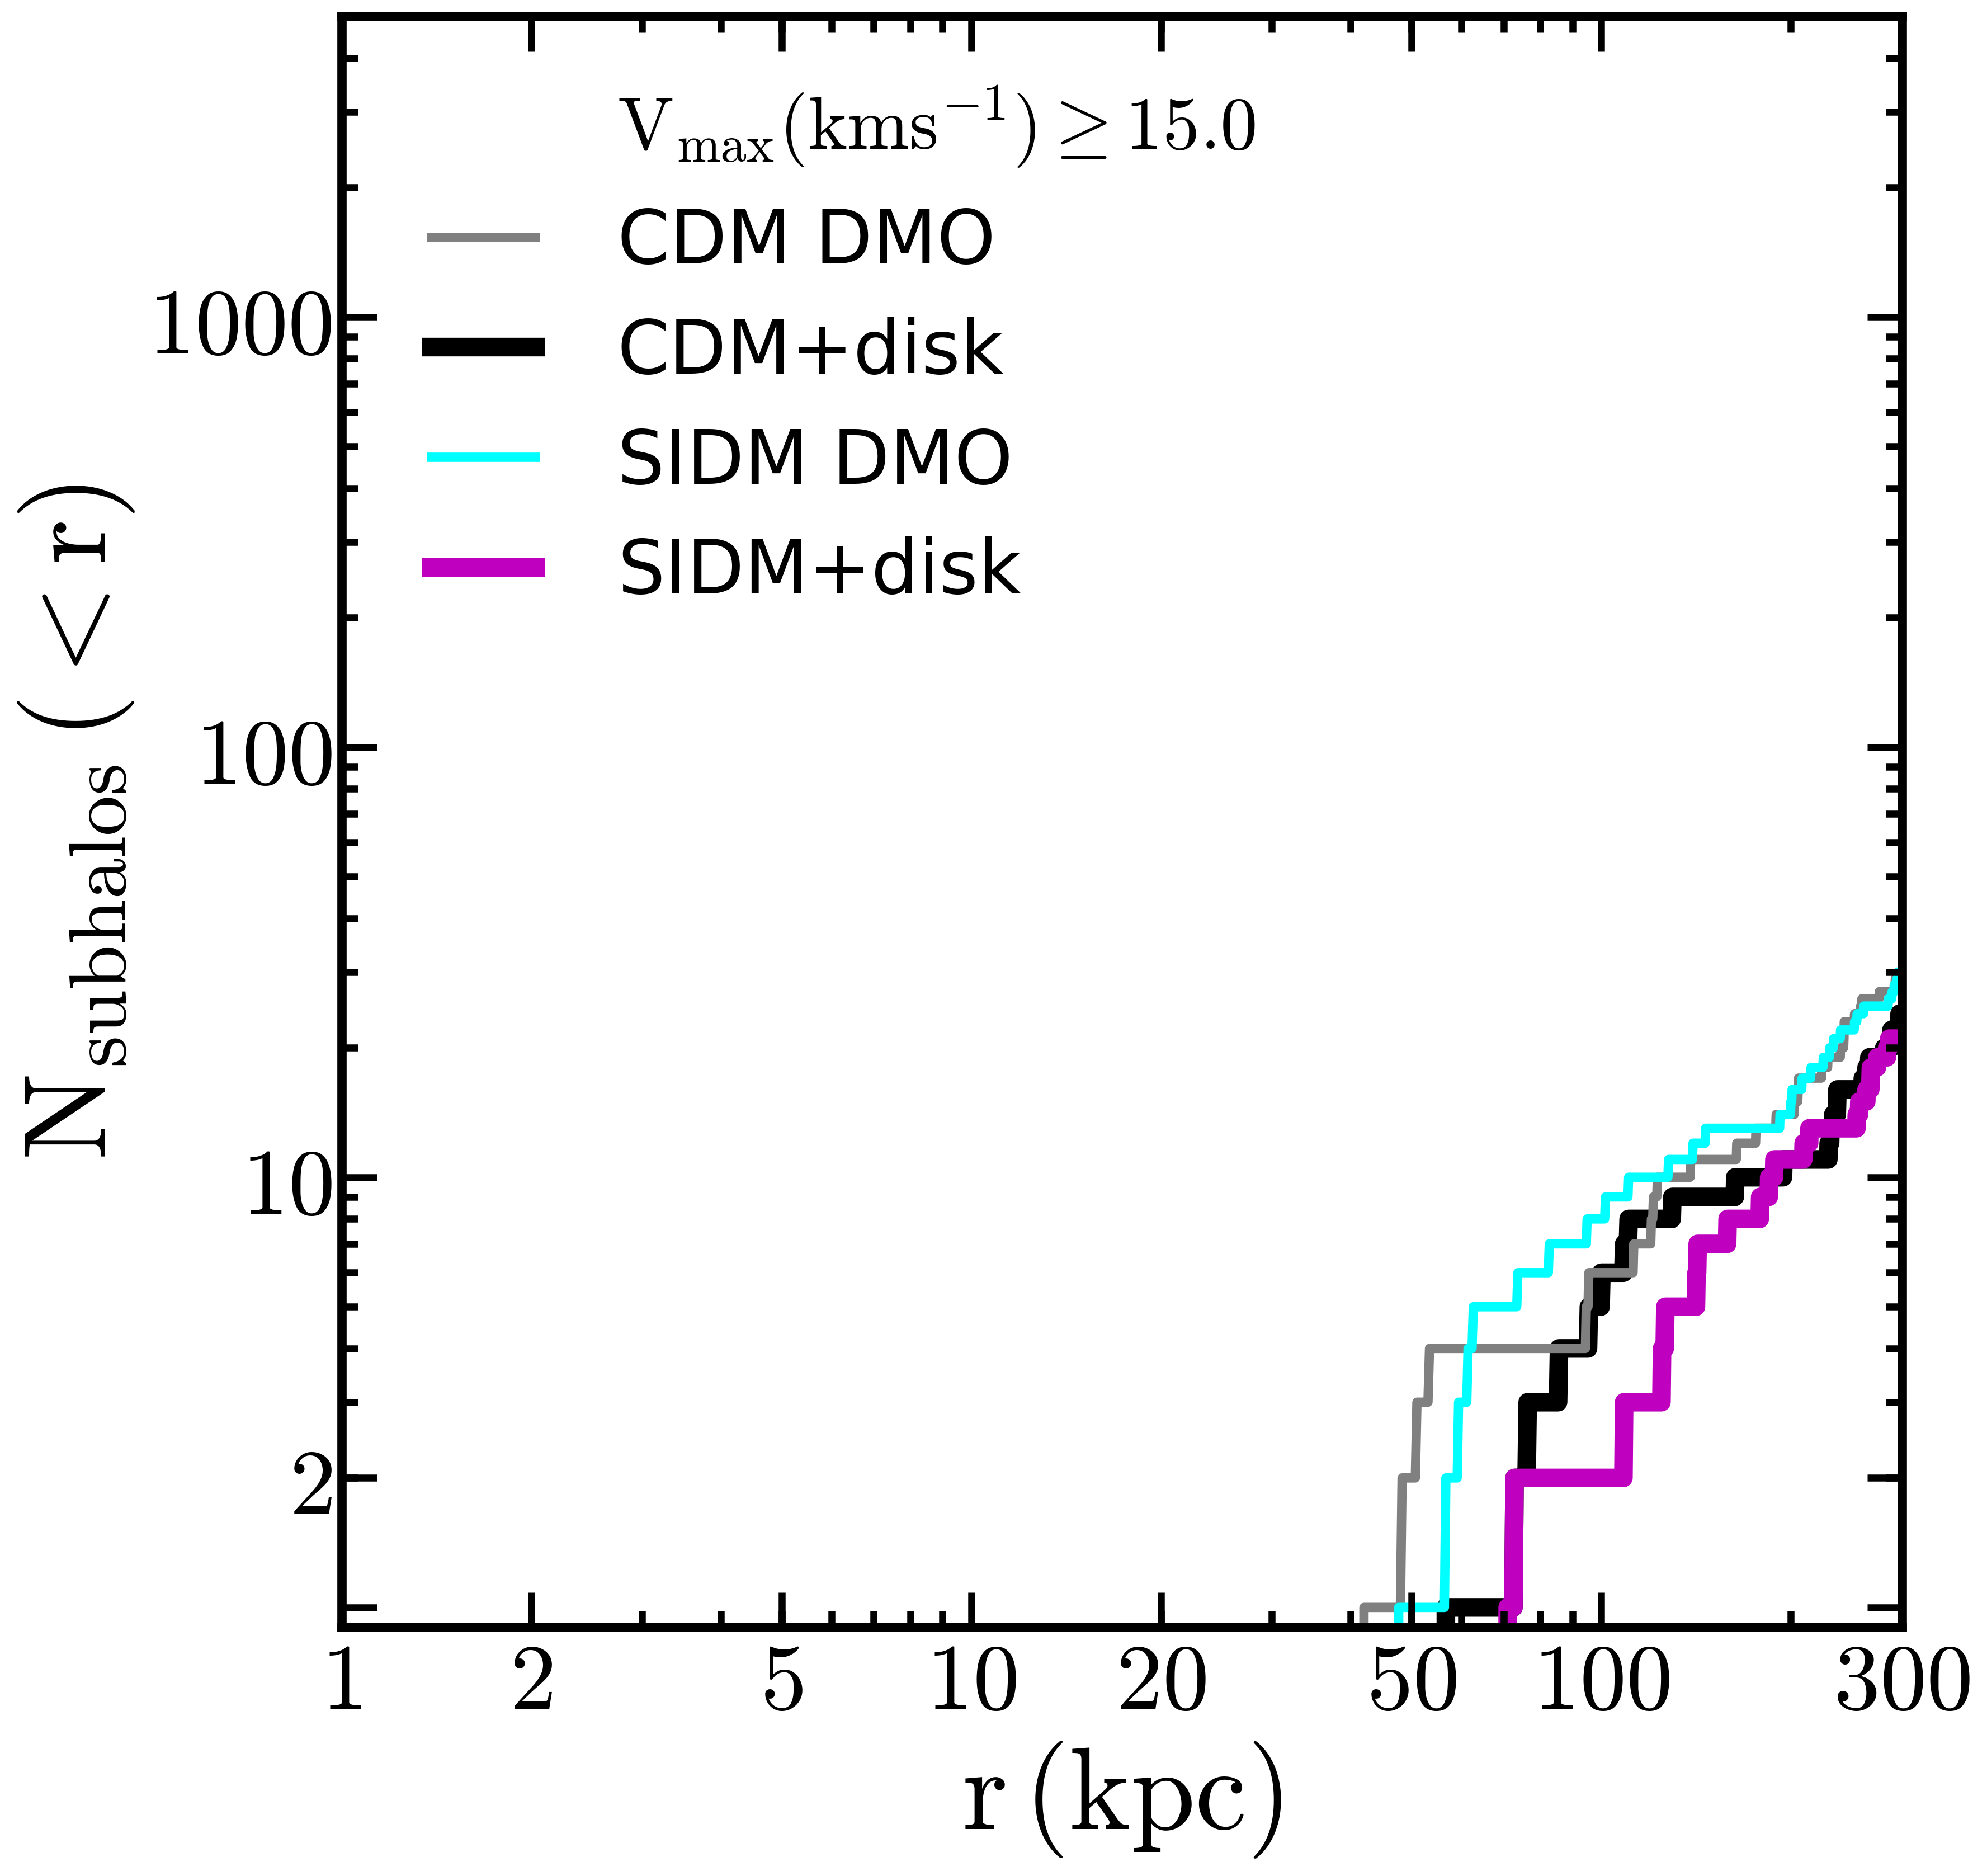
Comparing the number of massive subhalos (, which would host the bright MW satellites) in SIDM and CDM for simulations that include the galaxy potential, we find remarkably similar abundances. The small difference in the subhalo populations above is consistent with variations in the individual subhalo orbits arising from the non-linear evolution; we find that none of these subhalos had pericenter distances () for the DMO (disk) runs.
We also show the radial distribution for all well-resolved subhalos (equivalent bound mass ) and more massive subhalos in Fig. 2. The radial distributions of subhalos are very similar in CDM and SIDM once the baryonic potential are included. This is consistent with the disk preferentially destroying subhalos that have orbits with small pericenters. In particular, the distribution of the most massive subhalos () is remarkably consistent across the four simulations. For lower mass halos (), the presence of the baryonic potential mutes the differences between CDM and SIDM, indicating that number counts of subhalos alone will not be sufficient to constrain cross sections .
5 Density profiles of the satellites
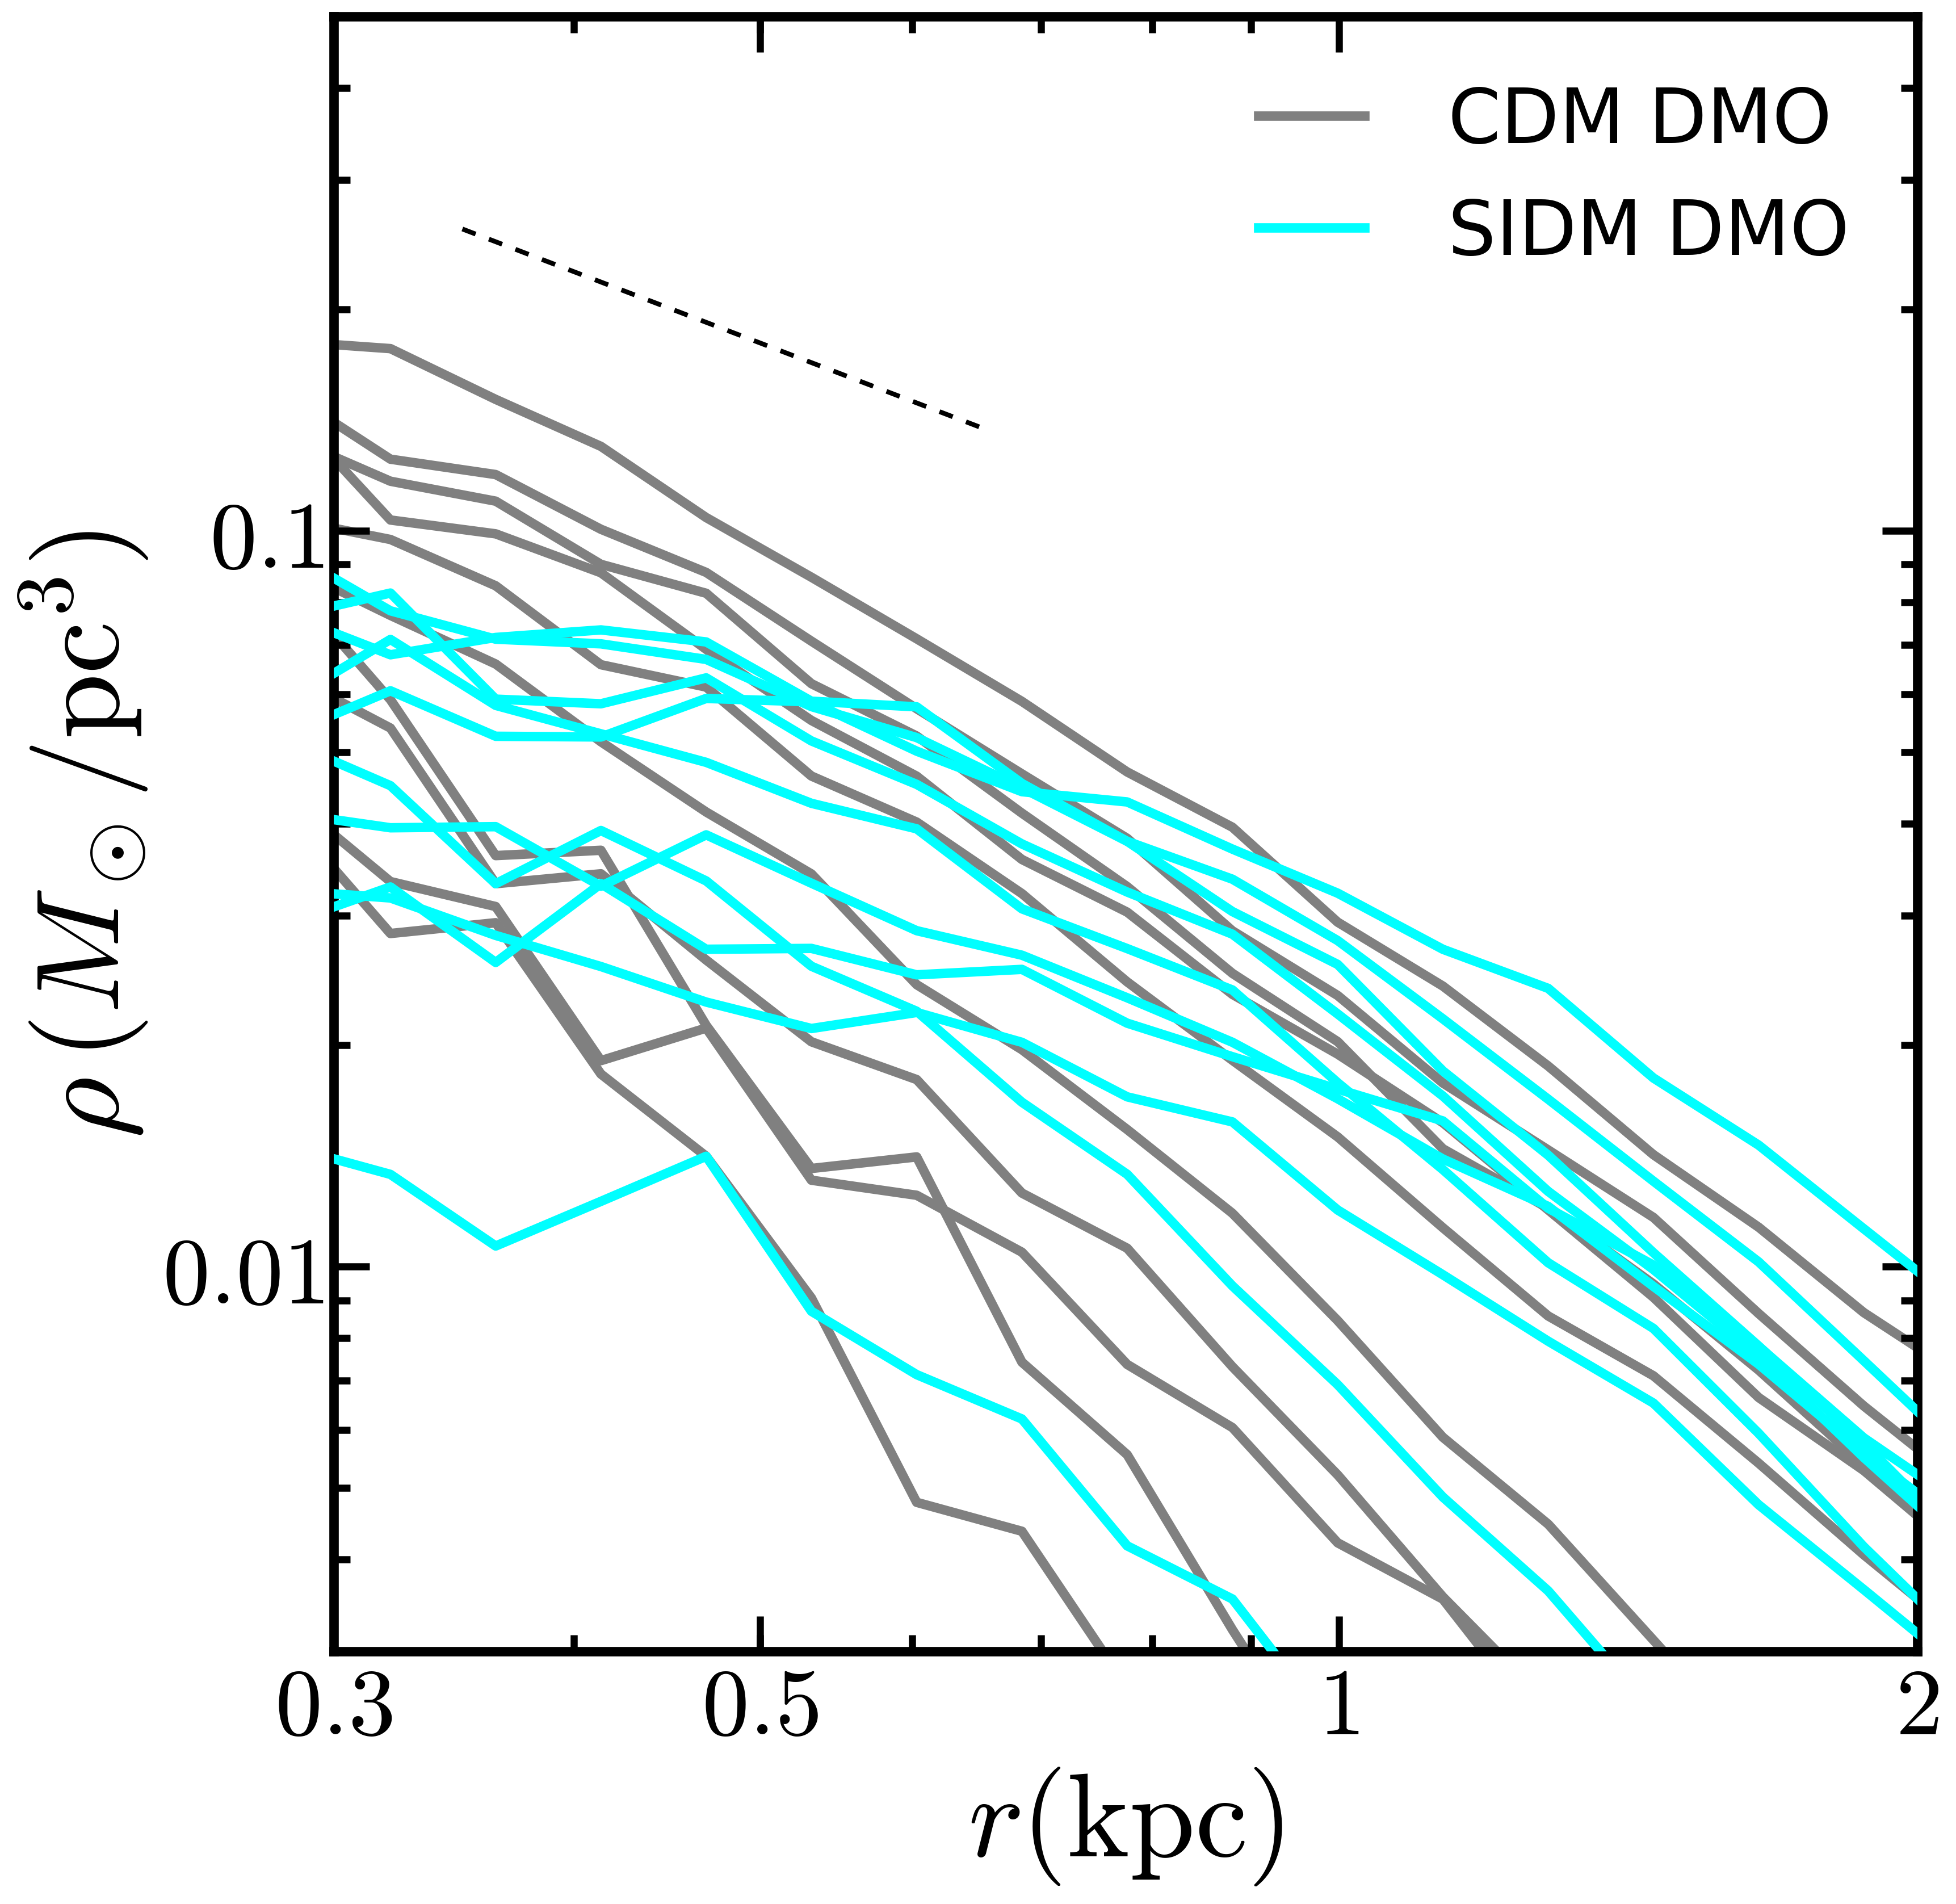
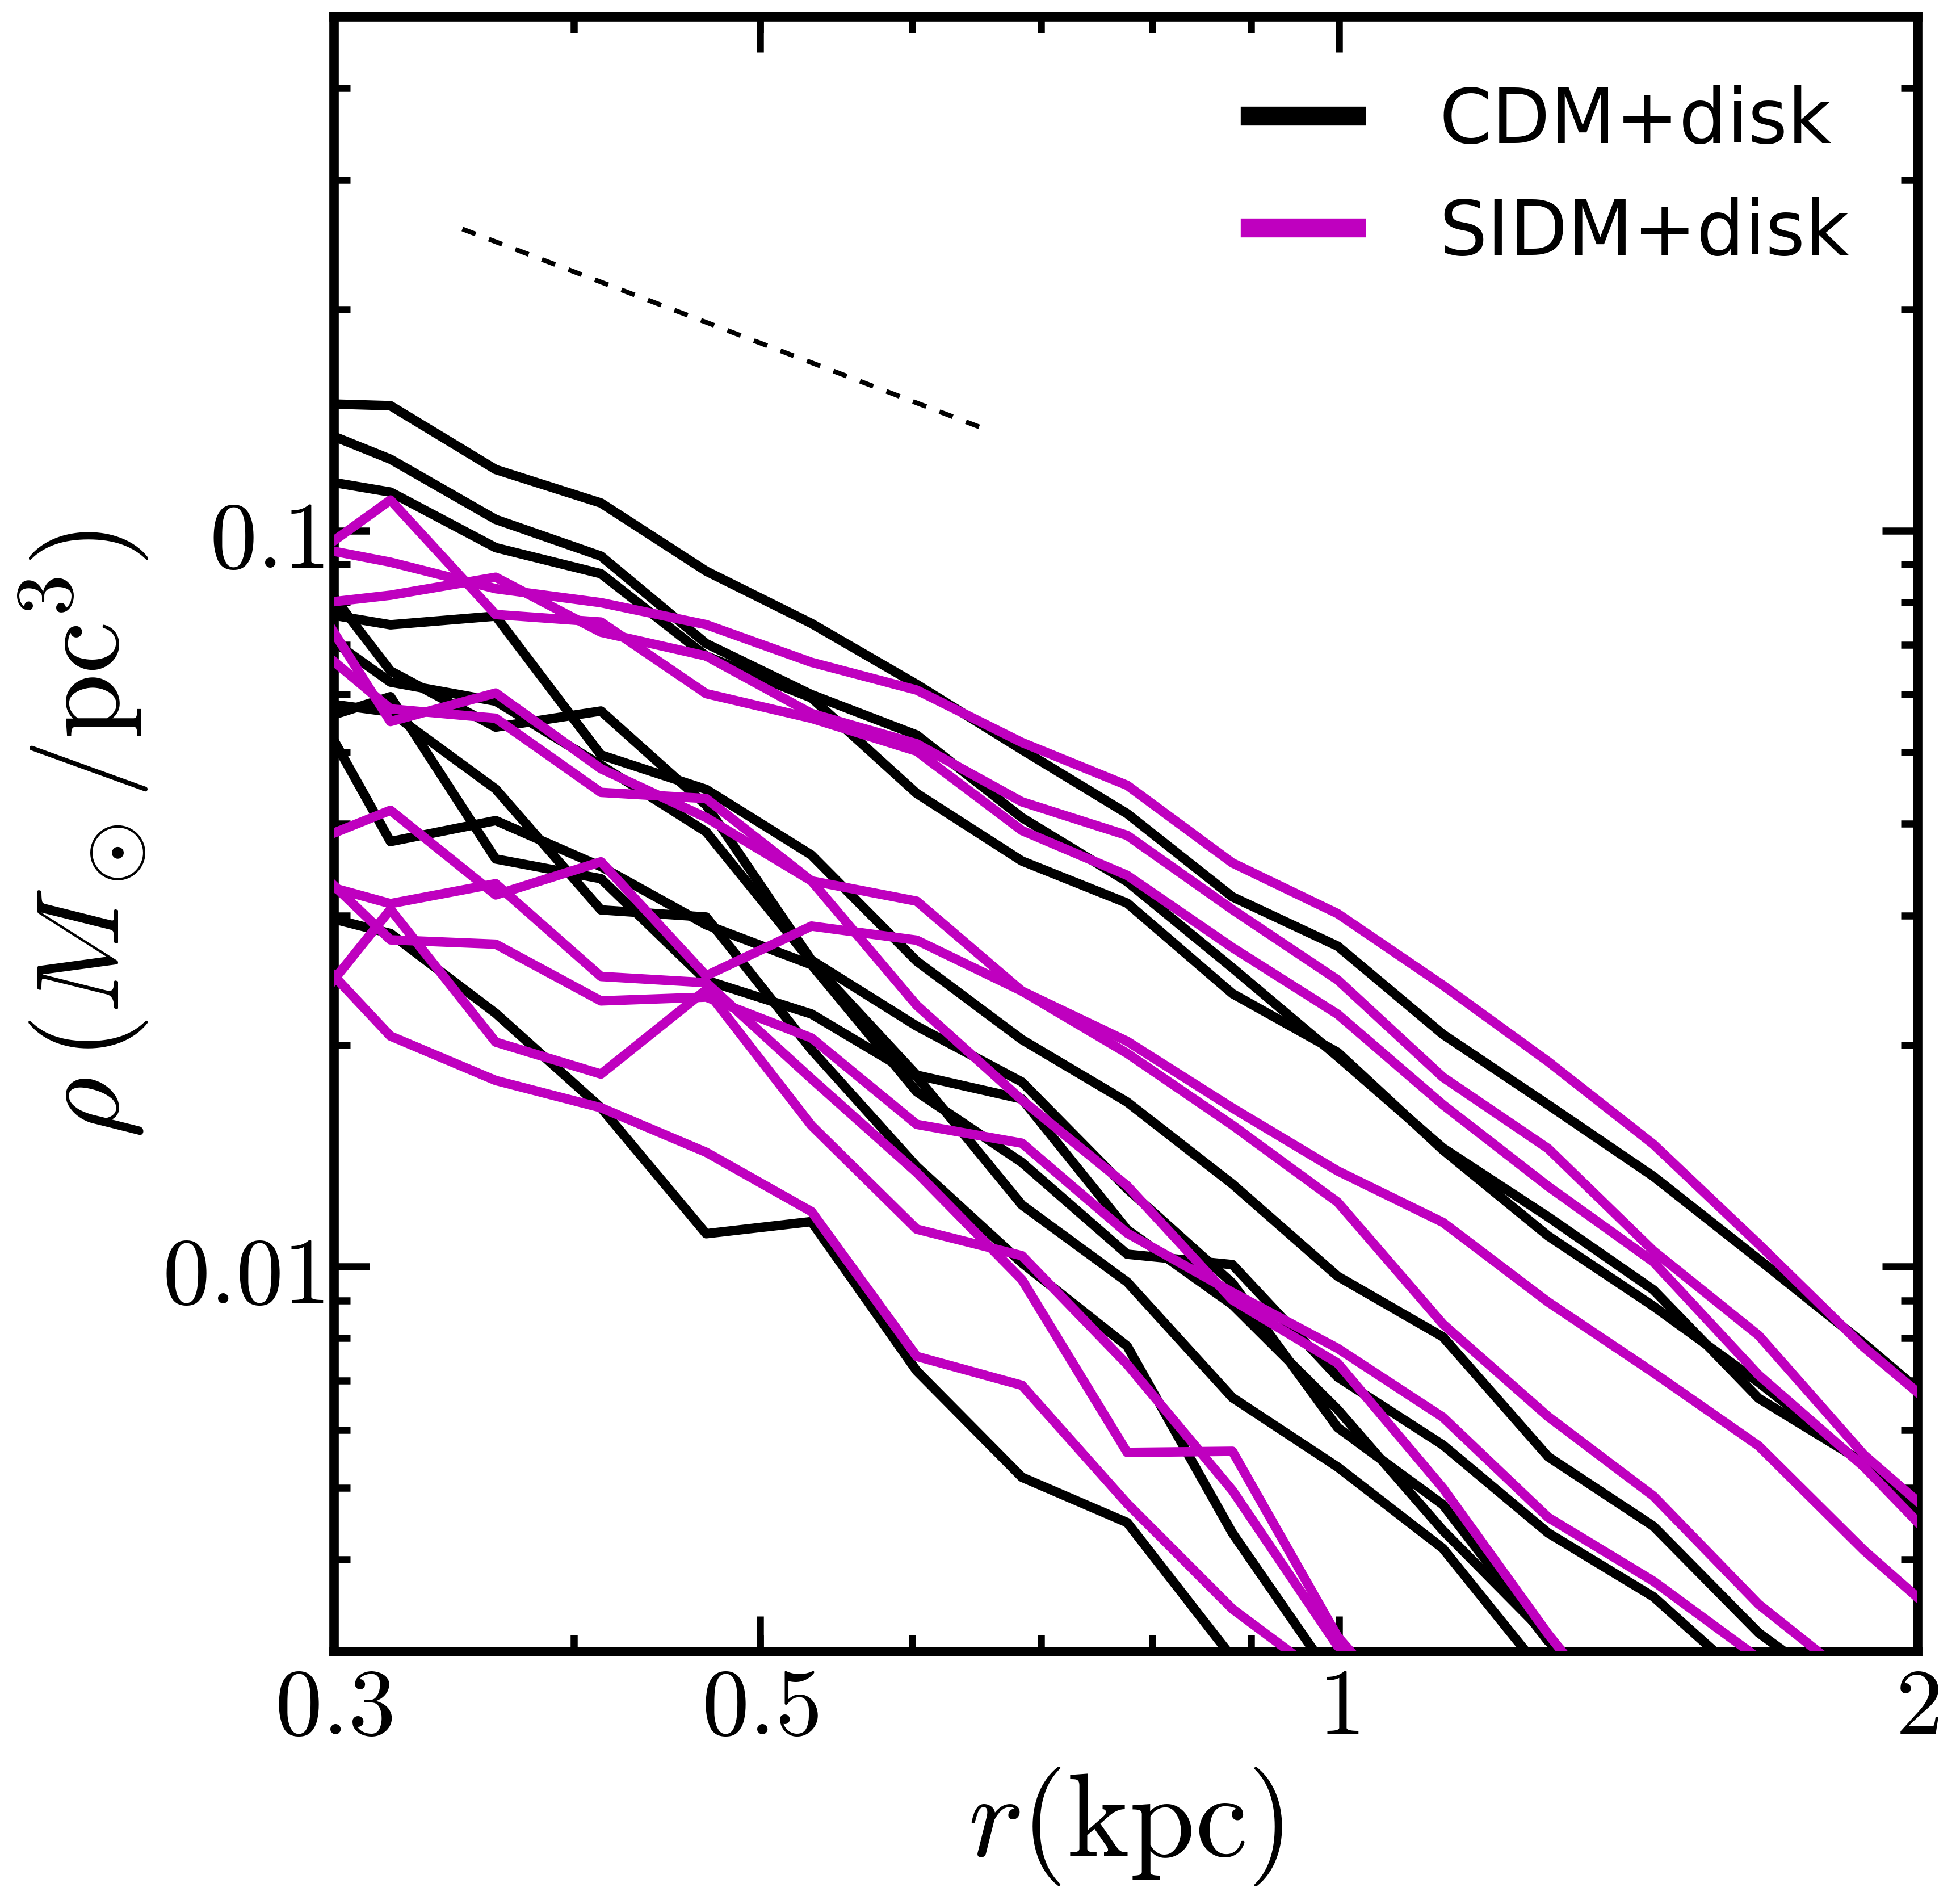
Our simulations resolve the inner pc of the most massive subhalos. Figure 3 shows the density profiles and circular velocity profiles of ten subhalos with the largest peak circular velocity () for the DMO and disk runs. In the CDM simulations, the subhalos are cuspy as expected and the influence of the disk does not substantially alter their inner densities. The data points in Fig. 3 are from inferences of the dynamical mass at the half-light radius for the MW dwarf spheroidals (dSphs) (taken from (Wolf et al., 2010), who used data from (Walker & Peñarrubia, 2011; Muñoz et al., 2005; Simon & Geha, 2007; Mateo, Olszewski & Walker, 2008; Koch et al., 2007)).
The impact of the disk on the central densities of the dwarf spheroidals has been proposed as the solution to the too-big-to-fail problem, in conjuction with stellar feedback (Zolotov et al., 2012; Brooks & Zolotov, 2014; Sawala et al., 2016). Our work provides a clean demonstration of the impact of just the disk on the central densities of the subhalos, and it shows that the tidal effects of the disk can reduce the circular velocities at by 20-30% for most subhalos, thereby alleviating the too-big-to-fail problem.
In our SIDM DMO (disk) run, the five (three) most massive halos () develop a mild central core within 400 pc, these cores have comparable sizes to those found in cosmological dwarf halos in the field for the same value of (Robles et al., 2017). The lower mass SIDM subhalos have smaller cores and look cuspy over the range of scales that are resolved in our simulations. For , most of the SIDM subhalos that host the classical dwarf spheroidals would have core sizes (unresolved in our simulations). MW dwarf spheroidals with stellar half-light radii pc (McConnachie, 2012) could be the best targets to discriminate between SIDM and CDM. In fact, the high density inferred for Draco cannot be explained by the subhalos in our simulation (with or without the baryonic potential), consistent with the recent results of Read, Walker & Steger (2018).
In addition to the dynamical mass estimates of the MW dwarfs, properties like stellar mass, size, star formation history, chemical enrichment and metallicity spread could be different in SIDM and CDM models, perhaps providing further handles on DM particle physics. This motivates running hydrodynamical SIDM simulations and their CDM pairs.
6 Analytic SIDM density profile
A simple working model for the SIDM halo profile is that the inner profile is isothermal, while the outer parts are the same as in CDM (Rocha et al., 2013; Kaplinghat et al., 2014). Interpolating between the two profiles by smoothly joining the mass profile at a radius where (on average) SIDM particles have interacted once does a good job of matching simulation results for field halos that aren’t in the core collapse phase (Kaplinghat, Tulin & Yu, 2016; Elbert et al., 2018; Sameie et al., 2018; Robertson et al., 2018). As expected the SIDM DMO density profile is almost perfectly reproduced by the Kaplinghat, Tulin & Yu (2016) analytic model. We also found that the same model explains the core densities of subhalos reasonably well (see Appendix for details).
In the SIDM+disk run, the host halo has developed a negative temperature gradient (core density is increasing) and the analytic model underpredicts the densities at intermediate radii, as expected (Elbert et al., 2018). Interestingly, matching the isothermal profile exactly to the NFW profile fails for these core-collapsed systems. Taking a cue from that, we solved the Jeans equation (starting with a constant density core at a small radius as before) allowing for the 1-d SIDM dispersion to decrease mildly with radius. We found the smallest gradient to get an exact match between the density and mass of the solution to the Jeans equation and a NFW profile. Using this gradient resulted in a good match to the simulated SIDM+disk profile (see Appendix for details). The generality of this modification remains to be investigated.
7 Orbits of satellites
Figure 3 shows both the data and simulations colored by their pericenters of the satellite and subhalo orbits. We use the inferences of the pericenter values for the dSphs using Gaia data from Fritz et al. (2018) for their Milky Way halo mass of , which is close to our simulated halo.
The comparison of the orbits of the subhalos to the measured pericenter distances from Gaia for the satellites presents an interesting puzzle. In the presence of the disk, the central density of the CDM subhalos is reduced (as expected). In this case, the two densest satellites Draco and Ursa Minor have to be hosted in halos that have pericenter distances at the upper end of the distribution. However, Gaia measurements suggest that these two satellites have likely come as close as 30 kpc to the center of the halo. On the other hand, the lower density satellites (e.g. Sextans) are hosted in subhalos that have been significantly affected by tidal interactions (smaller pericenters). Statistically assessing the too-big-to-fail problem in CDM and SIDM models and determining whether the mismatch between the observed satellite pericenters and the simulated subhalos is a strong discrepancy are issues that remain to be addressed.
8 Conclusions
We have presented results from high-resolution cosmological simulations of a Milky Way like galaxy in models with no dark matter self-interaction (CDM) and self-interaction cross section over mass (SIDM). We included a realistic contribution of the stellar disk and bulge with an evolving embedded potential that grows in mass and size from to the present. The simulated disk and bulge properties at agree with MW observations.
We find that in the absence of a baryonic potential, a MW halo with dark matter self-interaction strength develops a large core at its center and is nearly ten times less dense within than its corresponding CDM DMO halo. When the disk and bulge potential is included, the behavior is inverted: the SIDM halo is a factor of 2-3 denser than its equivalent CDM halo. This behavior can be understood by considering the thermalization of the inner region.
We find the substructure abundance and the overall radial distribution of subhalos are similar once the baryonic potential is included suggesting that matching the number of observed satellites via abundance matching would yield same results for SIDM and CDM.
We find that the internal structure of the most massive subhalos in both DMO and disk SIDM simulations reveal shallow profiles within about , comparable to the effective stellar half-light radii of some MW and M31 dwarf spheroidal satellite galaxies (McConnachie, 2012; Tollerud, Boylan-Kolchin & Bullock, 2014). The gravitational impact of the disk is sufficient to lower the simulated subhalo densities within a kpc to be consistent with the range of densities inferred for the MW dwarf spheroidals. The lowest density subhalos are those with the smallest pericenters, a trend that doesn’t seem to be reflected in the measurements of densities and pericenters of the bright MW satellites.
None of the subhalos in the SIDM simulation was dense enough to match the inferred density of Draco. Our results suggest a detailed comparison of the stellar properties of classical dwarf spheroidals, including their orbital histories, could be used to discriminate between the two models. Including the ultra-faint satellites of the Milky Way, the dwarf spheroidals in Andromeda and the other Local Group dwarf galaxies should further sharpen this test.
Acknowledgments
VHR was supported by a Gary A. McCue postdoctoral fellowship. JSB and VHR were supported by NSF AST-1518291, HST-AR-14282, and HST-AR-13888. TK and JSB were supported by NSF AST-1518291, HST-AR-14282, and HST-AR-13888. MK was supported by NSF Grant No. PHY-1620638. The simulations were run on the Texas Advanced Computing Center (TACC; http://www.tacc.utexas.edu), the NASA Advanced Supercomputing (NAS) Division and the NASA Center for Climate Simulation (NCCS), and the Extreme Science and Engineering Discovery Environment (XSEDE), which is supported by National Science Foundation grant number OCI-1053575.
Appendix: Analytic fits to SIDM halos
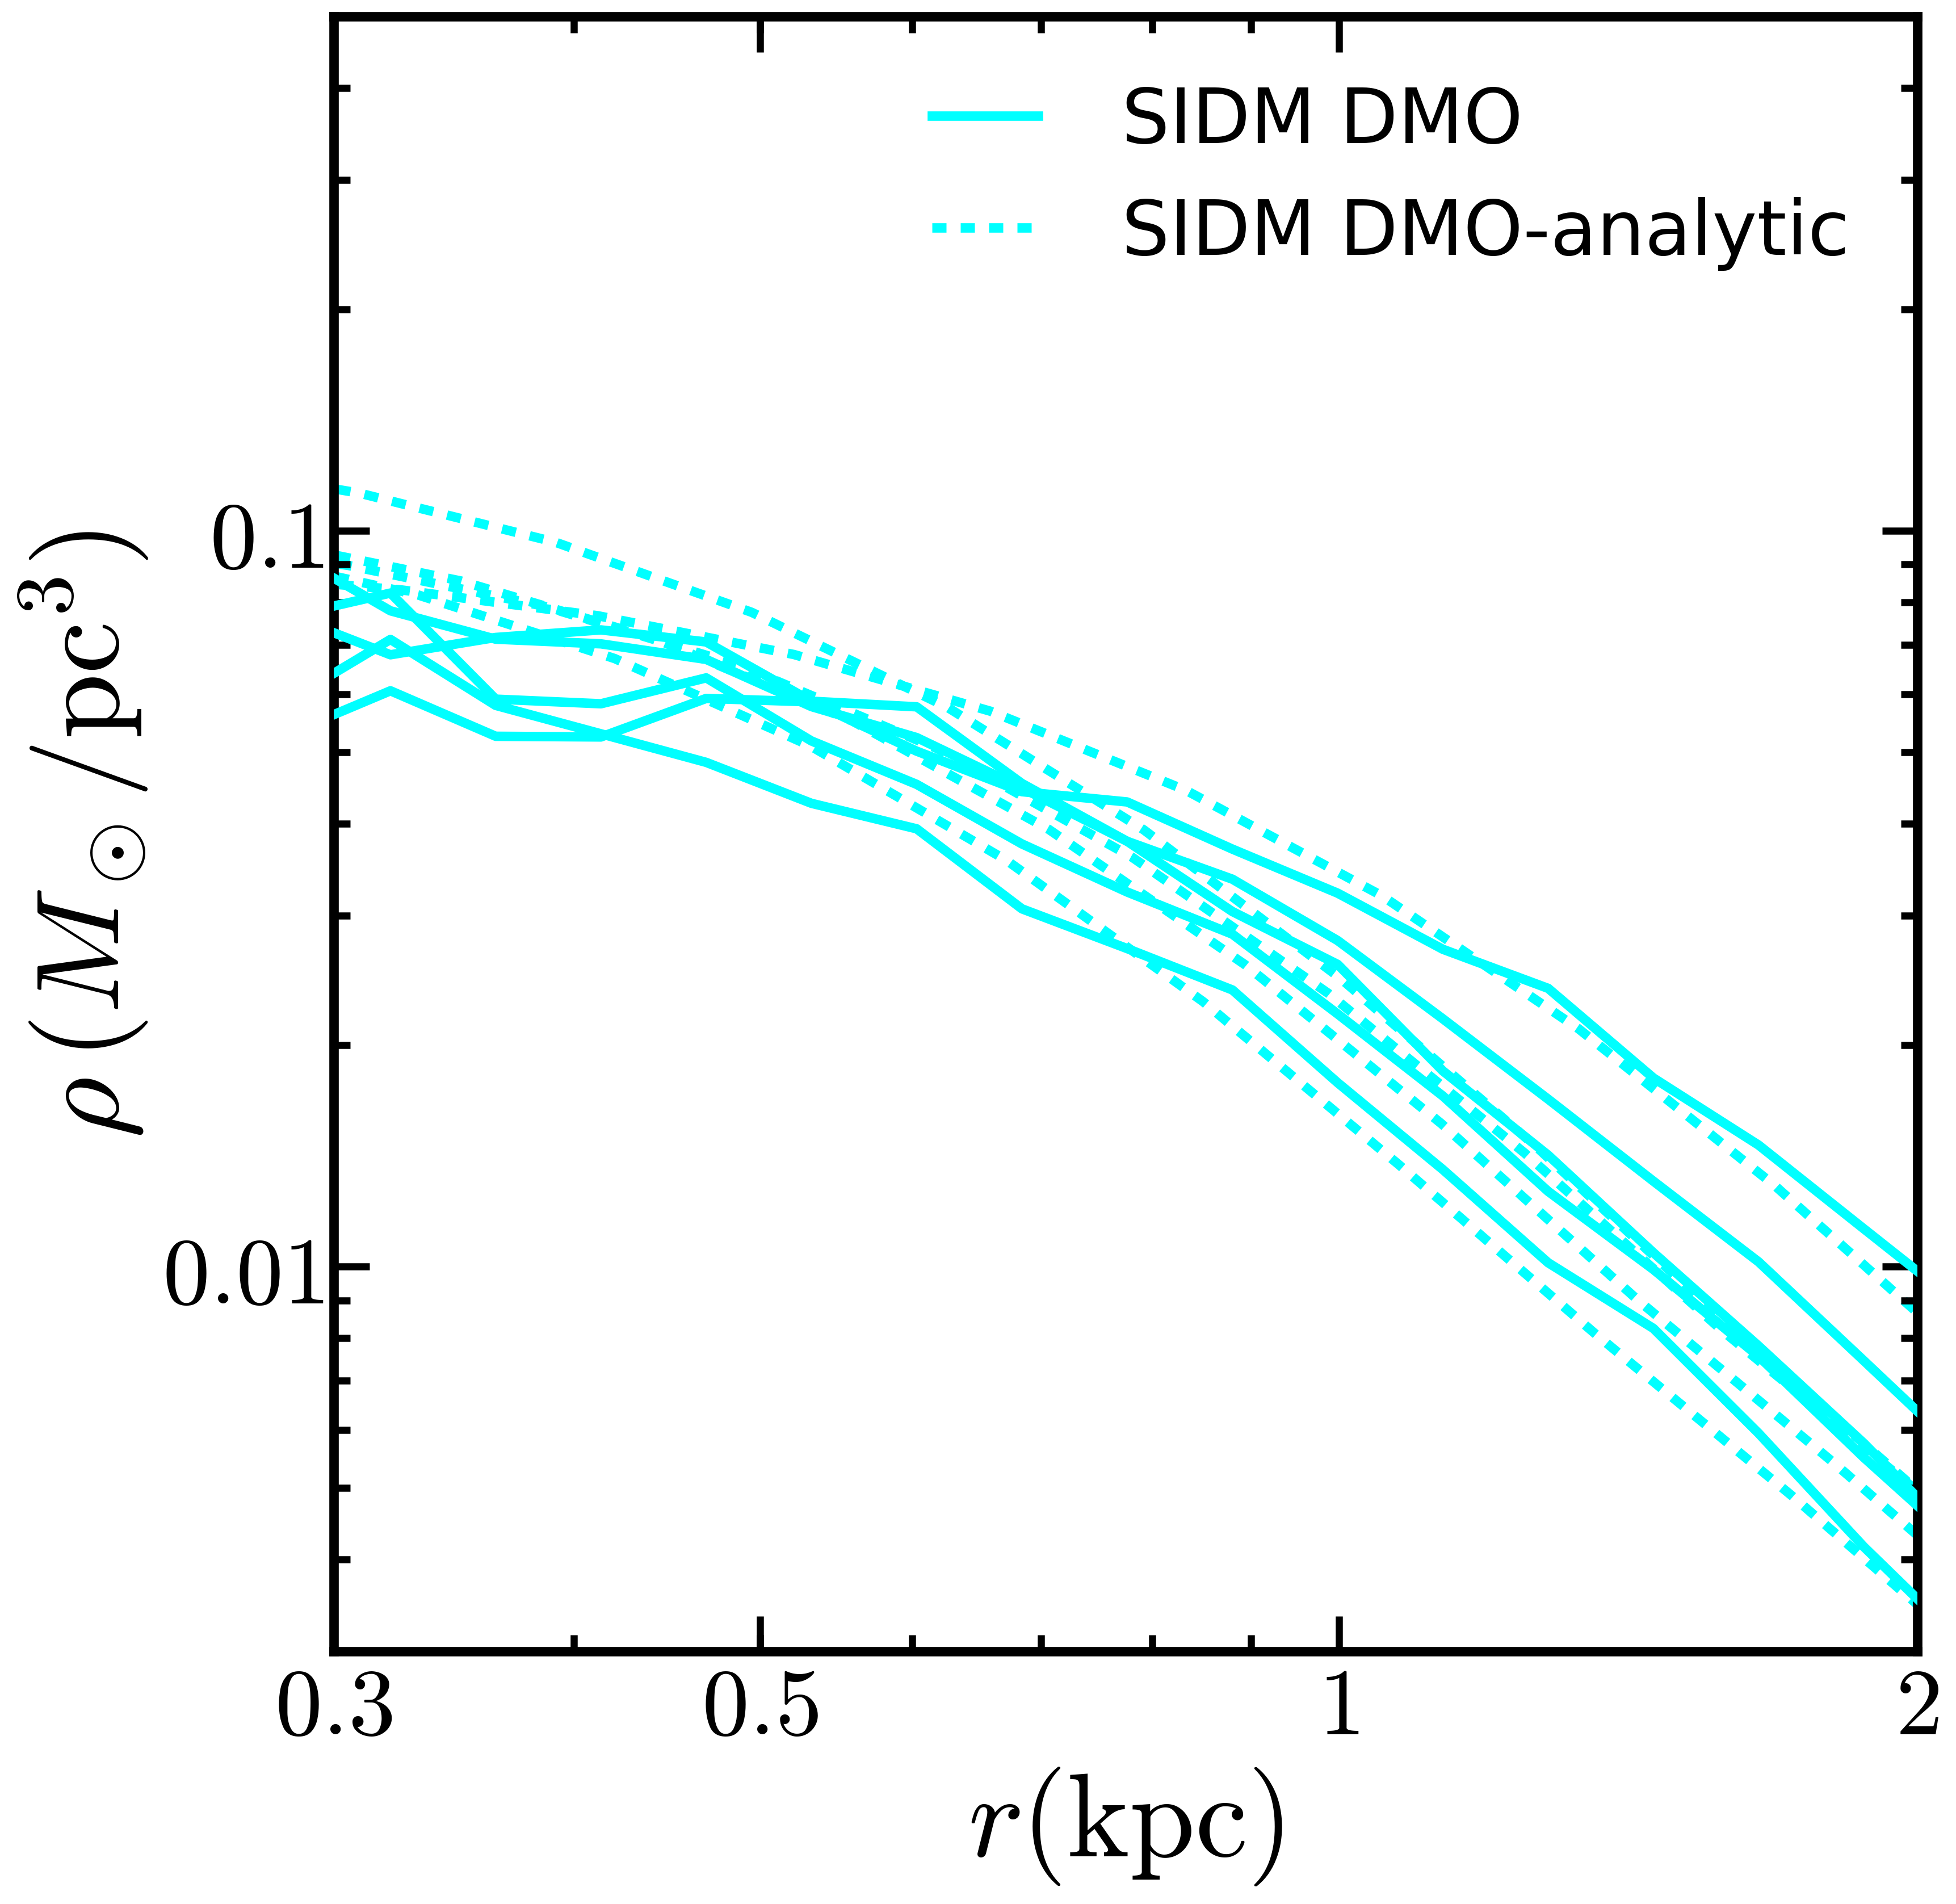
The halo profile of SIDM halos can be understood using a simple analytic model(Kaplinghat, Tulin & Yu, 2016). The inner profile is isothermal, which implies that the halo density where is the 3D velocity dispersion. In the region where interactions have not had time to thermalize the halo, the density profile will be the same as in CDM. The CDM profile will be close to the NFW profile in regions sufficiently far from the influence of baryons. This picture works well for .
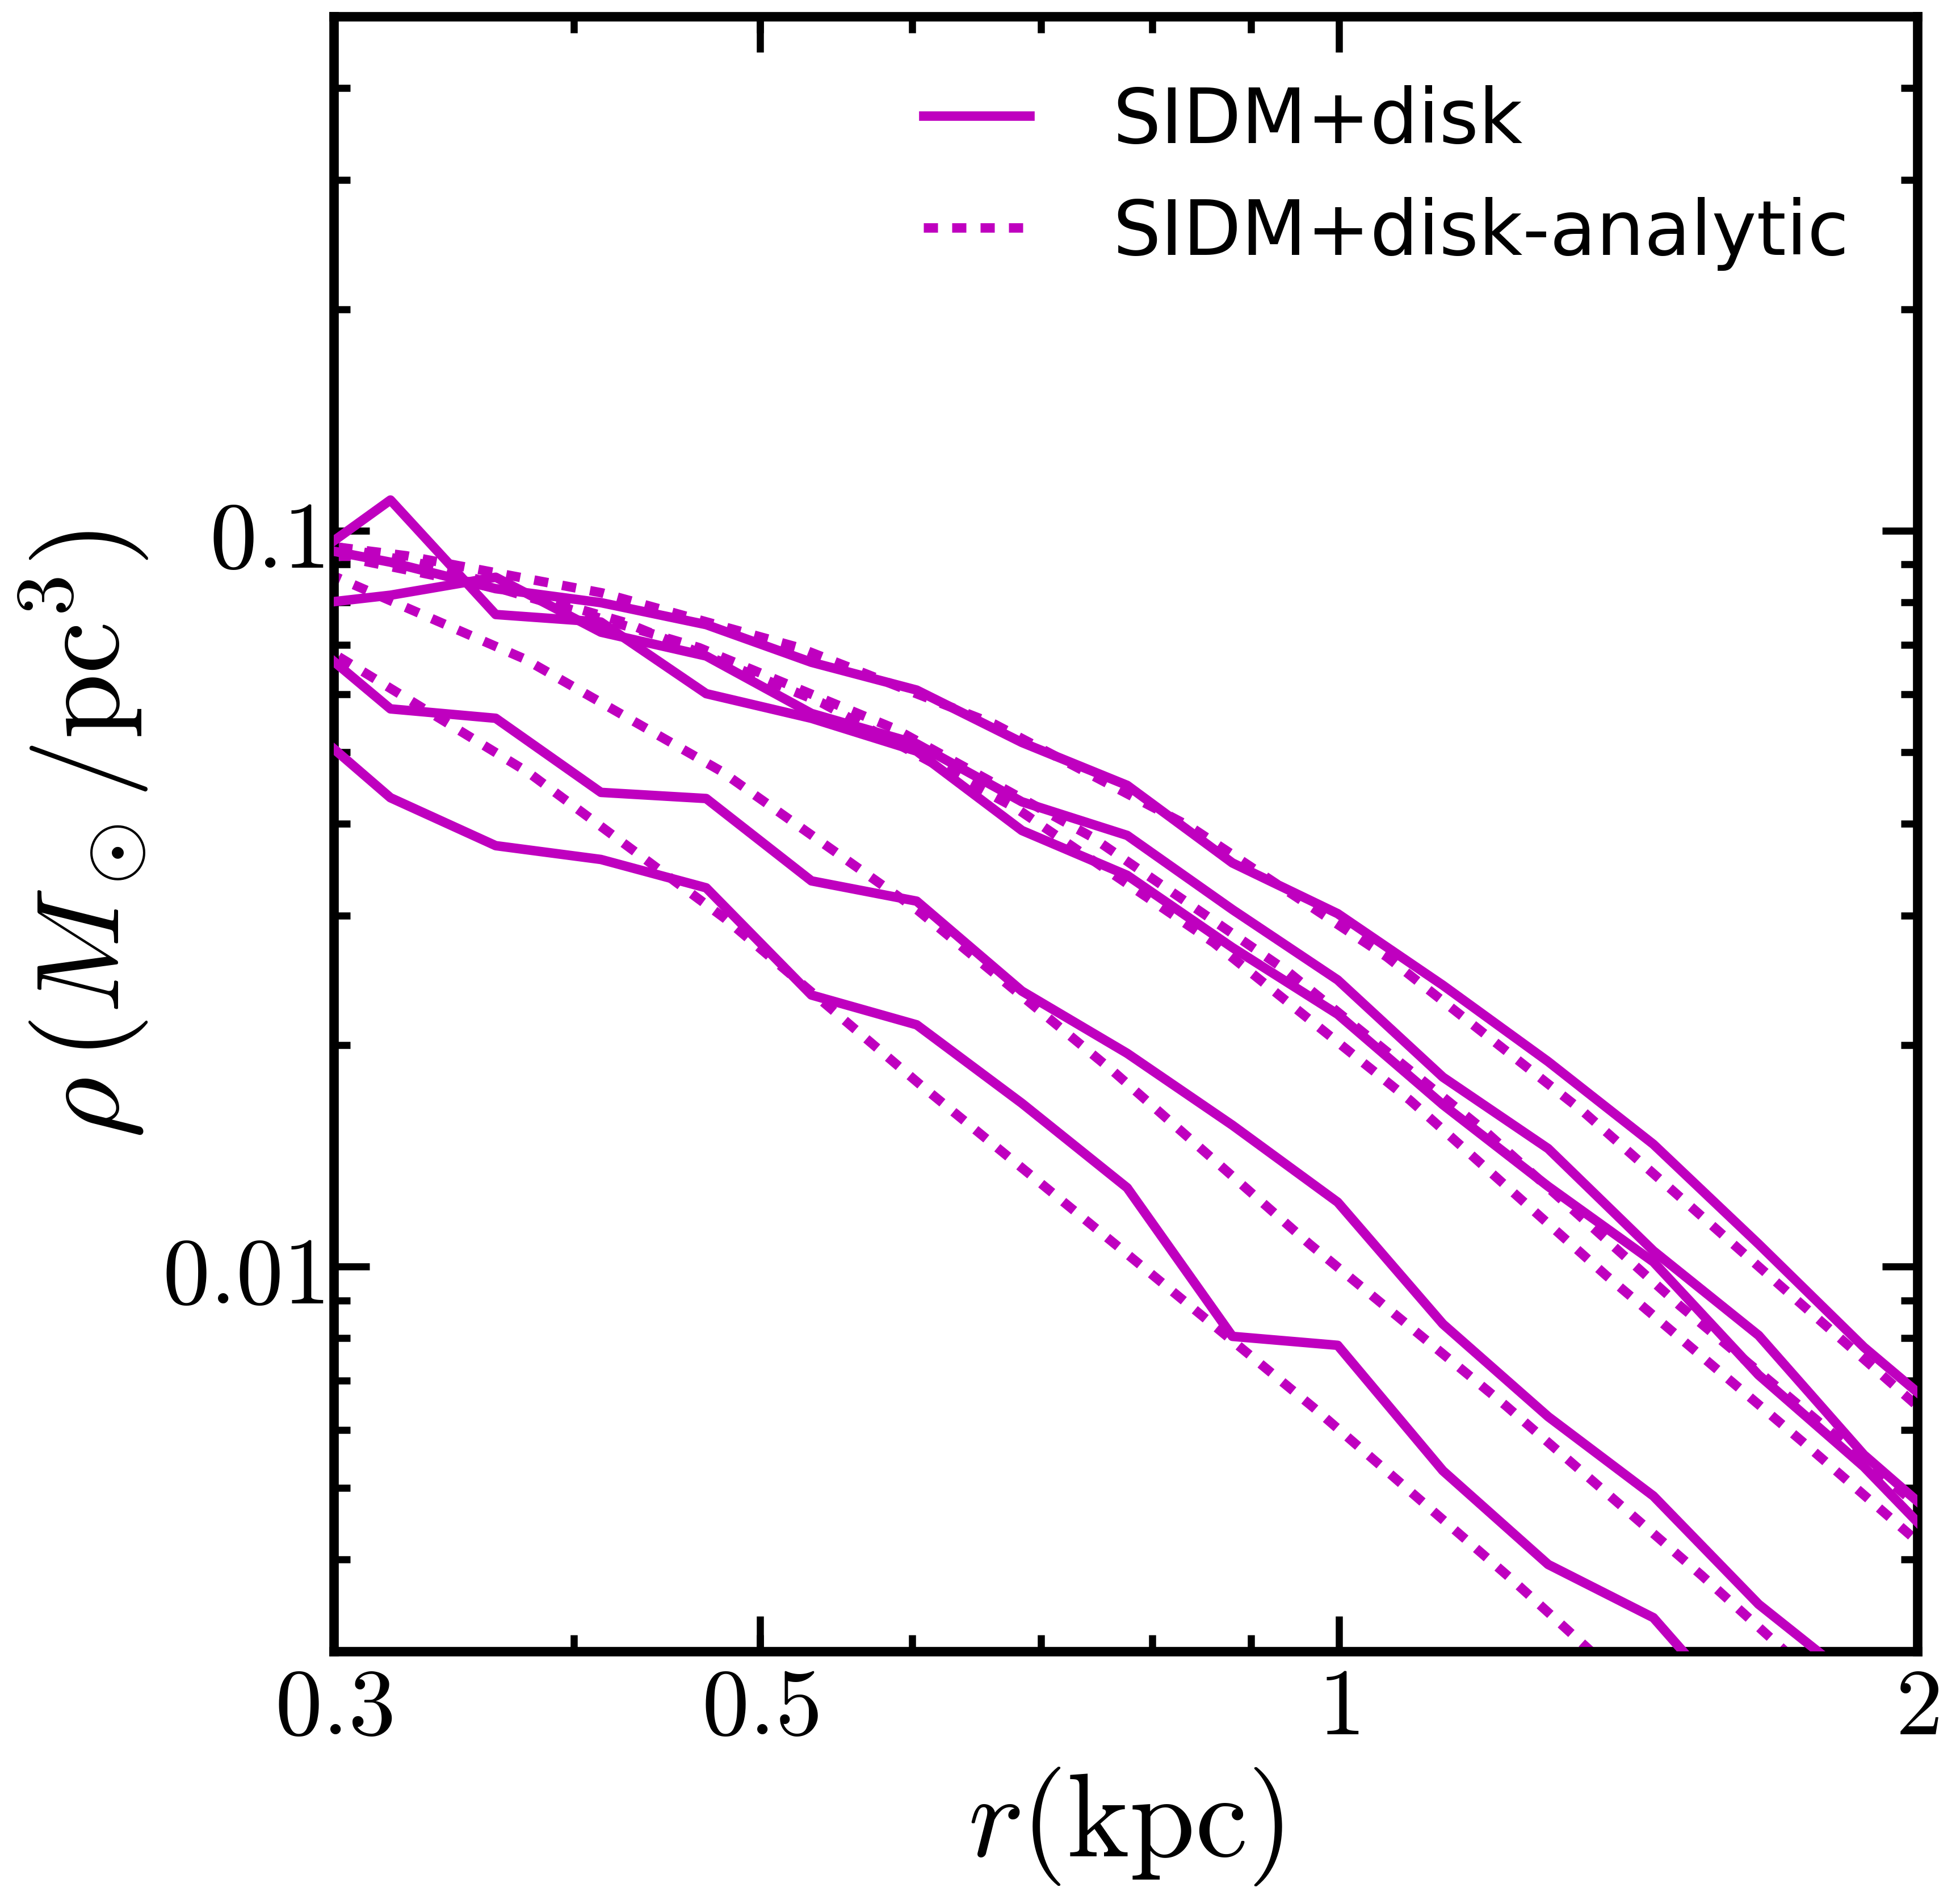
A simple ansatz for interpolating between the isothermal and NFW profiles is to match the mass and density at a radius where the halo particles have had on average one interaction. Thus, is defined by the relation , where is halo age. We show the results from this analytic model (assuming and =13 Gyr) in Fig. 4 (dotted lines) obtained by matching the isothermal solution to NFW fits to the CDM subhalos in Fig. 3. We used the Colossus Python package to obtain the NFW fits. The analytic profiles are compared to the subhalo profiles in the simulations with and without the baryonic potential. The SIDM analytic profiles inferred from CDM subhalos are remarkably similar (less than difference) to the simulated SIDM profiles, showing that the core formation in SIDM subhalos can be understood from the thermalization of the dark matter caused by self-interactions.
It was pointed out by Kaplinghat et al. (2014) that the isothermal requirement in the presence of a sufficiently compact stellar disk (or a massive bulge) would drive the SIDM density profile to be dense (thereby reducing the core size). The analytic model discussed above was shown to work well for N-body SIDM simulations with a static disk (Elbert et al., 2018; Sameie et al., 2018), except when the velocity dispersion profile has a negative gradient. In this case, it was not possible to get a good match to both mass and density at .
Our MW disk and bulge potentials increase the SIDM density, shorten the interaction timescale and bring the halo into the phase where the central density is increasing and the core is shrinking. In order to get a better match at than in Elbert et al. (2018), we allow for a small negative gradient in the profile using the ansatz . The value of was chosen to be comparable to , with the expectation that the required gradients will be small. We decreased (starting from zero) until the SIDM profile could match on to a NFW profile exactly at (in both mass and density). Thus, the slope of the is automatically set by this procedure. The required value of is about , which implies is about at 10 kpc, consistent with the mild temperature gradient seen in the simulation. For less dense disks, no gradients are required to match the inner and outer profiles at and hence we will revert back to the construction in Kaplinghat, Tulin & Yu (2016).
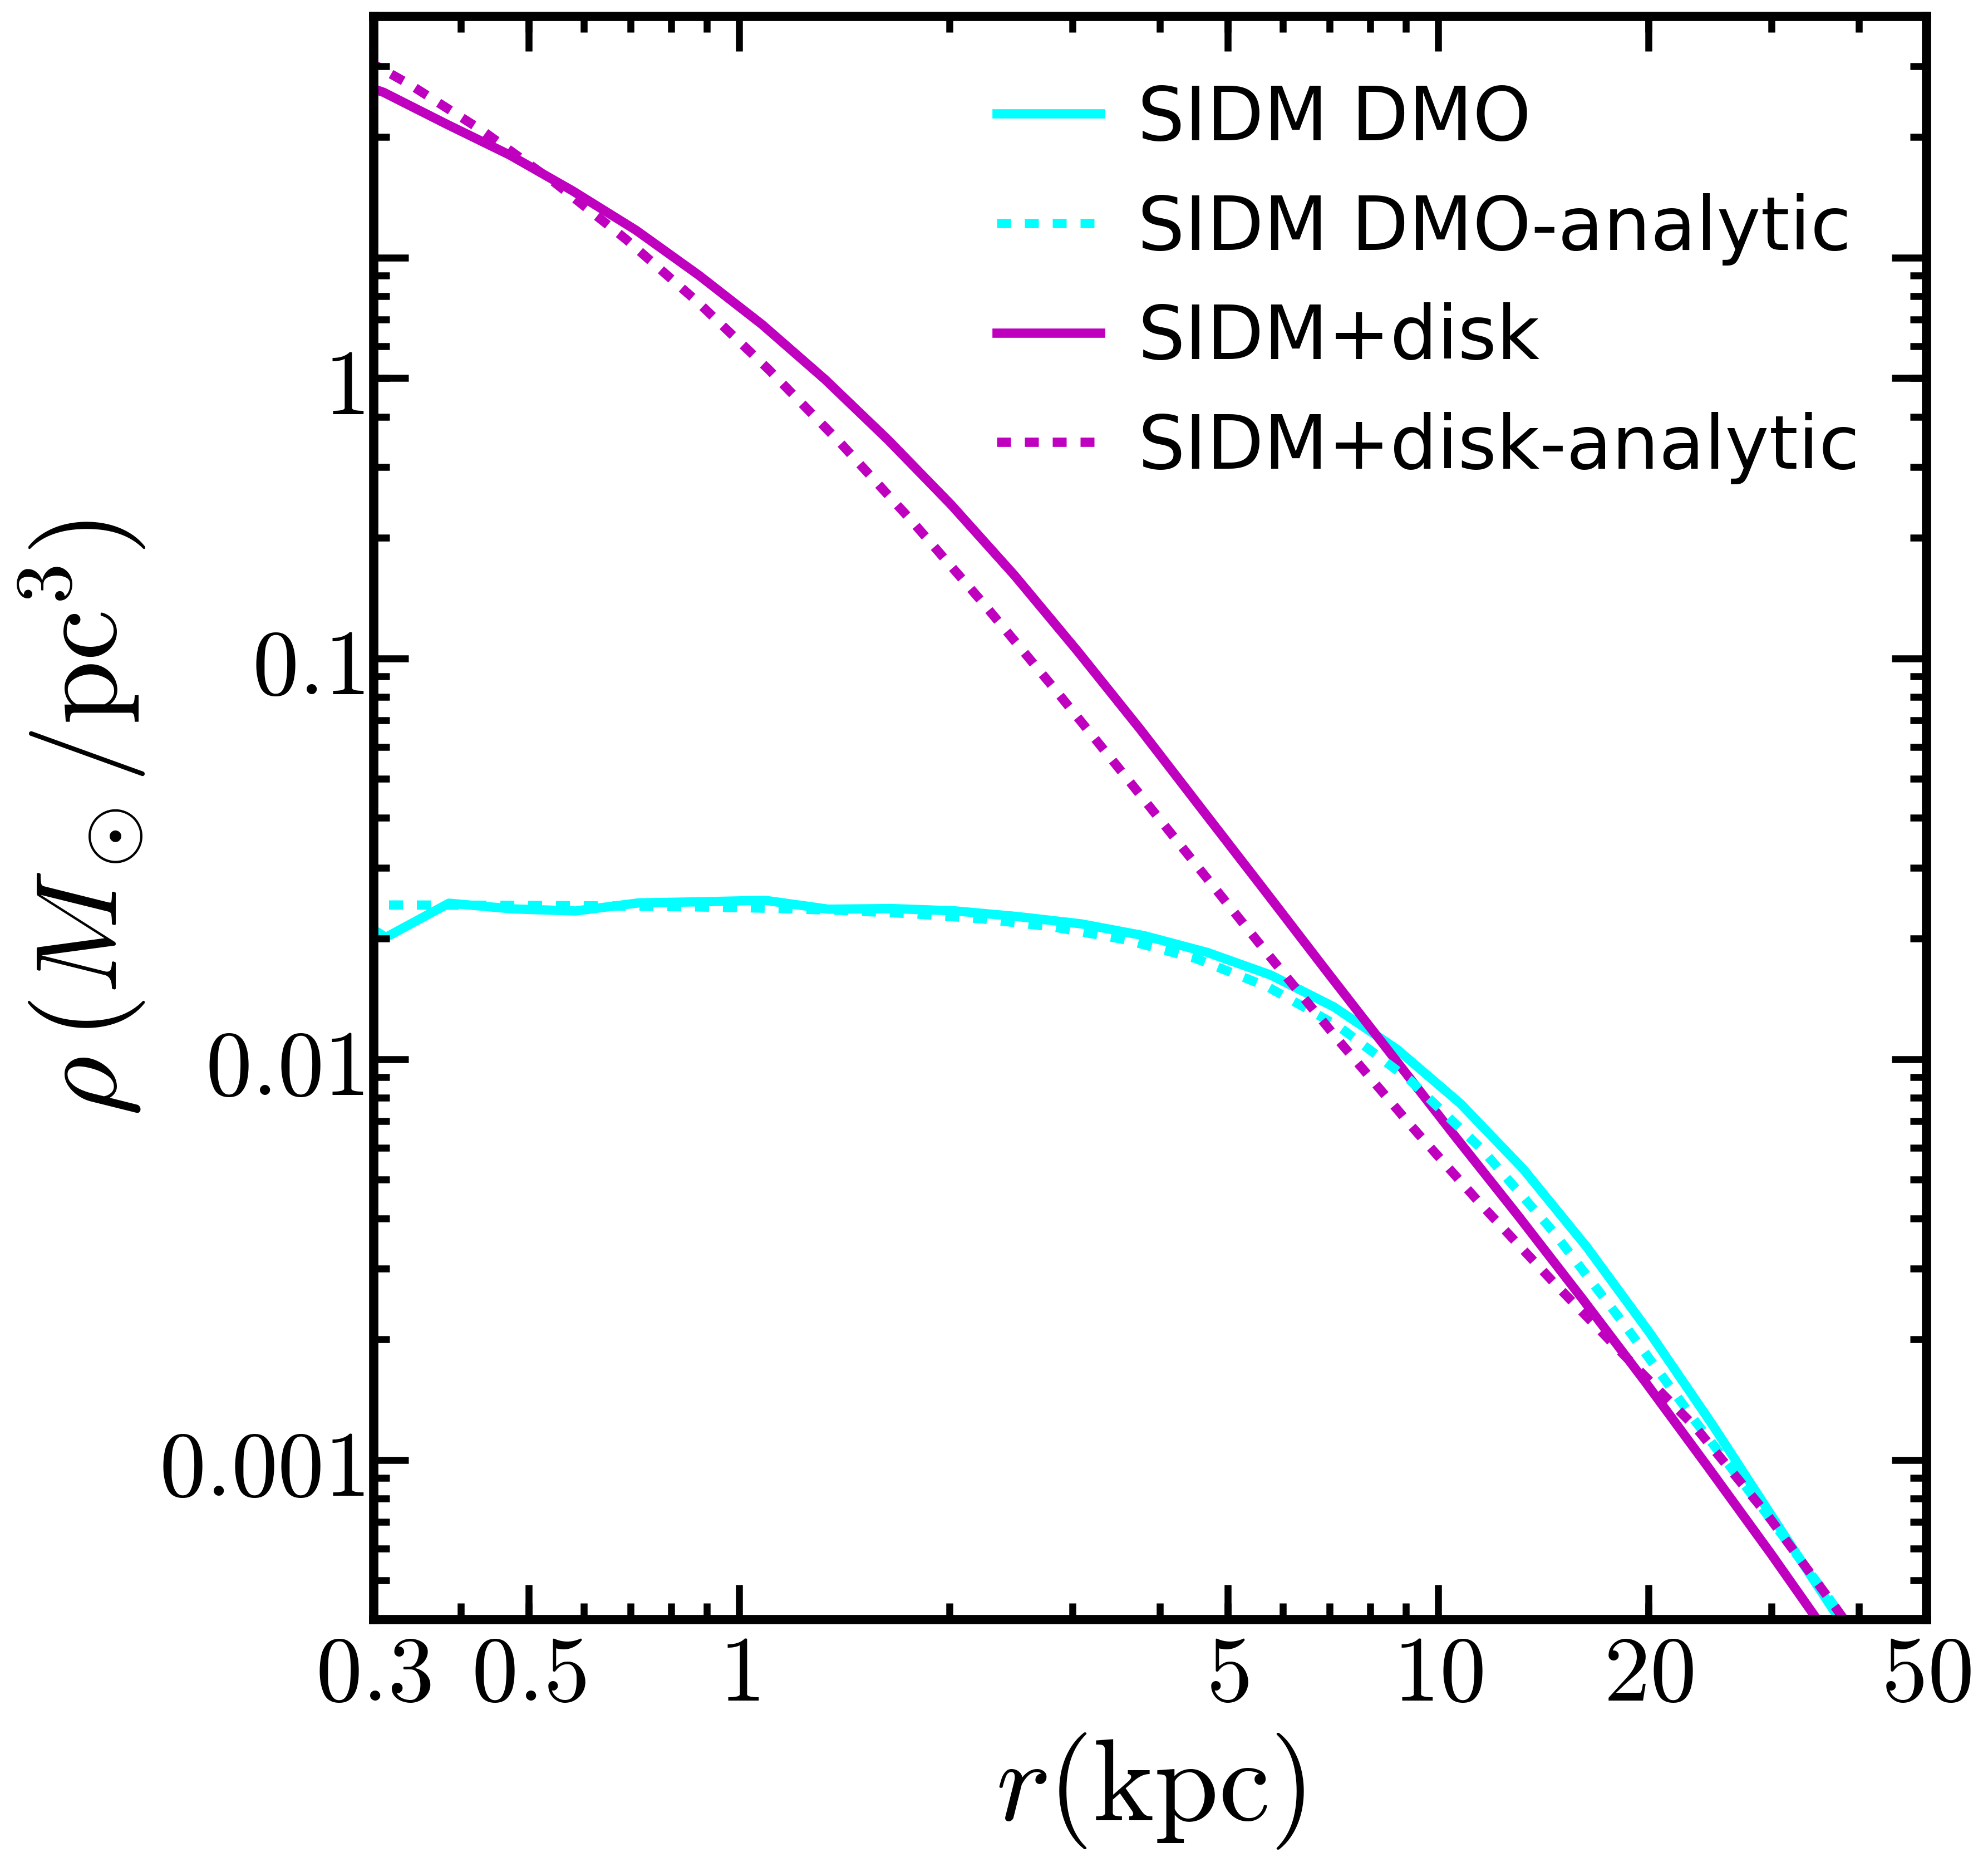
The inferred analytic profiles for the MW host from the SIDM simulations (DMO and with the embedded potential) are shown in Fig. 5 (dashed lines), and the simulation results are included for reference (solid lines). The profiles are obtained as described above by matching on to a NFW profile that is fit to the CDM simulation results at using the Colossus Python package. The agreement is remarkably good for both simulations (with and without the baryonic potential). When the bulge and disk are present, there is excellent agreement between the analytic and simulated profiles in the baryon-dominated region () and in the asymptotic DM-dominated regime (); in the transition region between these two regimes the fit is less good but still within about .
References
- Behroozi, Wechsler & Conroy (2013) Behroozi P. S., Wechsler R. H., Conroy C., 2013, ApJ, 770, 57
- Behroozi, Wechsler & Wu (2013) Behroozi P. S., Wechsler R. H., Wu H.-Y., 2013, The Astrophysical Journal, 762, 109
- Behroozi et al. (2013) Behroozi P. S., Wechsler R. H., Wu H.-Y., Busha M. T., Klypin A. A., Primack J. R., 2013, ApJ, 763, 18
- Bland-Hawthorn & Gerhard (2016) Bland-Hawthorn J., Gerhard O., 2016, Annual Review of Astronomy and Astrophysics, 54, 529
- Boylan-Kolchin, Bullock & Kaplinghat (2011) Boylan-Kolchin M., Bullock J. S., Kaplinghat M., 2011, MNRAS, 415, L40
- Boylan-Kolchin, Bullock & Kaplinghat (2012) —, 2012, MNRAS, 422, 1203
- Brooks & Zolotov (2014) Brooks A. M., Zolotov A., 2014, The Astrophysical Journal, 786, 87
- Creasey et al. (2017) Creasey P., Sameie O., Sales L. V., Yu H.-B., Vogelsberger M., Zavala J., 2017, Monthly Notices of the Royal Astronomical Society, 468, 2283
- Davé et al. (2001) Davé R., Spergel D. N., Steinhardt P. J., Wandelt B. D., 2001, ApJ, 547, 574
- Di Cintio et al. (2017) Di Cintio A., Tremmel M., Governato F., Pontzen A., Zavala J., Bastidas Fry A., Brooks A., Vogelsberger M., 2017, Monthly Notices of the Royal Astronomical Society, 469, 2845
- Elbert et al. (2015) Elbert O. D., Bullock J. S., Garrison-Kimmel S., Rocha M., Oñorbe J., Peter A. H. G., 2015, Monthly Notices of the Royal Astronomical Society, 453, 29
- Elbert et al. (2018) Elbert O. D., Bullock J. S., Kaplinghat M., Garrison-Kimmel S., Graus A. S., Rocha M., 2018, The Astrophysical Journal, 853, 109
- Fitts et al. (2017) Fitts A. et al., 2017, Monthly Notices of the Royal Astronomical Society, 471, 3547
- Fritz et al. (2018) Fritz T. K., Battaglia G., Pawlowski M. S., Kallivayalil N., van der Marel R., Sohn S. T., Brook C., Besla G., 2018, A&A, 619, A103
- Fry et al. (2015) Fry A. B. et al., 2015, Monthly Notices of the Royal Astronomical Society, 452, 1468
- Garrison-Kimmel et al. (2014) Garrison-Kimmel S., Boylan-Kolchin M., Bullock J. S., Kirby E. N., 2014, Monthly Notices of the Royal Astronomical Society, 444, 222
- Garrison-Kimmel et al. (2018) Garrison-Kimmel S. et al., 2018, ArXiv e-prints
- Garrison-Kimmel et al. (2017) Garrison-Kimmel S. et al., 2017, Monthly Notices of the Royal Astronomical Society, 471, 1709
- Hahn & Abel (2011) Hahn O., Abel T., 2011, Monthly Notices of the Royal Astronomical Society, 415, 2101
- Hernquist (1990) Hernquist L., 1990, ApJ, 356, 359
- Hopkins (2015) Hopkins P. F., 2015, Monthly Notices of the Royal Astronomical Society, 450, 53
- Kamada et al. (2017) Kamada A., Kaplinghat M., Pace A. B., Yu H.-B., 2017, Phys. Rev. Lett., 119, 111102
- Kaplinghat et al. (2014) Kaplinghat M., Keeley R. E., Linden T., Yu H.-B., 2014, Phys. Rev. Lett., 113, 021302
- Kaplinghat, Tulin & Yu (2016) Kaplinghat M., Tulin S., Yu H.-B., 2016, Phys. Rev. Lett., 116, 041302
- Katz & White (1993) Katz N., White S. D. M., 1993, ApJ, 412, 455
- Kelley et al. (2018) Kelley T., Bullock J. S., Garrison-Kimmel S., Boylan-Kolchin M., Pawlowski M. S., Graus A. S., 2018, arXiv e-prints
- Kirby et al. (2014) Kirby E. N., Bullock J. S., Boylan-Kolchin M., Kaplinghat M., Cohen J. G., 2014, Monthly Notices of the Royal Astronomical Society, 439, 1015
- Koch et al. (2007) Koch A., Kleyna J. T., Wilkinson M. I., Grebel E. K., Gilmore G. F., Evans N. W., Wyse R. F. G., Harbeck D. R., 2007, AJ, 134, 566
- Mateo, Olszewski & Walker (2008) Mateo M., Olszewski E. W., Walker M., 2008, The Astrophysical Journal, 675, 201
- McConnachie (2012) McConnachie A. W., 2012, The Astronomical Journal, 144, 4
- Miyamoto & Nagai (1975) Miyamoto M., Nagai R., 1975, PASJ, 27, 533
- Muñoz et al. (2005) Muñoz R. R. et al., 2005, ApJ, 631, L137
- Oñorbe et al. (2014) Oñorbe J., Garrison-Kimmel S., Maller A. H., Bullock J. S., Rocha M., Hahn O., 2014, Monthly Notices of the Royal Astronomical Society, 437, 1894
- Oman et al. (2015) Oman K. A. et al., 2015, Monthly Notices of the Royal Astronomical Society, 452, 3650
- Papastergis et al. (2015) Papastergis E., Giovanelli R., Haynes M. P., Shankar F., 2015, A&A, 574, A113
- Papastergis & Shankar (2016) Papastergis E., Shankar F., 2016, A&A, 591, A58
- Peter et al. (2013) Peter A. H. G., Rocha M., Bullock J. S., Kaplinghat M., 2013, Monthly Notices of the Royal Astronomical Society, 430, 105
- Planck Collaboration (2015) Planck Collaboration, 2015, AA, 594, A13
- Read, Walker & Steger (2018) Read J. I., Walker M. G., Steger P., 2018, MNRAS, 481, 860
- Ren et al. (2018) Ren T., Kwa A., Kaplinghat M., Yu H.-B., 2018, ArXiv e-prints
- Robertson, Massey & Eke (2017) Robertson A., Massey R., Eke V., 2017, MNRAS, 467, 4719
- Robertson et al. (2018) Robertson A. et al., 2018, MNRAS, 476, L20
- Robles et al. (2017) Robles V. H. et al., 2017, Monthly Notices of the Royal Astronomical Society, 472, 2945
- Rocha et al. (2013) Rocha M., Peter A. H. G., Bullock J. S., Kaplinghat M., Garrison-Kimmel S., Oñorbe J., Moustakas L. A., 2013, Monthly Notices of the Royal Astronomical Society, 430, 81
- Sameie et al. (2018) Sameie O., Creasey P., Yu H.-B., Sales L. V., Vogelsberger M., Zavala J., 2018, Monthly Notices of the Royal Astronomical Society, 479, 359
- Sawala et al. (2016) Sawala T. et al., 2016, Monthly Notices of the Royal Astronomical Society, 457, 1931
- Simon & Geha (2007) Simon J. D., Geha M., 2007, The Astrophysical Journal, 670, 313
- Smith et al. (2015) Smith R., Flynn C., Candlish G. N., Fellhauer M., Gibson B. K., 2015, MNRAS, 448, 2934
- Spergel & Steinhardt (2000) Spergel D. N., Steinhardt P. J., 2000, Phys. Rev. Lett., 84, 3760
- Springel, Frenk & M. (2006) Springel V., Frenk C. S., M. W. S. D., 2006, Nat, 440, 1137
- Tollerud, Boylan-Kolchin & Bullock (2014) Tollerud E. J., Boylan-Kolchin M., Bullock J. S., 2014, Monthly Notices of the Royal Astronomical Society, 440, 3511
- Trujillo-Gomez et al. (2011) Trujillo-Gomez S., Klypin A., Primack J., Romanowsky A. J., 2011, The Astrophysical Journal, 742, 16
- Tulin & Yu (2018) Tulin S., Yu H.-B., 2018, Physics Reports, 730, 1 , dark matter self-interactions and small scale structure
- Vogelsberger et al. (2014a) Vogelsberger M. et al., 2014a, Monthly Notices of the Royal Astronomical Society, 444, 1518
- Vogelsberger, Zavala & Loeb (2012) Vogelsberger M., Zavala J., Loeb A., 2012, MNRAS, 423, 3740
- Vogelsberger et al. (2014b) Vogelsberger M., Zavala J., Simpson C., Jenkins A., 2014b, Monthly Notices of the Royal Astronomical Society, 444, 3684
- Walker & Peñarrubia (2011) Walker M. G., Peñarrubia J., 2011, ApJ, 742, 20
- Wetzel et al. (2016) Wetzel A. R., Hopkins P. F., Ji-hoon K., Faucher-Giguere C.-A., Keres D., Quataert E., 2016, The Astrophysical Journal Letters, 827, L23
- Wolf et al. (2010) Wolf J., Martinez G. D., Bullock J. S., Kaplinghat M., Geha M., Muñoz R. R., Simon J. D., Avedo F. F., 2010, MNRAS, 406, 1220
- Zavala, Vogelsberger & Walker (2013) Zavala J., Vogelsberger M., Walker M. G., 2013, MNRAS, 431, L20
- Zolotov et al. (2012) Zolotov A. et al., 2012, The Astrophysical Journal, 761, 71