Selective Exposure shapes the Facebook News Diet
Abstract
The social brain hypothesis fixes to 150 the number of social relationships we are able to maintain. Similar cognitive constraints emerge in several aspects of our daily life, from our mobility up to the way we communicate, and might even affect the way we consume information online. Indeed, despite the unprecedented amount of information we can access online, our attention span still remains limited. Furthermore, recent studies showed the tendency of users to ignore dissenting information but to interact with information adhering to their point of view. In this paper, we quantitatively analyze users’ attention economy in news consumption on social media by analyzing 14M users interacting with 583 news outlets (pages) on Facebook over a time span of 6 years. In particular, we explore how users distribute their activity across news pages and topics. We find that, independently of their activity, users show the tendency to follow a very limited number of pages. On the other hand, users tend to interact with almost all the topics presented by their favored pages. Finally, we introduce a taxonomy accounting for users behavior to distinguish between patterns of selective exposure and interest.
Our findings suggest that segregation of users in echo chambers might be an emerging effect of users’ activity on social media and that selective exposure – i.e. the tendency of users to consume information interest coherent with their preferences – could be a major driver in their consumption patterns.
I Introduction
The social brain hypothesis fixes to 150 the number of social relationships we are able to maintain dunbar1998social ; dunbar1992neocortex . Such a theoretical cognitive limit emerges in several other contexts dunbar2012social from the patterns of human mobility alessandretti2018evidence up to the way we communicate saramaki2014persistence ; goncalves2011validation . Furthermore, the uptake of social media radically changed the way we consume content online. Indeed, the way we consume information and the cognitive limits and algorithmic mechanisms underpinning them bears on foundational issues concerning our news consumption patterns. As a consequence, in 2017 the World Economic Forum raised a warning on the potential of social media to distort the perception of reality111http://reports.weforum.org/global-risks-2017/part-2-social-and-political-challenges/2-1-western-democracy-in-crisis/; possibly, such risk is related to the fact that social media induced a paradigm shift in the way we consume information carlson2018facebook ; quattrociocchi2014opinion . Along this path, recent studies targeting Facebook zollo2017debunking ; del2016spreading ; bakshy2015exposure showed that content consumption is dominated by selective exposure – i.e., the tendency of users to ignore dissenting information and to interact with information adhering to their preferred narrative.
Selective exposure may lead to the emergence of echo-chambers bastos2018geographic ; del2016echo – i.e., groups of like-minded people cooperating to frame and reinforce a shared narrative – thus facilitating fake news and more generally misinformation cascades mocanu2015collective ; bessi2015science , especially since we switched from a paradigm where information was supplied by few official news sources mediated by experts and/or journalists, to the current disintermediated environment composed by a heterogeneous mass of information sources. Social media play a pivotal role not only in our social lives, but also in the political and civic world, coming to such an extent that they have rapidly become the main information source for many users sehl2016public . Essentially, online confirmation bias seems to account for users’ decisions about consuming and spreading content; at the same time, the aggregation of favored information within those communities reinforces selective exposure and group polarization sunstein2002law ; quattrociocchi2017inside .
Several works addressed the dynamics of news consumption through social media allcott2017social ; oeldorf2015posting ; del2017mapping and explored the interplay between selective exposure and political polarization on the Internet garrett2009politically ; garrett2009echo . Focusing on news consumption on social media, in schmidt2017anatomy the authors find that users’ consumption patterns seem to determine the emergence of a sharp community structure among news outlets. Nowadays, the understanding of the impact of social media on the news business model is one of the most pressing challenges for both science and society flaxman2016filter ; garimella2018quantifying ; burgess2018youtube .
In this paper, we perform a thorough quantitative analysis to characterize users’ attention dynamics on news outlets on Facebook. In particular, we study how 14 million Facebook users distribute their activity among 50000 posts, clustered by topics, produced by 583 pages listed by the European Media Monitor on a 6 years time span. We find that users, independently of their activity and of the time they spend online, show a tendency to interact with a very limited number of news outlets. To test the presence of selective exposure, whose evidence emerges from users focusing their attention on a set of preferred news sources, we analyze how homogeneously users distribute their activity across pages and topics. More precisely, the concentration of the distribution of likes towards a certain page or topic signals the presence of selective exposure, while the heterogeneity of such a distribution determines the strength of selective exposure. We find that highly engaged users tend to concentrate their activity on few pages while being less selective to the topics presented by the pages. In general, we observe that selective exposure increases in strength when the activity of users (i.e. the number of likes) grows but is not affected by users’ lifetime (i.e. the time span between the first and the last like). Finally, we provide a taxonomy to classify users by means of their consumption patterns. Our results suggest that the tendency of users to limit their attention on few news sources might be one of the factors behind the emergence of echo chambers online. The emerging outcome still underlines the tendency of users towards segregation, partly because of their attitude and cognitive limits, and partly because of the features of the social media in which they operate.
The paper is structured as follows. First, we describe the way users interact with posts, pages and topics, characterizing their news consumption habits. Then, we analyze users’ attention patterns on pages and topics and discuss the mechanism of selective exposure as a quantitative heterogeneity problem. Finally, we conclude the paper by outlining a taxonomy of the users based on the comparison between their attention patterns with respect to pages and topics.
II Results and Discussion
II.1 Users’ News Consumption
News appear on Facebook as posts and users can interact with such posts through different actions, namely likes, comments and shares. A like is usually a positive feedback on a news item. A share indicates a desire to spread a news item to friends. A comment can have multiple features and meanings and can generate collective debate. Since our aim is to investigate the mechanism of selective exposure we focus our analysis on the likes of the users, i.e on their positive feedback towards certain posts. As shown in previous works schmidt2017anatomy , likes are a good proxy of the users’ activity in terms of engagement and attention patterns.
The interaction between users and posts can be represented as a bipartite network , undirected and unweighted, in which the first partition has elements (corresponding to the users) while the second partition has elements (corresponding to the pages). The matrix representing such bipartite network is binary since a user is allowed to put one like per post; thus, we have if user likes post , otherwise. Given , the activity – i.e. the number of likes – of the user can be quantified by his/her degree .
In order to investigate the relationship between user and pages, from the bipartite network we obtain a second bipartite network with users and pages called , in which posts are simply grouped by the page that generated them. On such a network the activity of the user remains unchanged and the number of likes of user to page can be obtained as .
Additionally, the posts of the user-post network can be also grouped by the topic they treat using a topic modeling algorithm gerlach2018network as described in Section IV. Aggregating by topic, we generate a third bipartite network called with users and topics. A post can be considered a mixture of topics, all appearing in a certain proportion, and the weighted bipartite network is represented by the matrix in which the weight of each element is proportional to the overall presence of a certain topic in the posts liked by a certain user (see in Section IV). Using we can study the activity of users with respect to different topics. A pictorial representation of the activity of the user and the relationship between posts, pages and topics in reported in Figure 1.
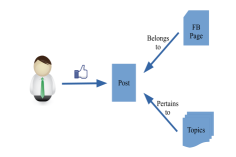
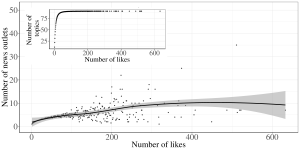
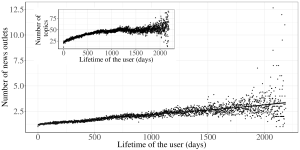
Figure 2 shows the average number of pages liked by users with respect to their activity and lifetime, whereas the former is defined as the number of likes of the user and the latter as the time span between the first and the last like a user put on two different posts. In Figure 2 (left) we observe the relationship between the users’ activity and the number of pages they interact with. We notice that the average number of pages liked by a user reaches a plateau with increasing activity; in particular, users with more than likes concentrate, on average, their activity on only pages (for further details, see SI). This may be due to different – an possibly co-interacting – factors, such as the different narratives adopted by the pages in order to report information, the presence of natural limits to attention of the users, or even to the filtering due to the ranking algorithms used in the information search.
To define the topics of the posts, we first pre-process the posts to extract the set of meaningful words (see sec.IV) and then define the bipartite network that links each post to the words used in the post. We then apply the hierarchical stochastic block-modeling algorithm of gerlach2018network (a well assessed topic modeling algorithm that takes a bipartite network as input) on to detect the topics and find different topics (see section IV). We observe that, since the analyzed pages are news outlets, most pages tend to cover almost all the topics (see SI).
The inset in Figure 2 (left) shows the number of topics an user interacts with respect to his/her activity. At difference from what observed in the interaction with pages, users tend to interact with many topics regardless of their activity. In particular, users with more than likes already tend to interact with almost all the topics. Such a interaction patterns could be explained assuming that users tend to interact with all the topics presented by their reference pages.
In Figure 2 (right) we notice that average number of pages users interact with grows slowly with the users’ lifetime. However, the average number of topics reaches a plateau corresponding to of the overall topics for users with a lifetime larger than days.
II.2 Attention Patterns on Topics
Selective exposure relates to the tendency of users to concentrate their activity on specific topics or pages while ignoring other ones. For instance, a user who focuses his/her activity on a single topic (or page) would display higher selective exposure than a user who interacts with multiple topics. Focusing on a single topic rather than on different ones entails an heterogeneity in the distribution of the user’s activity that can be directly associated with the mechanism of selective exposure.
Therefore, a good proxy to selective exposure is a measure able to quantify heterogeneity in the distribution of users’ activity across different elements, namely topics or pages.
The Gini index gini1921measurement is a classic example of synthetic indicator for measuring inequality of social and economic conditions xu2003has ; hence, to give a measure of selective exposure, we apply the Gini index on the users’ activity on different topics as stored on the rows of the weighted incidence matrix . Notice that, consistently with the use of a state of the art topic modeling algorithm gerlach2018network , a post is considered a mixture of topics all appearing in different proportions. Consequently, the interaction of a user with multiple topics, that derives from liking one or more posts treating that topics, is still consistent with a mixed membership model airoldi2014handbook .
The Gini index can be defined starting from the Gini absolute mean difference kendall1958theadvanced of a generic vector with elements that can be written as:
| (1) |
The relative mean difference is consequently defined as where . Thus, the relative mean difference equals the absolute mean difference divided by the mean of the vector . The Gini index is one-half of the Gini relative mean difference anand1983inequality
| (2) |
We estimate the strength of selective exposure of user to topics using, accordingly to Equation 2, using the following expression of the Gini index:
| (3) |
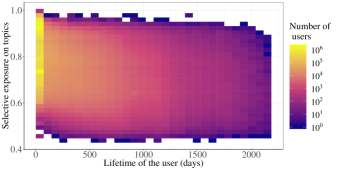
Values of signal that the user concentrates his/her activity on few topics, while values of signal the tendency to be active on different topics. In Figure 3, we show the strength of selective exposure (as measured by the Gini index ) with respect to the users’ activity and lifetime. We observe that to increasing values of activity corresponds a progressively weaker selective exposure; on the other hand, users’ lifetime does not show strong correlations with their focus on specific topics. This result is consistent with the fact that Facebook pages tend to span several topics (see SI) and that highly active users are more likely to consume a wider amount of topics, thus decreasing their selective exposure to topics. In fact, even if users never get to a flat ”diet” on topics (corresponding to a Gini index ), we note that users consume more topics with increasing activity, i.e. most active users are those with the weaker selective exposure to topics.
II.3 Attention Patterns on Pages
To understand whether the mechanism of selective exposure to pages – if present – could be different from that observed for topics, we replicate the analysis of Section II.2 by considering the matrix , i.e. considering the interaction of users with news outlets (pages).
In this case, the expression for the Gini index of the user with respect to pages he/she likes is:
| (4) |
However, applying the Gini index to our dataset would introduce a bias due to the sparsity of the matrix . In fact, we have many users whose activity is smaller than the number of pages (i.e. the sum of the entries of a row of is often much smaller than than the number of columns ). In such cases, the Gini index displays a bias towards high values bernasco2017more of (see SI) since the denominator of Equation 4 is small and the possibility of perfect equidistribution – i.e. the same number of likes on each page – cannot be achieved. Therefore, to avoid such flaw of the Gini index in the case of sparse data, we renormalize the Gini index according to the minimum and maximum values it can assume :
| (5) |
where is the maximum value of the Gini coefficient, while is the minimum value of the Gini coefficient. As shown in Section IV.3, depends on the number of likes and the number of pages ; when , due to the ”not enough data bias” we have that . Thus, the quantification of selective exposure can be assessed using the normalized Gini index as in Equation 5.
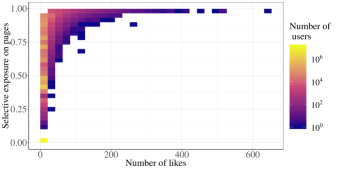
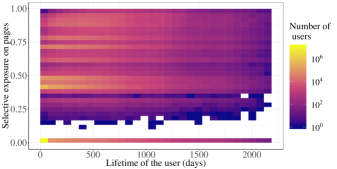
In Figure 4 we observe that the mechanism of selective exposure is present also in the case of pages, but with a completely different trend than what observed in the case of topics. In fact, we observe that to increasing values of activity correspond a concentration of users toward high values of , i.e. users’ selective exposure to pages increases. On the other hand, users’ lifetimes do not show strong correlations with ; hence, the mechanism of choice of pages does not seem to be influenced by the time users has been present on the medium. Such results are consistent with a way of choosing news outlets based on selective exposure rather than on confrontation among several sources; it is also consistent with a reinforcement mechanism for which the higher the activity, the stronger the concentration on fewer pages. In other words, we observe that users, especially the most active, tend to affiliate to pages and to their narratives regardless of the topics they treat. What appears is that the consumption of news depends on very few sources of information and could be almost independent on the subjects treated.
II.4 Comparing Activity on Pages and Topics
In this section we compare the two mechanisms of selective exposure. Indeed, users can display different profiles of selective exposure with respect to pages and topics and the knowledge of both dimensions can be helpful in order to characterize their attention patterns on social media.
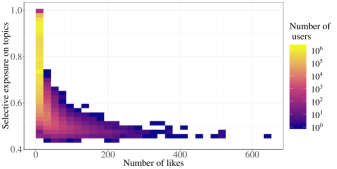
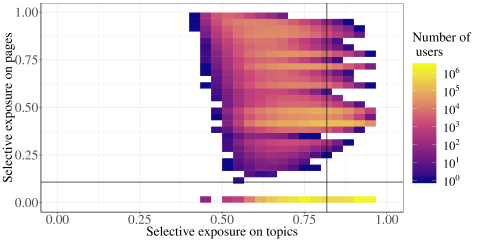
In Figure 5, by combining the results related to users’ selective exposure to both pages and topics, we report different classes of users based on their statistical signatures. Users can be classified in three classes that are related to a specific type of selective exposure:
-
•
Multi-topic selective exposure: high selective exposure to pages and low selective exposure to topics. Users in the region of multi-topic selective exposure are affiliated to one or few pages while spanning many topics.
-
•
Single topic selective exposure: high selective exposure to pages and high selective exposure to topics. Users in the region of single-topic selective exposure are affiliated to one or few pages but they tend to focus their attention on specific contents.
-
•
Exposure by Interest: low selective exposure to pages and high selective exposure to topics. Users in the region of interest are not affiliated to pages but browse different sources consuming the contents they are interested in.
Figure 5 is divided in four regions determined by the average values of selective exposure to pages and topics. Notice that the region of high selective exposure to topics / low selective exposure of pages corresponds mostly to users with very few likes; for such users the statistics is too low for assessing their interaction mechanisms with the social medium.
The region of multi-topic selective exposure is located top-left, the region of single-topic selective exposure is located top-right while the region of exposue by interest is located bottom right. In Figure 5 we observe that the largest fraction of users are located in the region of multi-topic selective exposure, accordingly with the fact that users tend to display a high selective exposure to pages and a low selective exposure to topics. The users with highest selective exposure to pages are also those with the highest activity (see Figure 4 and SI). Other users are located in the region of single-topic selective exposure meaning that they tend to focus on few pages and topics. We note that such users, having a high selective exposure to topics, also display an average activity that is lower than that of users in the region of multi-topic selective exposure (see Figure 3 and SI).
The region of exposure by interest is well populated, however in such a region (as well as the fourth region located bottom left) the characterization of the behavior has to be carefully considered, since users users with low selective exposure to pages are also those with the lowest activity (see Figure 3, 4 and SI).
III Conclusions
In this paper we explored the news diet of users on social media. The economy of attention on social media is characterized by different features, one of which is selective exposure. Analyzing the interaction between 14 millions users and 583 news outlets, we find that users tend to interact with a very limited maximum amount of pages and that, similarly to a Dunbar number, it does not depend on their activity or lifetime. We find different features in the mechanism of selective exposure to pages respect to the mechanism of selective exposure to topics. In particular, the probability of finding users with high selective exposure to pages increases with the users’ activity, while in the case of topics, selective exposure decreases with activity. However, in both cases the lifetime of the user has no particular influence on the mechanism of selective exposure.
By confronting the mechanisms of selective exposure to pages and topics, it is possible to differentiate between users’ attention patterns to understand whether they are driven by selective exposure or interest. Our findings suggest that the mechanism of selective exposure, together with users’ limits to attention, strongly affects the way users select and consume news, and is likely to play a role in the segregation process that leads to the formation of echo chambers. Further studies and datasets would be needed to investigate whether is the presentation priority of the news due to the Facebook algorithm is significantly relevant for the choice of news sources selected.
IV Materials and Methods
IV.1 Topic Modeling Algorithm
Topic modeling consists in the application of machine learning tools to infer the latent topical structure of a collection of documents.
Well-established and widely used topic models are probabilistic models, such as probabilistic Latent Semantic Analysis (pLSA) hofmann1999probabilistic and Latent Dirichlet Allocation (LDA) blei2003latent , an improvement of pLSA that exploits Bayesian statistics), where each document is a mixture of topics while each topic is a mixture of words. Despite being the state of the art method for topic modeling, LDA suffers of several restrictions such as the risk of overfitting and the aprioristic choice of the number of topics gerlach2018network , among others griffiths2005integrating ; li2006pachinko ; zhou2015negative . Such shortcomings of LDA have been recently addressed gerlach2018network by exploiting the conceptual relationship between topic modeling and community detection in networks.
By representing the relationship between words and documents (posts in our case) as a bipartite network, the algorithm proposed by gerlach2018network detects communities (i.e. cluster of densely interconnected nodes) using a hierarchical Stochastic Block Modeling (hSBM) algorithm peixoto2014hierarchical ; peixoto2015model ; peixoto2017nonparametric . The hSBM is a hierarchical version of the stochastic block model (SBM), a generative method for networks with block structure (i.e. communities) that serves as a base for community detection using statistical inference holland1983stochastic ; moore2017computer .
In gerlach2018network a comparison between topic modeling and community detection algorithms, namely pLSA and SBM and LDA and hSBM, is carried on in order to demonstrate the suitability of hSBM for topic modeling problems. In particular, a mixed membership version of the SBM is formally proven to be equivalent to pLSA while the hSBM is shown to be conceptually similar to LDA. In fact, hSBM represents a non parametric bayesian improvement of the SBM in the same way LDA is an improvement of pLSA based on bayesian statistics.
IV.2 Data Processing and Topic Modeling
In our paper we exploit the hSBM algorithm for topic modeling on a bipartite network in which one partition is made up of 50000 pre-processed Facebook posts while the other is made up of the words contained in such posts. The raw Facebook posts that we consider are produced by a set of 583 news outlets. Such posts often include a link to an external website containing an article whose .html file is downloaded, parsed and reported as part of the raw post. The raw posts are then processed in the following way: punctuation and stopwords are removed, words are lemmatised, part of speech tagging is executed keeping only nouns, posts with less than 5 words are removed.
After processing the text we run the hSBM algorithm on the considered network obtaining a hierarchy of topics with 5 levels, as displayed in Figure 6.
From the hierarchical structure of the topics we select the third level, containing 91 topics, for interpretability reasons. According to the results of the topic modeling algorithm each topic is present in each post in a certain proportion and .
In order to count the amount of topics related to each post (as displayed in the inset of Figure 2) we binarize the outcome of the topic modeling as follows. We assume that a post treats a topic if that post is associated to the topic more than the average association across all the considered posts, i.e. . Consequently a topic is considered in the pool of topics liked by the user if he/she liked at least one post that contains the topic .
IV.3 Minimum Gini coefficient
For simplicity, let’s calculate the minimum value a Gini coefficient can attain by considering an user that puts likes on pages. In this case, our Gini coefficient can be written as
| (6) |
If the user has an overall activity greater than the number of pages, the coefficient since a homogeneous distribution of likes across pages is allowed. On the other hand, when the overall number of likes is smaller than the number of pages, then the minimum value of the Gini index is in general greater than 0, since the likesa are concentrated only on pages, i.e. the distribution of likes is heterogeneous. Again, in this case we can compute the lower bound to the Gini index, by supposing that the user spreads uniformly his/her likes over pages (by putting 1 like per page); by substituting in eq.4, we obtain
| (7) |
, where is the number of likes of the user. Summarising, the coefficient can be written as:
| (8) |
IV.4 Data Collection
The Europe Media Monitor provides a list of all news sources. We limit our collection to Facebook pages associated to such sources reporting in English. The downloaded data from each page include all of the posts made from January 1, 2010 to December 31, 2015, as well as all of the likes and comments on those posts. In this paper we consider a sample of the original dataset made up of 50000 posts produced by 583 pages spanning the 6 years time window.
References
- (1) Edoardo M Airoldi, David Blei, Elena A Erosheva, and Stephen E Fienberg. Handbook of mixed membership models and their applications. CRC press, 2014.
- (2) Laura Alessandretti, Piotr Sapiezynski, Vedran Sekara, Sune Lehmann, and Andrea Baronchelli. Evidence for a conserved quantity in human mobility. Nature Human Behaviour, 2(7):485, 2018.
- (3) Hunt Allcott and Matthew Gentzkow. Social media and fake news in the 2016 election. Journal of economic perspectives, 31(2):211–36, 2017.
- (4) Sudhir Anand. Inequality and poverty in Malaysia: Measurement and decomposition. The World Bank, 1983.
- (5) Eytan Bakshy, Solomon Messing, and Lada A Adamic. Exposure to ideologically diverse news and opinion on facebook. Science, 348(6239):1130–1132, 2015.
- (6) Marco Bastos, Dan Mercea, and Andrea Baronchelli. The geographic embedding of online echo chambers: Evidence from the brexit campaign. PloS one, 13(11):e0206841, 2018.
- (7) Wim Bernasco and Wouter Steenbeek. More places than crimes: Implications for evaluating the law of crime concentration at place. Journal of quantitative criminology, 33(3):451–467, 2017.
- (8) Alessandro Bessi, Mauro Coletto, George Alexandru Davidescu, Antonio Scala, Guido Caldarelli, and Walter Quattrociocchi. Science vs conspiracy: Collective narratives in the age of misinformation. PloS one, 10(2):e0118093, 2015.
- (9) David M Blei, Andrew Y Ng, and Michael I Jordan. Latent dirichlet allocation. Journal of machine Learning research, 3(Jan):993–1022, 2003.
- (10) Jean Burgess and Joshua Green. YouTube: Online video and participatory culture. John Wiley & Sons, 2018.
- (11) Matt Carlson. Facebook in the news: Social media, journalism, and public responsibility following the 2016 trending topics controversy. Digital Journalism, 6(1):4–20, 2018.
- (12) Michela Del Vicario, Alessandro Bessi, Fabiana Zollo, Fabio Petroni, Antonio Scala, Guido Caldarelli, H Eugene Stanley, and Walter Quattrociocchi. The spreading of misinformation online. Proceedings of the National Academy of Sciences, 113(3):554–559, 2016.
- (13) Michela Del Vicario, Gianna Vivaldo, Alessandro Bessi, Fabiana Zollo, Antonio Scala, Guido Caldarelli, and Walter Quattrociocchi. Echo chambers: Emotional contagion and group polarization on facebook. Scientific reports, 6:37825, 2016.
- (14) Michela Del Vicario, Fabiana Zollo, Guido Caldarelli, Antonio Scala, and Walter Quattrociocchi. Mapping social dynamics on facebook: The brexit debate. Social Networks, 50:6–16, 2017.
- (15) Robin IM Dunbar. Neocortex size as a constraint on group size in primates. Journal of human evolution, 22(6):469–493, 1992.
- (16) Robin IM Dunbar. The social brain hypothesis. Evolutionary Anthropology: Issues, News, and Reviews: Issues, News, and Reviews, 6(5):178–190, 1998.
- (17) Robin IM Dunbar. Social cognition on the internet: testing constraints on social network size. Philosophical Transactions of the Royal Society B: Biological Sciences, 367(1599):2192–2201, 2012.
- (18) Seth Flaxman, Sharad Goel, and Justin M Rao. Filter bubbles, echo chambers, and online news consumption. Public opinion quarterly, 80(S1):298–320, 2016.
- (19) Kiran Garimella, Gianmarco De Francisci Morales, Aristides Gionis, and Michael Mathioudakis. Quantifying controversy on social media. ACM Transactions on Social Computing, 1(1):3, 2018.
- (20) R Kelly Garrett. Echo chambers online?: Politically motivated selective exposure among internet news users. Journal of Computer-Mediated Communication, 14(2):265–285, 2009.
- (21) R Kelly Garrett. Politically motivated reinforcement seeking: Reframing the selective exposure debate. Journal of Communication, 59(4):676–699, 2009.
- (22) Martin Gerlach, Tiago P Peixoto, and Eduardo G Altmann. A network approach to topic models. Science advances, 4(7):eaaq1360, 2018.
- (23) Corrado Gini. Measurement of inequality of incomes. The Economic Journal, 31(121):124–126, 1921.
- (24) Bruno Goncalves, Nicola Perra, and Alessandro Vespignani. Validation of dunbar’s number in twitter conversations. arXiv preprint arXiv:1105.5170, 2011.
- (25) Thomas L Griffiths, Mark Steyvers, David M Blei, and Joshua B Tenenbaum. Integrating topics and syntax. In Advances in neural information processing systems, pages 537–544, 2005.
- (26) Thomas Hofmann. Probabilistic latent semantic analysis. In Proceedings of the Fifteenth conference on Uncertainty in artificial intelligence, pages 289–296. Morgan Kaufmann Publishers Inc., 1999.
- (27) Paul W Holland, Kathryn Blackmond Laskey, and Samuel Leinhardt. Stochastic blockmodels: First steps. Social networks, 5(2):109–137, 1983.
- (28) Maurice G Kendall and Alan Stuart. TheAdvanced Theory of Statistics, Vol. 1, DistributionTheory. New York: Hafner Publishing Company, 1958.
- (29) Wei Li and Andrew McCallum. Pachinko allocation: Dag-structured mixture models of topic correlations. In Proceedings of the 23rd international conference on Machine learning, pages 577–584. ACM, 2006.
- (30) Delia Mocanu, Luca Rossi, Qian Zhang, Marton Karsai, and Walter Quattrociocchi. Collective attention in the age of (mis) information. Computers in Human Behavior, 51:1198–1204, 2015.
- (31) Cristopher Moore. The computer science and physics of community detection: Landscapes, phase transitions, and hardness. arXiv preprint arXiv:1702.00467, 2017.
- (32) Anne Oeldorf-Hirsch and S Shyam Sundar. Posting, commenting, and tagging: Effects of sharing news stories on facebook. Computers in Human Behavior, 44:240–249, 2015.
- (33) Tiago P Peixoto. Hierarchical block structures and high-resolution model selection in large networks. Physical Review X, 4(1):011047, 2014.
- (34) Tiago P Peixoto. Model selection and hypothesis testing for large-scale network models with overlapping groups. Physical Review X, 5(1):011033, 2015.
- (35) Tiago P Peixoto. Nonparametric bayesian inference of the microcanonical stochastic block model. Physical Review E, 95(1):012317, 2017.
- (36) Walter Quattrociocchi. Inside the echo chamber. Scientific American, 316(4):60–63, 2017.
- (37) Walter Quattrociocchi, Guido Caldarelli, and Antonio Scala. Opinion dynamics on interacting networks: media competition and social influence. Scientific reports, 4:4938, 2014.
- (38) Jari Saramäki, Elizabeth A Leicht, Eduardo López, Sam GB Roberts, Felix Reed-Tsochas, and Robin IM Dunbar. Persistence of social signatures in human communication. Proceedings of the National Academy of Sciences, 111(3):942–947, 2014.
- (39) Ana Lucía Schmidt, Fabiana Zollo, Michela Del Vicario, Alessandro Bessi, Antonio Scala, Guido Caldarelli, H Eugene Stanley, and Walter Quattrociocchi. Anatomy of news consumption on facebook. Proceedings of the National Academy of Sciences, 114(12):3035–3039, 2017.
- (40) Annika Sehl, Alessio Cornia, and Rasmus Kleis Nielsen. Public service news and digital media. Reuters Institute Reports, 2016.
- (41) Cass R Sunstein. The law of group polarization. Journal of political philosophy, 10(2):175–195, 2002.
- (42) Kuan Xu. How has the literature on gini’s index evolved in the past 80 years? Dalhousie University, Economics Working Paper, 2003.
- (43) Mingyuan Zhou and Lawrence Carin. Negative binomial process count and mixture modeling. IEEE Transactions on Pattern Analysis and Machine Intelligence, 37(2):307–320, 2015.
- (44) Fabiana Zollo, Alessandro Bessi, Michela Del Vicario, Antonio Scala, Guido Caldarelli, Louis Shekhtman, Shlomo Havlin, and Walter Quattrociocchi. Debunking in a world of tribes. PloS one, 12(7):e0181821, 2017.