The host galaxy of GRB 980425 / SN1998bw: a collisional ring galaxy
Abstract
We report Giant Metrewave Radio Telescope (GMRT) , Very Large Telescope (VLT) and Spitzer Space Telescope observations of ESO 184G82, the host galaxy of GRB 980425/SN 1998bw, that yield evidence of a companion dwarf galaxy at a projected distance of 13 kpc. The companion, hereafter GALJ193510-524947, is a gas-rich, star-forming galaxy with a star formation rate of , a gas mass of , and a stellar mass of . The interaction between ESO 184G82 and GALJ193510-524947 is evident from the extended gaseous structure between the two galaxies in the GMRT Hi 21 cm map. We find a ring of high column density Hi gas, passing through the actively star forming regions of ESO 184G82 and the GRB location. This ring lends support to the picture in which ESO 184G82 is interacting with GALJ193510-524947. The massive stars in GALJ193510-524947 have similar ages to those in star-forming regions in ESO 184G82, also suggesting that the interaction may have triggered star formation in both galaxies. The gas and star formation properties of ESO 184G82 favour a head-on collision with GALJ193510-524947 rather than a classical tidal interaction. We perform state-of-the art simulations of dwarf–dwarf mergers and confirm that the observed properties of ESO 184G82 can be reproduced by collision with a small companion galaxy. This is a very clear case of interaction in a gamma ray burst host galaxy, and of interaction-driven star formation giving rise to a gamma ray burst in a dense environment.
keywords:
gamma-ray burst: general – galaxies: ISM – galaxies: star formation – galaxies: kinematics and dynamics – galaxies: interactions – radio lines: galaxies1 Introduction
Long duration Gamma Ray Bursts (GRBs) are luminous explosions in the Universe, with powerful energy releases that make them detectable back to when the first stars and galaxies were formed (e.g., Tanvir et al., 2009). For a few seconds, these extremely bright explosions release the energy that our Sun emits in its whole lifetime (see Piran et al., 2013). Their short durations (a few seconds to minutes) and enormous energy releases can be explained by radiation from highly relativistic outflowing particles with Lorentz factors (see Piran, 2004, and references therein). Such outflowing jets can be powered by rotational energy tapped from the compact remnants, magnetars or black holes, of the core-collapse of massive stars (Usov, 1992; Woosley, 1993; MacFadyen & Woosley, 1999; Aloy et al., 2000; Zhang et al., 2003, 2004; Yoon & Langer, 2005; Woosley & Heger, 2006). This is observationally supported by the occurrence of GRBs in actively star-forming regions, which links GRB formation to massive stars (Paczyński, 1998; Fynbo et al., 2000; Bloom et al., 2002; Le Floc’h et al., 2003; Christensen et al., 2004; Fruchter et al., 2006; Fynbo et al., 2006a; Lyman et al., 2017). The association of GRBs with type Ib,c supernovae (SNe) (e.g., Galama et al., 1998; Hjorth et al., 2003; Stanek et al., 2003; Malesani et al., 2004; Pian et al., 2006), and also the young ages of stellar populations in GRB environments (Chary et al., 2002; Christensen et al., 2004) strengthen the connection between GRBs and massive stars.
GRBs typically occur in low mass and metal poor (dwarf) galaxies (Fynbo et al., 2006b; Prochaska et al., 2008; Savaglio et al., 2009; Castro Cerón et al., 2010; Graham & Fruchter, 2013; Krühler et al., 2015; Cucchiara et al., 2015; Perley et al., 2016). This is often interpreted as an indication that a low metallicity is needed for the formation of GRB progenitors. Such a hypothesis is consistent with the single-star progenitor model for GRB formation where the low metallicity of the progenitor star is critical. However, the detection of several GRBs in metal-rich environments (Savaglio et al., 2012; Elliott et al., 2013; Schady et al., 2015) and particularly, the identification of a large number of massive and metal rich GRB host galaxies (dark / dust-obscured GRB hosts, Svensson et al., 2012; Hunt et al., 2014; Perley et al., 2013) has raised questions about whether a low metallicity is indeed necessary for the formation of GRB progenitor stars.
While the low metallicity requirement is debated, high star formation densities do appear to play a critical role for the formation of GRB progenitors. Studies in both the local and the high- Universe show that massive stars (and hence GRB progenitors) are more likely to be found in regions with high star formation rate (SFR) densities (Dabringhausen et al., 2009, 2012; Banerjee & Kroupa, 2012; Marks et al., 2012; Peacock et al., 2017; Schneider et al., 2018; Zhang et al., 2018). GRB hosts are indeed found to have high surface densities of SFR (Kelly et al., 2014). Interactions are known to enhance the star formation activities of galaxies (Renaud et al., 2014) and also trigger the formation of massive and compact clumps (see Renaud, 2018, and references therein). It would be therefore interesting to investigate whether interactions and mergers are common in GRB host galaxies.
Evidence for interactions is likely to be easier to obtain in the closest GRB host galaxies, as their proximity allows us to identify both very faint companion galaxies and weak disturbances in their velocity fields. Perhaps the best system in this regard is ESO 184G82, the host of GRB 980425 and its associated supernova, SN 1998bw (Galama et al., 1998). At , this has the lowest redshift of any known GRB till date. ESO 184G82 is a barred spiral (Sbc-type) galaxy, and has several Hii regions that are actively forming stars (Fynbo et al., 2000). It has an SFR of (Christensen et al., 2008; Krühler et al., 2017) and a stellar mass of (Michałowski et al., 2014) which place it on the galaxy Main Sequence relation in the M∗–SFR plane (Brinchmann et al., 2004). Most interestingly, there is a very bright star forming region in the host galaxy with an sSFR more than an order of magnitude larger than the overall sSFR of the host (Hammer et al., 2006; Christensen et al., 2008). This is one of the most luminous and infrared-bright Hii regions identified to date in the nearby Universe (Le Floc’h et al., 2012). With a high density of young and massive Wolf-Rayet (WR) stars with ages less than 3 Myr (Krühler et al., 2017), this WR region appears to have been formed in a recent episode of star formation (Hammer et al., 2006; Le Floc’h et al., 2012). GRB 980425 occurred in an Hii region 800 pc from this WR region. The GRB Hii region contains young and massive stars with estimated ages between 5 and 8 Myr (Krühler et al., 2017).
Fynbo et al. (2000) proposed that interactions could have triggered the recent star formation episode in ESO 184G82. However, extensive multi-wavelength studies ESO 184G82 and its surroundings did not yield any sign of interactions or a companion galaxy. Christensen et al. (2008) mapped the emission from the host and found its velocity field to show ordered rotation without any signature of a disturbance. Foley et al. (2006) studied the field of ESO 184G82 to search for possible companions interacting with the GRB host, but found all of the observed galaxies in the field to lie at significantly greater distances than ESO 184G82. They concluded that ESO 184G82 is an isolated dwarf galaxy and interactions with other galaxies are not responsible for its star formation.
Hi 21 cm mapping studies with radio interferometers allow the possibility of tracing the spatial distribution and velocity fields of the neutral hydrogen in nearby galaxies. Such Hi 21 cm studies of GRB host galaxies provide a powerful tool to directly test the hypothesis that an interaction might have triggered the star formation that gave rise to the GRB. In Arabsalmani et al. (2015), we used the Giant Metrewave Radio Telescope (GMRT) to map the Hi 21 cm emission from ESO 184G82, finding its gas disc to be disturbed, while the global gas properties of the galaxy appeared similar to those of local dwarfs. This was the first tentative evidence that interactions or a merger event might indeed have played a role in the recent star formation activity of ESO 184G82.
In this paper we present deep GMRT Hi 21 cm emission observations of ESO 184-G82, which allow us to study the structure of the atomic gas in the vicinity of GRB 980425 in detail, with high spatial resolution. We combine our Hi 21 cm mapping data with optical and infrared imaging studies to glean further information on the galaxy’s star formation history. We also use state-of-the-art simulations to compare the observed properties with a model of a merger event. This paper is organised as follows. The observations and data reduction are presented in Section 2. The Hi 21 cm mapping results are discussed in Section 3, while Section 4 provides details on the companion galaxy identified in this paper. Next, Section 5 compares the observed Hi 21 cm morphology of ESO 182-G82 and its companion to that expected in a simulation of the merger of two disc galaxies. Sections 6 and 7 contain, respectively, a general discussion and a summary of our results.
2 Observations and data reduction
2.1 HI 21 cm emission observations
We used the L-band receivers of the GMRT to map the Hi 21 cm emission of ESO 184G82 on six consecutive days between 2016 March 17 and 2016 March 22 (proposal no: 29076; PI: Arabsalmani). The observations used the GMRT Software Backend, with a bandwidth of 4.167 MHz, centred at 1408.246 MHz, and sub-divided into 512 channels, yielding a velocity resolution of 1.7 km s-1 and a total velocity coverage of km s-1. The southern declination of ESO 184G82 () implies that it is visible from the GMRT for only hours per day. Our total on-source time from the six runs was hence only 9.6 hours; however, we note that this was significantly larger than the on-source time ( hours) of our earlier run (Arabsalmani et al., 2015). The bright flux calibrator 3C48 was observed at the start and end of each observing run, to calibrate the system bandpass.
“Classic” aips was used for the analysis of the data (Greisen, 2003). After initial data editing and bandpass calibration, a ”channel-0” visibility data set was created by averaging together line-free channels. The flux scale of the data was set by an initial calibration to a sky model based on our earlier GMRT continuum image of the field (Arabsalmani et al., 2015). This was followed by a standard self-calibration, imaging and data-editing procedure on the same channel-0 data set, until no further improvement was seen in the continuum image on further self-calibration. The antenna-based gains derived from the above procedure were then applied to all visibilities of the original multi-channel data set. At the end of the loop, the final calibration was applied to all the visibilities.
The radio continuum image made using the line-free channels at the end of the self-calibration cycle, was used to subtract the continuum from the calibrated visibilities, using the task uvsub. The residual visibilities were mapped with different U–V tapers to produce spectral cubes at different angular resolutions using the task imagr. The velocity resolution was optimized to be 7 km s-1 by averaging groups of four channels together. This was done to improve the statistical significance of the detected Hi 21 cm emission in independent velocity channels while still having sufficient resolution to accurately trace the velocity field.
The task momnt was then applied to the spectral cubes in order to obtain maps of the Hi total intensity and the intensity-weighted velocity field at different angular resolutions. momnt works by masking out pixels in the spectral data cube which lie below a threshold flux in a secondary data cube created by smoothing the original cube both spatially and along the velocity axis – the smoothing ensures that any localized noise peaks are ignored and only emission correlated spatially and in velocity is chosen. We created the secondary data cube by applying Hanning smoothing across blocks of three consecutive velocity channels, whereas spatially a Gaussian kernel of full width at half maximum (FWHM) equal to six pixels was applied. The threshold flux used to select pixels was approximately 1.5 times the noise in a line-free channel of the original cube.
We produced four spectral cubes with different angular resolutions. The synthesized beam FWHMs for these cubes are 3.0′′9.3′′, 11.9′′16.8′′, 17.2′′23.9′′, and 25.3′′44.1′′. The properties of the four cubes are listed in Table 1.
| Synthesized Beam | Channel width | Noise in line-free channel |
|---|---|---|
| (arcsarcs) | (km s-1) | (mJy Bm-1) |
| 3.0 9.3 | 7.0 | 0.7 |
| 11.916.8 | 7.0 | 1.0 |
| 17.223.9 | 7.0 | 1.2 |
| 25.344.1 | 7.0 | 1.7 |
2.2 Ancillary data
We obtained ancillary data for the field of ESO 184G82 at several wavelengths. These include (i) optical broad-band images of the field obtained with the FOcal Reducer and low dispersion Spectrograph (FORS) on the Very Large Telescope (VLT) on October 10, 14, and 15, 1999, using the , , , and filters, with a total exposure time of 300 seconds in each filter (Program IDs: 064.H-0375(A) and 066.D-0576(A), PI: F. Patat), (ii) a narrow-band image of the field with the filter obtained with VLT/FORS on August 03, 2000, with a total exposure time of 300 seconds (Program ID: 165.H-0464(A), PI: Van Den Heuvel), (iii) a 4.5 m continuum data set obtained with the InfraRed Array Camera (IRAC) on the Spitzer Space Telescope on 2004 April 03, with a total exposure time of 100 seconds (as a part of the IRS Guaranteed Time, Houck et al., 2004, Program ID:76), and (iv) a Hubble Space Telescope (HST) image with the MIRVIS/Clear filter centred at 5737.453 Å on June 11, 2000 with a total exposure time of 295 seconds (Program ID: GO-8640, PI: Holland)
3 The atomic gas in ESO 184G82
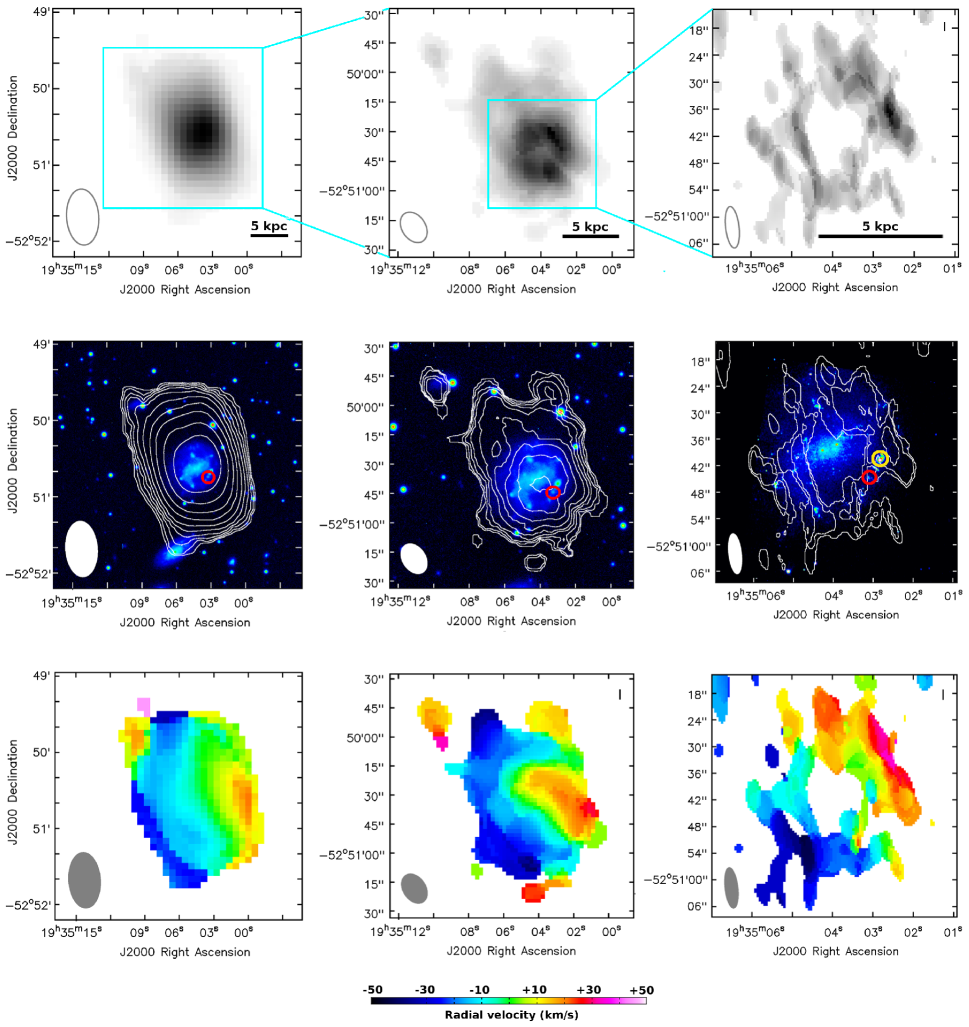
In Fig. 1, we show the Hi 21 cm total intensity and velocity maps of ESO 184G82 at three different angular resolutions. The synthesized beams are shown in the bottom-left corner of each panel, and have the FWHMs of 25′′44′′, 12′′17′′, and 3′′9′′for the left, middle, and right panels respectively (see Table 1 for the properties of the Hi cubes).
The Hi 21 cm intensity map at our lowest resolution (25′′44′′) is shown in greyscale in the top-left panel. The corresponding contours are overlaid on the optical VLT/FORS (B-band) image of the galaxy in the middle-left panel. These maps show the extent of the diffuse gas since we are sensitive to low Hi column densities, , at this resolution. We clearly see that the diffuse Hi is much more extended than the optical disc of the galaxy (at least twice as large in diameter). We derive a total Hi mass of for the main gas disc from the total Hi flux measured at this resolution, consistent with the value we reported in Arabsalmani et al. (2015). This is comparable to the stellar mass of the galaxy, . The velocity field at the same coarse resolution (bottom-left panel) shows that the atomic gas disc has ordered rotation, but that the gas to the North-East corner seems not to be following the rotation of the gas disc.
The Hi intensity map at a resolution of 12′′17′′ in greyscale, and with contours overlaid on the VLT/FORS B-band image, are shown in the middle panels of the top two rows. From these maps, we find that, in addition to the main mass of gas coincident with the optical disc of ESO 184G82, the gas disc extends at least 5 kpc to the North of the optical disc. We clearly detect the presence of an Hi knot to the North-East of the galaxy, about an arcminute from the optical centre of ESO 184G82 (middle panels). The extension of gas towards this knot is strong evidence of tidal interaction between ESO 184G82 and the object associated with the Hi knot. The velocity field at the same resolution (bottom-middle panel) shows that whereas the main gas disc appears to have regular rotation along an axis running through the centre of the optical disc from South-East to North-West, the extension to the North contains kinematically disturbed gas. The presence of disturbed gas strengthens the case for an ongoing interaction between the GRB host and a companion galaxy.
The highest resolution Hi map, with a resolution of 3′′9′′, is shown in greyscale in the top-right panel. The corresponding contours, overlaid on the HST image of the galaxy, are shown in the middle-right panel. At this resolution we are sensitive to only high Hi column density gas, with N(Hi) . We find the high column density Hi to have formed a ring around the optical centre of the galaxy. This ring passes across the actively star-forming regions in the galaxy and encircles the stellar bar in ESO 184G82. The locations of both the SN/GRB and the WR region are situated in the Western part of this high column density ring, portions of which were also picked up in our previous GMRT Hi 21 cm image (Arabsalmani et al., 2015). Gas rings can form due to resonances with bars or resonances caused by a mild tidal interaction with a companion galaxy (resonance rings, Buta & Combes, 1996; Buta, 1999). But high density gas rings, which are also the sites of enhanced star formation in galaxies, are usually formed due to collisions with small companions (see Appleton & Struck-Marcell, 1996, for a review on collisional ring galaxies). In Section 5 we discuss the likely cause for the formation of the high column density gas ring in ESO 184G82. The high resolution velocity field (bottom-right panel) shows that this high column density ring of gas follows the rotation of the main Hi disc of the galaxy, though within the ring there are regions with velocity gradients as high as 40 km s-1over sub-kpc scales.
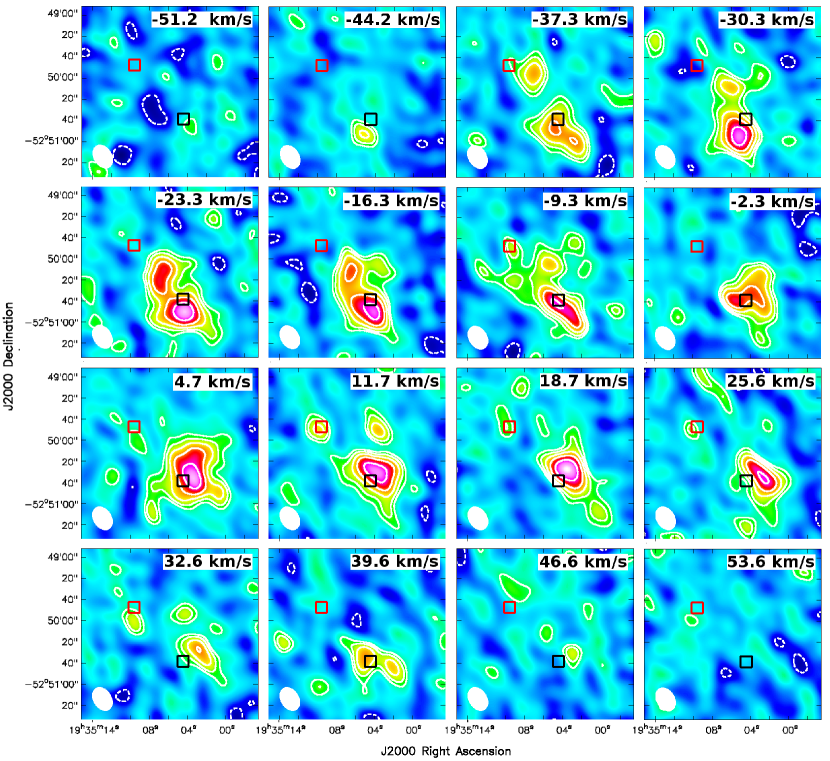
In order to take a detailed look at the velocity distribution of the Hi gas, we use the spectral cube with an angular resolution of 17′′24′′. This intermediate resolution allows us to both be sensitive to relatively low gas column densities and spatially distinguish the Hi knot to the North-East from the main gas disc of ESO 184G82. Fig. 2 shows the Hi fluxes per 7 km s-1 velocity channel at this resolution. There is Hi around the optical centre of the galaxy which shows ordered rotation – the peak emission shifts from South-East to North-West with increasing velocity. But there appears to be a substantial amount of Hi which does not follow the ordered rotation, located to the North–North-East of the optical centre. Emission from the previously mentioned spatially distinct North-Eastern knot is detected in the velocity channels between 2591.7 km s-1 and 2612.6 km s-1. Note that much of the kinematically disturbed gas in various velocity channels is extended towards the location of this North-Eastern knot, reminiscent of gas being dragged out of a galactic halo by the passage of another galaxy during a merger event.
4 The companion galaxy of ESO 184G82
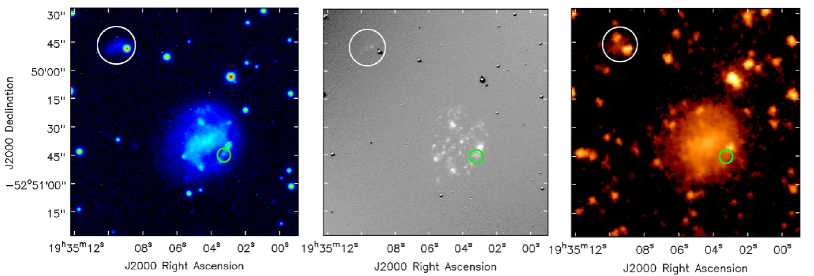
The structure of the atomic gas in ESO 184G82 shows clear evidence for an ongoing interaction between the galaxy and a companion object, probably associated with the Hi knot of Fig. 1. In order to identify the optical counterpart of the Hi knot, we searched the multiple VLT/FORS optical images. In all these images we clearly detect optical emission spatially coincident with the Hi knot. We also identify this object in the Spitzer/IRAC2 4.5 m image and the VLT/FORS H image. The optical and infrared images of the field are shown in Fig. 3 (see also the top-middle panel of Fig. 1). These confirm the association of the Hi knot with a galaxy centred on and and at a projected distance of 13 kpc from the centre of ESO 184G82. The Hi 21 cm emission from this galaxy is centred at a redshift of , consistent with the redshift of ESO 184G82 ( obtained from the Hi 21 cm emission line); ie., the centres of the Hi 21 cm emission from the two galaxies are separated by about 20 km s-1. We name this newly identified galaxy GALJ193510-524947.
GALJ193510-524947 appears to be a star-forming dwarf galaxy. We obtain an H emission flux of , implying that the galaxy has an SFR of (based on the calibration of Kennicutt, 1998). The VLT/FORS images yield AB magnitudes of B=, V=, R=, and I= for the galaxy (corresponding to absolute magnitudes of , , , and , respectively). The Spitzer/IRAC2 photometry is complicated by contamination from two foreground stars in the 4.5m image (see the right panel of Fig. 3). We hence first measured the contributions of the two stars using aperture photometry, and subtracted their emission to obtain the flux density of GALJ193510-524.947. This yielded a m flux density of Jy, equivalent to an AB magnitude of . Note that while GALJ193510-524947 is clearly detected in the Spitzer/IRAC2 image, the presence of the two bright stars in the image lead to the large uncertainty in the IRAC photometry.
We estimated the stellar mass of GALJ193510-524947 by modelling its spectral energy distribution (SED) with LePhare (Arnouts et al., 1999) based on our optical and near-infrared (NIR) photometry. We use the Stellar Population Synthesis templates developed by Bruzual & Charlot (2003), assume a Chabrier initial mass function (Chabrier, 2003), and consider an exponentially declining star formation history (SFR ). From this, we estimate a stellar mass of for GALJ193510-524947. We note that our SED modelling is dominated by the optical photometry which has lower errors than the m photometry. In order to confirm the stellar mass derived from the SED modelling, we obtain an independent estimate of the stellar mass of GALJ193510-524947 from its NIR photometry alone. For this we assume a ratio of 0.6 for the Spitzer/IRAC 3.6 m to 4.5 m fluxes (Zhu et al., 2010) and use the calibration of Leroy et al. (2008). We then obtain a stellar mass of from the NIR photometry which is consistent with our estimate from the SED modelling.
We measure an Hi mass of for GALJ193510-524947. This is comparable to its stellar mass, implying that GALJ193510-524947 is a gas-rich galaxy. We detect the Hi 21 cm emission line from GALJ193510-524947 in five channels, corresponding to a velocity width of km s-1 (see Fig. 2). This places the galaxy on the baryonic Tully–Fisher relation for low-mass dwarfs in the local Universe (McGaugh, 2012). Based on our SED modelling, we derive the continuum emission of GALJ193510-524947 at the rest-frame wavelength (6562.8 Å) to be Å-1. With this and the flux measured from the VLT/FORS narrow-band image we estimate the equivalent width of the line (EWHα, the ratio of flux to the continuum level at the wavelength of the emission) to be 28 Å for GALJ193510-524947. Using Starburst99 models with instantaneous star formation laws (Leitherer et al., 1999), this corresponds to an age of 8 Myr, somewhat larger than, but comparable to, those of the Hii regions in ESO 184G82 (see Christensen et al., 2008; Krühler et al., 2017).
| B | V | R | I | F4.5μm | SFR | |||
| Jy) | () | () | () | () | ||||
| 18.840.10 | 18.330.10 | 18.050.15 | 17.930.20 | 177 | 0.004 |
5 Interaction between ESO 184G82 and GALJ193510-524947
The structure of atomic gas and also the star formation activity in ESO 184G82 and GALJ193510-524947 are reminiscent of an interacting system. In addition to the main mass of gas which is spatially coincident with the optical disc of ESO 184G82, the atomic gas in ESO 184G82 has an extension over at least 5 kpc (projected size) to the North of the optical disc. The eastern part of the extended gas looks like a bridge between ESO 184G82 and GALJ193510-524947, suggestive of a tidal interaction or a collision between the two galaxies. While the main mass of gas in ESO 184G82 shows regular rotation, a substantial amount of Hi gas in the extension is disturbed and does not follow the ordered rotation. This is reminiscent of gas being dragged out of ESO 184G82 by the passage of GALJ193510-524947. The Hi gas with the highest column density appears to have formed a ring around the optical centre of ESO 184G82, passing across its actively star-forming regions. This structure, resembling a cartwheel-like ring, is suggestive of a collisional ring formed due to a head-on collision with a small galaxy like GALJ193510-524947 which passed through the disk of ESO 184G82 close to its centre (a drop-through collision, see Wong et al., 2006). The large velocity gradients of the atomic gas in the gas ring of ESO 184G82 and also the presence of the large knots coincident with the Hi ring lend support to this hypothesis.
In a drop-through collision, the inner annular shells of gas will have larger velocities compared to the outer shells. The catching up of the inner shells with the outer shells creates shock and compression of gas and leads to the formation of a ring of high density gas with a large velocity dispersion (Appleton & Struck-Marcell, 1996; Bournaud & Combes, 2003). The high velocity dispersion of gas in the ring increases the Jeans mass which leads to the formation of massive molecular gas clumps and hence large knots of star formation (Horellou & Combes, 2001; Renaud et al., 2018). Unlike in classical tidal interactions, the lack of large gas inflows towards the galaxy centre during a collision results in the absence (or negligible amount) of star formation enhancement in the central regions (Renaud et al., 2018). This picture is consistent with the star formation activity in ESO 184G82. As is clear from its emission line observations, the recent star formation in ESO 184G82 is not concentrated in the centre of the galaxy, but arises in a number of Hii regions coincident with the high column density Hi ring (see the middle panel of Fig. 3; see also Christensen et al., 2004; Krühler et al., 2017). Moreover, the velocity map presented in the bottom-right panel of Fig. 1 clearly shows large velocity gradients (as large as 40 km s-1on sub-kpc scales) along the radius of the high column density gas ring, typical of collisional rings. The gas ring in ESO 184G82 is also asymmetric, with its centre offset from the optical centre of the galaxy. It also has higher column densities in its North-West region compared to those in the rest of the ring. These asymmetric features too are typical of collisional rings.
The identification of GALJ193510-524947, a companion galaxy associated with the Hi knot to the North-East of ESO 184G82, and at a projected distance of 13 kpc from the GRB host, strengthens the case for an interaction between the two galaxies. We use state-of-the art simulations of dwarf–dwarf mergers (Starkenburg et al., 2016) to test whether the observed gas and star formation properties of ESO 184G82 and its companion can be reproduced by a dwarf-dwarf interaction model. These are controlled (isolated) simulations, performed with the OWLS version (Schaye et al., 2010) of the N-body/Smoothed-Particle-Hydrodynamic-code Gadget-3 (Springel et al., 2001; Springel, 2005). In these simulations, both dwarf galaxies have a Hernquist dark matter halo, and exponential stellar and gas discs. The primary dwarf contains particles in its dark matter halo and particles in its baryonic matter. The secondary dwarf contains particles in its dark matter halo, and particles in its baryons. The gravitational softening length is 10 pc for dark matter, and 3 pc for baryonic particles, and the smoothing is done over 48 neighbors. Gas above a density of cm-3 is governed by an effective equation of state and forms stars following a Kennicutt-Schmidt relation while at lower densities it follows an isothermal equation of state (see Schaye & Dalla Vecchia, 2008). We consider both the non-star-forming gas with temperature K, and the least dense three-fourths of the star-forming gas to be in the atomic phase (following Genel et al., 2014) and assume a mass ratio of molecular gas to atomic gas of (Saintonge et al., 2011). Feedback is implemented based on the kinetic stellar wind prescription of Dalla Vecchia & Schaye (2008) and is calibrated to ensure self-regulated star formation. For a detailed description of the simulations we refer the readers to Starkenburg et al. (2016).
Our main criteria are to simultaneously reproduce the following observed features of ESO 184G82: (i) the extension of Hi gas from ESO 184G82 towards GALJ193510-524947, (ii) the asymmetric ring of high column density Hi gas in ESO 184G82, (iii) the large velocity gradients of the Hi in the ring, (iv) the enhancement of star formation in the location of the gas ring, and finally (v) the lack of enhanced star formation activity in the central regions of ESO 184G82. We run two sets of simulations, one for classical tidal interactions and the other for collisional interactions. In both we start with two discs with smoothly distributed stellar and gas components. In the tidal interaction simulations, the secondary galaxy passes through the outskirts of the primary galaxy disc at the first pericentre, on an orbit which has a small inclination with respect to the plane of the disc of the primary dwarf (covering a range of -10 to 30 degrees). In the collisional interaction simulations, the secondary galaxy has a direct collision with the primary galaxy with angles between 70 to 90 degrees with respect to the plane of the primary galaxy.
We find that the tidal interaction simulations, within the ranges of the initial configurations mentioned below, fail to reproduce the observed criteria (ii) to (v) mentioned above. The explored initial configurations for this set of simulations are: a virial mass range of (in 3 steps) for the primary dwarf and (in 7 steps) for the secondary dwarf galaxy; the range of 0.0010.02 (in 5 steps) for the ratio of baryonic to virial mass, 0.30.7 (in 5 steps) for the ratio of gas to baryonic mass, and 14 (in 5 steps) for the ratio of gas to stellar disc size for both the dwarf galaxies; the range of -10 to 30 degrees (in 6 steps) for the inclination of the orbit of the secondary galaxy with respect to the disc of the primary dwarf; and the range of 28 to 66 kpc (in 3 steps) for the initial separation between the two dwarf galaxies. In particular, in tidal interactions the star formation enhancement in the central regions of the galaxy (central kpc) should contribute significantly (if not dominantly) to the total star formation enhancement of the galaxy (Barnes & Hernquist, 1991; Di Matteo et al., 2007; Di Matteo et al., 2008; Teyssier et al., 2010; Powell et al., 2013; Renaud et al., 2014; Hibbard & van Gorkom, 1996). The fact that this is not the case in ESO 184G82 suggests that it is unlikely that a tidal interaction has taken place in the system.
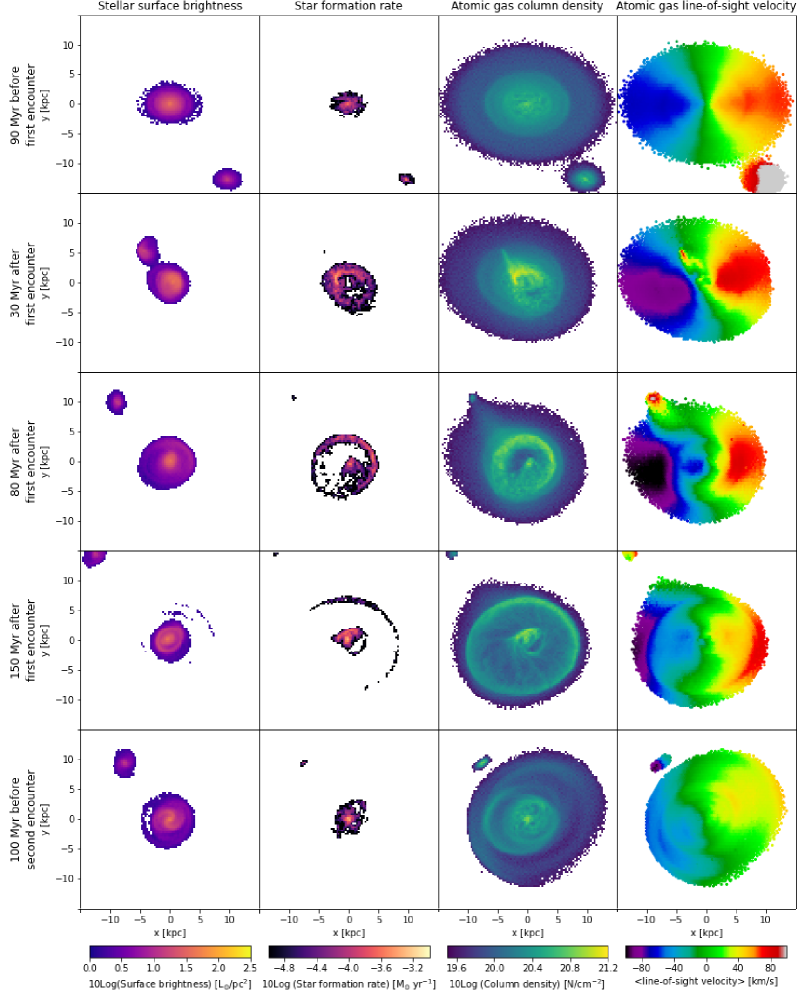
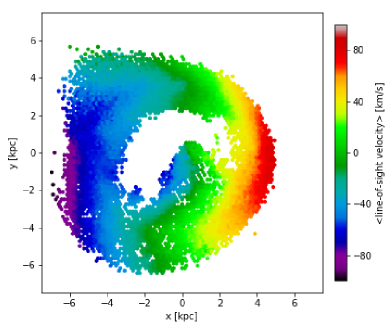
Conversely, the collisional interaction simulations simultaneously reproduce all the above observational constraints. Fig. 4 presents the outcome of one of these simulations at five different times; for each time sample, the different results are plotted in a single row. The four columns (from left to right) present, respectively, the distributions of the stellar surface brightness, the SFR, the Hi column density, and the Hi 21 cm velocity field. The viewing angle for the simulation presented in this figure is 45 degrees from the plane of the primary dwarf galaxy. The primary and secondary dwarfs have halo masses of and respectively. The dark matter particle masses for the primary and secondary dwarf are and while the baryonic particle masses are and , respectively.
The top row shows the configuration of the system in a snapshot corresponding to 90 Myr before the first collision, when the secondary dwarf is at a distance of 20 kpc (projected distance of 16 kpc) from the primary galaxy. The primary dwarf at this time has a stellar mass of and a similar atomic gas mass. The secondary dwarf is moving with a velocity of 100 km s-1, on a direct collision course with the disk of the primary galaxy and at an angle of 70 degrees with respect to the plane of the primary galaxy. The first collision occurs at a point 2 kpc away from the centre of the primary dwarf disk, and results in the formation of annular shells moving outwards from the collision point. The inner shells have larger velocities compared to the outer shells. The shock caused by this difference in velocities results in the compression of gas and as a consequence, in the enhancement of star formation. The high density gas and the enhancement of star formation in the primary dwarf can be seen in the second snapshot (the second row of Fig. 4) which shows the system 30 Myr after the first collision. By this time, star formation in the primary dwarf has increased by more than a factor of three compared to that before the collision.
With time, the shock wave moves outwards from the point of collision and forms an asymmetric ring of dense atomic gas in the primary dwarf. This ring is clearly visible in the third snapshot (the third row of Fig. 4) which corresponds to 80 Myr after the first collision. By this time the formation of molecular gas in the dense atomic gas ring has enhanced the star formation in the ring. At the same time, the lack of sufficient inflow of gas to the centre of the primary dwarf has resulted in very little or no star formation enhancement in the centre of the galaxy. The secondary dwarf is at a distance of 17 kpc (projected distance of 13 kpc) from the primary galaxy and is moving away from it. The atomic gas which has been dragged out from the primary galaxy is visible as the extension of gas between the two galaxies. The overall stellar and gas distributions of the dwarf–dwarf system at this snapshot matches those of ESO 184G82 and GALJ193510-524947. The velocity field of the atomic gas too resembles the velocity map of the atomic gas in ESO 184G82, presented in the bottom-middle panel of Fig. 1. The dense gas in the region of the ring demonstrates velocity gradients of a few tens of km s-1 over sub-kpc scales. Such large velocity gradients result in the formation of massive gas clouds and hence large knots of star formation. These massive gas clouds as well as large star formation knots are resolved in our simulations and are visible in the third row of Fig. 4. The large velocity gradients can also be clearly seen in the velocity distribution of the gas ring shown separately in Fig. 5.
The radius of the gas ring continues to increase with time and its density contrast decreases as can be seen in the fourth snapshot (the fourth row in Fig. 4) which corresponds to 150 Myr after the first collision. At this time the secondary galaxy is moving further away from the primary dwarf. The fifth snapshot (the fifth row in Fig. 4), corresponding to 100 Myr before the second collision, when the secondary galaxy, after reaching its apocentre, is moving back towards the primary galaxy for the second collision. By this time the distribution of atomic gas in the primary galaxy has become more uniform, with no depression in the central regions. Also, the star formation activity is only present in the centre of the galaxy.
6 Discussion
The gas and star formation properties of ESO 184G82, along with the identification of a companion galaxy, GALJ193510-524947, in its vicinity provide clear evidence for interaction between the two galaxies. Our simulations support the paradigm in which ESO 184G82 had a head-on collision with its companion which led to the formation of the high column density gas ring observed in our Hi map. This ring, with large velocity gradients (as high as 40 km s-1 over sub-kpc scales), is an ideal site for formation of massive Giant Molecular Clouds and hence super star clusters (SSCs). This, consequently, increases the probability of formation of massive stars in the star forming regions within the gas ring and in turn increases the chance of a GRB progenitor to form. Note that this paradigm is for the formation of the GRB progenitor, and may not have any bearing on the stellar explosion mechanism which ultimately produces the GRB.
A comparison between the stellar mass distributions of GRB hosts and the cosmic star formation rate density shows that most GRBs occur in galaxies with stellar masses lower than those of galaxies responsible for the bulk of star formation (e.g. galaxies with at , Conroy & Wechsler, 2009). This is especially the case for GRBs at (see Perley et al., 2016). Hence, the processes that create these energetic explosions are not linked in a trivial way to the SFRs of their host galaxies. There must be other factors which drive the formation of GRB progenitors in galaxies.
The typical low mass and metallicity of GRB hosts has been widely interpreted as low metallicity being the primary requirement for GRB formation. However, this has been called into question by the detection of a large number of GRBs in massive, metal-rich galaxies (Savaglio et al., 2012; Svensson et al., 2012; Elliott et al., 2013; Hunt et al., 2014; Schady et al., 2015; Perley et al., 2013). A less addressed, but more likely, factor is high SFR densities. Kelly et al. (2014) found the SFR surface densities of GRB hosts to be higher than those of field galaxies, implying that they have high SFR densities. Regions with high star formation densities are expected to power strong gas outflows with large velocities (Lagos et al., 2013; Sharma et al., 2017). The large galaxy outflow velocities deduced from the velocity widths of the interstellar medium absorption lines in GRB hosts (detected in GRB afterglows, see Arabsalmani et al., 2018b, and references therein) are therefore consistent with the hypothesis of GRBs originating in regions with high SFR densities.
This picture is in agreement with GRB formation models. There are two main models proposed for the generation of relativistic jets in GRBs through core-collapse of massive stars. In one, a single progenitor star with anomalously rapid rotation forms the GRB (MacFadyen & Woosley, 1999; Yoon & Langer, 2005; Hirschi et al., 2005; Woosley & Heger, 2006), while in the other, the GRB is associated with the core collapse of a massive star stripped by a companion in a close binary system (Usov, 1992; Izzard et al., 2004; Podsiadlowski et al., 2004; Fryer & Heger, 2005; Detmers et al., 2008; Podsiadlowski et al., 2010; Tout et al., 2011; Kinugawa & Asano, 2017). The single star model requires the progenitor to retain angular momentum (necessary for GRB formation) and, at the same time, lose substantial mass (to develop into a hydrogen- and helium-poor star). While the presence of metals helps the mass loss (and the removal of the hydrogen/helium envelope), this also carries away angular momentum. This contradiction is avoided in chemically homogeneous evolved progenitors, which however require much lower metallicities than is observed in GRB hosts. On the other hand, the metallicity constraints on the progenitor stars when GRBs are produced in close binaries are more relaxed; although these models predict a higher probability of GRB formation in metal-poor progenitors, they do not rule out high (e.g. solar or super-solar) metallicities in the progenitors (e.g., see Podsiadlowski et al., 2010; Tout et al., 2011). It is notable that Sana et al. (2014) found massive stars to form nearly exclusively in multiple systems (see also Mason et al., 2009; Sana et al., 2012). Formation of GRB progenitors in massive and dense SSCs is particularly in agreement with the models in which GRBs forms through dynamical interactions and collisions of massive stars in dense environments (see for e.g., van den Heuvel & Portegies Zwart, 2013).
The link between high SFR densities and GRB progenitors is also supported by the observed top heavy initial mass function (IMF) in regions with high SFR densities. There are several lines of evidence in the local Universe indicating that more massive stars are found in regions with high SFR densities than would be expected from a standard IMF (e.g. Salpeter, Chabrier, etc; Dabringhausen et al., 2009, 2012; Banerjee & Kroupa, 2012; Marks et al., 2012; Peacock et al., 2017). Schneider et al. (2018) studied a compact and bright Hii region in the Large Magellanic Cloud whose properties may closely replicate starbursts at high redshifts. They found it to contain more stars with masses larger than 30 than expected from a standard IMF. This is in line with the findings of Zhang et al. (2018) who recently investigated four submillimetre galaxies at and found evidence for a top heavy IMF in all of them. Therefore, regions with compact and intense star formation, such as massive SSCs, are the likely birth-place of GRB progenitors (also see Chen et al., 2007).
Massive SSCs are known to be common in interacting systems (Elmegreen et al., 1993; de Grijs et al., 2003; Bastian, 2008; Renaud, 2018). The absence of gravitational shear and the increased turbulence in interacting systems are thought to aid the gravitational collapse of massive amounts of gas into massive and compact GMCs, which may subsequently form SSCs (see Elmegreen et al., 2000; Weidner et al., 2010; Teyssier et al., 2010; Elmegreen et al., 2017). The large velocity dispersion of the interstellar gas in interacting systems not only increases the Jeans mass (which in turn results in the formation of massive clumps), but also heightens the temperature of the clouds, thus shifting the IMF toward more massive stars (see Elmegreen et al., 1993). Collisional encounters between galaxies, though rare compared to tidal interactions, are more efficient in triggering the formation of massive and compact SSCs (Struck et al., 1996; Burkert et al., 2005; Elmegreen & Elmegreen, 2006; Pellerin et al., 2010). In a recent study Renaud et al. (2018) showed that head-on collisions produce fewer, but larger SSCs, compared to tidal interactions.
The above evidence suggests a natural link between the host galaxies of GRBs and interacting systems. Such a link seems to be especially likely at since interactions appear to play a dominant role in the formation of massive and compact SSCs at low redshifts. At higher redshifts, the high gas fractions of galaxies can cause gravitational instability leading to the collapse of large amounts of gas into massive and dense clumps. Recent studies however indicate that, at high redshifts too, violent mechanisms such as major or minor mergers are required to generate strong concentrations of gas (see Elbaz et al., 2018, and references therein).
The typical high sSFR values of GRB host galaxies (e.g., Sokolov et al., 2001; Chary et al., 2002; Christensen et al., 2004; Savaglio et al., 2009; Svensson et al., 2010; Perley et al., 2015), suggesting a recent boost in their star formation, are consistent with the existence of a link between GRB hosts and interacting systems. Interactions are known to enhance the star formation activities of galaxies and increase their SFR up to an order of magnitude higher (e.g., Renaud et al., 2014; Pan et al., 2018). Earlier studies have found indications of interactions and mergers in GRB host galaxies, but the evidence has not been unambiguous. Chary et al. (2002) found 6 of the 11 GRB hosts in their sample to be disturbed or to have candidate companion galaxies. Spectroscopic studies are required in order to, as the first step, confirm whether the candidate companions are indeed at the redshift of the GRB hosts. Chen (2012) performed spectroscopic studies in the fields of two GRBs at and , and in both cases found a few galaxies with small separations in projected distance and velocity space, indicating them to belong to interacting systems. Wainwright et al. (2007) reported the morphology of of the 42 hosts in their sample to show signs of interaction, with an additional exhibiting irregular and asymmetric structure. Savaglio et al. (2009) found the morphology of 10 out of 22 GRB hosts to be asymmetric or similar to merger remnants (see also Savaglio, 2015, and references therein). However, interpreting the morphological signatures of interaction can be challenging, especially at high redshifts. Absorption studies have also indicated possible ongoing interactions in GRB hosts. Savaglio et al. (2012) reported the presence of strong double absorption systems with small velocity separation in 5 out of 40 GRB spectra, compared to 18 cases out of 500 for absorbers in sightlines towards quasars (see also Wiseman et al., 2017; Arabsalmani et al., 2018b). Emission studies are required to confirm whether the multi-component systems detected in the pencil-beams of GRB afterglows are associated with interacting systems or if they are related to other phenomena such as strong outflowing gas in the host galaxies (see Arabsalmani et al., 2018a, b).
In this study we find clear evidence for an ongoing interaction between the host galaxy of GRB 980425 and its companion, through a detailed Hi 21 cm study of the distribution and kinematics of atomic gas in the GRB host galaxy. In addition, our simulations show that the gas and star formation properties of the host galaxy of GRB 980425 can be reproduced by a collisional interaction with its companion galaxy. The similar ages of massive stars in the actively star forming regions of the host galaxy of GRB 980425 and its companion galaxy suggest that the interaction between the two galaxies has triggered the recent star formation in them. This is a clear case linking interaction driven star formation to a GRB event.
7 summary
We have used the GMRT to map the Hi 21 cm emission from ESO 184G82, the host galaxy of GRB 980425/SN1998bw. The Hi 21 cm intensity images and velocity distribution yield clear evidence that ESO 184G82 is undergoing an interaction with a companion galaxy: these include the detection of an Hi knot to the North-East of ESO 184-G82, an extended Hi structure extending from ESO 184-G82 towards the Hi knot, the disturbed Hi velocity field, and finally the presence of a high column density Hi ring, likely a collisional ring, around the optical centre of ESO 184G82, passing through the actively star-forming regions of the galaxy. We use VLT/FORS, HST, and Spitzer optical and NIR imaging to identify a small galaxy coincident with the Hi knot detected in the GMRT Hi 21 cm image, at a projected distance of 13 kpc from the centre of the GRB host galaxy. We find the companion galaxy to be a gas-rich star-forming dwarf galaxy, with an SFR of , a gas mass of , and a stellar mass of .
Head-on collisions produce star-forming gaseous rings with high surface densities and velocity dispersions, leading to the formation of massive SSCs in the ring. At the same time they cause little (or no) star formation enhancement in the centre of the galaxies, unlike classical tidal interactions. Our simulations of dwarf-dwarf mergers illustrate this process and show that a head-on collision can reproduce the main observed gas and star formation features of ESO 184G82 simultaneously. This is while it is difficult to explain the observed properties such as the presence of the gas ring and the absence of the star formation enhancement in the centre of ESO 184G82 via a tidal encounter. Our findings therefore suggest that the collision between ESO 184G82 and its companion galaxy has lead to the formation of dense and massive SSCs in which the GRB progenitor must have formed.
Acknowledgments
M.A. and S.R. would like to thank Bruce Elmegreen, Francoise Combes, Diane Cormier, and David Elbaz for valuable discussions. We thank the staff of the GMRT for making these observations possible. The GMRT is run by the National Centre for Radio Astrophysics of the Tata Institute of Fundamental Research. We acknowledge using data based on observations collected at the European Southern Observatory under ESO programs 064.H-0375(A), 066.D-0576(A), and 165.H-0464(A). This work is based in part on observations made with the Spitzer Space Telescope, which is operated by the Jet Propulsion Laboratory, California Institute of Technology under a contract with NASA, and also data made with the NASA/ESA Hubble Space Telescope, obtained from the data archive at the Space Telescope Science Institute. M.A. acknowledges support from UnivEarthS Labex program at Sorbonne Paris Cité (ANR-10-LABX-0023 and ANR-11-IDEX-0005-02). N.K. acknowledges support from the Department of Science and Technology via a Swarnajayanti Fellowship (DST/SJF/PSA-01/2012-13). L.C. is supported by DFF – 4090-00079. The Flatiron Institute is supported by the Simons Foundation. The Cosmic Dawn Center is funded by the DNRF. STScI is operated by the Association of Universities for Research in Astronomy, Inc. under NASA contract NAS 5-26555.
References
- Aloy et al. (2000) Aloy M. A., Müller E., Ibáñez J. M., Martí J. M., MacFadyen A., 2000, ApJ, 531, L119
- Appleton & Struck-Marcell (1996) Appleton P. N., Struck-Marcell C., 1996, Fundamentals Cosmic Phys., 16, 111
- Arabsalmani et al. (2015) Arabsalmani M., Roychowdhury S., Zwaan M. A., Kanekar N., Michałowski M. J., 2015, MNRAS, 454, L51
- Arabsalmani et al. (2018a) Arabsalmani M., et al., 2018a, MNRAS,
- Arabsalmani et al. (2018b) Arabsalmani M., et al., 2018b, MNRAS, 473, 3312
- Arnouts et al. (1999) Arnouts S., Cristiani S., Moscardini L., Matarrese S., Lucchin F., Fontana A., Giallongo E., 1999, MNRAS, 310, 540
- Banerjee & Kroupa (2012) Banerjee S., Kroupa P., 2012, A&A, 547, A23
- Barnes & Hernquist (1991) Barnes J. E., Hernquist L. E., 1991, ApJ, 370, L65
- Bastian (2008) Bastian N., 2008, MNRAS, 390, 759
- Bloom et al. (2002) Bloom J. S., Kulkarni S. R., Djorgovski S. G., 2002, AJ, 123, 1111
- Bournaud & Combes (2003) Bournaud F., Combes F., 2003, A&A, 401, 817
- Brinchmann et al. (2004) Brinchmann J., Charlot S., White S. D. M., Tremonti C., Kauffmann G., Heckman T., Brinkmann J., 2004, MNRAS, 351, 1151
- Bruzual & Charlot (2003) Bruzual G., Charlot S., 2003, MNRAS, 344, 1000
- Burkert et al. (2005) Burkert A., Brodie J., Larsen S., 2005, ApJ, 628, 231
- Buta (1999) Buta R., 1999, Ap&SS, 269, 79
- Buta & Combes (1996) Buta R., Combes F., 1996, Fundamentals Cosmic Phys., 17, 95
- Castro Cerón et al. (2010) Castro Cerón J. M., Michałowski M. J., Hjorth J., Malesani D., Gorosabel J., Watson D., Fynbo J. P. U., Morales Calderón M., 2010, ApJ, 721, 1919
- Chabrier (2003) Chabrier G., 2003, PASP, 115, 763
- Chary et al. (2002) Chary R., Becklin E. E., Armus L., 2002, ApJ, 566, 229
- Chen (2012) Chen H.-W., 2012, MNRAS, 419, 3039
- Chen et al. (2007) Chen H.-W., Prochaska J. X., Bloom J. S., 2007, ApJ, 668, 384
- Christensen et al. (2004) Christensen L., Hjorth J., Gorosabel J., 2004, A&A, 425, 913
- Christensen et al. (2008) Christensen L., Vreeswijk P. M., Sollerman J., Thöne C. C., Le Floc’h E., Wiersema K., 2008, A&A, 490, 45
- Conroy & Wechsler (2009) Conroy C., Wechsler R. H., 2009, ApJ, 696, 620
- Cucchiara et al. (2015) Cucchiara A., Fumagalli M., Rafelski M., Kocevski D., Prochaska J. X., Cooke R. J., Becker G. D., 2015, ApJ, 804, 51
- Dabringhausen et al. (2009) Dabringhausen J., Kroupa P., Baumgardt H., 2009, MNRAS, 394, 1529
- Dabringhausen et al. (2012) Dabringhausen J., Kroupa P., Pflamm-Altenburg J., Mieske S., 2012, ApJ, 747, 72
- Dalla Vecchia & Schaye (2008) Dalla Vecchia C., Schaye J., 2008, MNRAS, 387, 1431
- Detmers et al. (2008) Detmers R. G., Langer N., Podsiadlowski P., Izzard R. G., 2008, A&A, 484, 831
- Di Matteo et al. (2007) Di Matteo P., Combes F., Melchior A.-L., Semelin B., 2007, A&A, 468, 61
- Di Matteo et al. (2008) Di Matteo P., Bournaud F., Martig M., Combes F., Melchior A.-L., Semelin B., 2008, A&A, 492, 31
- Elbaz et al. (2018) Elbaz D., et al., 2018, A&A, 616, A110
- Elliott et al. (2013) Elliott J., et al., 2013, A&A, 556, A23
- Elmegreen & Elmegreen (2006) Elmegreen D. M., Elmegreen B. G., 2006, ApJ, 651, 676
- Elmegreen et al. (1993) Elmegreen B. G., Kaufman M., Thomasson M., 1993, ApJ, 412, 90
- Elmegreen et al. (2000) Elmegreen B. G., et al., 2000, AJ, 120, 630
- Elmegreen et al. (2017) Elmegreen D. M., Elmegreen B. G., Kaufman M., Brinks E., Struck C., Bournaud F., Sheth K., Juneau S., 2017, ApJ, 841, 43
- Foley et al. (2006) Foley S., Watson D., Gorosabel J., Fynbo J. P. U., Sollerman J., McGlynn S., McBreen B., Hjorth J., 2006, A&A, 447, 891
- Fruchter et al. (2006) Fruchter A. S., et al., 2006, Nature, 441, 463
- Fryer & Heger (2005) Fryer C. L., Heger A., 2005, ApJ, 623, 302
- Fynbo et al. (2000) Fynbo J. U., et al., 2000, ApJ, 542, L89
- Fynbo et al. (2006a) Fynbo J. P. U., et al., 2006a, Nature, 444, 1047
- Fynbo et al. (2006b) Fynbo J. P. U., et al., 2006b, A&A, 451, L47
- Galama et al. (1998) Galama T. J., et al., 1998, Nature, 395, 670
- Genel et al. (2014) Genel S., et al., 2014, MNRAS, 445, 175
- Graham & Fruchter (2013) Graham J. F., Fruchter A. S., 2013, ApJ, 774, 119
- Greisen (2003) Greisen E. W., 2003, in Heck A., ed., Astrophysics and Space Science Library Vol. 285, Information Handling in Astronomy - Historical Vistas. p. 109, doi:10.1007/0-306-48080-8˙7
- Hammer et al. (2006) Hammer F., Flores H., Schaerer D., Dessauges-Zavadsky M., Le Floc’h E., Puech M., 2006, A&A, 454, 103
- Hibbard & van Gorkom (1996) Hibbard J. E., van Gorkom J. H., 1996, AJ, 111, 655
- Hirschi et al. (2005) Hirschi R., Meynet G., Maeder A., 2005, A&A, 443, 581
- Hjorth et al. (2003) Hjorth J., et al., 2003, Nature, 423, 847
- Horellou & Combes (2001) Horellou C., Combes F., 2001, Ap&SS, 276, 1141
- Houck et al. (2004) Houck J. R., et al., 2004, ApJS, 154, 18
- Hunt et al. (2014) Hunt L. K., et al., 2014, A&A, 565, A112
- Izzard et al. (2004) Izzard R. G., Ramirez-Ruiz E., Tout C. A., 2004, MNRAS, 348, 1215
- Kelly et al. (2014) Kelly P. L., Filippenko A. V., Modjaz M., Kocevski D., 2014, ApJ, 789, 23
- Kennicutt (1998) Kennicutt Jr. R. C., 1998, ApJ, 498, 541
- Kinugawa & Asano (2017) Kinugawa T., Asano K., 2017, ApJ, 849, L29
- Krühler et al. (2015) Krühler T., et al., 2015, A&A, 581, A125
- Krühler et al. (2017) Krühler T., Kuncarayakti H., Schady P., Anderson J. P., Galbany L., Gensior J., 2017, A&A, 602, A85
- Lagos et al. (2013) Lagos C. d. P., Lacey C. G., Baugh C. M., 2013, MNRAS, 436, 1787
- Le Floc’h et al. (2003) Le Floc’h E., et al., 2003, A&A, 400, 499
- Le Floc’h et al. (2006) Le Floc’h E., Charmandaris V., Forrest W. J., Mirabel I. F., Armus L., Devost D., 2006, ApJ, 642, 636
- Le Floc’h et al. (2012) Le Floc’h E., Charmandaris V., Gordon K., Forrest W. J., Brandl B., Schaerer D., Dessauges-Zavadsky M., Armus L., 2012, ApJ, 746, 7
- Leitherer et al. (1999) Leitherer C., et al., 1999, ApJS, 123, 3
- Leroy et al. (2008) Leroy A. K., Walter F., Brinks E., Bigiel F., de Blok W. J. G., Madore B., Thornley M. D., 2008, AJ, 136, 2782
- Lyman et al. (2017) Lyman J. D., et al., 2017, MNRAS, 467, 1795
- MacFadyen & Woosley (1999) MacFadyen A. I., Woosley S. E., 1999, ApJ, 524, 262
- Malesani et al. (2004) Malesani D., et al., 2004, ApJ, 609, L5
- Marks et al. (2012) Marks M., Kroupa P., Dabringhausen J., Pawlowski M. S., 2012, MNRAS, 422, 2246
- Mason et al. (2009) Mason B. D., Hartkopf W. I., Gies D. R., Henry T. J., Helsel J. W., 2009, AJ, 137, 3358
- McGaugh (2012) McGaugh S. S., 2012, AJ, 143, 40
- Michałowski et al. (2014) Michałowski M. J., et al., 2014, A&A, 562, A70
- Paczyński (1998) Paczyński B., 1998, ApJ, 494, L45
- Pan et al. (2018) Pan H.-A., et al., 2018, preprint, (arXiv:1810.10162)
- Peacock et al. (2017) Peacock M. B., et al., 2017, ApJ, 841, 28
- Pellerin et al. (2010) Pellerin A., Meurer G. R., Bekki K., Elmegreen D. M., Wong O. I., Knezek P. M., 2010, AJ, 139, 1369
- Perley et al. (2013) Perley D. A., et al., 2013, ApJ, 778, 128
- Perley et al. (2015) Perley D. A., et al., 2015, ApJ, 801, 102
- Perley et al. (2016) Perley D. A., et al., 2016, ApJ, 817, 8
- Pian et al. (2006) Pian E., et al., 2006, Nature, 442, 1011
- Piran (2004) Piran T., 2004, Reviews of Modern Physics, 76, 1143
- Piran et al. (2013) Piran T., Bromberg O., Nakar E., Sari R., 2013, Philosophical Transactions of the Royal Society of London Series A, 371, 20120273
- Podsiadlowski et al. (2004) Podsiadlowski P., Mazzali P. A., Nomoto K., Lazzati D., Cappellaro E., 2004, ApJ, 607, L17
- Podsiadlowski et al. (2010) Podsiadlowski P., Ivanova N., Justham S., Rappaport S., 2010, MNRAS, 406, 840
- Powell et al. (2013) Powell L. C., Bournaud F., Chapon D., Teyssier R., 2013, MNRAS, 434, 1028
- Prochaska et al. (2008) Prochaska J. X., Chen H.-W., Wolfe A. M., Dessauges-Zavadsky M., Bloom J. S., 2008, ApJ, 672, 59
- Renaud (2018) Renaud F., 2018, New Astron. Rev., 81, 1
- Renaud et al. (2014) Renaud F., Bournaud F., Kraljic K., Duc P.-A., 2014, MNRAS, 442, L33
- Renaud et al. (2018) Renaud F., et al., 2018, MNRAS, 473, 585
- Saintonge et al. (2011) Saintonge A., et al., 2011, MNRAS, 415, 32
- Sana et al. (2012) Sana H., et al., 2012, Science, 337, 444
- Sana et al. (2014) Sana H., et al., 2014, ApJS, 215, 15
- Savaglio (2015) Savaglio S., 2015, Journal of High Energy Astrophysics, 7, 95
- Savaglio et al. (2009) Savaglio S., Glazebrook K., Le Borgne D., 2009, ApJ, 691, 182
- Savaglio et al. (2012) Savaglio S., et al., 2012, MNRAS, 420, 627
- Schady et al. (2015) Schady P., et al., 2015, A&A, 579, A126
- Schaye & Dalla Vecchia (2008) Schaye J., Dalla Vecchia C., 2008, MNRAS, 383, 1210
- Schaye et al. (2010) Schaye J., et al., 2010, MNRAS, 402, 1536
- Schneider et al. (2018) Schneider F. R. N., et al., 2018, Science, 359, 69
- Sharma et al. (2017) Sharma M., Theuns T., Frenk C., Bower R. G., Crain R. A., Schaller M., Schaye J., 2017, MNRAS, 468, 2176
- Sokolov et al. (2001) Sokolov V. V., et al., 2001, A&A, 372, 438
- Sollerman et al. (2005) Sollerman J., Östlin G., Fynbo J. P. U., Hjorth J., Fruchter A., Pedersen K., 2005, New Astron., 11, 103
- Springel (2005) Springel V., 2005, MNRAS, 364, 1105
- Springel et al. (2001) Springel V., Yoshida N., White S. D. M., 2001, New Astron., 6, 79
- Stanek et al. (2003) Stanek K. Z., et al., 2003, ApJ, 591, L17
- Starkenburg et al. (2016) Starkenburg T. K., Helmi A., Sales L. V., 2016, A&A, 587, A24
- Struck et al. (1996) Struck C., Appleton P. N., Borne K. D., Lucas R. A., 1996, AJ, 112, 1868
- Svensson et al. (2010) Svensson K. M., Levan A. J., Tanvir N. R., Fruchter A. S., Strolger L.-G., 2010, MNRAS, 405, 57
- Svensson et al. (2012) Svensson K. M., et al., 2012, MNRAS, 421, 25
- Tanvir et al. (2009) Tanvir N. R., et al., 2009, Nature, 461, 1254
- Teyssier et al. (2010) Teyssier R., Chapon D., Bournaud F., 2010, ApJ, 720, L149
- Tout et al. (2011) Tout C. A., Wickramasinghe D. T., Lau H. H.-B., Pringle J. E., Ferrario L., 2011, MNRAS, 410, 2458
- Usov (1992) Usov V. V., 1992, Nature, 357, 472
- Wainwright et al. (2007) Wainwright C., Berger E., Penprase B. E., 2007, ApJ, 657, 367
- Weidner et al. (2010) Weidner C., Bonnell I. A., Zinnecker H., 2010, ApJ, 724, 1503
- Wiseman et al. (2017) Wiseman P., Perley D. A., Schady P., Prochaska J. X., de Ugarte Postigo A., Krühler T., Yates R. M., Greiner J., 2017, A&A, 607, A107
- Wong et al. (2006) Wong O. I., et al., 2006, MNRAS, 370, 1607
- Woosley (1993) Woosley S. E., 1993, ApJ, 405, 273
- Woosley & Heger (2006) Woosley S. E., Heger A., 2006, ApJ, 637, 914
- Yoon & Langer (2005) Yoon S.-C., Langer N., 2005, A&A, 443, 643
- Zhang et al. (2003) Zhang W., Woosley S. E., MacFadyen A. I., 2003, ApJ, 586, 356
- Zhang et al. (2004) Zhang W., Woosley S. E., Heger A., 2004, ApJ, 608, 365
- Zhang et al. (2018) Zhang Z.-Y., Romano D., Ivison R. J., Papadopoulos P. P., Matteucci F., 2018, Nature, 558, 260
- Zhu et al. (2010) Zhu Y.-N., Wu H., Li H.-N., Cao C., 2010, Research in Astronomy and Astrophysics, 10, 329
- de Grijs et al. (2003) de Grijs R., Lee J. T., Clemencia Mora Herrera M., Fritze-v. Alvensleben U., Anders P., 2003, New Astron., 8, 155
- van den Heuvel & Portegies Zwart (2013) van den Heuvel E. P. J., Portegies Zwart S. F., 2013, ApJ, 779, 114