Hi 21 cm mapping of the host galaxy of AT2018cow: a fast-evolving luminous transient within a ring of high column density gas
Abstract
We report Giant Metrewave Radio Telescope (GMRT) Hi 21 cm imaging of CGCG 137068, the host galaxy of the fast-evolving luminous transient (FELT) AT2018cow. This is the first study of the gas properties of a FELT host galaxy. We obtain a total Hi mass of M⊙ for the host galaxy, which implies an atomic gas depletion time of Gyr and a gas-to-stellar mass ratio of , consistent with values in normal star-forming dwarf galaxies. At spatial resolutions of kpc, the Hi of CGCG 137068 appears to be distributed in a disk, in mostly regular rotation. However, at spatial resolutions of kpc, the highest column density Hi is found to lie in an asymmetric ring around the central regions, with Hi column densities cm-2; AT2018cow lies within this high column density ring. This Hi ring could be suggestive of an interaction between CGCG 137068 and a companion galaxy. Such a ring is ideal for the formation of compact regions of star formation hosting massive stars which are likely progenitors of FELTs. We measure a 1.4 GHz flux density of mJy for AT2018cow on 2018 August 27.
keywords:
galaxies: ISM – galaxies: kinematics and dynamics – galaxies: star formation – radio lines: galaxies – stars: individual (AT2018cow) – stars: massive1 Introduction
Over the last decade, high-cadence wide-field optical surveys have resulted in the discovery of a new class of extragalactic variable sources, referred to as fast-evolving luminous transients (“FELTs”; Drout et al., 2014; Arcavi et al., 2016; Tanaka et al., 2016; Rest et al., 2018; Pursiainen et al., 2018). These transients show rapid rise and fading times, with, typically, days to peak luminosity and exponential decline days after the peak, and a wide range of peak luminosities, (e.g. Pursiainen et al., 2018). A black-body model provides a good fit to the optical spectral energy distribution upto a few weaks after the peak, yielding peak bolometric luminosities of to erg s-1 and peak temperatures of to K (Drout et al., 2014; Pursiainen et al., 2018). The spectra are typically featureless blue continua, consistent with hot ejecta (Drout et al., 2014; Pursiainen et al., 2018).
Nearly 100 FELTs have been detected till date, with spectroscopic redshifts available for about half of the host galaxies (typically in the redshift range to ; e.g. Pursiainen et al., 2018). Although the wide range of FELT luminosities has been difficult to explain in theoretical models, Pursiainen et al. (2018) emphasize that all their events with identified hosts arise in star-forming galaxies. This favours models in which FELTs originate in short-lived massive progenitor stars (see, e.g., Kasen & Bildsten, 2010; Chevalier & Irwin, 2011; Dexter & Kasen, 2013; Kleiser & Kasen, 2014; Rest et al., 2018). Unfortunately, the rarity of FELTs has meant that most events have not been identified in real time, but rather in archival surveys, without the possibility of early multi-wavelength studies that might allow one to distinguish between the various models.
The remarkable optical transient AT2018cow was discovered on 2018 June 16 by the Asteroid Terrestrial-impact Last Alert System (ATLAS) survey (Smartt et al., 2018; Prentice et al., 2018). With a rise time of days (Prentice et al., 2018), a blue spectrum, a black-body optical spectrum around the peak with a temperature of K, and a peak bolometric luminosity of erg s-1 (Perley et al., 2019), it has characteristics similar to the FELTs discovered in earlier surveys. However, the early ATLAS identification of this transient allowed rapid follow-up observations over a wide range of frequencies, extending from the radio regime to X-rays and gamma rays (e.g. Ho et al., 2019; Kuin et al., 2019; Perley et al., 2019; Margutti et al., 2018). These studies have found evidence for a number of exciting new characteristics, including (1) a very fast rise and fading, on timescales of a few days, (2) an initially featureless optical spectrum, followed by a single broad absorption feature during days after the peak, centred at Å, followed by a weak, broad emission feature at Å, and then a variety of similar emission lines, (3) a high radio luminosity, (4) long-lived millimetre-wave emission, extending to GHz, (5) an additional source of X-ray emission from what appears to be a central engine, etc (e.g. Prentice et al., 2018; Ho et al., 2019; Perley et al., 2019; Margutti et al., 2018). The detailed observational properties have proved challenging to explain so far, with some authors arguing for a supernova shock wave breaking out of a dense medium, others for a central engine providing extended energy injection, and yet others for a disruption of a stellar companion by an intermediate-mass black hole.
AT2018cow is located (equivalent to kpc, Perley et al., 2019) from the centre of the dwarf spiral galaxy CGCG 137-068, at (Adelman-McCarthy et al., 2008). This is the first case of the discovery of a FELT in the nearby Universe, providing a unique opportunity to study physical conditions in the host galaxy of the transient, and the environment that gives rise to such an event. Studies of the distribution and kinematics of atomic hydrogen through Hi 21 cm emission line observations of FELT host galaxies are a promising tool to probe the environment that gives rise to the progenitors of these transients. Such a study has provided important observational clues to the origin of a transient in the case of the nearest Gamma Ray Burst (GRB) host galaxy (Arabsalmani et al., 2015, Arabsalmani et al., in press). In this Letter, we present a Giant Metrewave Radio Telescope (GMRT) Hi 21 cm study of CGCG 137-068, the first case of Hi 21 cm emission mapping of the neutral gas in a FELT host galaxy.
2 Observations and data analysis
We used the GMRT L-band receivers to observe CGCG 137-068 on 2018 August 27 in proposal DDTC022 (PI: Arabsalmani). The observations used the GMRT Software Backend as the correlator, with a bandwidth of 16.67 MHz, centred at 1399.67 MHz and sub-divided into 512 channels, yielding a velocity resolution of km s-1 and a total velocity coverage of km s-1 (at ). Observations of the standard primary calibrators 3C286 and 3C48 at the start and end of the run were used to calibrate the flux density scale, and of the nearby bright compact source 1609+266, to calibrate the antenna gains and passband shapes. The total on-source time was hours, with 27 working antennas.
The GMRT data were analysed in “classic” aips (Greisen, 2003), following standard procedures. After initial data editing to remove dead antennas and data affected by radio frequency interference, and calibration of the complex gains and passband shapes, the calibrated visibilities were averaged together (excluding edge channels and km s-1 around the expected Hi 21 cm redshifted line frequency of CGCG 137-068) to produce a multi-channel continuum data set with a frequency resolution of MHz (to avoid frequency-smearing in the continuum image). The final antenna-based gains were obtained via a standard iterative self-calibration and imaging procedure on this data set, with a few rounds of phase-only self-calibration and 3-D imaging, followed by amplitude-and-phase self-calibration, 3-D imaging, and further data editing. The imaging was done using the full uv-data set excluding baselines which are smaller than 1 kilo , with a uv-taper of 90 kilo and robust weighting ( being the observation wavelength). The average amplitude of the antenna gains was normalized during the amplitude-and-phase self-calibration, to preserve the flux density scale. This procedure was repeated until the image showed no improvement on further self-calibration. The entire GMRT primary beam was imaged, out to a radius of degrees, using 37 facets.
We subtracted out the final continuum image from the calibrated spectral-line visibilities using the task uvsub, and next used the task cvel to shift the residual visibilities to the heliocentric frame. The residual visibilities were then imaged with different tapering and weighting schemes, to produce spectral cubes at a range of angular resolutions. To increase the signal-to-noise ratio while deconvolving the array point spread function, the cubes were created by averaging either two or three channels, yielding final velocity resolutions of km s-1 or km s-1. Any residual continuum emission was removed by fitting a second-order polynomial in the image plane, using the task imlin. The parameters of the different spectral cubes, made at different angular and velocity resolutions, are presented in Table 1. Note that the cube with the coarsest angular resolution () and velocity resolution ( km/s) was made in order to accurately estimate the total Hi mass of the galaxy, without resolving out any of the Hi 21 cm emission.
| Synthesized Beam | uv-maximum | uv-taper | weighting | Channel width | RMS noise |
|---|---|---|---|---|---|
| () | (kilo ) | (kilo ) | (km s-1) | (mJy Bm-1) | |
| 5 | 4.8 | natural | |||
| 10 | 6 | robust | |||
| 20 | 12 | robust | |||
| 40 | 30 | robust |
The task momnt was then applied to the spectral cubes to obtain maps of the total Hi 21 cm intensity and the intensity-weighted Hi 21 cm velocity field at the chosen angular resolutions. This task creates a secondary spectral cube by smoothing out the emission along both spatial and velocity axes, and then masks out pixels lying below a chosen threshold flux. The mask is applied to the original spectral cube before creating the moment maps. The smoothing ensures that localized noise peaks are ignored, and that only emission that is correlated both spatially and along the velocity axis is selected. We smoothed our spectral cubes spatially with a Gaussian kernel of full width at half maximum (FWHM) equal to six pixels, and along the velocity axis by applying Hanning smoothing across blocks of three consecutive velocity channels. The threshold flux used to create the mask was typically times the root-mean-square noise in each channel of the original spectral cube.
The integrated Hi 21 cm emission spectrum for CGCG 137068 was derived from the lowest-resolution spectral cube, by summing over the flux within the spatial extent of the total Hi 21 cm intensity (i.e. zeroth moment) image, in each channel of the cube. The Hi 21 cm spectrum and the moment images made from the higher-resolution data cubes are presented and discussed in the next section.
3 Results
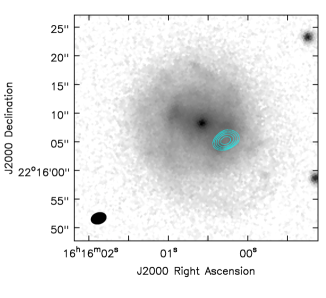
The GMRT 1.4 GHz continuum image, the central portion of which is shown in Fig. 1, has an angular resolution of , and a root-mean-square (RMS) noise of Jy/Bm, away from bright sources. An unresolved source is clearly visible at the centre of the image, at (J2000 co-ordinates) RA = 16h16m00.3s, Dec. = 22d16′05′′, consistent within the errors with the position of AT2018cow (Bietenholz et al., 2018). We fit a 2-D Gaussian model to a small region centred on the source to obtain its flux density. Based on our earlier experience, systematic errors in the GMRT flux density scale are % at these frequencies, and with the above analysis procedure. The measured value for the 1.4 GHz flux density of AT2018cow on 2018 August 27 is mJy, where we have added the statistical error from the fit and the systematic error on the flux density scale in quadrature.

The GMRT Hi 21 cm emission spectrum of CGCG 137068 is shown in Fig. 2. We measure an integrated Hi 21 cm line flux density of Jy km s-1, where the quoted error combines, in quadrature, the statistical error and an assumed 10% systematic error on the flux scale. Using a luminosity distance of Mpc 111We assume a flat Lambda Cold Dark Matter cosmology, with km s-1 Mpc-1, , and (Ade et al., 2016)., we obtain a total Hi mass of for CGCG 137068. The Hi 21 cm emission profile has a velocity width of km s-1.
 |
 |
|
 |
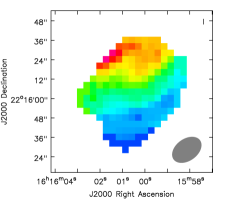 |
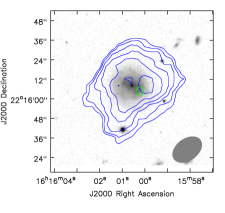
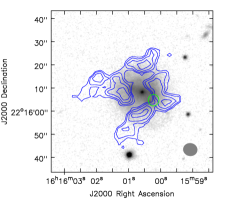
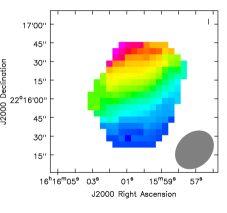
We study the spatial structure and kinematics of the Hi in CGCG 137068 using the zeroth and first velocity moment maps of the Hi 21 cm emission derived from spectral cubes created at three different resolutions (the three highest resolutions listed in Table 1). The moment maps are presented in Fig. 3, where the angular resolutions of the images are (left panel), (middle panel), and (right panel). Note that as we improve the angular resolution of the Hi 21 cm images, we are less sensitive to low column densities. Thus, making the images at different resolutions helps us capture both the extent of the diffuse atomic gas and the structure of the atomic gas on smaller scales. The Hi 21 cm column density (contours) overlaid on a Sloan Digital Sky Survey (SDSS; Adelman-McCarthy et al., 2008) Data Release 6 r-band image (in greyscale) are shown in the panels of the top row in Fig. 3, while those of the bottom row show the Hi 21 cm velocity field. It is clear from the left and middle panels (spatial resolutions kpc) that the Hi in CGCG 137068 is distributed in a disk which extends beyond the optical disk of the galaxy. The velocity fields in the left and middle panels indicate that the Hi is in regular rotation.
Our highest-resolution Hi 21 cm images of CGCG 137068 (spatial resolution kpc) are shown in the right panels of Fig. 3. At this angular resolution, the image is only sensitive to gas at a high Hi column density, cm-2. The high column density atomic gas is seen to lie in an asymmetric ring around the optical centre of the galaxy. The transient AT2018cow (location indicated by the green circle in the top panels) lies within this ridge of high column density gas; the Hi 21 cm column density around the location of AT2018cow averaged over the area of the beam is cm-2.
The velocity structure of the high column density gas at this high angular resolution is particularly interesting. The rotation evident in the lower resolution maps is much more broken and non-uniform at this high resolution. We note that there exist large velocity gradients within the ring, as high as km s-1 over kpc scales.
4 Discussion
CGCG 137068 has a stellar mass of and a star formation rate (SFR) of (Perley et al., 2019). These properties are consistent with a “main sequence” galaxy in the M∗–SFR plane in the nearby Universe (Brinchmann et al., 2004). Our Hi mass estimate of M⊙ then yields a gas-to-stellar mass ratio of , consistent with values in normal star-forming galaxies with similar stellar masses (e.g. Dénes et al., 2014). Comparing the Hi mass with the SFR yields an atomic gas depletion time of Gyr, again consistent with typical values in star-forming galaxies in the nearby Universe (see, e.g., the xCOLDGASS sample; Saintonge et al., 2017). By comparing the width of the Hi 21 cm emission of CGCG 137068 with its combined gasstellar mass, we find that the galaxy follows the baryonic Tully-Fisher relation (Zaritsky et al., 2014). Overall, both the global stellar and Hi properties of CGCG 137068 are consistent with its being a normal star-forming dwarf galaxy, on the main sequence.
While the global stellar and gas properties of CGCG 137068 are typical of normal star-forming galaxies, the same cannot be said of the spatial distribution or the velocity field of the atomic gas, as seen in the highest-resolution GMRT Hi 21 cm images of Fig. 3. The highest column density Hi appears to be arranged in a asymmetric ring around the central regions of the galaxy. Such a high-column density ring of atomic gas is very unusual for a low-mass dwarf galaxy such as CGCG 137068. The transient AT2018cow is located within this ring of high column density Hi gas. This suggests that the occurrence of AT2018cow might be related to the compression of gas to high densities within the ring, that could have caused a rapid burst of star formation.
Similar evidence that a highly energetic event took place in the highest column density Hi in a galaxy was found by Arabsalmani et al. (2015) based on GMRT Hi 21 cm mapping observations of the host galaxy of GRB 980425. There too, the high column density Hi appears to be in a ring, which is the site of actively star-forming regions in the galaxy. Deeper follow-up Hi 21 cm observations, combined with archival Very Large Telescope and Spitzer Space Telescope imaging data, have revealed the presence of a faint companion galaxy interacting with the GRB host galaxy (Arabsalmani et al., in press). Numerical simulations of galaxy-galaxy mergers by Arabsalmani et al. (inn press) show that a collisional interaction between the GRB host galaxy and the companion can explain the formation of the high column density Hi ring. Their simulations indicate that a collisional gas ring should have velocity gradients of a few tens of km s-1 on sub-kpc scales within the ring.
Regions of compact and intense star formation like super star-clusters can produce a number of high-mass stars which are the progenitors of highly energetic stellar events like GRBs, and the likely progenitors of FELTs. Interacting galaxies are ideal sites for the formation of such super star-clusters, due to the formation of compact and massive Giant Molecular Clouds (GMCs) in such systems (e.g. Jog & Solomon, 1992; Barnes & Hernquist, 1996; Mihos & Hernquist, 1996; Renaud et al., 2009). Massive GMCs form efficiently in interacting galaxies due to the absence of gravitational shear and the increased turbulence, which both aid in the collapse of large amounts of gas. The large velocity gradients within the interstellar gas of such systems also increases the Jeans mass of collapsing clouds. The increased Jeans mass increases the temperature of the clouds, thereby shifting the stellar mass function towards the high mass end (Elmegreen et al., 1993). Massive super star-clusters (SSCs) have indeed been found more commonly in interacting systems (e.g. Elmegreen et al., 1993; de Grijs et al., 2003; Bastian, 2008). In particular, collisional interactions have been shown to be efficient in forming fewer but more massive and compact SSCs compared to tidal interactions (see Renaud et al., 2018, and references therein). Therefore, a connection between interacting galaxies and highly energetic transients born out of massive stars appears to be a plausible one.
After GRB 980425, AT2018cow is the second case of a luminous transient associated with an asymmetric ring of high column density atomic gas in the host galaxy. The velocity gradient in the western section of the ring (which contains AT2018cow) reaches km s-1 on the spatial scales of kpc (our highest resolution), similar to what is seen for the Hi ring in the host galaxy of GRB 980425. The observed velocity gradient is relatively large for a low-mass galaxy like CGCG 137068. Deeper and higher resolution Hi observations are required to confirm the existence of high velocity gradients on sub-kpc scales within the ring of high column density Hi .
We note, in passing, that the William Herschel Telescope r-band optical image of CGCG 137-068 (Perley et al., 2019) shows indications of a stellar ring, roughly coincident with the HI ring reported here. Deep multi-wavelength observations are required to confirm whether GMCs and regions of dense star formation are located along the Hi ring, especially around the location of AT2018cow.
In summary, we have used the GMRT to carry out Hi 21 cm spectroscopy of CGCG 137068, the host galaxy of the fast-evolving luminous transient AT2018cow. This is the first study of the gas properties of a FELT host galaxy. Our kpc spatial resolution GMRT Hi 21 cm maps indicate that CGCG 137068 is a disk galaxy, with the Hi mostly in regular rotation, and with an Hi mass of M⊙. We obtain a gas-to-stellar mass ratio of and a gas depletion time of Gyr, both consistent with typical values found in normal star-forming dwarf galaxies in the nearby Universe. However, our kpc spatial resolution Hi 21 cm image shows that the high column density atomic gas is distributed in an asymmetric ring around the central regions of the galaxy and with high velocity gradients. AT2018cow is located within this high Hi column density ring. Such a ring is an ideal site for the formation of super star-clusters hosting massive stars which are the likely progenitors of luminous transients like AT2018cow.
Acknowledgments
MA would like to thank Emeric Le Floc’h and Frederic Bournaud for helpful discussions. MA acknowledges support from UnivEarthS Labex program at Sorbonne Paris Cité (ANR-10-LABX-0023 and ANR-11-IDEX-0005-02). NK acknowledges support from the Department of Science and Technology via a Swarnajayanti Fellowship (DST/SJF/PSA-01/2012-13). We thank the staff of the GMRT who have made these observations possible. The GMRT is run by the National Centre for Radio Astrophysics of the Tata Institute of Fundamental Research.
References
- Ade et al. (2016) Ade P. A. R., et al., 2016, A&A, 594, A13
- Adelman-McCarthy et al. (2008) Adelman-McCarthy J. K., et al., 2008, ApJS, 175, 297
- Arabsalmani et al. (2015) Arabsalmani M., Roychowdhury S., Zwaan M. A., Kanekar N., Michałowski M. J., 2015, MNRAS, 454, L51
- Arcavi et al. (2016) Arcavi I., et al., 2016, ApJ, 819, 35
- Barnes & Hernquist (1996) Barnes J. E., Hernquist L., 1996, ApJ, 471, 115
- Bastian (2008) Bastian N., 2008, MNRAS, 390, 759
- Bietenholz et al. (2018) Bietenholz M., et al., 2018, The Astronomer’s Telegram, 11900
- Brinchmann et al. (2004) Brinchmann J., Charlot S., White S. D. M., Tremonti C., Kauffmann G., Heckman T., Brinkmann J., 2004, MNRAS, 351, 1151
- Chevalier & Irwin (2011) Chevalier R. A., Irwin C. M., 2011, ApJ, 729, L6
- Dénes et al. (2014) Dénes H., Kilborn V. A., Koribalski B. S., 2014, MNRAS, 444, 667
- Dexter & Kasen (2013) Dexter J., Kasen D., 2013, ApJ, 772, 30
- Drout et al. (2014) Drout M. R., et al., 2014, ApJ, 794, 23
- Elmegreen et al. (1993) Elmegreen B. G., Kaufman M., Thomasson M., 1993, ApJ, 412, 90
- Greisen (2003) Greisen E. W., 2003, in Heck A., ed., Astrophysics and Space Science Library Vol. 285, Information Handling in Astronomy - Historical Vistas. p. 109
- Ho et al. (2019) Ho A. Y. Q., et al., 2019, ApJ, 871, 73
- Jog & Solomon (1992) Jog C. J., Solomon P. M., 1992, ApJ, 387, 152
- Kasen & Bildsten (2010) Kasen D., Bildsten L., 2010, ApJ, 717, 245
- Kleiser & Kasen (2014) Kleiser I. K. W., Kasen D., 2014, MNRAS, 438, 318
- Kuin et al. (2019) Kuin N. P. M., et al., 2019, MNRAS,
- Margutti et al. (2018) Margutti R., et al., 2018, preprint, (arXiv:1810.10720)
- Mihos & Hernquist (1996) Mihos J. C., Hernquist L., 1996, ApJ, 464, 641
- Perley et al. (2019) Perley D. A., et al., 2019, MNRAS, 484, 1031
- Prentice et al. (2018) Prentice S. J., et al., 2018, ApJ, 865, L3
- Pursiainen et al. (2018) Pursiainen M., et al., 2018, MNRAS, 481, 894
- Renaud et al. (2009) Renaud F., Boily C. M., Naab T., Theis C., 2009, ApJ, 706, 67
- Renaud et al. (2018) Renaud F., et al., 2018, MNRAS, 473, 585
- Rest et al. (2018) Rest A., et al., 2018, Nature Astronomy, 2, 307
- Saintonge et al. (2017) Saintonge A., et al., 2017, ApJS, 233, 22
- Smartt et al. (2018) Smartt S. J., et al., 2018, The Astronomer’s Telegram, 11727
- Tanaka et al. (2016) Tanaka M., et al., 2016, ApJ, 819, 5
- Zaritsky et al. (2014) Zaritsky D., et al., 2014, AJ, 147, 134
- de Grijs et al. (2003) de Grijs R., Lee J. T., Clemencia Mora Herrera M., Fritze-v. Alvensleben U., Anders P., 2003, New Astron., 8, 155