The black hole X-ray transient Swift J1357.2-0933 as seen with Swift and NuSTAR during its 2017 outburst
Abstract
We report on observations of black hole Swift J1357.2-0933, a member of the modest population of very faint X-ray transients. This source has previously shown intense dips in the optical lightcurve, a phenomena that has been linked to the existence of a “unique toroidal structure” in the inner region of the disc, seen at a high inclination. Our observations, carried out by the Neil Gehrels Swift and NuSTAR X-ray observatories, do not show the presence of intense dips in the optical light curves. We find that the X-ray light curves do not show any features that would straightforwardly support an edge-on configuration or high inclination configuration of the orbit. This is similar to what was seen in the X-ray observations of the source during its 2011 outburst. Moreover, the broadband spectra were well described with an absorbed power-law model without any signatures of cut-off at energies above 10 keV, or any reflection from the disc or the putative torus. Thus, the X-ray data do not support the unique ’obscuring torus’ scenario proposed for J1357. We also performed a multi-wavelength study using the data of X-ray telescope and Ultraviolet/Optical Telescope aboard Swift, taken during the ∼4.5 months duration of the 2017 outburst. This is consistent with what was previously inferred for this source. We found a correlation between the simultaneous X-ray and ultraviolet/optical data and our study suggests that most of the reprocessed flux must be coming out in the ultraviolet.
keywords:
accretion, accretion discs, black hole physics, X-rays: binaries.1 Introduction
Low mass X-ray Binaries (LMXBs) are one of the brightest sources of
X-ray emission in the sky and harbor a black hole (BH) or neutron star (NS). These compact objects accrete gas from their low-mass companion star, typically having mass less than a solar mass (). However, in some BH-LMXBs the companion has a mass which is a few times (e.g., GRS 1915+105; Reid et al., 2014).
Most LMXBs are transients spending most of their time in quiescence with X-ray luminosities of , interrupted by occasional outburst episodes. During outbursts, LMXBs
accrete at much higher rates (than when in quiescence), resulting in an increase in the observed by several orders of magnitude.
Transient LMXBs can be classified as bright X-ray transients, Faint X-ray transients, and Very faint X-ray transients (VFXTs),
based on their 2-10 keV peak luminosity () reached during outburst.
VFXTs are defined as the systems that reach of only
, orders of magnitude
lower than bright X-ray transients, which display (see Wijnands
et al., 2006, for details). This classification in luminosity classes is phenomenological and does not necessarily reflect any physical difference between the systems.
Despite the growth of the known population of VFXTs over the last 15 years, the X-ray behavior of such systems is not yet completely understood. An example of a BH VFXTs is the Galactic LMXB, Swift J1357.2-0933 (hereafter, J1357).
This source was discovered on 2011, January 28 when an outburst was detected with the Swift Burst Alert Telescope (Krimm
et al., 2011a).
This outburst lasted for about 7 months.
Several X-ray as well as ground-based
observations were carried out during this outburst (see e.g., Casares
et al., 2011; Krimm
et al., 2011b; Milisavljevic et al., 2011; Armas Padilla et al., 2013; Armas Padilla
et al., 2014). The peak X-ray luminosity () observed in 2-10 keV band during this outburst was , placing
J1357 in the category of VFXTs (Armas Padilla et al., 2013).
Optical observations performed during the 2011 outburst
revealed the black hole nature of the accretor (Corral-Santana et al., 2013), making J1357 one of the very few VFXTs confirmed to harbor a BH (Armas Padilla
et al., 2014; Corral-Santana et al., 2013). Based on optical data, Corral-Santana et al. (2013) were able to find an orbital period of
2.8 h, and based on optical observations the source distance is estimated to lie within a range of 0.5 and 6.3 kpc (Rau
et al., 2011; Shahbaz et al., 2013).
The optical light curves also showed the presence of intense dips (Corral-Santana et al., 2013). The optical dip recurrence time evolved over time and the frequency associated with the dip recurrence time was found to decrease throughout the outburst decay (Corral-Santana et al., 2013).
The dips observed in the optical light curves have been linked to
the existence of a “toroidal structure” in the inner region of the disc. This obscuring structure is thought to move outwards as the mass accretion rate decreases and can only be seen at very high inclination (70∘, Corral-Santana et al., 2013; Mata Sánchez
et al., 2015).
The light curves of J1357 during
quiescence showed similar dips and also flares (Shahbaz et al., 2013; Russell et al., 2017).
This kind of large optical variability has never been observed in any other LMXB when they are observed at similar time resolution (Russell et al., 2017).
LMXBs that have between 60∘ and 80∘ with respect to the line of sight are observed to show signatures of the orbital motion (eclipse) or dips in the X-ray light curves (see e.g., Parmar et al., 1986; Courvoisier et al., 1986). The X-ray observations made with Rossi X-ray Timing Explorer (RXTE) and XMM-Newton during the outburst of J1357 in 2011 did not show any of these features (Corral-Santana et al., 2013; Armas Padilla
et al., 2014).
The lack of signatures of the orbital motion in the RXTE light curves were suggested to be because of the existence of extreme mass ratio in this system (Corral-Santana et al., 2013). The very small size of the donor could make the X-ray eclipse very shallow and difficult to detect in J1357. However, this interpretation
is not secure and not all the observed phenomena can be explained by it (see Armas Padilla
et al., 2014, for a discussion).
During the 2011 outburst of J1357, one of the RXTE observations made near the beginning of the outburst revealed the presence of a quasi-periodic oscillation (QPO) at a frequency (milli-hertz; mHz) similar to that of the optical dips. However, this feature was not present in any of the subsequent X-ray observations made close to the dates of the detection of the optical dips (Armas Padilla
et al., 2014).
The same authors found that on the extrapolation of the frequency of optical dips near the beginning of the outburst resulted into a much higher frequency than observed in X-rays.
Thus, it is not clear whether the mechanism behind the optical dips is similar to that behind the X-ray QPO (Armas Padilla
et al., 2014).
The X-ray spectrum of J1357 has also been investigated during its outburst in 2011
with data from the Swift and XMM-Newton observatories
(Armas Padilla et al., 2013; Armas Padilla
et al., 2014).
The Swift-XRT observations showed
softening of the X-ray spectra with the decrease in X-ray flux. This behavior is typical of X-ray binaries that accrete at sub-luminous accretion rates ( ; see Armas Padilla et al., 2013; Wijnands
et al., 2015).
The high quality X-ray data obtained with XMM-Newton showed the presence of soft thermal disc component with a temperature of 0.22 keV and a hard Comptonized component (NTHCOMP) with a photon index of 1.6 and an electron temperature () 8.2
(Armas Padilla et al., 2013).
However, no evidence of reflection features that support the torus scenario were found in the X-ray spectrum. Thus, the overall geometry of J1357 is still under debate.
On 2017 April 20, J1357 underwent its second outburst (Drake
et al., 2017; Sivakoff et al., 2017) providing an opportunity to further investigate this source.
One of the ways to test the putative torus model is to study the broadband X-ray spectrum covering energies above 10 keV. The detection of any signatures of a high energy cut-off,
or any reflection from the disc will be quite useful to test the torus model. Here, we report results obtained using data from the Swift and NuSTAR observatories.
| Obs-ID | Time (MJD) | Mode | Exp-time (ksec) | (dof) | |||
|---|---|---|---|---|---|---|---|
| 31918049 | 57864.8471 | WT | 1.4 | 0.53 (27) | |||
| 31918050 | 57866.7112 | WT | 1.4 | 0.71 (20) | |||
| 31918051 | 57867.6940 | WT | 0.7 | 0.70 (37) | |||
| 88094002 | 57871.1618 | PC | 1.0 | 0.94 (46) | |||
| 31918054 | 57874.8192 | WT | 0.2 | 0.73 (24) | |||
| 31918055 | 57876.2725 | WT | 0.5 | 1.2 (24) | |||
| 31918056 | 57878.3949 | WT | 0.5 | 1.2 (32) | |||
| 31918057 | 57885.7127 | WT | 1.0 | 1.06 (76) | |||
| 31918058 | 57888.5048 | WT | 1.0 | 1.07 (49) | |||
| 31918059 | 57893.0720 | WT | 0.6 | 1.0 (39) | |||
| 31918060 | 57894.8105 | WT | 1.0 | 0.44 (23) | |||
| 31918061 | 57896.3281 | WT | 1.0 | 0.97 (34) | |||
| 31918062 | 57901.3109 | WT | 1.3 | 1.01 (79) | |||
| 31918064 | 57904.3665 | WT | 0.8 | 0.84 (37) | |||
| 31918065 | 57906.1601 | WT | 0.80 | 1.1 (40) | |||
| 31918066 | 57914.6150 | WT | 0.7 | 0.91 (27) | |||
| 88197001 | 57915.1940 | PC | 1.6 | 0.67 (36) | |||
| 31918068 | 57921.5100 | WT | 1.0 | 0.86 (29) | |||
| 31918069 | 57924.6414 | WT | 1.1 | 0.77 (36) | |||
| 31918070 | 57925.8951 | WT | 1.7 | 0.99 (27) | |||
| 31918071 | 57932.1508 | WT | 1.8 | 1.35 (49) | |||
| 31918072 | 57934.2056 | WT | 1.0 | 0.53 (18) | |||
| 31918073 | 57938.9768 | WT | 1.4 | 1.2 (26) | |||
| 31918074 | 57944.0258 | WT | 1.4 | 0.94 (33) | |||
| 31918075 | 57949.2266 | WT | 1.3 | 0.1 | 0.80 (24) | ||
| 31918076 | 57954.5955 | WT | 2.0 | 1.21 (29) | |||
| 31918077 | 57959.2528 | WT | 1.8 | 0.73 (25) | |||
| 31918078 | 57969.7412 | PC | 2. | 1.13 (21) | |||
| 31918079 | 57974.4516 | PC | 2.0 | 1.08 (15) | |||
| 31918080 | 57979.1890 | PC | 1.0 | 1.31 (7) | |||
| 31918082 | 57997.1966 | PC | 0.7 | 1.30 (3) |
Note. a Flux () is in units of . b X-ray luminosity () in units of calculated from the 0.5–10 keV unabsorbed flux by adopting a distance of 1.5 kpc.


2 Observations and data analysis
2.1 NuSTAR
The Nuclear Spectroscopic Telescope Array (NuSTAR) mission is the first X-ray satellite with multi-layer hard X-ray optics. It operates in the 3 to 79 keV energy band (Harrison et al., 2013). There are two identical telescopes aboard with grazing incidence optics, each one focusing on separate detector modules, Focal Plane Modules A and B (FPMA & FPMB), at a distance of 10 m. In addition to its imaging capabilities that extend well above 10 keV, NuSTAR has a time resolution of 10 s, which allows us to study variability in LMXBs.
During the 2017 outburst of J1357, two NuSTAR observations were performed. One of the observations was made between 12:51 UT on 2017 April 28 and 10:06 UT on 2017 April 29, while the second observation was performed between 13:36 UT 2017 June 10 and 03:46 UT on 2017 June 11. We have used both observations in this work. The standard processing and the extraction were performed using HEASOFT v6.19 and NUSTARDAS (V1.9.1). The light curves, spectra, and the response files were extracted using NUPRODUCTS. We have used a circular region of 30 arc-second radius for the source and a void circular region of 30 arc-second radius on the same chip for the background files. J1357 was detected well above the background in the entire NuSTAR energy band.
2.2 Swift
The Neil Gehrels Swift observatory (Gehrels
et al., 2004), launched in November 2004, has three instruments on board: a) the Burst Alert Telescope (BAT) operating in the energy range of 15-150 keV (Barthelmy
et al., 2005), b) the X-ray Telescope (XRT) which works in soft X-ray band (0.2-10 keV; Burrows
et al., 2005) and c) the Ultraviolet and Optical Telescope (UVOT), which covers UV and optical bands (70-600 nm; Roming
et al., 2004).
We monitored J1357 for months (30 pointings totaling ks) over the course of its 2017 outburst with Swift, using the XRT and the UVOT.
A log of Swift-XRT observations is given in Table 1.
Two of the Swift observations are contemporaneous with the NuSTAR observations.
One of them was made between 14:49 and 16:38 UT
on 2017 April 28 (Obs ID 00088094002) and the other was performed between
14:44 and 14:55 UT on 2017 June 10 (Obs ID 00031918066).
The XRT observation with ID 00088094002 was made in photon counting (PC) mode, while during the other observation with ID 00031918066 data were collected in the windowed timing (WT) mode.
The average countrate in the 0.5–10 keV band during these observations is and respectively.
We reprocessed the XRT data using xrtpipeline and manually extracted source and background spectra for each observation using xselect (from the Heasoft software package; version 6.19).
Due to high source count rate, most of our observations were performed in WT, while a few were taken in PC. For WT mode observations, we extracted spectra from only grade 0 events to avoid possible spectral residuals in the spectrum111e.g., see: http://www.swift.ac.uk/analysis/xrt/.
The source events were obtained from a circular region using one of the two values of radius 35 or 47 , depending on the source brightness. The background
events were extracted from the outer source-free regions, with a circular
region of same radius as that used for the extraction of source events.
We investigated the PC mode observations for evidence of pile up following procedures provided in the Swift/XRT guide222http://www.swift.ac.uk/analysis/xrt/pileup.php.
We found pile-up issues in the two observations (ID 00088197001 and 00031918072). For these two observations, we extracted the source spectrum from an annulus excluding the piled up region.
For the observation with ID 00088197001, the annulus has inner and outer radii of 7 and 47, and for the other observation (ID 00031918072) they were 5 and 35, respectively. For the PC mode data which did not exhibit any pile-up issues we have used a circular region of size 35. For all the PC mode observations, the background was typically extracted from source-free 200 radius circles.
We generated exposure maps for observations using the task xrtexpomap and created Ancillary Response Files (ARFs) using xrtmkarf. Finally, we performed spectral analysis in the 0.3–10 keV band for PC mode data and the 0.7–10 keV band for WT mode data.
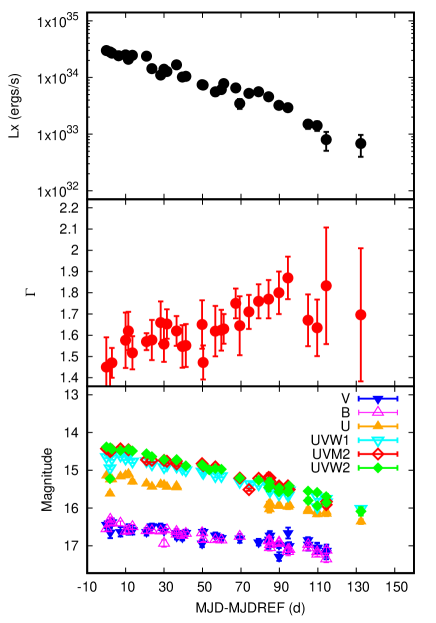
All the UVOT observations were taken in image mode. The majority of the observations were taken in all six available filters (v, b, u, uvw1, uvm2, uvw2), with a few exceptions. We used the uvotmaghist tool to create light curves, in each filter. This tool uses uvotsource to perform aperture photometry on all sky images (in each filter) available for an individual observation and calculate the source magnitude (in the Vega system) and flux densities. Aperture photometry was performed with a circular region with a radius of 5 centered on the source position. A neighboring source-free circular sky region with a radius of 10 was used for background correction. We have corrected the magnitudes and fluxes for the Galactic extinction. The reddening is 0.04 mag in the direction of J1357. We have used the following values of extinction: = 0.123, = 0.163, = 0.193, = 0.263, = 0.387, = 0.349, which were obtained by Armas Padilla et al. (2013).
2.3 X-ray Spectral Analysis
We performed X-ray spectral analysis using xspec 12.9.1 (Arnaud, 1996) and applied statistics.
The spectra obtained from both the detectors (FPMA and FPMB) of NuSTAR were grouped into bins with a minimum of 20 photons using grppha. For the case of spectra obtained with the XRT we have grouped data with a minimum of 15 counts per bin.
Interstellar absorption was included in all our spectral fits, employing Wilms
et al. (2000) abundances of elements and Verner et al. (1996) photo-electric cross-sections.
For all the observations performed with the XRT, we used phabs
model and fixed to for the spectral fitting. This value
was obtained by Armas Padilla
et al. (2014) from the high-resolution X-ray
spectra obtained with XMM-Newton. By using the same absorption model, abundances, cross-sections as Armas Padilla et al. (2013) in our spectral analysis, we can directly compare the two different outbursts.
NuSTAR works in the energy range of 3-79 keV, therefore, to study the low energy emission below 3 keV we have used the data from the Swift-XRT observations made contemporaneous to the NuSTAR observations. For the case of simultaneous spectral fitting of Swift-XRT and NuSTAR observations we have used the latest and more updated model tbabs for taking into account the interstellar absorption.
We allowed the cross-calibration constant (CC) between the instruments to take a difference in absolute flux calibration into account.
All the fluxes are given with respect to FPMA.
The values of the CC obtained for FPMB and Swift–XRT during the first contemporaneous NuSTAR (ID 90201057002) and Swift (ID 00088094002)
observation are and respectively.
The observed values of the CC for the second contemporaneous
NuSTAR (ID 90301005002) and Swift (ID 00031918066) observation are as follows: (FPMB)
and (XRT).
Unless explicitly mentioned, we quote all errors at 1- confidence level.
3 Results
3.1 Timing Results
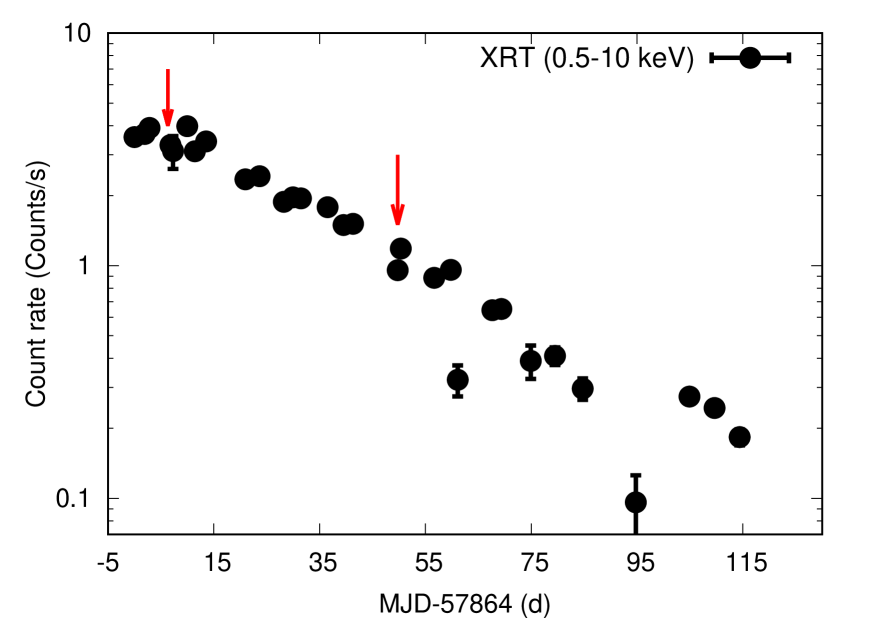
In Figure 1, we show the long-term 0.5-10 keV light curve of J1357 obtained from the Swift-XRT observations. The NuSTAR observations used in this work are marked in red.
Here, we note that Tetarenko et al. (2018)
found that during both outbursts observed for J1357 the exponential (viscous) decay timescale is about 64 days.
To search for signatures of the orbital motion (2.8 h) or the presence of dip-like features similar to that observed in the optical light curves (e.g., Corral-Santana et al., 2013), we created light curves in 3-79 keV band from the two NuSTAR observations.
In Figure 2 we show the light curves obtained with the FPMA for each observation.
The average count rate measured during the first and the second NuSTAR observation is 4 and 1 respectively. We do not observe any dip-like features or the presence of eclipses in the X-ray light curves.
Power density spectral analysis was performed using the timing analysis software HENDRICS 3.0333https://github.com/StingraySoftware/HENDRICS (High ENergy Data Reduction Interface from the Command Shell). This software is well suited to create the cross power density spectrum (CPDS) which is a proxy for the power density spectrum (PDS) that uses the signals from two independent detectors of NuSTAR instead of a single one (for details see Bachetti, 2015). This software also allowed us to perform poisson noise subtraction. The light curves in 3-79 keV band, having a bin size of 1 s were used to search for signals in the low frequency range.
The CPDS obtained with the first NuSTAR observation (ID-90201057002) was fitted using two zero-centered Lorentzian and a power law (Belloni et al., 2002).
The obtained values of characteristic frequencies () of the two Lorentzian components are
mHz and mHz and the corresponding full width at half maximum (FWHM) values
are mHz and mHz, respectively. Thus, the Q factor of the two Lorentzians at 4 mHz and 18 mHz is 0.8 and 1, respectively (also given in Table 2).
The root mean square (rms) variability of the two Lorentzian components are and , respectively (Figure 3).
The value of the power-law index observed for the CPDS is . The second NuSTAR observation (ID-90301005002) could be well fitted with a Lorentzian and a power law. The observed values of the characteristic frequency and the root mean square (rms) variability of the Lorentzian component in the CPDS of the second NuSTAR observation is and, , respectively.
The FWHM of the feature at 4 mHz is (and thus a Q factor of 0.6). The value of the power law index is . In this second observation, we did not require any low frequency component around 0.0183 Hz, plausibly due to the lower count-rate in this observation.
In Table 2, we summarize the values of the
frequencies observed with the two NuSTAR observations during the
outburst of J1357 in 2017, along with the previous known value of QPO frequency during its outburst in 2011. Here, we notice that during the 2017 outburst, J1357 exhibits low frequency variability, having fractional rms value quite low compared to its previous outburst and also to other black hole binaries in their hard state (see Belloni &
Stella, 2014, for details).
| Outburst | Observatory | MJD | 1 (mHz) | Q Value | rms () | 2 (mHz) | Q Value | rms () |
|---|---|---|---|---|---|---|---|---|
| 2011 | RXTE | 55594 | 3 | none | - | - | ||
| 2017 | NuSTAR | 57871.54 | ||||||
| 2017 | NuSTAR | 57914.57 | none | - | - |
Notes:
Errors quoted are for the 90 confidence range.
| NuSTAR Obs ID | NH (fixed) | Flux | Reduced (dof) | ||
|---|---|---|---|---|---|
| 90201057002 | 0.96 (1179) | ||||
| 90301005002 | 1.01 (595) |
Notes:
NH is in units of 10.
Unabsorbed flux in 0.3-79 keV band is in units . a Power law normalization () is in units of at 1 keV.
| Parameters | cutoffpl | bknpower | diskbb+nthcomp | diskbb+comptt | |
| Observation 1 | |||||
| - | |||||
| - | - | - | |||
| (keV) | |||||
| - | - | ||||
| - | - | - | |||
| Reduced (dof) | 0.96 (1178) | 0.96 (1177) | 0.96 (1176) | 0.95 (1175) | |
| Observation 2 | |||||
| - | |||||
| - | - | - | |||
| (keV) | |||||
| - | - | ||||
| - | - | - | |||
| Reduced (dof) | 1.0 (594) | 1.0 (593) | 1.0 (594) | 1.0 (592) |
Note:
a Normalization ()
is in units of at 1 keV.

3.2 Spectral Results
In Figure 4, we show the 0.5–10 keV Swift-XRT light curve. The maximum of the outburst was observed on 57864 MJD (OBSID 31918049). The peak value of unabsorbed flux is which corresponds to a peak X-ray luminosity of about assuming a source distance of 1.5 kpc (Rau
et al., 2011). We used this value of the source distance in order to compare our results with that obtained during its previous outburst (Armas Padilla et al., 2013). After this, the X-ray luminosity decreased monotonically. About 130 days after the peak our monitoring stopped but the source was still detected during our last observation, albeit at a low luminosities.
The middle panel of Figure 4 shows the power law index () evolution over the course of the outburst. We observe that increases from a value of 1.5 to a value of 1.9. This suggests a softening of the X-ray spectrum.
Wijnands
et al. (2015) searched the literature for reports on the spectral properties of NS and BH LMXBs studied using an absorbed power-law model.
They compared the spectra of NH and BH transients
when they have accretion luminosities between .
The authors found that neutron star LMXBs are significantly softer than black holes below an
X-ray luminosity (0.5-10 keV) of (Figure 1
of Wijnands
et al., 2015). In Figure 6, we plot two outbursts in J1357 together with the data from Figure 1 of Wijnands
et al. (2015). During both the outbursts of J1357, the power-law index showed
a similar behavior and the data points clearly follow the general trend of the BH sample.
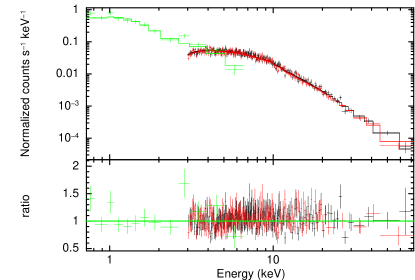
To perform simultaneous NuSTAR/Swift-XRT spectral fitting
we have used 0.3-79 keV band for the first simultaneous observation
while for the second observation the 0.7-79 keV band was used.
A different energy in the lower band was used for the spectral fitting in these observations because the first contemporaneous XRT observation
was done using the PC mode while for the second contemporaneous XRT observation, the data were collected in the WT mode.
We first employed an absorbed power-law model for the spectral fitting (Figure 5). The residuals obtained after spectral fitting neither showed the presence of any absorption/emission features nor the requirement of any other high-energy component (e.g.,a Compton hump). The value of power-law index observed during the first and second observation are and , respectively, indicating that the source was in its hard spectral state (Lewin & van der
Klis, 2006). The absorbed flux measured in the 0.3–10 keV band is for the first observation, while it decreased by a factor of 2.6 during the second observation. The best-fit parameters are given in Table 3. We note that the flux reported by Stiele &
Kong (2018) during the first observation is, for unclear reasons, 6 times higher compared to that measured in this work. Our measurements are consistent with that reported by Mondal &
Chakrabarti (2019).
We next tried a two-component model (diskbb + power law) and obtained a very low value of the disc temperature ( 0.03 keV). However, we find that the additional disc component did not significantly improve the fit. There was no change in the value of
chi-squared () for 2 degrees of freedom (d.o.f) less.
Armas Padilla et al. (2013) also found that none of the XRT observations required a disc component to fit spectra during the 2011 outburst of J1357.
We have also tried the same phenomenological models as suggested by Stiele &
Kong (2018) to compare our spectral fits with those reported earlier by these authors. Table 4 gives the fit parameters. Using a cut-off power law to the Swift and NuSTAR spectra, we found that the obtained cut-off energy lies outside the energy range covered by the data and a
cut-off power law is statistically not required. The value of reduced did not change. Similar results were reported by Stiele &
Kong (2018) but our parameter values are not the same.
We also found that using a broken power law or an absorbed disc blackbody plus thermal Comptonization model did not further improve the spectral fits. Our spectral fits suggests that an additional accretion disc component is not required. This is in contrast with that reported earlier by Stiele &
Kong (2018), might be due to the higher value of flux obtained by these authors.
The presence of a neutral iron line at 6.4 keV is statistically
not required, however, we obtained an upper limit on the equivalent width (EW) of 4 at a 1 confidence level. We have used an absorbed powerlaw plus Gaussian (tbabs*(powerlaw+gaussian)) for the spectral fitting and assumed the line width of 10 eV.
To place an upper limit on the reflection fraction in this source we have used a slab model ‘pexrav’.
pexrav describes X-ray reflection off an infinitely
thick flat slab, from a central illuminating source (Magdziarz &
Zdziarski, 1995). It includes a reflection scaling factor (R) which gives an estimate of the fraction of X-rays that get reflected off the disc, taking into account other parameters such as the power law
photon index, cut-off energy, abundance of elements heavier than helium, iron abundance and inclination angle of the slab. We fixed the values of the neutral hydrogen column density to and power-law index to the best-fit values and assigned a very high value to the cut-off energy (500 keV) based on the high value of cut-off energy obtained using an absorbed cut-off power law model.
The inclination angle was fixed to the value 0.63 (cosine of ). This allowed us to attain an upper limit on the reflection parameter (R) at a 1 confidence level. This low value of reflection fraction indicates almost negligible reflection off the disc.
Following Stiele & Kong (2018), we tried to use a sophisticated relativistic model ‘relxill’ (Dauser et al., 2014; García et al., 2014). For the first observation, we used an absorbed disc blackbody plus relxill model, however, for the second observation a disc component was not required. As in Stiele & Kong (2018), we fixed the values of emissivity index to 3, the cut-off energy at 300 keV and outer disk radius () at 400 . We also found that it was difficult to constrain ionisation parameter () and the iron abundance (), if kept free. Therefore, we fixed the value of = 1 and =0.8 based on the values obtained by Stiele & Kong (2018). The authors suggested that assuming a low inclination of and a spin value of 0.9 leads to a value of inner disc radius which is consistent with the expected value at low luminosities ( of the Eddington Luminosity ()). Therefore, we tried an inclination of for different values of the spin parameter (a) 0, 0.8 and 0.9. However, no change in the fit parameters was found on using a different value of spin parameter (see Table 5). Using the above-mentioned values, we observed that using a relxill model did not improve the fit and we were not able to constrain the inner disc radius and obtained a very low value of the reflection fraction. Stiele & Kong (2018) also reported that an inclination of results into the truncation radius which is quite close to the BH and this contradicts the observed scenario which suggests that the disc is truncated far away from the BH at low luminosities (see their discussion for details).
| Parameters | a=0 | a=0.8 | a=0.9 | |
| Observation 1 (Inclination: ) | ||||
| 0.03 | 0.02 | 0.02 | ||
| Reduced (dof) | 0.96 (1175) | 0.96 (1175) | 0.96 (1175) | |
| Observation 2 (Inclination: ) | ||||
| - | - | - | ||
| Reduced (dof) | 1.01 (593) | 1.01 (593) | 1.01 (593) |
Note:
a Normalization ()
is in units of at 1 keV.
3.3 Ultraviolet/Optical and X-ray correlation:
The simultaneous XRT and UVOT observations allowed us
to study the correlation between the X-ray and the UV/optical emission along the outburst. Figure 4 shows the X-ray light curve
and UV/optical magnitudes in the Vega system. Over the course of the outburst the brightness in all bands decreased with the decline in X-rays.
Following Armas Padilla et al. (2013) we fitted these correlations with a power law
to calculate the correlation slopes (, . The results are given in Table 6.
The disc-instability model (including irradiation) predicts the light-curve for the outburst of an irradiated accretion disc to display a characteristic shaped decay profile after the outburst peak (Dubus et al., 1999; Dubus
et al., 2001). This profile, which has been observed in a number of BH-LMXB outburst light-curves, is clearly seen in the outburst light-curves of J1357 (e.g., Tetarenko et al. 2018). Therefore,
we compared the correlation between the UV/optical and X-ray fluxes against correlations observed for three emission processes: X-ray reprocessing
in the disc, the viscously heated disc and jet emission.
For X-ray reprocessing, we adopt the theoretical model between the optical and X-ray luminosities given by
van Paradijs
& McClintock (1994). This model predicts that the optical luminosity of an X-ray reprocessing accretion disc varies as , where is the orbital separation of the system given by (Frank
et al., 2002). For J1357, we have adopted the values of mass of the BH (), the mass ratio of the companion star to the compact object, and the orbital period () from Casares (2016). For the viscously heated disc and jet emission we have used the following relations:
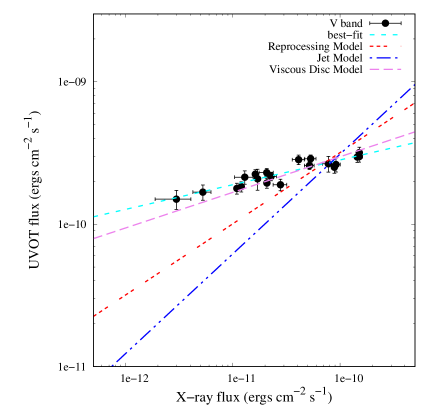
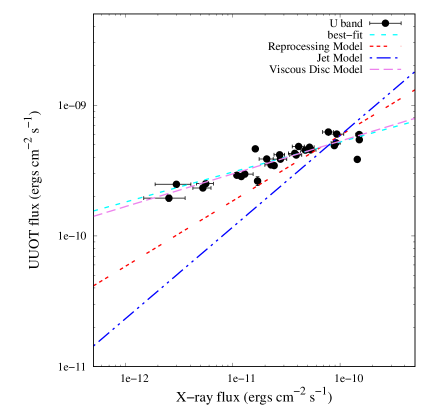
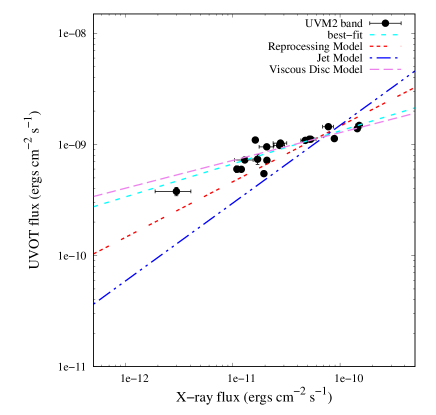
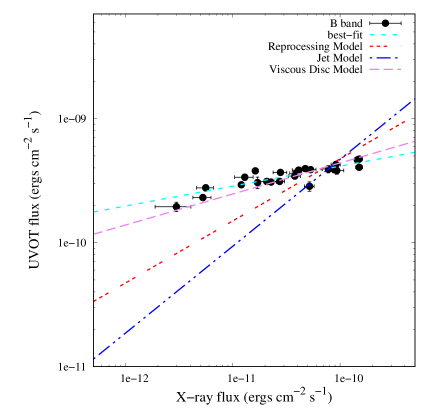
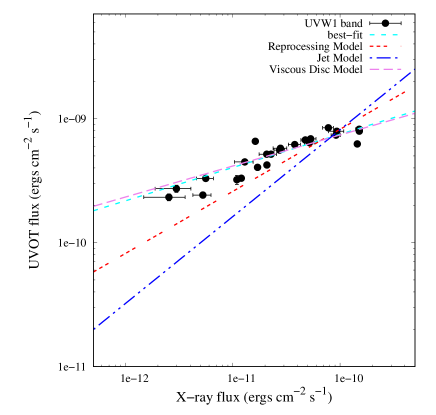
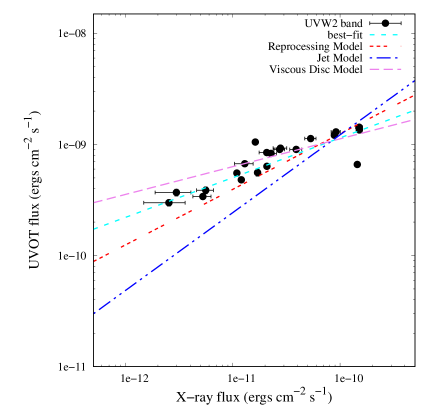
and , respectively (see Russell et al., 2006). Figure 7 shows that for all the UVOT bands
our best-fitted correlation slope lies closer to the model for the optical emission arising from a viscously heated disc around a BH. The other two models, namely the X-ray reprocessing and jet component do not fit these data well. However, for the UV emission it seems that there is not a single process going on in wavelength, very similar to
what Armas Padilla et al. (2013) found for the 2011 outburst of the source (their points are plotted as well).
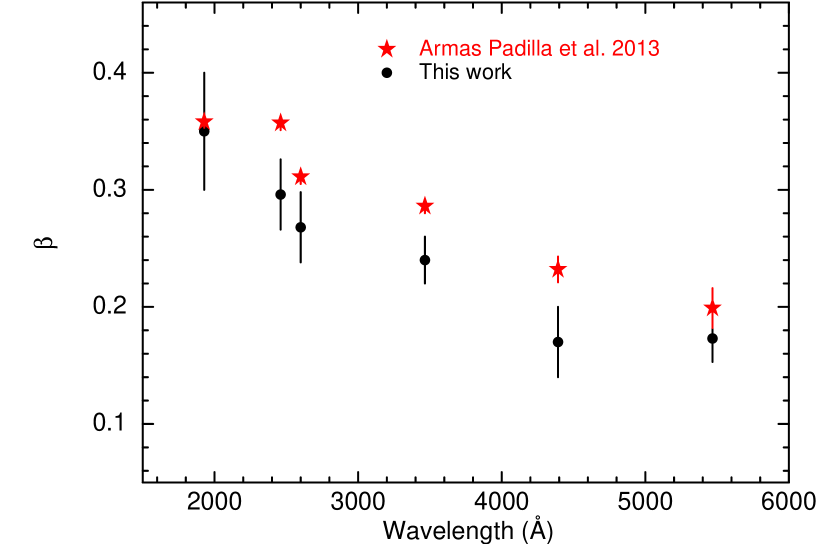
In the Figure 8, we plotted the correlation slopes obtained for all the UVOT bands which shows an increase in with decrease
in the wavelength.
We also tried the combined spectral fitting using the optical/UV and X-ray data, however, we find that it was not possible to constrain fit parameters using the model ‘diskir’. Therefore, we do not further comment on this. The broadband spectral fits have been discussed in detail in Paice et al. (in prep).
| UVOT Band | Wavelength | (fit values) |
|---|---|---|
| v | 5402 | |
| b | 4329 | |
| u | 3501 | |
| uvw1 | 2634 | |
| uvm2 | 2231 | |
| uvw2 | 2030 |
Note: Errors quoted are at 1-sigma confidence.
4 Discussion
In this work, we report a multi-wavelength analysis of J1357 during its second recorded outburst, obtained using the observations made with the Swift and NuSTAR observatories.
4.1 Timing Behavior
The timing studies performed with the light curves obtained with the NuSTAR data did not show any dips or eclipse.
This behavior of the X-ray light curves is consistent with that observed during its previous outburst in 2011 (Armas Padilla
et al., 2014). The power density spectra created
using data of both the NuSTAR observations (which are separated by more than 1 month and 10 days) showed the presence of some excess power in the milli-hertz frequency range.
We observed that the Q factor of the broad feature at 3 mHz and 0.019 mHz is 0.6 and 1.0 respectively. Thus, it seems that the features observed in the PDS are not QPOs (van der
Klis, 2000).
Armas Padilla
et al. (2014) reported the presence of a QPO at 6 having a Q value of about 3 or larger
in one of the RXTE observations made close to the beginning of the outburst. However, the XMM-Newton observation made 3.5 days after the first RXTE observation did not show
this QPO.
Thus, the absence of a QPO in the NuSTAR observations
made a week after the peak of the outburst is consistent
with the previous reports by Armas Padilla
et al. (2014).
Based on the discovery of the optical dips, Corral-Santana et al. (2013) suggested the presence of obscuring torus in the inner accretion disc which moves outwards when the X-ray luminosity decreases. However, based on the X-ray study of J1357, Armas Padilla
et al. (2014) question this interpretation and suggested that something else might cause the optical dips.
It is observed that high inclination X-ray sources show deep, irregular shaped dips in the X-ray light curves because the accretion disc structure in the outer disc extends vertically above the plane of the binary and periodically blocks the line of sight to the central compact object. This structure is a sort of bulge at the disc edge, associated with the impact point of the accretion stream from the secondary star with the outer accretion disc. Since J1357 has been suggested to be a high inclination binary system, we searched the literature for any possible similarities of this source with any other X-ray dipping sources. J1357, however, behaves quite differently from X-ray dipping sources. One of the X-ray dipping sources, 4U 1254–690, shows cessation of X-ray dipping activity (Smale & Wachter, 1999). 4U 1254–690 is a low mass X-ray binary having an inclination angle of (Motch et al., 1987). This source usually displays dips during which the observed reduction in flux is 20-95 (Courvoisier et al., 1986). However, during observations made with RXTE in 1997 (May) did not show the presence of dips. The non-existence of dips in the X-ray light curves of 4U 1254–690 were explained due to shrinkage of the angular size of the bulge height (from 17-25 to less than 10; Smale & Wachter, 1999). Therefore, it might be possible that non-existence of dips in the X-ray light curves of J1357 is due to a low angular size of the bulge height (less that 10) as predicted for 4U 1254–690. In that case, J1357 spends most of its time with this configuration and hence we observe no dips in the X-ray light curves. Galloway et al. (2016) reported on sporadic dipping in Aql X–1 and suggested systems with high inclination can exist despite not showing persistent dipping activity.
4.2 Spectral Behavior
We found that a simple absorbed power law was adequate to fit the spectra
obtained with the observations made with Swift-XRT and NuSTAR during the 2017 outburst of J1357. The observed power-law index showed that the source was in its hard spectral state during all the observations (Table 1,3).
The evolution of power-law index with the X-ray luminosity follow a similar trend during the 2011 and 2017 outbursts of J1357.
The Swift-XRT observations performed during the 2017 outburst of J1357 did not reveal the presence of any soft excess such as seen during an XMM-Newton observation
obtained during the 2011 outburst of J1357 (Armas Padilla
et al., 2014). This might again be due to the limitations on the data (see also Armas Padilla
et al., 2014).
It is believed that during the low/hard spectral state of black hole binaries (BHBs), the disc is either not detected (see e.g., Belloni et al., 1999), or it appears much cooler and larger than it does in the soft state (see Wilms et al., 1999; McClintock
et al., 2001; Reynolds &
Miller, 2013). Therefore, it is not possible to observe such a cool disc with the instruments like NuSTAR that have a low energy cut-off of approximately 3 .
Reis
et al. (2010) studied eight BHBs during their low hard state using the data from XMM-Newton, Suzaku and Chandra observatories. They found the presence of thermal emission in all of these sources. They found the disc temperature as low as 0.2 .
Thus, the non-detection of the soft component in J1357 suggests that it was in its hard spectral state.
Signatures of reflection in the form of an iron line and Compton hump
are often observed in the X-ray spectra of BHBs during their low/hard state (e.g., Miller
et al., 2006; Reynolds &
Miller, 2010, for reviews).
The reflection components are however
most apparent when the accretion disc is observed nearly face-on (see e.g., Di Salvo et al., 2001; Tomsick et al., 2009; Fürst
et al., 2015, 2016).
J1357 is proposed to have a torus-like structure in the inner region of accretion disc similar to the torus observed in
several Compton-Thick (CT) active galactic nuclei (AGN). Observations suggest that the X-ray spectrum of CT AGNs is dominated by the
cold Compton reflection component which arises from the Compton scattering of the inner “wall” of the neutral obscuring torus.
This emission is characterised by a hard X-ray spectral slope with a peak around 30 keV as well as high EW of fluorescent emission line like the 6.4 keV line (see e.g Arévalo
et al., 2014; Gandhi
et al., 2014; Bauer
et al., 2015)). From the broad band spectral study performed with data of Swift-XRT and NuSTAR we did not find the presence of any reflection features (iron line or Compton hump) that would support the presence of clumpy torus in the disc. An upper limit of 0.04 on the reflection fraction was obtained using the slab model ‘pexrav’. We also note that using a relativisitic ‘relxill’ model did not improve the spectral fits and the measured values of the reflection fraction are very low and unconstrained.
We did not observe an iron line in the X-ray spectra of J1357 at luminosities
of about . However,
there have been several reports of broad iron lines in the brighter part of the low/hard state (greater than ) during an outburst for example, GX 339–4 (Miller
et al., 2006; Reis
et al., 2010), GRS 1739–278 (Miller
et al., 2015) and as well as for
many other systems (see Reynolds &
Miller, 2010, for details). The typical range of iron line EW is 50-300 eV (Gilfanov, 2010). A detailed study of GX 339–4 in the low/hard state at a luminosity of about showed the presence of
a narrow iron line in the X-ray spectrum (Tomsick et al., 2009).
The EW of the observed iron line is 77 . Based on their study, the authors suggested the truncation of the accretion disc for stellar mass black holes in the hard state, at low luminosities ( ).
They also found the drop in the iron line EW with the increase in the inner accretion disc radius ().
Another detailed spectral study on GRS 1739–278 during its low hard state showed the presence of reflection features in the spectrum at the luminosity of about (Fürst
et al., 2016).
For the advection dominated accretion flow (ADAF) one requires a large increase in with decreasing . Therefore, it might be possible that for the case of J1357 is quite large and because of this we do not observe reflection features in the X-ay spectrum.
4.3 UV/optical and X-ray Correlation
During the 2017 outburst of J1357, we found a set of values
of the correlation coefficient (; Table 6). We observe that the value of the correlation coefficient in the v band is 0.17. This value lies between which is expected for a BH system with a viscously heated accretion disc (Armas Padilla et al., 2013). This is supported by the fact that the best-fitted correlation slopes () can be explained by the model for a viscously heated disc.
We also observe a clear increase in the value of with the decrease in wavelength (Figure 8) as also observed by Armas Padilla et al. (2013). The best-fit values of for each band deviate largely from the predicted values for the reprocessing model and the jet model but it might be possible that intrinsic thermal emission from the viscously heated outer accretion disc contribute significant light in the optical (Frank et al., 2002). Moreover, it is suggested by van Paradijs & McClintock (1994) that for smaller accretion discs (i.e., smaller ) we expect the average surface temperature of the disc to be larger (presumably as it is closer to the compact object and irradiation source). Therefore, we expect a larger fraction of the reprocessed emission to be in the UV band. Given that we observe the slope of the correlation between UV and X-ray emission get steeper (i.e., increases) as the wavelength of the UV band used decreases, this could explain the values of between the V band and X-ray more consistent with the viscous disc only, rather then the irradiated disc.
Acknowledgments
We thank the anonymous referee for several useful suggestions which improved the quality of the paper. A.B is grateful to the Royal Society and SERB (Science and Engineering Research Board, India) for financial support through Newton-Bhabha Fund. A.B. is supported by an INSPIRE Faculty grant (DST/INSPIRE/04/2018/001265) by the Department of Science and Technology, Govt. of India. She also gratefully acknowledge Dr. Adam Hill for help in the installation of NuSTAR Timing Analysis Software package. DA acknowledges support from the Royal Society. ND and JVHS are supported by a Vidi grant awarded to ND by the Netherlands Organization for Scientific Research (NWO). MJM acknowledge support from STFC Ernest Rutherford fellowships. This work is based on data from the NuSTAR and Swift mission. We would like to thank all the members of NuSTAR and Swift team for TOO observations. This research has made use of data and/or software provided by the High Energy Astrophysics Science Archive Research Center (HEASARC), which is a service of the Astrophysics Science Division at NASA/GSFC and the High Energy Astrophysics Division of the Smithsonian Astrophysical Observatory. This research has made use of NASA’s Astrophysics Data System.
References
- Arévalo et al. (2014) Arévalo P., et al., 2014, ApJ, 791, 81
- Armas Padilla et al. (2013) Armas Padilla M., Degenaar N., Russell D. M., Wijnands R., 2013, MNRAS, 428, 3083
- Armas Padilla et al. (2014) Armas Padilla M., Wijnands R., Altamirano D., Méndez M., Miller J. M., Degenaar N., 2014, MNRAS, 439, 3908
- Arnaud (1996) Arnaud K. A., 1996, in Jacoby G. H., Barnes J., eds, Astronomical Society of the Pacific Conference Series Vol. 101, Astronomical Data Analysis Software and Systems V. p. 17
- Bachetti (2015) Bachetti M., 2015, MaLTPyNT: Quick look timing analysis for NuSTAR data, Astrophysics Source Code Library (ascl:1502.021)
- Barthelmy et al. (2005) Barthelmy S. D., et al., 2005, Space Sci. Rev., 120, 143
- Bauer et al. (2015) Bauer F. E., et al., 2015, ApJ, 812, 116
- Belloni & Stella (2014) Belloni T. M., Stella L., 2014, Space Sci. Rev., 183, 43
- Belloni et al. (1999) Belloni T., Méndez M., van der Klis M., Lewin W. H. G., Dieters S., 1999, ApJ, 519, L159
- Belloni et al. (2002) Belloni T., Psaltis D., van der Klis M., 2002, ApJ, 572, 392
- Burrows et al. (2005) Burrows D. N., et al., 2005, Space Sci. Rev., 120, 165
- Casares (2016) Casares J., 2016, ApJ, 822, 99
- Casares et al. (2011) Casares J., Torres M. A. P., Negueruela I., Gonzalez-Fernandez C., Corral-Santana J. M., Zurita C., Llano S. R., 2011, The Astronomer’s Telegram, 3206
- Corral-Santana et al. (2013) Corral-Santana J. M., Casares J., Muñoz-Darias T., Rodríguez-Gil P., Shahbaz T., Torres M. A. P., Zurita C., Tyndall A. A., 2013, Science, 339, 1048
- Courvoisier et al. (1986) Courvoisier T. J.-L., Parmar A. N., Peacock A., Pakull M., 1986, ApJ, 309, 265
- Dauser et al. (2014) Dauser T., García J., Parker M. L., Fabian A. C., Wilms J., 2014, MNRAS, 444, L100
- Di Salvo et al. (2001) Di Salvo T., Done C., Życki P. T., Burderi L., Robba N. R., 2001, ApJ, 547, 1024
- Drake et al. (2017) Drake A. J., Djorgovski S. G., Mahabal A. A., Graham M. J., Stern D., Catelan M., Christensen E., Larson S. M., 2017, The Astronomer’s Telegram, No. 10297, 297
- Dubus et al. (1999) Dubus G., Lasota J.-P., Hameury J.-M., Charles P., 1999, MNRAS, 303, 139
- Dubus et al. (2001) Dubus G., Hameury J.-M., Lasota J.-P., 2001, A&A, 373, 251
- Frank et al. (2002) Frank J., King A., Raine D. J., 2002, Accretion Power in Astrophysics: Third Edition
- Fürst et al. (2015) Fürst F., et al., 2015, ApJ, 808, 122
- Fürst et al. (2016) Fürst F., et al., 2016, ApJ, 832, 115
- Galloway et al. (2016) Galloway D. K., Ajamyan A. N., Upjohn J., Stuart M., 2016, MNRAS, 461, 3847
- Gandhi et al. (2014) Gandhi P., et al., 2014, ApJ, 792, 117
- García et al. (2014) García J., et al., 2014, ApJ, 782, 76
- Gehrels et al. (2004) Gehrels N., et al., 2004, ApJ, 611, 1005
- Gilfanov (2010) Gilfanov M., 2010, in Belloni T., ed., Lecture Notes in Physics, Berlin Springer Verlag Vol. 794, Lecture Notes in Physics, Berlin Springer Verlag. p. 17 (arXiv:0909.2567), doi:10.1007/978-3-540-76937-8˙2
- Harrison et al. (2013) Harrison F. A., et al., 2013, ApJ, 770, 103
- Krimm et al. (2011a) Krimm H. A., et al., 2011a, The Astronomer’s Telegram, 3138
- Krimm et al. (2011b) Krimm H. A., Kennea J. A., Holland S. T., 2011b, The Astronomer’s Telegram, 3142
- Lewin & van der Klis (2006) Lewin W. H. G., van der Klis M., 2006, Compact Stellar X-ray Sources
- Magdziarz & Zdziarski (1995) Magdziarz P., Zdziarski A. A., 1995, MNRAS, 273, 837
- Mata Sánchez et al. (2015) Mata Sánchez D., Muñoz-Darias T., Casares J., Corral-Santana J. M., Shahbaz T., 2015, MNRAS, 454, 2199
- McClintock et al. (2001) McClintock J. E., et al., 2001, ApJ, 555, 477
- Milisavljevic et al. (2011) Milisavljevic D., Fesen R. A., Parrent J. T., Thorstensen J. R., 2011, The Astronomer’s Telegram, 3146
- Miller et al. (2006) Miller J. M., Homan J., Steeghs D., Rupen M., Hunstead R. W., Wijnands R., Charles P. A., Fabian A. C., 2006, ApJ, 653, 525
- Miller et al. (2015) Miller J. M., et al., 2015, ApJ, 799, L6
- Mondal & Chakrabarti (2019) Mondal S., Chakrabarti S. K., 2019, MNRAS, 483, 1178
- Motch et al. (1987) Motch C., Pedersen H., Courvoisier T. J.-L., Beuermann K., Pakull M. W., 1987, ApJ, 313, 792
- Parmar et al. (1986) Parmar A. N., White N. E., Giommi P., Gottwald M., 1986, ApJ, 308, 199
- Rau et al. (2011) Rau A., Greiner J., Filgas R., 2011, The Astronomer’s Telegram, 3140
- Reid et al. (2014) Reid M. J., McClintock J. E., Steiner J. F., Steeghs D., Remillard R. A., Dhawan V., Narayan R., 2014, ApJ, 796, 2
- Reis et al. (2010) Reis R. C., Fabian A. C., Miller J. M., 2010, MNRAS, 402, 836
- Reynolds & Miller (2010) Reynolds M. T., Miller J. M., 2010, X-ray Astronomy 2009; Present Status, Multi-Wavelength Approach and Future Perspectives, 1248, 191
- Reynolds & Miller (2013) Reynolds M. T., Miller J. M., 2013, ApJ, 769, 16
- Roming et al. (2004) Roming P. W. A., et al., 2004, in Flanagan K. A., Siegmund O. H. W., eds, Proc. SPIEVol. 5165, X-Ray and Gamma-Ray Instrumentation for Astronomy XIII. pp 262–276, doi:10.1117/12.504554
- Russell et al. (2006) Russell D. M., Fender R. P., Hynes R. I., Brocksopp C., Homan J., Jonker P. G., Buxton M. M., 2006, MNRAS, 371, 1334
- Russell et al. (2017) Russell D. M., Qasim A. A., Bernardini F., Plotkin R. M., Lewis F., Koljonen K. I. I., Yang Y.-J., 2017, preprint, (arXiv:1707.05814)
- Shahbaz et al. (2013) Shahbaz T., Russell D. M., Zurita C., Casares J., Corral-Santana J. M., Dhillon V. S., Marsh T. R., 2013, MNRAS, 434, 2696
- Sivakoff et al. (2017) Sivakoff G. R., Tetarenko B. E., Shaw A. W., Bahramian A., 2017, The Astronomer’s Telegram, No. 10314, 314
- Smale & Wachter (1999) Smale A. P., Wachter S., 1999, ApJ, 527, 341
- Stiele & Kong (2018) Stiele H., Kong A. K. H., 2018, ApJ, 852, 34
- Tetarenko et al. (2018) Tetarenko B. E., Lasota J.-P., Heinke C. O., Dubus G., Sivakoff G. R., 2018, Nature, 554, 69
- Tomsick et al. (2009) Tomsick J. A., Yamaoka K., Corbel S., Kaaret P., Kalemci E., Migliari S., 2009, ApJ, 707, L87
- Verner et al. (1996) Verner D. A., Ferland G. J., Korista K. T., Yakovlev D. G., 1996, ApJ, 465, 487
- Wijnands et al. (2006) Wijnands R., et al., 2006, A&A, 449, 1117
- Wijnands et al. (2015) Wijnands R., Degenaar N., Armas Padilla M., Altamirano D., Cavecchi Y., Linares M., Bahramian A., Heinke C. O., 2015, MNRAS, 454, 1371
- Wilms et al. (1999) Wilms J., Nowak M. A., Dove J. B., Fender R. P., Di Matteo T., 1999, ApJ, 522, 460
- Wilms et al. (2000) Wilms J., Allen A., McCray R., 2000, ApJ, 542, 914
- van Paradijs & McClintock (1994) van Paradijs J., McClintock J. E., 1994, A&A, 290, 133
- van der Klis (2000) van der Klis M., 2000, Quasiperiodic Oscillations in X-ray Binaries. p. 2380, doi:10.1888/0333750888/2380