Circumgalactic Pressure Profiles Indicate Precipitation-Limited Atmospheres for –
Abstract
Cosmic gas cycles in and out of galaxies, but outside of galaxies it is difficult to observe except for the absorption lines that circumgalactic clouds leave in the spectra of background quasars. Using photoionization modeling of those lines to determine cloud pressures, we find that galaxies are surrounded by extended atmospheres that confine the clouds and have a radial pressure profile that depends on galaxy mass. Motivated by observations of the universe’s most massive galaxies, we compare those pressure measurements with models predicting the critical pressure at which cooler clouds start to precipitate out of the hot atmosphere and rain toward the center. We find excellent agreement, implying that the precipitation limit applies to galaxies over a wide mass range.
1 Introduction
Lyman Spitzer postulated in 1956 that a million-degree corona surrounds the Milky Way galaxy (Spitzer, 1956). His proposal was based on absorption-line observations of much cooler gas clouds along lines of sight extending high above the galactic disk (Münch & Zirin, 1961). Hypothesizing that those clouds must be pressure-confined by a volume-filling ambient medium, Spitzer inferred its pressure from the pressures of the cooler clouds, and its temperature by assuming the ambient medium to be in hydrostatic equilibrium in the galaxy’s potential well. Direct confirmation of the corona’s existence came only gradually, decades later, as X-ray observations began to distinguish its distinct contribution to the X-ray background that covers the sky (e.g., Kuntz & Snowden, 2000; Henley & Shelton, 2013). Astronomers of the twenty-first century refer to this gas as the circumgalactic medium (CGM) and have found that most of the baryons associated with a galaxy reside there, along with a large fraction of the elements produced by a galaxy’s stars (e.g., Chen et al., 2010; Tumlinson et al., 2011; Prochaska et al., 2011; Werk et al., 2014; Keeney et al., 2017; Zahedy et al., 2019).
X-ray emission from the volume-filling hot component of the CGM around high-mass galaxies can be directly observed (e.g., Mathews & Brighenti, 2003), but it cannot yet be seen around galaxies with masses similar to or less than the Milky Way’s (e.g., Bregman, 2007). Most of what we know about the CGM around those galaxies has therefore been inferred from observations of the absorption lines that it produces in the spectra of background quasars, which are most sensitive to K gas that is photoionized and heated by intergalactic ultraviolet (UV) radiation. Those K clouds are thought to trace both the gaseous inflows that sustain star formation in galaxies and the galaxy-scale outflows that limit it (e.g., Tumlinson et al., 2017). Such observations place strong constraints on models of the feedback processes that regulate galaxy evolution. However, the observed velocity differences between a galaxy and the absorption-line clouds that surround it tend to be smaller than the expected speeds of Keplerian orbits (Borthakur et al., 2016; Huang et al., 2016; McQuinn & Werk, 2018; Zahedy et al., 2019), which makes it difficult to understand if those clouds are either falling ballistically toward the galaxy or being ejected at speeds sufficient to escape the galaxy’s potential well.
This Letter presents evidence indicating that the K clouds around galaxies are instead confined by a volume-filling corona that circulates the elements made by the galaxy’s stars, but does not deviate far from hydrostatic equilibrium. Those coronae appear to be similar to the X-ray–emitting ambient media around the most massive galaxies, in which energetic outflows powered by accretion of gas onto a central black hole balance radiative energy losses from the CGM. In massive galaxies, the feedback loop connecting black hole accretion to the CGM suspends the ambient gas in a state in which the cooling time () required for the gas to radiate away its thermal energy cannot drop much below 10 times the freefall time () that it would take for a gas blob to fall freely to the center of the galaxy (Sharma et al., 2012a, b; Gaspari et al., 2012; Voit et al., 2015b). Numerical simulations have shown that CGM gas with tends to produce a rain of cold clouds that condense out of the ambient medium and fall toward the central black hole through a process known as “chaotic cold accretion” (Gaspari et al., 2013, 2017). The energy released as those clouds accrete onto the black hole then heats the ambient medium, causing it to expand, thereby increasing and reducing the precipitation of clouds. An ambient CGM that is regulated through such a feedback loop to have is therefore “precipitation-limited” (Voit et al., 2017), with important consequences for the rate at which condensation of CGM gas can fuel star formation (Voit et al., 2015a).
2 CGM Pressure Measurements
The evidence for a precipitation-limited CGM around less massive galaxies comes from photoionization models of the K clouds. Those clouds are exposed to the ionizing UV background that permeates intergalactic space, which is known to better than a factor of 3 (e.g., Shull et al., 2015). Each element in the cloud therefore has an ionization state depending on the ratio , where is the number density of ionizing photons and is the number density of hydrogen nuclei. That ratio, known as the ionization parameter, is related to the cloud’s pressure through
| (1) |
where – K is the temperature at which photoelectric heating and radiative cooling balance each other and pressure has been expressed in terms of . For a given UV background, the quantity is consequently a proxy for .
The Hubble Space Telescope’s Cosmic Origins Spectrograph (COS) has obtained measurements of in K clouds around approximately 60 galaxies in the mass range , where is the stellar mass (in solar units) inferred from a galaxy’s luminosity and color. This Letter analyzes a sample of CGM absorption-line clouds comprising six subsamples culled from three different studies. One of those studies was performed by the COS Guaranteed Time Observing (COS-GTO) team (Stocke et al., 2013; Keeney et al., 2017). From that study, we took the 13 galaxies with absorption lines observed at around galaxies with , where is the dark-matter halo radius determined by those authors. We then subdivided them into three subsamples with (two galaxies), (two galaxies), and (nine galaxies). All the lower-mass galaxies have redshift , and all the higher-mass galaxies have . The second study was performed by the COS-Halos team (Werk et al., 2013, 2014). From that study, we took the 32 galaxies with measured values of at and subdivided them into two subsamples with (11 galaxies) and (21 galaxies). Those galaxies all fall into the redshift range . The third study is COS-LRG (Chen et al., 2018; Zahedy et al., 2019), which contains 11 luminous red galaxies (LRGs) with low-ionization CGM absorption lines strong enough to support measurement of . They form a sixth subsample of galaxies that has and .
Our COS-Halos and COS-LRG subsamples share three galaxies in common, along the lines of sight to quasars J0910+1014, J0950+4831, and J1550+4001. The COS-Halos study did not attempt to separate the absorption lines into distinct components and represent a fit to the entire column density derived for each ion used to determine , whereas the COS-LRG team elected to perform separate ionization-parameter fits for components that can be distinguished from each other in velocity space. If there are multiple absorption-line clouds along a given line of sight through the CGM, then the simplest hypothesis for the pressure differences found among them is that those clouds are at different distances from the central galaxy within a confining atmosphere in which pressure declines with radius. If so, then the cloud with the greatest pressure would be most representative of the pressure at . Our study therefore includes only the COS-LRG points for the three galaxies jointly analyzed by COS-Halos and COS-LRG. Even though this choice mitigates some of the potential projection effects, there may still be significant systematic uncertainties in the inferred values of resulting from complex, overlapping absorption lines. In the longer term, those uncertainties will need to be quantified and constrained with the use of physical models for those substructures (e.g., Stern et al., 2018).
3 Trends in the Data
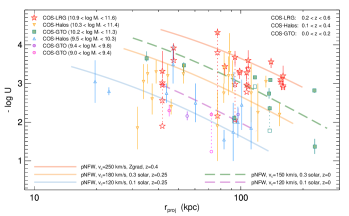
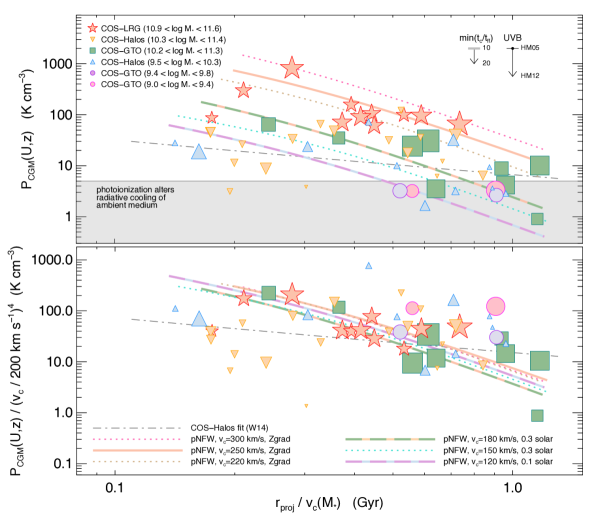
Figure 1 shows how those measurements depend on and projected distance from the galaxy’s center (). No obvious dependence of cloud pressure on can been seen in the sample as a whole, but when the galaxies are grouped by stellar mass, each subset shows a decline in cloud pressure with radius. Furthermore, gas pressure at a given radius in the highest-mass subset (COS-LRG) is approximately two orders of magnitude greater than in the three lowest-mass subsets. Those trends still hold if the projected radius is divided by the circular velocity of an orbit in the gravitational potential of the galaxy’s dark-matter halo, to give the dynamical timescale at (top panel of Figure 2). Dividing by is analogous to dividing by a virial radius but avoids introducing a potentially spurious cosmological dependence into the scaling. The value for each galaxy comes from interpolating the – relation of McGaugh et al. (2010), which is approximately , with a scatter in of about 0.2 dex at fixed , depending on assumptions about the mass-to-light ratio of the stellar population. If in the photoionized clouds were simply proportional to the mean matter density enclosed within , then at would be nearly independent of galaxy mass. The bottom panel of Figure 2 shows instead that is much closer to being a mass-independent function of , which is similar to the predictions of precipitation-limited CGM models (see §4).
A detrending analysis of the data demonstrates that the weighted sample variance of is minimized for . Before performing the minimization, we restrict the set of points included in the fit by removing all the points at at Gyr, as well as all the clouds with higher-pressure companions along a given line of sight. Doing so reduces but does not eliminate the influence of projection effects. We also remove all the points with predicted pressure , because photoionization of the ambient medium is likely to alter radiative cooling and therefore the precipitation limit below that pressure (e.g., Stern et al., 2018). Fitting the remaining points to the formula
| (2) |
shows that the weighted sample variance is minimized at and , giving a weighted standard deviation dex. We therefore redo the fits with updated weighting obtained by adding a dispersion of 0.3 dex in quadrature to the observational uncertainties in .
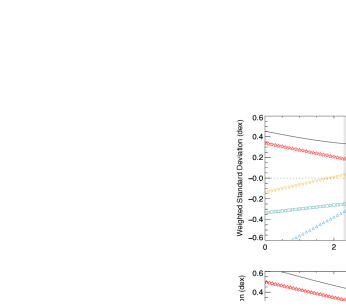
The top panel of Figure 3 shows the resulting dependence of weighted sample variance on . It is minimized at (max likelihood estimate) implying that is ruled out at greater than significance, assuming that the likelihood has a distribution. A purely cosmological pressure profile would have at fixed , which is disfavored relative to but not ruled out. Figure 3 also shows how deviations from the best fit depend on . Each line of symbols corresponds to a subsample of the restricted data set. For a given , the vertical position of a symbol represents the difference between the weighted mean pressure for that subsample and the best-fitting pressure profile for all the subsamples. The slope of each line therefore depends on the mean for the galaxies in that subsample. Red stars representing COS-LRG trend downward with increasing because that is the highest-mass subsample. The slopes of the other lines become increasingly more positive with decreasing mean mass. They come closest together within the gray shaded region showing .
The bottom panel of Figure 3 shows the dependence of weighted sample variance on the parameter combination , which specifies how scales with at fixed radius. Its minimum is at , implying that no dependence of on is ruled out at greater than confidence. We obtain tighter constraints on than on alone because of a covariance in the fit: for small values of , a steeper pressure profile (larger absolute value of ) brings the data points for low-mass systems closer to the best fit to the whole sample.
4 Comparisons with Models
Models of precipitation-limited ambient media predict that at should be nearly independent of galaxy mass, which is consistent with the detrending analysis. This scaling results from the fundamental assumption that feedback keeps roughly constant. In this ratio, the cooling time is defined to be , where is the radiative cooling rate per unit volume and applies to collisionally ionized gas at temperature with heavy-element abundances times their solar values. The freefall time is defined to be . With those definitions, the corresponding upper limit on CGM pressure, expressed in terms of , is
| (3) |
This pressure limit scales as
| (4) |
because a volume-filling medium near hydrostatic equilibrium tends to have , where is the mean mass per particle. Dividing by should therefore give a radial profile that depends primarily on the cooling function , the dynamical time , and the dimensionless ratio , which may vary with radius but should be largely independent of system mass.
In precipitation-limited CGM models for galaxies in the mass range that we are considering, the cooling-function term in equation (4) is not expected to vary strongly with , because its dependence on tends to offset its dependence on . Fits to the cooling functions of Sutherland & Dopita (1993) give for and . Consequently, the cooling-function term scales as for and for . Vertical dashed lines in Figure 3 show the resulting predictions for , which are close to the maximum-likelihood value for and just outside the range for .
The ambient value of is what determines the prediction, and there are essentially no direct observational constraints on the scaling of ambient CGM metallicity with halo mass. We will therefore outline the predictions that follow from the assumption that a galaxy’s supernova ejecta are well mixed with the baryons associated with its halo, and compare them with observed metallicity trends among the stars and gas clouds within galaxies. In that case, the CGM abundances in a galaxy population with should scale as , giving . The – relation of McGaugh et al. (2010), which has , then leads to and . However, observations indicate that may become larger as declines. For example, abundance matching of galaxies and halos (e.g. Moster et al., 2010) yields for , implying . Observational constraints on the relationship between stellar mass and gas-phase metallicity are harder to apply because of systematic uncertainties in the metallicity diagnostics. For , some analyses are consistent with , and therefore with (e.g., Blanc et al., 2019), while others indicate a relationship closer to (e.g., Sánchez et al., 2017), which is more consistent with . And for , both the stellar and gas-phase metallicities saturate near the solar value, indicating that a simple power-law model might not be adequate for expressing the relationship between and over the entire range of stellar mass that we are considering.
On the other hand, assuming allows us to bring the model predictions one step closer to the data, because is really a proxy for in the detrending analysis of §3. Fundamentally, the detrending analysis constrains in the power-law relation . Assuming that and efficient mixing then converts equation (4) into the prediction
| (5) |
in which the factor in square brackets is presumed to depend only on . Within the range , the model therefore predicts , which lies within of the maximum-likelihood value derived from detrending the data (see Figure 3). Extending the model down to , in which case becomes independent of , gives the prediction , which is more than 1 from the maximum-likelihood value but well within the range. In other words, the observed dependence of on and is much more consistent with precipitation-model predictions than with a CGM pressure that is independent of and .
Accounting for the dependence of on halo mass by assuming reveals that the radial pressure gradients predicted by precipitation-limited models are also similar to those found in the data. The solid and dashed lines in Figures 1 and 2 show predicted pressure profiles from Voit (2018) for galaxies that would belong to each of the mass-segregated subsets. In all the models, CGM pressure is determined by the precipitation-limit condition . The resulting models have lower pressures at large radii than previously proposed models for hot atmospheres (Mo & Miralda-Escude, 1996; Maller & Bullock, 2004; Faerman et al., 2017) in which the minimum pressures are inconsistent with observations (Werk et al., 2014). In each galaxy-mass subset, the data points generally track the corresponding model, but projection effects produce considerable scatter, for reasons best illustrated in Figure 1. Dotted lines in that figure connect measurements of clouds that all belong to a single galaxy but are slightly separated in velocity space. According to the data, the spread in CGM pressure along at least some lines of sight can exceed two orders of magnitude. We therefore take the highest-pressure cloud to be most representative of the CGM pressure at a distance from the galaxy, while recognizing that its pressure may still be just a lower bound on the maximum pressure along that sightline.
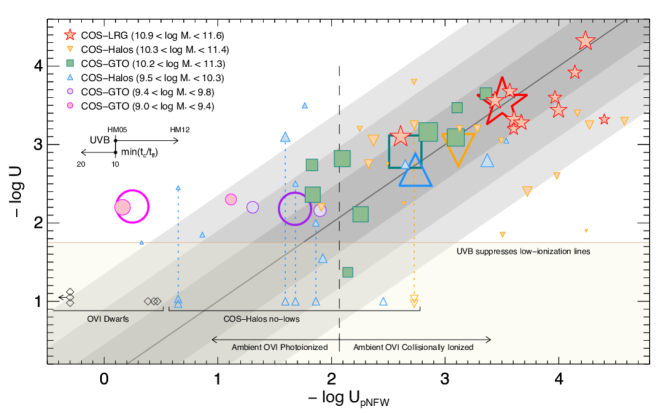
Figure 4 shows how the ionization level predicted for a cloud at radius by a precipitation-limited model for a galaxy with stellar mass compares with observations. The predicted ionization levels () are determined by a model for the UV background and a pressure calculated according to the pNFW prescription from Voit (2018). Each pressure calculation depends on projected radius, the maximum circular velocity of the gravitational potential, and an assumption about the element abundance in the ambient CGM. For the COS-LRG galaxies, we used “Zgrad” models, which assume solar abundances at small radii and a gradual decline to 0.3 solar at large radii. For the higher-mass COS-Halos and COS-GTO galaxies, we used models with 0.3 times solar abundances. For the lower-mass COS-Halos and COS-GTO galaxies, we used models with 0.1 times solar abundances. (Note that abundances in the ambient CGM are not necessarily identical to those observed in the cooler photoionized clouds, because at least some of those clouds may not have condensed out of the ambient gas.) A dark gray line indicates where observations would match those predictions. Uncertainties in mapping onto a particular CGM model add considerable horizontal scatter, which is approximately represented by the shaded region around the line, and the individual data points generally follow the model predictions, with a scatter similar to the expected dispersion. Large open symbols corresponding to each mass-segregated subsample represent weighted subsample means and generally lie along the dark gray line, with no significant dependence on galaxy mass, except perhaps at .
5 Concluding Thoughts
These results indicate that galaxies in the stellar mass range adhere to the same regulating principle that governs the CGM around higher-mass galaxies, in that the cooling time of volume-filling ambient gas cannot fall much below at all radii. In high-mass galaxies, the feedback that limits cooling comes from black hole accretion. In low-mass galaxies it comes mostly from supernovae, but a role for black holes cannot be ruled out. In this marginally unstable state, condensation of ambient gas may be producing at least some of the photoionized K clouds that are embedded within it, and the predicted condensation rate is similar to a galaxy’s time-averaged rate of star formation (Voit et al., 2015a). Around dwarf galaxies of even lower mass (), photoelectric heating suppresses radiative cooling of ambient circumgalactic gas at the predicted pressure (Stern et al., 2018), with implications for precipitation that have yet to be modeled. However, it is likely that the UV background then maintains the CGM in a state that maximizes the abundance of the O5+ ion and allows those dwarf galaxies to produce strong O VI absorption lines (Johnson et al., 2017).
G.M.V. acknowledges helpful conversations with Gus Evrard and has been supported in part by Chandra Science Center grant TM8-19006X. H.W.C. and F.S.Z. acknowledge partial support from HST- GO-14145.01A and NSF AST-1715692 grants. J.K.W. acknowledges support from a 2018 Alfred P. Sloan Research Fellowship and NSF-AST-1812531. B.W.O. was supported in part by NSF grants PHY-1430152, AST-1514700, OAC-1835213, by NASA grants NNX12AC98G, NNX15AP39G, and by HST AR #14315. G.L.B. was partially supported by NSF grant AST-1615955 and NASA grant NNX15AB20G.
References
- Blanc et al. (2019) Blanc, G. A., Lu, Y., Benson, A., Katsianis, A., & Barraza, M. 2019, arXiv e-prints, arXiv:1904.02721
- Borthakur et al. (2016) Borthakur, S., Heckman, T., Tumlinson, J., et al. 2016, ApJ, 833, 259
- Bregman (2007) Bregman, J. N. 2007, ARA&A, 45, 221
- Chen et al. (2010) Chen, H.-W., Helsby, J. E., Gauthier, J.-R., et al. 2010, ApJ, 714, 1521
- Chen et al. (2018) Chen, H.-W., Zahedy, F. S., Johnson, S. D., et al. 2018, MNRAS, 479, 2547
- Faerman et al. (2017) Faerman, Y., Sternberg, A., & McKee, C. F. 2017, ApJ, 835, 52
- Gaspari et al. (2013) Gaspari, M., Ruszkowski, M., & Oh, S. P. 2013, MNRAS, 432, 3401
- Gaspari et al. (2012) Gaspari, M., Ruszkowski, M., & Sharma, P. 2012, ApJ, 746, 94
- Gaspari et al. (2017) Gaspari, M., Temi, P., & Brighenti, F. 2017, MNRAS, 466, 677
- Haardt & Madau (2001) Haardt, F., & Madau, P. 2001, in Clusters of Galaxies and the High Redshift Universe Observed in X-rays, ed. D. M. Neumann & J. T. V. Tran, 64
- Haardt & Madau (2012) Haardt, F., & Madau, P. 2012, ApJ, 746, 125
- Henley & Shelton (2013) Henley, D. B., & Shelton, R. L. 2013, ApJ, 773, 92
- Huang et al. (2016) Huang, Y.-H., Chen, H.-W., Johnson, S. D., & Weiner, B. J. 2016, MNRAS, 455, 1713
- Johnson et al. (2017) Johnson, S. D., Chen, H.-W., Mulchaey, J. S., Schaye, J., & Straka, L. A. 2017, ApJ, 850, L10
- Keeney et al. (2017) Keeney, B. A., Stocke, J. T., Danforth, C. W., et al. 2017, ApJS, 230, 6
- Kuntz & Snowden (2000) Kuntz, K. D., & Snowden, S. L. 2000, ApJ, 543, 195
- Maller & Bullock (2004) Maller, A. H., & Bullock, J. S. 2004, MNRAS, 355, 694
- Mathews & Brighenti (2003) Mathews, W. G., & Brighenti, F. 2003, ARA&A, 41, 191
- McGaugh et al. (2010) McGaugh, S. S., Schombert, J. M., de Blok, W. J. G., & Zagursky, M. J. 2010, ApJ, 708, L14
- McQuinn & Werk (2018) McQuinn, M., & Werk, J. K. 2018, ApJ, 852, 33
- Mo & Miralda-Escude (1996) Mo, H. J., & Miralda-Escude, J. 1996, ApJ, 469, 589
- Moster et al. (2010) Moster, B. P., Somerville, R. S., Maulbetsch, C., et al. 2010, ApJ, 710, 903
- Münch & Zirin (1961) Münch, G., & Zirin, H. 1961, ApJ, 133, 11
- Prochaska et al. (2011) Prochaska, J. X., Weiner, B., Chen, H.-W., Mulchaey, J., & Cooksey, K. 2011, ApJ, 740, 91
- Sánchez et al. (2017) Sánchez, S. F., Barrera-Ballesteros, J. K., Sánchez-Menguiano, L., et al. 2017, MNRAS, 469, 2121
- Sharma et al. (2012a) Sharma, P., McCourt, M., Parrish, I. J., & Quataert, E. 2012a, MNRAS, 427, 1219
- Sharma et al. (2012b) Sharma, P., McCourt, M., Quataert, E., & Parrish, I. J. 2012b, MNRAS, 420, 3174
- Shull et al. (2015) Shull, J. M., Moloney, J., Danforth, C. W., & Tilton, E. M. 2015, ApJ, 811, 3
- Spitzer (1956) Spitzer, Jr., L. 1956, ApJ, 124, 20
- Stern et al. (2018) Stern, J., Faucher-Giguère, C.-A., Hennawi, J. F., et al. 2018, ArXiv e-prints, arXiv:1803.05446
- Stocke et al. (2013) Stocke, J. T., Keeney, B. A., Danforth, C. W., et al. 2013, ApJ, 763, 148
- Sutherland & Dopita (1993) Sutherland, R. S., & Dopita, M. A. 1993, ApJS, 88, 253
- Tumlinson et al. (2017) Tumlinson, J., Peeples, M. S., & Werk, J. K. 2017, ARA&A, 55, 389
- Tumlinson et al. (2011) Tumlinson, J., Thom, C., Werk, J. K., et al. 2011, Science, 334, 948
- Voit (2018) Voit, G. M. 2018, arXiv e-prints, arXiv:1811.04976
- Voit et al. (2015a) Voit, G. M., Bryan, G. L., O’Shea, B. W., & Donahue, M. 2015a, ApJ, 808, L30
- Voit et al. (2015b) Voit, G. M., Donahue, M., Bryan, G. L., & McDonald, M. 2015b, Nature, 519, 203
- Voit et al. (2017) Voit, G. M., Meece, G., Li, Y., et al. 2017, ApJ, 845, 80
- Werk et al. (2013) Werk, J. K., Prochaska, J. X., Thom, C., et al. 2013, ApJS, 204, 17
- Werk et al. (2014) Werk, J. K., Prochaska, J. X., Tumlinson, J., et al. 2014, ApJ, 792, 8
- Werk et al. (2016) Werk, J. K., Prochaska, J. X., Cantalupo, S., et al. 2016, ApJ, 833, 54
- Zahedy et al. (2019) Zahedy, F. S., Chen, H.-W., Johnson, S. D., et al. 2019, MNRAS, 484, 2257