Optical IFU spectroscopy of a bipolar microquasar jet in NGC 300
Abstract
We recently reported the discovery of a candidate jet-driving microquasar (S10) in the nearby spiral galaxy NGC 300. However, in the absence of kinematic information, we could not reliably determine the jet power or the dynamical age of the jet cavity. Here, we present optical MUSE integral field unit (IFU) observations of S10, which reveal a bipolar line-emitting jet structure surrounding a continuum-emitting central source. The optical jet lobes of S10 have a total extent of 40 pc and a shock velocity of 150 km s-1. Together with the jet kinematics, we exploit the MUSE coverage of the Balmer H line to estimate the density of the surrounding matter and therefore compute the jet power to be 6.3 1038 erg s-1. An optical analysis of a microquasar jet bubble and a consequent robust derivation of the jet power have been possible only in a handful of similar sources. This study therefore adds valuable insight into microquasar jets, and demonstrates the power of optical integral field spectroscopy in identifying and analysing these objects.
keywords:
accretion, accretion disks – stars: black holes – X-rays: binaries1 Introduction
Accretion-powered objects of all types appear to produce jets of some kind (see e.g. Livio 1999). On galactic scales, radio jets are seen in many active galaxies and quasars. On stellar-mass scales, the presence of jets is well established in systems ranging from young stellar objects to accreting neutron stars and black holes. In recent years, jets have even been discovered in cataclysmic variables (accreting white dwarf systems, Körding et al. 2008) and accreting X-ray pulsars (van den Eijnden et al., 2018). Both of these classes had previously been thought to be incapable of driving such powerful collimated outflows. All of this suggests that jets are a key ingredient in the physics of disk accretion. In addition, jets are also important sources of feedback into the interstellar medium, both in terms of total kinetic power, and as sources for the production of cosmic rays (Heinz & Sunyaev 2002; Fender & Muñoz-Darias 2016; Romero et al. 2017). The term microquasar (Mirabel et al., 1992) is often used to describe the most extreme X-ray binaries with strong, resolved jets.Two of the best-known Galactic examples which show the most prominent resolved jets are the accreting black holes SS 433 (e.g. Zealey et al. 1980; Fabrika 2004; Brinkmann et al. 2007; Goodall et al. 2011; Farnes et al. 2017) and GRS 1915+105 (e.g. Castro-Tirado et al. 1992; Mirabel & Rodríguez 1994; Reid et al. 2014; Tetarenko et al. 2018). Both of these systems are thought to be accreting at rates in excess of the Eddington limit for a black hole.
In external galaxies, searches for stellar-mass black holes accreting at similarly high rates have focused on ultra-luminous X-ray sources (ULXs: erg s-1). At least some ULXs are now known to contain neutron stars (based on the detection of coherent pulsations, e.g. Doroshenko et al. 2015), implying accretion at even more highly super-Eddington rates and/or strong beaming. Regardless of the nature of the compact accretor, ULXs represent a promising population in which to search for extragalactic microquasars.
Many ULXs in the Local Universe are surrounded by large optical nebulae (e.g. Pakull & Mirioni 2002). In some cases, such as the nebula around Holmberg II X-1 (Pakull & Mirioni, 2002), the observed line ratios suggest that the gas is X-ray photoionised; in other cases, such as the one around NGC 1313 X-2, collisional ionisation dominates (Pakull & Grisé, 2008). These nebulae provide important information about the nature and the true energy output of ULXs. In photo-ionised nebulae, the total power emitted in the HeII line leads to an estimate of the X-ray luminosity of the central source (Pakull & Mirioni, 2002), which argues strongly against high beaming factors. In shock-ionised nebulae, also known as “ULX bubbles”, the power emitted in diagnostic lines, such as H, [OIII] , and [FeII] m, is a proxy for the input mechanical power (Dopita & Sutherland, 1996) and shows that the kinetic output (in the form of jets and/or winds, e.g. Siwek et al. 2017) can be of the same order of magnitude as the radiative output.
X-ray photoionised nebulae (powered by accreting compact objects, see also Kallman & McCray 1982; Pakull & Angebault 1986) can be easily distinguished from ordinary HII regions (ionised by stellar photons), because of the co-existence of lower-ionisation and higher-ionisation lines of the same elements (e.g., [OIII], [OII] and [OI]), and the higher relative strength of high-ionisation lines such as those from HeII and [NeV] (Urquhart et al., 2018). Shock-ionised ULX bubbles can be distinguished from supernova remnants (SNRs) because of their larger size (diameters of 100–300 pc, e.g. Pakull & Grisé 2008) and dynamical age ( 105 yr).
Both kind of ULX nebulae (photo- and shock-ionised) provide an additional, independent line of evidence that geometric and relativistic beaming are unlikely to be of strong importance for producing the high luminosities seen in most ULXs (Pakull & Mirioni, 2002; Kaaret et al., 2004; Binder et al., 2018). If high beaming factors were present, for every nebula containing a ULX, there should be a large number of isotropically emitting nebulae without a strong X-ray source in the center (representing systems in which the X-rays are beamed away from our line of sight). This is in contradiction with observational results. The few nebulae without ultraluminous X-ray sources are then of great interest (Pakull et al., 2010). It is likely that these are ULXs viewed edge-on, like SS 433 in the Milky Way, so that the inner accretion flow where most of the X-rays are produced is obscured by the puffed-up outer accretion disk. Developing good statistics on the number, kinetic power, and eventually the orbital periods of these systems may thus help understand the nature of the ultraluminous sources’ geometries. It is thus of great importance to discover and characterize these nebulae.
In a recent publication, Urquhart et al. 2019 (henceforth referred to as Paper I) reported the discovery and carried out a comprehensive multi-wavelength analysis of a candidate microquasar in NGC 300, associated with the collisionally-ionised nebula S10, which had previously been interpreted as a SNR (D’Odorico et al., 1980; Blair & Long, 1997). While not sufficiently bright to classify S10 as a ULX, the Chandra X-ray data show an elongated ( 150 pc) structure consisting of four discrete knots, which is suggested to result from shocks along the axis of a jet as it propagates through the local interstellar medium (ISM). In the optical, Hubble Space Telescope (HST) broad-band and Very Large Telescope (VLT) narrow-band images show a bubble and likely jet lobes seemingly associated with the X-ray structure. In the radio regime, 5-GHz and 9-GHz maps from the Australia Telescope Compact Array (ATCA) were also discussed in Paper I, and supported the identification of a large-scale jet, with optically-thin synchrotron emission. In Paper I, we estimate the jet power according to the method of Pakull et al. (2010), where the main derived quantity is the shock velocity. From the total H luminosity, we find a jet power P erg s-1. However, this result depends on an assumed shock velocity, and a more reliable estimate of the jet power can be obtained by computing the dynamical age of the shocked bubble. For this, the shock velocity, the ambient ISM density and the size of the bubble are required (Weaver et al., 1977; Kaiser & Alexander, 1997; Lamers & Cassinelli, 1999).
In this paper, we use the Multi Unit Spectroscopic Explorer (MUSE; Bacon et al. 2010) on the VLT to analyse the kinematic and physical properties of the S10 nebula. MUSE covers all the main nebular emission lines in the optical wavelength regime ( 4750–9350 Å in the nominal mode). The simultaneous spectral and spatial coverage of this integral field spectrograph enables us to determine the kinematics of the shocked gas and the ISM density, and therefore derive a more robust measurement of jet power. Moreover, our MUSE data allow us to determine the spatial orientation of the bipolar jet along the line of sight. This paper is organised as follows. Section 2 discusses the MUSE observations, data reduction and astrometry; in Section 3, we analyse the morphology, kinematics, nebular emission and stellar counterpart of S10, and compute the jet power; conclusions are presented in Section 4.

2 Observations
The data presented in this work were taken with the integral field spectrograph MUSE (mounted on the VLT), as part of the observing program 098.B-0193(A) (PI McLeod). This program consists of a contiguous 35-pointing mosaic covering the NGC 300 disk. Here, we only analyse data from the MUSE cube covering NGC 300-S10. The data cube is a combination of three 900 seconds integration time single telescope pointings taken in a 90∘ rotation dither pattern, a strategy which has proven successful in reducing instrumental artefacts in our previous MUSE programs (e.g. McLeod et al. 2015, McLeod et al. 2016b). The observations were carried out in January 2017 under grade A observing conditions, with an average seeing of 0′′.5. This program was taken in the Wide Field Mode of MUSE, with a pixel scale of 0.2 arcsec/pixel, a resolving power of 1770 to 3590 (from 4750 to 9350 Å ), and a spectral separation of 1.25 Å between single frames.
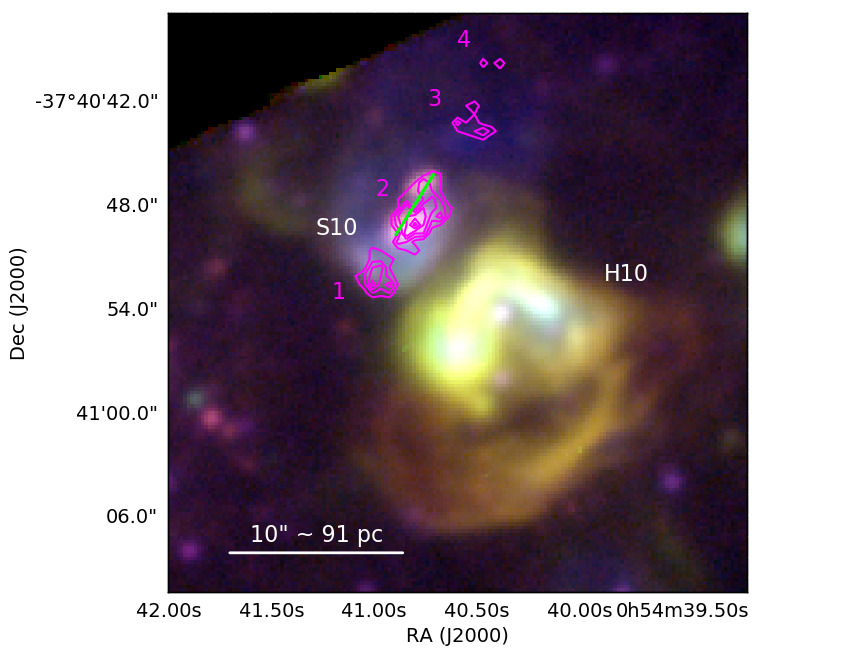
The data reduction was carried out with the MUSE pipeline (Weilbacher et al., 2012) in the esorex environment using the standard calibration files for that particular night and the static calibrations of the pipeline. Emission line and ratio maps are obtained as in our previous MUSE programs (McLeod et al. 2015, McLeod et al. 2016a, McLeod et al. 2016b), and a MUSE three-color composite of the [SII]6717, H and [OIII]5007 lines is shown in Fig. 1. The galactic background (selected from an emission-free region) is subtracted from each integrated emission line map, and we mask pixels with negative values in the map with lowest S/N ([NII]6548).
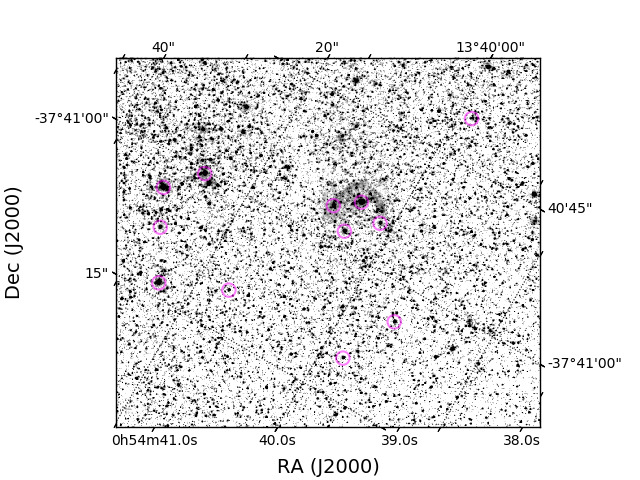
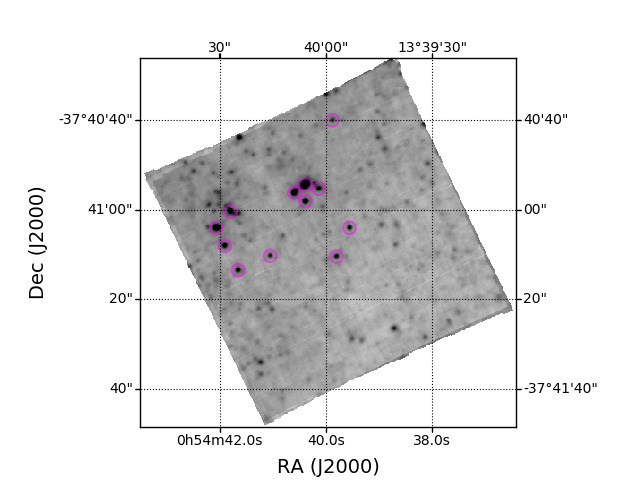
Because of the 90∘ rotation dither pattern used for our observations, we want to exclude the introduction of world coordinate system (WCS) shifts/distortions which would complicate the overlay with the X-ray data in Section 3 and the HST broad-band filter image in Section 3.3. For this we compare the MUSE WCS to that of HST data by using the photutils package (Bradley et al., 2017) to identify point sources in both the archival HST F814W and the MUSE V band images. Here, the V band filter image was obtained by collapsing the combined MUSE cube over the Johnson-Cousins V band filter specifications, with a central wavelength of 5477 Å and a FWHM of 991 Å. In a second step, we cross match the two point source catalogs, obtaining a mean separation of 0′′.12 between cross-matched objects, smaller than the MUSE pixel scale of 0′′.2. We are therefore confident in adopting the MUSE WCS for the purpose of the analyses presented in this paper. The cross-matched sources are shown in the Appendix, Fig. 8(a) and 8(b) for HST and MUSE, respectively.
3 Analysis
3.1 Morphology and kinematics
In Paper I, the presence of a powerful microquasar is inferred from a string of four aligned X-ray knots (magenta contours in Fig. 1) and an elongated radio structure, associated with the shock-ionised optical nebula S10 (RA , Dec , J2000). As part of one of the earliest classifications of this source, Blair & Long (1997) identify S10 as a candidate supernova remnant. Immediately South-West of S10 is another large optical nebula, labeled H10 in Blair & Long (1997), and interpreted as an ordinary H II region.
Here, we exploit the MUSE coverage of the main optical nebular emission lines to analyse the morphology and kinematics of the ionised gas associated with S10 and H10. Fig. 1 shows a three-color composite of the region of interest, where red is [SII]6717, green is H, and blue corresponds to [OIII]5007. S10 is clearly identified in the MUSE data, with two bright emission line regions coincident with X-ray knot 2 (magenta contours). This indicates that X-ray knot 2 is indeed extended, as suggested in Paper I. The MUSE data also reveal a bow-shock-like structure to the South-East (part of which is coincident with knot 1), as well as diffuse [OIII] emission (blue in Fig. 1) towards the northern end of S10. The HII region H10 is a bubble-shaped structure, traced by bright emission on its northern rim (facing S10), and a more filamentary southern rim. Integrated flux values of the main nebular emission lines for S10 and H10 are listed in Table LABEL:fluxes.
| Line | Flux | |
|---|---|---|
| S10 | H10 | |
| H | 98 | 95 |
| 5007 [OIII] | 206 | 38 |
| 6548 [NII] | 38 | 24 |
| H | 300 | 300 |
| 6584 [NII] | 115 | 68 |
| 6717 [SII] | 116 | 62 |
| 6731 [SII] | 107 | 45 |
| Region | A6717 | A6731 | Ne | ||
|---|---|---|---|---|---|
| (10-16 erg s-1 cm-2 Å-1) | Å | (10-16 erg s-1 cm-2 Å-1) | Å | (cm-3) | |
| S10 | 23.2 | 1.60 | 18.7 | 1.80 | 456 |
| H10 | 167.0 | 1.18 | 116.2 | 1.17 | 42 |
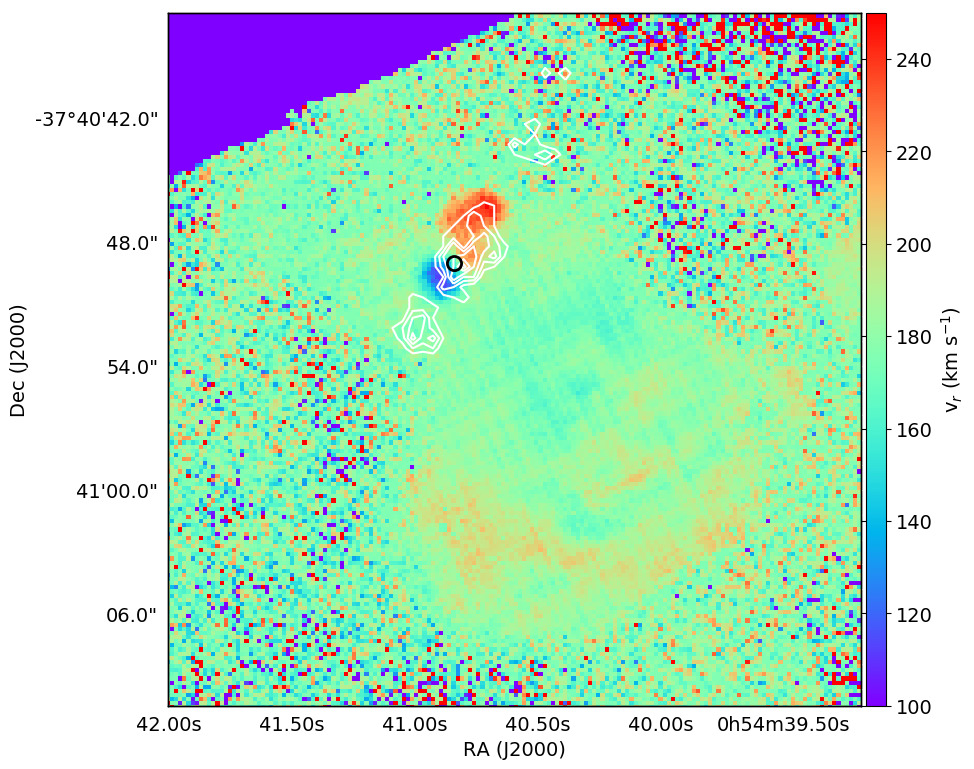
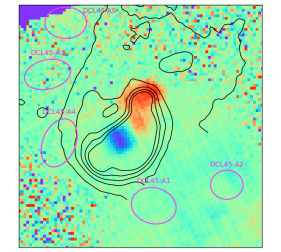
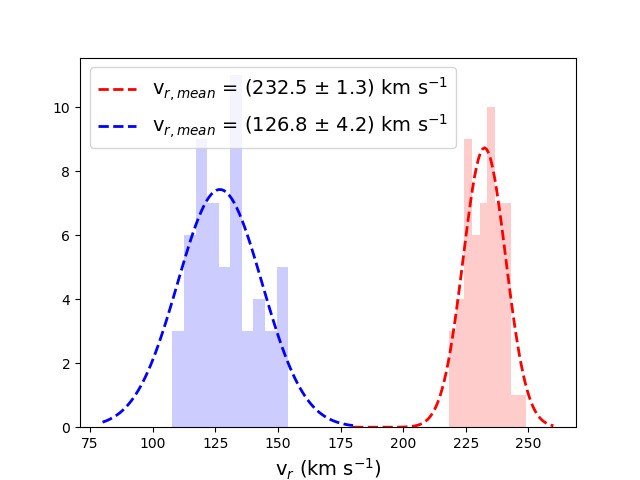
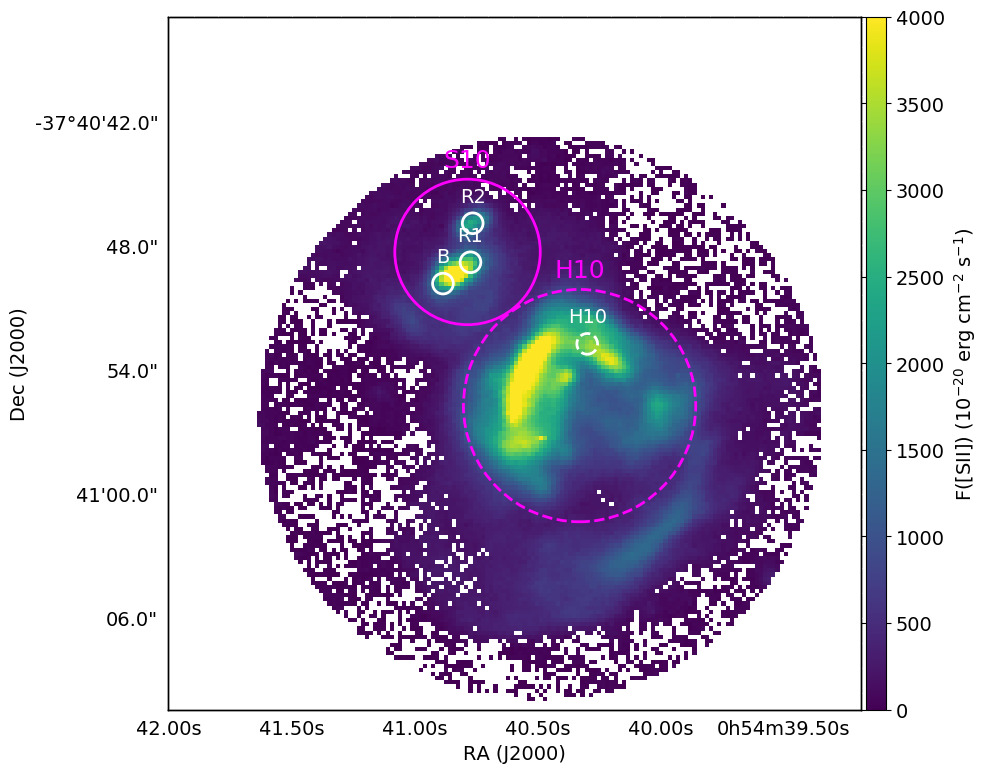
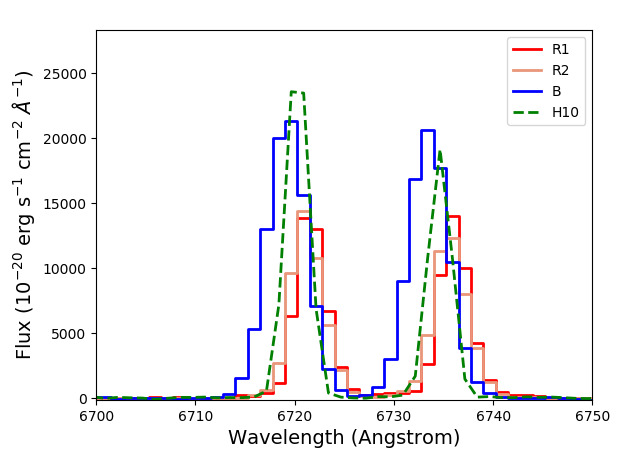
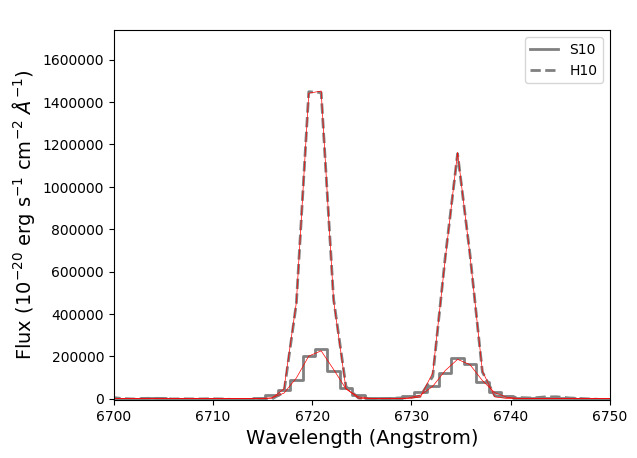
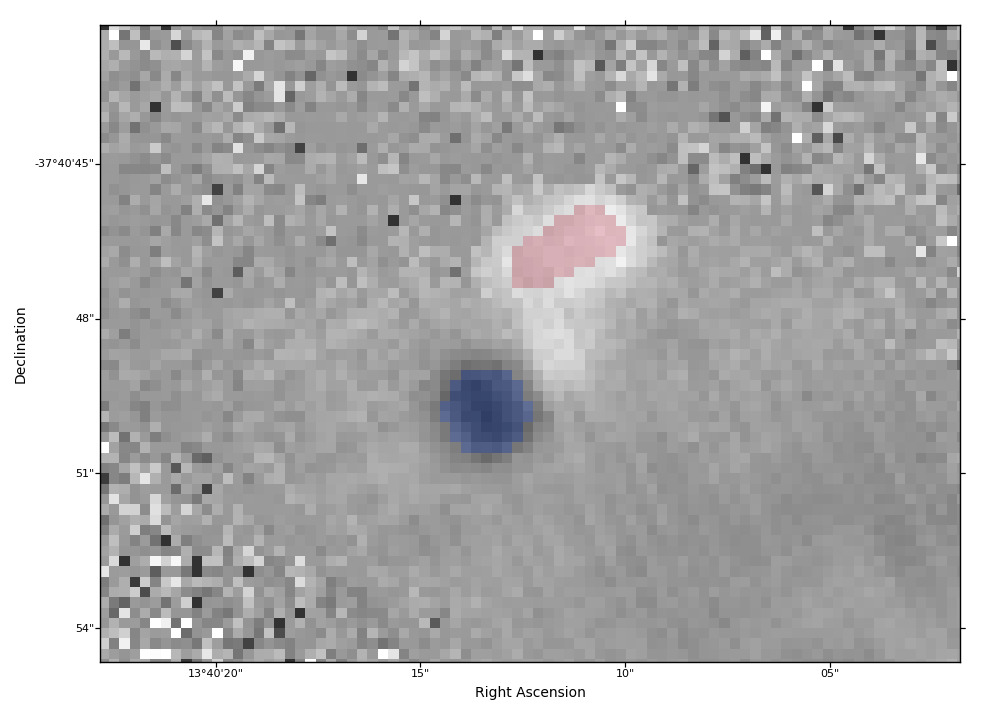
The kinematics of the ionised gas are illustrated in Fig. 2, which shows a radial velocity map obtained by applying a pixel-by-pixel single component Gaussian fitting routine to the [SII]6717 line. The southern H10 shell can be identified at velocities of 195 km s-1, in good agreement with the radial velocity map of NGC 300 obtained by Westmeier et al. (2011) from HI 21 cm data. The striking feature in Fig. 2, however, is coincident with X-ray knot 2 and consists of a bipolar structure aligned with the general direction of S10. Together with the results of Paper I, this bipolar morphology of S10 confirms the presence of a microquasar jet powered by accretion onto a compact central object and traced by the emission of the ionised bubble driven by the bipolar jet. Given the distance to NGC 300 of 2 Mpc (Dalcanton et al., 2009), we infer the ionised shocks to be pc apart (i.e. the projected separation between the two velocity peaks, see also Fig. 1). We use glue111http://glueviz.org/ to extract representative pixel values of the red and blue lobes of S10 (see Appendix, Fig. 9), allowing us to further analyse the bipolar jet bubble. Histograms of the extracted pixel velocities are shown in Fig. 3. Gaussian fits to the distributions yield a projected differential velocity (105 4) km s-1 between the red-shifted and blue-shifted peaks. Thus, the forward-shock velocity is 50 km s-1, which however is a strict lower limit given that projection effects are playing a significant role and the absolute shock velocity is potentially much higher (see Section 3.2). To further illustrate the shifted line centroids of the two lobes we plot their [SII] spectra in Fig. 4(b) (where we label the blue lobe as B, and two regions in the red lobe as R1 and R2), together with a spectrum of H10.
The velocity structure of S10 shows a clear asymmetry between the red and blue lobes where the red lobe is almost double in angular size than the blue lobe (see Fig. 2). This is a possible indication for a scenario in which the blue lobe is moving towards (and therefore being slowed down by) a region of higher density as compared to the redshifted region. If so, we would expect to find molecular material in the path of the blue lobe. To test this scenario we retrieve the coordinates, position angles and approximate sizes of ALMA CO intensity peaks in the region from Faesi et al. (2018) and plot them in Fig. 2(a). We find that the CO peaks trace the bow-shock shaped structure seen in Fig. 1(b), therefore supporting the picture in which the blueshifted jet lobe is expanding into a region higher density, where it is being slowed down and a bow-shock is observed.
3.2 Emission line ratios
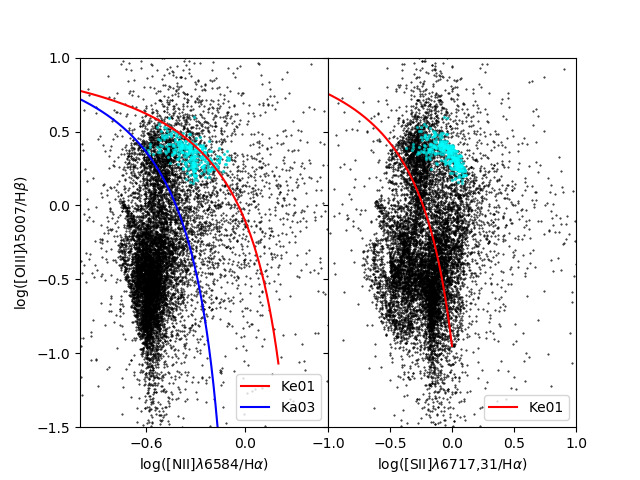
We exploit MUSE’s coverage of the optical nebular emission lines to further investigate the physical conditions of the ionised gas in terms of shock- vs. photo-ionisation and ISM densities. In Paper I, we suggested that the emission in S10 is mainly due to shock-ionisation, as opposed to photo-ionisation (which is responsible for part of the emission from H10). Here, we further strengthen this statement with the diagnostic BPT diagram (Baldwin, Phillips & Terlevich, 1981), which compares ratios of the main collisionally excited lines to the Balmer recombination lines. Shock- and photo-ionisation-dominated regions occupy different parts of the BPT diagram, and it has therefore been used extensively to distinguish between HII regions and AGN, for example. Generally, one distinguishes between HII regions (photo-ionisation) and AGN-dominated galaxies (shock-ionisation) depending on whether a source is found above or below the maximum starburst line, as determined from photoionisation and stellar synthesis population models (Kewley et al., 2001). The [NII] and [SII] BPT diagrams for the FOV covered by the data cube are shown in Fig. 5, where the data points corresponding to S10 are marked in cyan. The S10 data points lie above the maximum starburst lines in both the [SII] (Kewley et al., 2001) and the [NII] (Kauffmann et al., 2003) BPT diagrams (where the blue line in the [NII] BTP diagram corresponds to a modified Kewley et al. 2001 line which also accounts for composite HII region and AGN excitation), suggesting that shocks (or non-stellar AGN-type ionising continua) are the dominant ionisation mechanism. The BPT diagram line ratios of the individual pixels are indicative of shock velocities of 55 – 90 km s-1, which correspond to a lower limit. Below we derive shock velocities of the red- and blueshifted lobes from the FWHM of their integrated spectra.
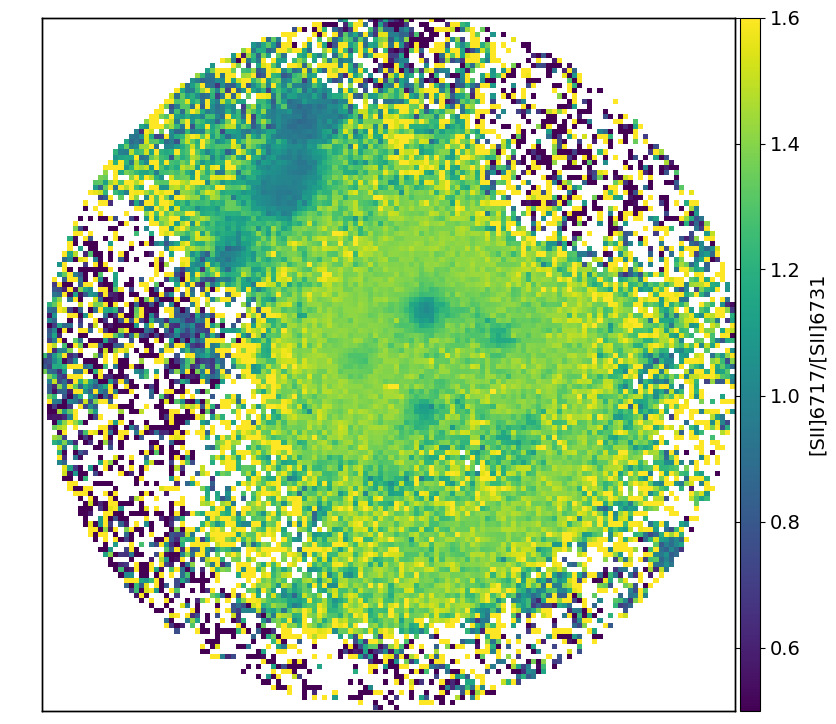
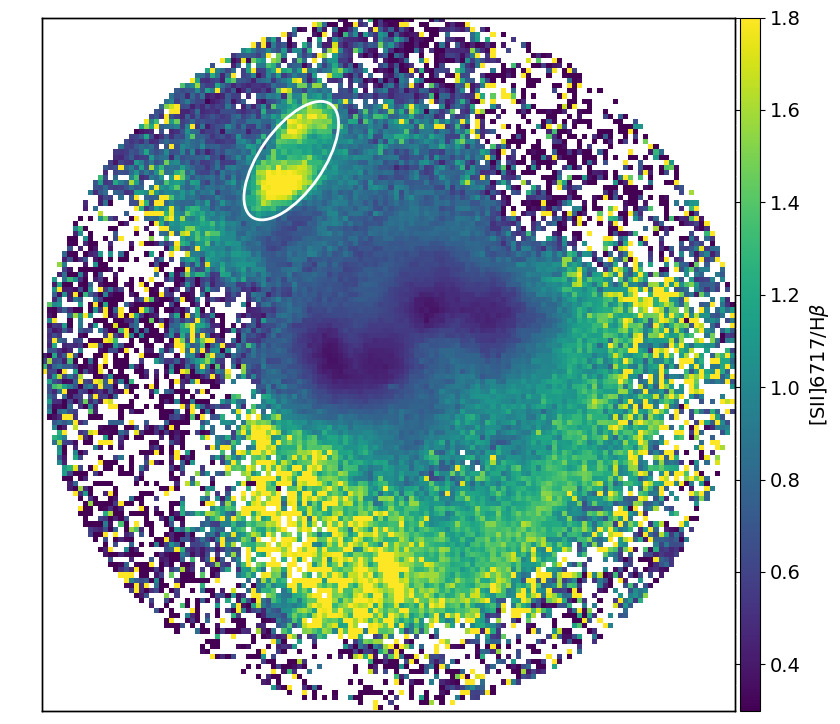
Further line ratios are shown in Figures 10, where the ratio of the [SII] lines traces the electron density and enhanced values of the [SII]6717/H ratio trace shock-ionized gas. It should be acknowledged that – as also mentioned in McLeod et al. 2015 and Ercolano et al. 2012 – some caution is required when applying BPT diagnostics to the emission line properties of spatially resolved regions. Specifically, the models used to interpret the BPT diagram predict integrated fluxes for single galaxies or HII regions, whereas our spatially resolved emission line ratios will reflect local variations of physical properties of the gas such as the density and the temperature (McLeod et al., 2016a). A more detailed emission line ratio and shock analysis of S10 and other shock-ionised sources in NGC 300 will be discussed in a forthcoming publication.
The derivation of the jet power (see Section 3.4) relies on the knowledge of the density of the pre-shock (ambient) ISM into which the jet is propagating. The ISM density does not correspond to the density as one would measure e.g. from the ratio of the [SII] lines, as this would deliver the electron density of the shocked matter. Moreover, local variations of physical parameters, together with weak emission line intensities, can lead to unrealistically high (or low) values when deriving e.g. the electron temperature on spatially-resolved scales. To estimate the pre-shock density , we therefore use the surface brightness of the H line according to Dopita & Sutherland (1996), who give a relation between the flux of the H line from a surface element of a radiative shock with velocity and the density,
| (1) |
where corresponds to in units of 100 km s-1. A bubble of radius R at a distance D from the observer spans a solid angle of on the sky and is observed with a flux and an intensity . Hence, Eq. 1 becomes
| (2) |
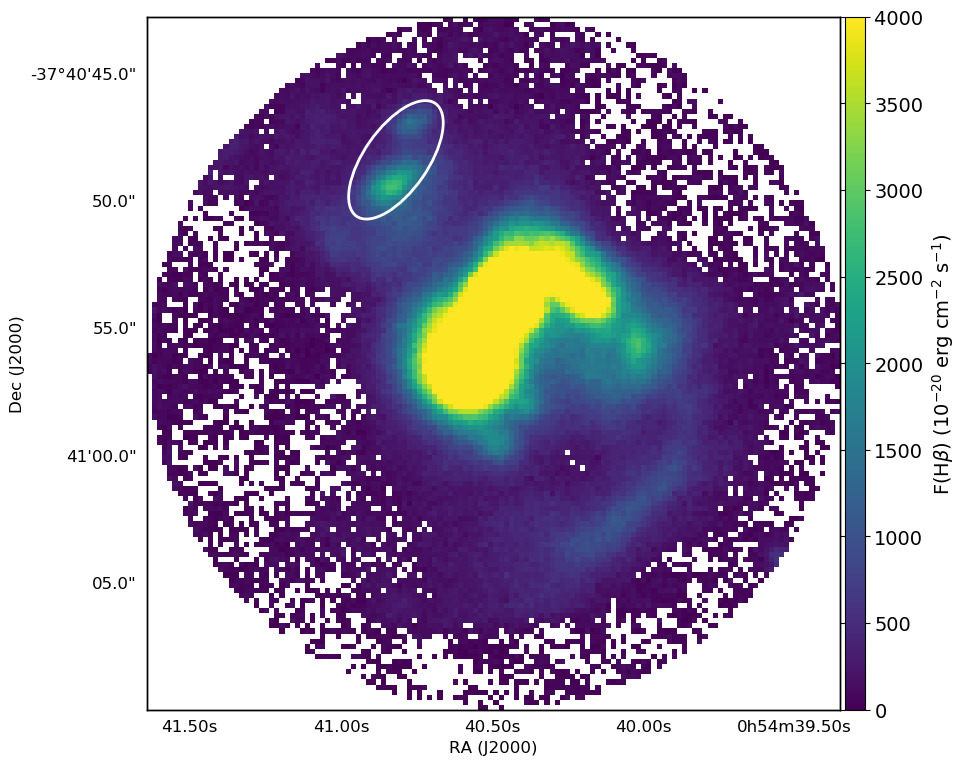
For the spectra shown in Fig. 4(b) we measure FWHM of 4.1, 4.2, 5.1 and 3.3 Å for R1, R2, B and H10, respectively. With an instrumental FWHM of 3 Å of MUSE at 6700 Å the mean intrinsic line width of the S10 [SII] lines therefore is 4.5 Å. This corresponds to shock velocities 150 km s-1 (with FWHM, Heng 2010), hence . From the H integrated line map (see Fig. 6) we derive 1.2 erg cm-2 s-1 sr-1, and we therefore obtain 2.0 cm-3.
3.3 The central binary system
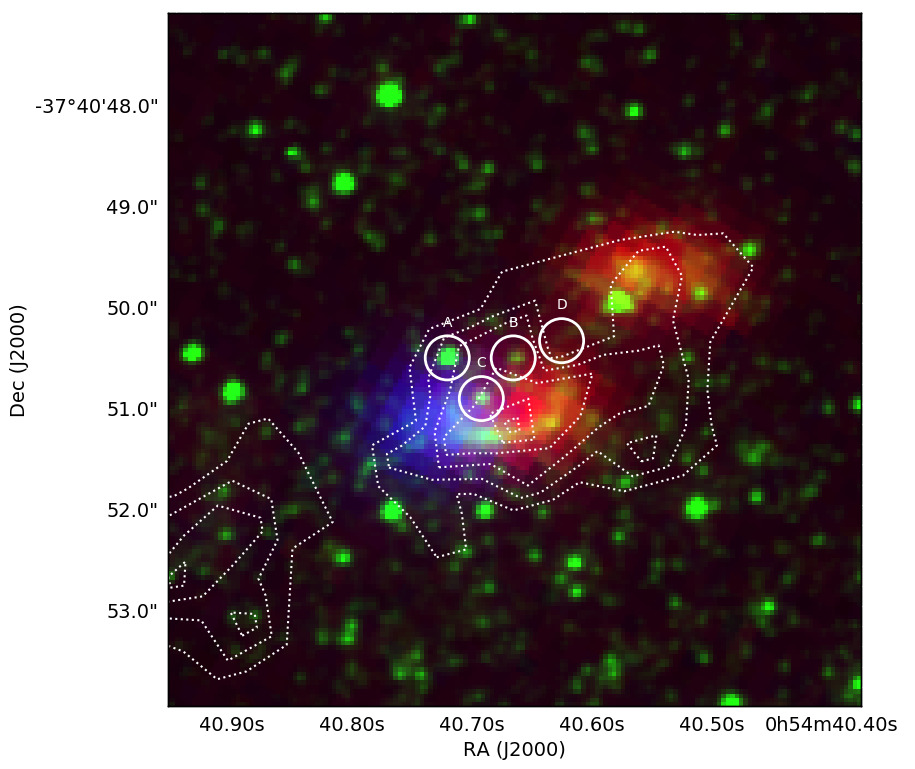
In Paper I, we discuss 4 potential point-like optical counterparts of the compact object that powers S10, selected from HST/ACS-WFC images (specifically, broadband F814W, F606W and F475W images), and suggest sources C and D (see Fig. 7) as the most likely candidates out of the sample of four.
Here, we spatially associate the two jet lobes and the four potential counterparts identified in Paper I. This is shown in Fig. 7, which consists of a 3-colour composite of the archival HST F606W image (in green), and two 1 Å wide integrated maps red and blue of the central [SII]6717 line extracted from the MUSE cube, centered on 6723.4 and 6717.2 Å, respectively. Based on the (projected) positions of the four sources with respect to the bipolar jet shown Fig. 7 (we note that source D is very faint in the F606W image, being a very red source as can be seen in the F814W image shown in Paper I), we suggest that source C is the most likely optical counterpart of the central binary associated with the S10 microquasar, as it lies almost precisely in between the red and blue jet lobes. By comparing the photometric properties of source C to the Padova isochrones (Bressan et al. 2012, see Paper I), we find this source to likely be an intermediate-age AGB star of 3 M⊙. Unfortunately the MUSE data are not deep enough to allow a spectral analysis of this source, but it is detected as a continuum source in the image obtained by collapsing the entire cube along the wavelength axis (not shown here). If source C is indeed the companion of stellar-mass black hole, and the isochrone adequately models the source (i.e. the source’s photometric properties are not too strongly affected by accretion disk light), this could indicate Case C mass transfer (i.e. mass transfer which does not begin until after the ignition of helium). Alternatively, the source could also be wind-fed.
3.4 Jet Power
Kaiser & Alexander (1997) have laid out an analytical model describing the properties of extragalactic radio sources. This model can be applied to microquasars, and more generally to accreting stellar-mass black holes producing jets (e.g. Gallo et al. 2005). By balancing the interior pressure exerted by the shock-ionised jet lobes and the ram pressure of the shocked ISM, it has been shown (Kaiser & Alexander 1997) that the jet length within the jet lobes grows with time in such a way that
| (3) |
where is the separation between the accreting source and the jet shocks, and is the mass density of the surrounding un-shocked gas. Since the speed of the shocked bubble (i.e. the jet lobe),
| (4) |
it follows that the jet lifetime can be estimated as
| (5) |
The MUSE data reveal the jet size and bubble velocity to be pc (from peak to peak) and km/s, respectively. This translates to a jet lifetime of Myr. We can now use the inferred ISM density cm-3 to estimate a mass density of g cm-3. The resulting time-averaged jet power for S10 is then erg s-1, with a total deposited energy in the jet of erg. For these estimates we have taken into account an extra factor of 2 from the equations of Kaiser & Alexander (1997) taking into account both jet lobes observed in S10. Furthermore, we have assumed a relatively wide jet opening angle for all of the above estimates by setting the constant appearing in Equation 4 of Kaiser & Alexander (1997) to 1. Although this is not known to be the case for S10, this assumption results in the simplest case. Calculating different values for different scenarios (e.g. spherical lobe) would yield a factor 4 difference in the jet power estimates, well within observational uncertainties such as measured lobe velocities or binary inclination, and in agreement with the jet power estimate reported in Paper I.
Although S10 possesses a smaller jet, lower shock velocities (likely due to S10’s propagation into a higher ambient density), and higher surrounding electron density compared to other super-Eddington microquasars (such as NGC 5408 X-1; Soria et al. 2006, IC 342 X-1 and Ho II X-1; Cseh et al. 2012), its total jet power is comparable. Furthermore, we note that the derived timescale of 0.2 Myr is consistent with the origin of the X-ray emission discussed in Paper I, where we argue that the emission is more consistent with a thermal plasma model with a thermal cooling timescale of 570,000 yr rather than synchrotron, as the latter would imply a cooling timescale of 3000 yr.
4 Conclusions
We have obtained spatially resolved spectroscopy with VLT/MUSE of the X-ray source and candidate micro-quasar S10 in the nearby galaxy NGC 300. The main results of our analysis of this data are as follows.
-
(i)
The bipolar radio and X-ray emission surrounding the X-ray source is associated with a spatially resolved optical emission line region in our data.
-
(ii)
We kinematically confirm this bipolar structure as a jet from S10, via the detection of distinct blue- and red-shifted ([SII]) emission line signatures with a shock velocity (as derived from the FWHM of the [SII] emission lines) km s-1.
-
(iii)
The spatial extent of the jet is pc ( pc), and the pre-shock (ISM) density in the material surrounding the jet is 2 cm-3 (as measured from the H surface brightness).
-
(iv)
Combining these estimates, we infer jet lifetime of Myr, a total kinetic jet power of erg s-1, and a total energy associated with the jet bubble of erg.
-
(v)
Based on these numbers, the jet from S10 is relatively small and slow relative to those in other extragalactic micro-quasars, but its total kinetic power is comparable. The jet is being driven into higher-density matter, which results in lower velocities.
-
(vi)
We identify the likely optical counterpart of the central binary system as a continuum-emitting source located centrally between the two jet lobes. The SED of the counterpart matches that of a AGB star (based on HST multi-band photometry), suggesting Case C mass transfer as the mechanism for driving the high accretion rate onto the compact object in S10.
Acknowledgements
This research is partly supported by a Marsden Grant from the Royal Society of New Zealand (AFM), and it is based on observations made with ESO Telescopes at the Paranal Observatory under program ID 098.B-0193. JMDK gratefully acknowledges funding from the German Research Foundation (DFG) in the form of an Emmy Noether Research Group (grant number KR4801/1-1) and from the European Research Council (ERC) under the European Union’s Horizon 2020 research and innovation programme via the ERC Starting Grant MUSTANG (grant agreement number 714907). RS thanks the Observatoire de Strasbourg for their hospitality during part of this work. JCAM-J is the recipient of an Australian Research Council Future Fellowship (FT140101082). Furthermore, this research made use of Astropy,222http://www.astropy.org a community-developed core Python package for Astronomy (Astropy Collaboration et al., 2013; Price-Whelan et al., 2018), Pyspeckit (Ginsburg & Mirocha, 2011) and APLpy, an open-source plotting package for Python (Robitaille & Bressert, 2012).
References
- Astropy Collaboration et al. (2013) Astropy Collaboration et al., 2013, aap, 558, A33
- Bacon et al. (2010) Bacon R., et al., 2010, in Society of Photo-Optical Instrumentation Engineers (SPIE) Conference Series. p. 8, doi:10.1117/12.856027
- Baldwin et al. (1981) Baldwin J. A., Phillips M. M., Terlevich R., 1981, PASP, 93, 5
- Binder et al. (2018) Binder B., Levesque E. M., Dorn-Wallenstein T., 2018, The Astrophysical Journal, 863, 141
- Blair & Long (1997) Blair W. P., Long K. S., 1997, The Astrophysical Journal Supplement, 108, 261
- Bradley et al. (2017) Bradley L., et al., 2017, astropy/photutils: v0.4, doi:10.5281/zenodo.1039309, https://doi.org/10.5281/zenodo.1039309
- Bressan et al. (2012) Bressan A., Marigo P., Girardi L., Salasnich B., Dal Cero C., Rubele S., Nanni A., 2012, Monthly Notices of the Royal Astronomical Society, 427, 127
- Brinkmann et al. (2007) Brinkmann W., Pratt G. W., Rohr S., Kawai N., Burwitz V., 2007, Astronomy & Astrophysics, 463, 611
- Castro-Tirado et al. (1992) Castro-Tirado A. J., Brandt S., Lund N., 1992, IAU Circ., 5590
- Cseh et al. (2012) Cseh D., et al., 2012, The Astrophysical Journal, 749, 17
- D’Odorico et al. (1980) D’Odorico S., Dopita M. A., Benvenuti P., 1980, A&AS, 40, 67
- Dalcanton et al. (2009) Dalcanton J. J., et al., 2009, The Astrophysical Journal Supplement, 183, 67
- Deharveng et al. (1988) Deharveng L., Caplan J., Lequeux J., Azzopardi M., Breysacher J., Tarenghi M., Westerlund B., 1988, A&AS, 73, 407
- Dopita & Sutherland (1996) Dopita M. A., Sutherland R. S., 1996, The Astrophysical Journal Supplement, 102, 161
- Dopita et al. (1984) Dopita M. A., Binette L., Dodorico S., Benvenuti P., 1984, The Astrophysical Journal, 276, 653
- Doroshenko et al. (2015) Doroshenko V., Santangelo A., Ducci L., 2015, Astronomy & Astrophysics, 579, A22
- Ercolano et al. (2012) Ercolano B., Dale J. E., Gritschneder M., Westmoquette M., 2012, Monthly Notices of the Royal Astronomical Society, 420, 141
- Fabrika (2004) Fabrika S., 2004, Astrophysics and Space Physics Reviews, 12, 1
- Faesi et al. (2018) Faesi C. M., Lada C. J., Forbrich J., 2018, The Astrophysical Journal, 857, 19
- Farnes et al. (2017) Farnes J. S., Gaensler B. M., Purcell C., Sun X. H., Haverkorn M., Lenc E., O’Sullivan S. P., Akahori T., 2017, Monthly Notices of the Royal Astronomical Society, 467, 4777
- Fender & Muñoz-Darias (2016) Fender R., Muñoz-Darias T., 2016, in Haardt F., Gorini V., Moschella U., Treves A., Colpi M., eds, Lecture Notes in Physics, Berlin Springer Verlag Vol. 905, Lecture Notes in Physics, Berlin Springer Verlag. p. 65 (arXiv:1505.03526), doi:10.1007/978-3-319-19416-5_3
- Gallo et al. (2005) Gallo E., Fender R., Kaiser C., Russell D., Morganti R., Oosterloo T., Heinz S., 2005, Nature, 436, 819
- Ginsburg & Mirocha (2011) Ginsburg A., Mirocha J., 2011, PySpecKit: Python Spectroscopic Toolkit, Astrophysics Source Code Library (ascl:1109.001)
- Goodall et al. (2011) Goodall P. T., Alouani-Bibi F., Blundell K. M., 2011, Monthly Notices of the Royal Astronomical Society, 414, 2838
- Hartigan et al. (1994) Hartigan P., Morse J. A., Raymond J., 1994, The Astrophysical Journal, 436, 125
- Heinz & Sunyaev (2002) Heinz S., Sunyaev R., 2002, Astronomy & Astrophysics, 390, 751
- Heng (2010) Heng K., 2010, Publ. Astron. Soc. Australia, 27, 23
- Kaaret et al. (2004) Kaaret P., Ward M. J., Zezas A., 2004, Monthly Notices of the Royal Astronomical Society, 351, L83
- Kaiser & Alexander (1997) Kaiser C. R., Alexander P., 1997, Monthly Notices of the Royal Astronomical Society, 286, 215
- Kallman & McCray (1982) Kallman T. R., McCray R., 1982, The Astrophysical Journal Supplement, 50, 263
- Kauffmann et al. (2003) Kauffmann G., et al., 2003, Monthly Notices of the Royal Astronomical Society, 346, 1055
- Kewley et al. (2001) Kewley L. J., Dopita M. A., Sutherland R. S., Heisler C. A., Trevena J., 2001, The Astrophysical Journal, 556, 121
- Körding et al. (2008) Körding E., Rupen M., Knigge C., Fender R., Dhawan V., Templeton M., Muxlow T., 2008, Science, 320, 1318
- Lamers & Cassinelli (1999) Lamers H. J. G. L. M., Cassinelli J. P., 1999, Introduction to Stellar Winds. Cambridge University Press
- Livio (1999) Livio M., 1999, Phys. Rep., 311, 225
- McLeod et al. (2015) McLeod A. F., Dale J. E., Ginsburg A., Ercolano B., Gritschneder M., Ramsay S., Testi L., 2015, Monthly Notices of the Royal Astronomical Society, 450, 1057
- McLeod et al. (2016a) McLeod A. F., Weilbacher P. M., Ginsburg A., Dale J. E., Ramsay S., Testi L., 2016a, Monthly Notices of the Royal Astronomical Society, 455, 4057
- McLeod et al. (2016b) McLeod A. F., et al., 2016b, Monthly Notices of the Royal Astronomical Society, 462, 3537
- Mirabel & Rodríguez (1994) Mirabel I. F., Rodríguez L. F., 1994, Nature, 371, 46
- Mirabel et al. (1992) Mirabel I. F., Rodriguez L. F., Cordier B., Paul J., Lebrun F., 1992, Nature, 358, 215
- Pakull & Angebault (1986) Pakull M. W., Angebault L. P., 1986, Nature, 322, 511
- Pakull & Grisé (2008) Pakull M. W., Grisé F., 2008, in Bandyopadhyay R. M., Wachter S., Gelino D., Gelino C. R., eds, American Institute of Physics Conference Series Vol. 1010, A Population Explosion: The Nature & Evolution of X-ray Binaries in Diverse Environments. pp 303–307 (arXiv:0803.4345), doi:10.1063/1.2945062
- Pakull & Mirioni (2002) Pakull M. W., Mirioni L., 2002, ArXiv Astrophysics e-prints astro-ph/0202488,
- Pakull et al. (2010) Pakull M. W., Soria R., Motch C., 2010, Nature, 466, 209
- Price-Whelan et al. (2018) Price-Whelan A. M., et al., 2018, aj, 156, 123
- Reid et al. (2014) Reid M. J., McClintock J. E., Steiner J. F., Steeghs D., Remillard R. A., Dhawan V., Narayan R., 2014, The Astrophysical Journal, 796, 2
- Robitaille & Bressert (2012) Robitaille T., Bressert E., 2012, APLpy: Astronomical Plotting Library in Python, Astrophysics Source Code Library (ascl:1208.017)
- Romero et al. (2017) Romero G. E., Boettcher M., Markoff S., Tavecchio F., 2017, Space Sci. Rev., 207, 5
- Sankrit & Hester (2000) Sankrit R., Hester J. J., 2000, The Astrophysical Journal, 535, 847
- Siwek et al. (2017) Siwek M., Sądowski A., Narayan R., Roberts T. P., Soria R., 2017, Monthly Notices of the Royal Astronomical Society, 470, 361
- Soria et al. (2006) Soria R., Fender R. P., Hannikainen D. C., Read A. M., Stevens I. R., 2006, Monthly Notices of the Royal Astronomical Society, 368, 1527
- Tetarenko et al. (2018) Tetarenko A. J., Freeman P., Rosolowsky E. W., Miller-Jones J. C. A., Sivakoff G. R., 2018, Monthly Notices of the Royal Astronomical Society, 475, 448
- Urquhart et al. (2018) Urquhart R., Soria R., Johnston H. M., Pakull M. W., Motch C., Schwope A., Miller-Jones J. C. A., Anderson G. E., 2018, Monthly Notices of the Royal Astronomical Society, 475, 3561
- Urquhart et al. (2019) Urquhart R., et al., 2019, Monthly Notices of the Royal Astronomical Society, 482, 2389
- Weaver et al. (1977) Weaver R., McCray R., Castor J., Shapiro P., Moore R., 1977, The Astrophysical Journal, 218, 377
- Weilbacher et al. (2012) Weilbacher P. M., Streicher O., Urrutia T., Jarno A., Pécontal-Rousset A., Bacon R., Böhm P., 2012, in Society of Photo-Optical Instrumentation Engineers (SPIE) Conference Series. p. 0, doi:10.1117/12.925114
- Westmeier et al. (2011) Westmeier T., Braun R., Koribalski B. S., 2011, Monthly Notices of the Royal Astronomical Society, 410, 2217
- Zealey et al. (1980) Zealey W. J., Dopita M. A., Malin D. F., 1980, Monthly Notices of the Royal Astronomical Society, 192, 731
- van den Eijnden et al. (2018) van den Eijnden J., Degenaar N., Russell T. D., Miller-Jones J. C. A., Wijnands R., Miller J. M., King A. L., Rupen M. P., 2018, Monthly Notices of the Royal Astronomical Society, 473, L141
Appendix A MUSE World Coordinate System
As described in Section 2, we compare the MUSE WCS to that of archival HST data. This is shown in Fig. 8, where the cross-matched sources between the two data sets are shown in magenta.
Appendix B glue pixel masks
We use glue (http://glueviz.org/) to extract pixel values from the velocity of the S10 jet lobes to evaluate their relative velocities, as is discussed in Section 3. This is shown in the [SII] velocity map in Fig. 9, which indicates the red/blue regions used for the pixel extraction. Pixel values withing the marked regions are then used as representative values to produce Fig. 3.
Appendix C Emission line ratios
