Microscale generation of entangled photons without momentum conservation
Spontaneous parametric down-conversion (SPDC) is a well-developed tool to produce entangled photons for practical applications, such as quantum imaging lemos2014quantum ; pittman1995optical ; brida2010experimental , quantum key distribution adachi2007simple ; jennewein2000quantum and quantum metrology wu1986generation ; valencia2004distant , as well as for tests of quantum mechanics shih1988new . So far, SPDC sources have exclusively been used in the phase matched regime: when the emitted daughter photons conserve the momentum of the pump photon. Phase matched SPDC restricts both the choice of non-linear materials and the available states the daughter photons can occupy. This has prompted the search for SPDC where phase matching is absent saleh2018towards ; tokman2018purcell ; yamashita2018nonlinear ; marino2019spontaneous . Here we register over 1000 photon pairs per second generated in a micrometer-sized SPDC source continuously pumped at a moderate power. This is both the smallest SPDC source reported to date and, due to the relaxed phase matching, an entirely new type of two-photon radiation. Reducing the interaction length and localizing the position of the daughter photons creation leads to a huge uncertainty in their momentum. The uncertain momentum mismatch leads to a frequency-angular spectrum an order of magnitude broader than that of phase matched SPDC. This results in record breaking spatio-temporal correlation widths and huge entanglement. We believe that similar sources can be realized on thinner platforms, not only compounding the aforementioned effects, but also allowing easy integrability on optical chips.
For SPDC, the probability of a pump photon, with momentum (wavevector ), to decay into two daughter photons, signal and idler with momenta (wavevectors ), strongly depends on the momentum (wavevector) mismatch . The allowed mismatch forms an uncertainty relation with the volume over which the non-linear interaction takes place. Its component parallel to the pump, or longitudinal mismatch , is restricted by the inverse length of the nonlinear material. The component perpendicular to the pump, or transverse mismatch , is restricted by the inverse non-linear interaction area, which is generally given by the Gaussian profile of the pump beam.
In a phase-matched process, , the longitudinal momentum of the pump photon is conserved by the daughter photons. However, this is a special case and is only satisfied in a few non-linear materials with the appropriate electronic and optical properties. More generally , causing pairs to be generated in or out of phase with respect to pairs generated earlier in the non-linear material. The relative phase difference depends on the non-linear interaction length, . If is equal to an odd multiple of the so called coherence length, boyd2003nonlinear , the interference between the emitted pairs is fully constructive leading to a local maximum in the emission probability. At , the pairs are always generated in phase. Moreover, with small length , the allowed longitudinal mismatch can be very large, which leads to a very broad spectrum of emitted photons, both in frequency and in angle.
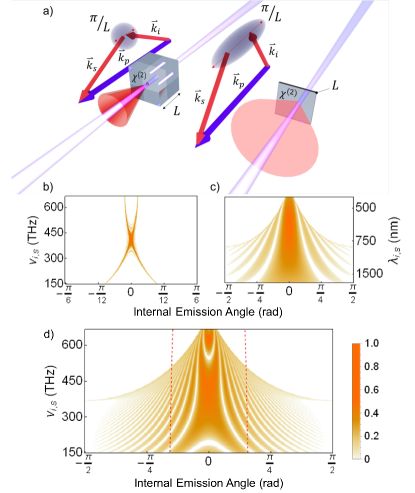
Fig. 1 a shows the allowed mismatch for a thick crystal and an ultra-thin layer. Whilst the thick crystal restricts the signal and idler angles and frequencies, the ultra-thin layer allows a broad range of modes to be populated. The calculated frequency - angular spectrum for SPDC from a single coherence length or its odd multiple (Fig. 1 c,d) is far broader than any phase matched SPDC spectra observed from a macroscopically thick crystal (Fig. 1 b). The emission characteristics differ so greatly between phase matched and non-phase matched SPDC that they can be considered separate sources of photon pairs yuan2019spatiotemporally .
While the possible emission angles and frequencies for the signal and idler photons are determined by the longitudinal mismatch, the correlation between the signal and idler angles of emission is governed by the transverse mismatch Burlakov1997 ; Monken1998 . These correlations will be tight if the pump has a large beam waist. Similarly, the frequency correlations are governed by the bandwidth of the pump Keller1997 ; Grice1997 and will be tight for a narrowband continuous-wave pump. For this reason, SPDC from an ultra-thin layer should produce photon pairs that are highly entangled in angle and frequency: while these parameters are very uncertain for a single photon, they are known with certainty when the conjugate photon is detected. It is noteworthy that whilst previous attempts to boost the bipartite entanglement have primarily focused on increasing either frequency or angular entanglement Fedorov2007 ; Brida2009 , SPDC in an ultrathin layer simultaneously has gains in both, leading to a massive improvement over previous techniques.
The reduced interaction length, however, leads to a lower SPDC emission probability (1). This can be partly compensated for by using a highly nonlinear medium. Here we use an x-cut lithium niobate (LN) crystal and, by taking advantage of the fact that we no longer need to phase match, utilize the large component of the nonlinear susceptibility tensor by correctly orienting the pump polarization. The component of LN ( pm/V) is roughly 40 times stronger than the effective susceptibility of Barium borate (BBO), a standard crystal used for SPDC experiments boyd2003nonlinear .
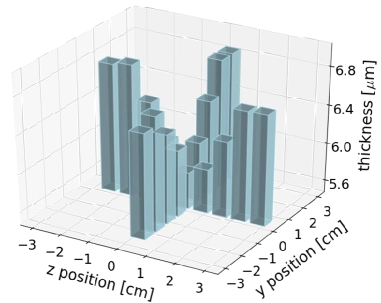
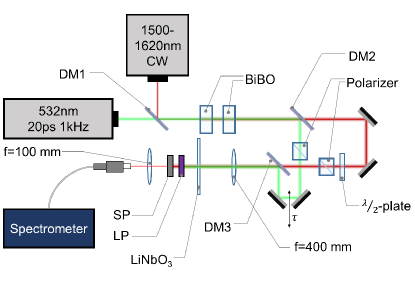
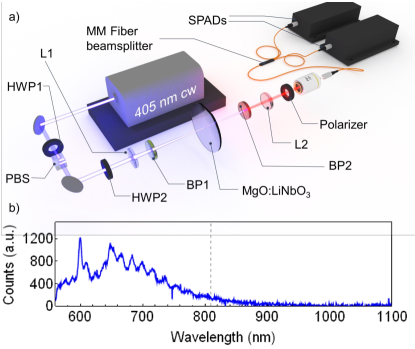
The experimental setup is shown in Fig. 2. The sample tested was a thin layer of magnesium oxide doped LN on a m fused silica substrate. The -axis of LN was in the plane of the layer. The thickness of the sample varied from 5.9 m to 6.8 m, due to the non-uniform fabrication of the wafer. Therefore by scanning the LN in the z-y plane it was possible to tune the length.
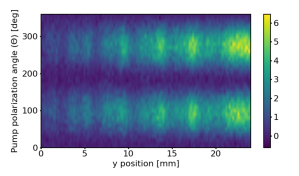
Despite the use of the highest non-linear component available in LN, the efficiency remained much lower than for phase-matched SPDC in a macroscopic crystal. As a result, fluorescence, which can usually be disregarded when working with phase matched SPDC, became the dominant process in the spectral region of interest. The measured fluorescence (Fig. 2 b) was more than an order of magnitude stronger than the expected SPDC emission. Due to the broadband nature of non-phase matched SPDC, distinguishing the two-photon radiation from fluorescence could only be done using correlation measurements.
The correlation measurements were performed using Hanbury Brown - Twiss (HBT) setup (Fig. 2 a). To begin with, the normalized second-order correlation function was measured (see Methods), shown in Fig. 3 a. Strong two-photon correlations were observed, as we see from the peak at zero delay. Further, the value of was measured for different varied pump powers (see Fig. 3 b). The measured value of was shown to have an inverse dependence on the pump power, which is a fingerprint of two-photon emission ivanova2006multiphoton . The correlation function , related to the coincidences-to-accidentals ratio , had a high value and an inverse dependence on the mean number of photons, both of which are compelling evidence of two-photon light generation.
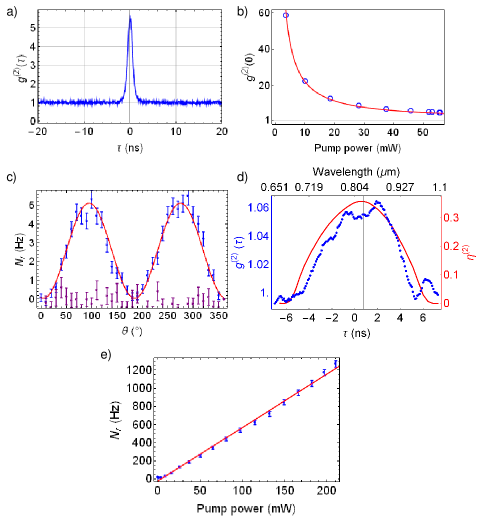
The measured polarization dependence of the coincidence count rate (Fig. 3 c) confirms that the SPDC was mediated by the component of the nonlinear susceptibility tensor, with the pump, signal, and idler photons all polarized along the z axis. Indeed, the SPDC was noticeable only when the signal and idler photons were polarized along the z axis, in this case the coincidence rate depended on the angle between the pump polarization and the y axis as (blue points, red fit). For the emission polarized along the y-axis, no real coincidences were observed (purple points).
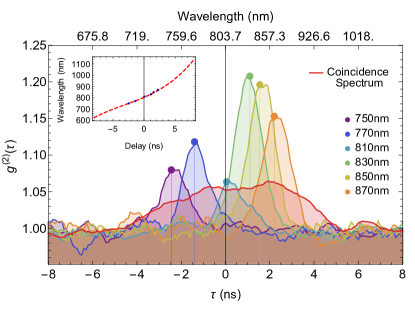
The SPDC spectrum was measured using single-photon spectroscopy (SPS) valencia2002entangled ; avenhaus2009fiber (see Methods), which allowed us to distinguish it from the fluorescence spectrum. Light generated from LN was coupled into a dispersive fiber. After propagation through the fiber the two-photon wavepackets spread in time. Therefore, the difference in the signal and idler photon detection times could be mapped to a frequency difference. The measured normalized correlation function after the propagation through 160 m of optical fibre is shown in Fig. 3 d. The width of the peak corresponds to 200 nm. This was less than the expected width of nm (Fig. 1 d) because of the relatively narrow sensitivity range of the single-photon detectors (see Methods) and frequency-dependent fiber coupling. The biphoton correlation time, given by the inverse spectral width valencia2002entangled , was estimated to be fs. The full spectral range of nm corresponds to a correlation time of fs.
Measurements with a 405 nm pump yielded a modest coincidence count rate due to the high fluorescence background saturating detectors even at low powers. To optimise this we moved to a 500 nm CW pump operating in a similar power range. The shift in wavelength reduced the fluorescence allowing a broader angle of emission to be collected without saturating the detectors. The linear dependence between the coincidence rate and pump power was verified for the optimised wavelength and collection angle (see Fig. 3 e). For the optimised pair collection and pump wavelength the CAR was measured to be 1400, with 100 mW pump power.
To demonstrate the high degree of frequency entanglement, we measured the joint spectral intensity (JSI), quantifying the joint probability of the signal and idler photons having frequencies , respectively (see Methods). The JSI was reconstructed using stimulated emission tomography (SET) liscidini2013stimulated , see Fig. 4 a.
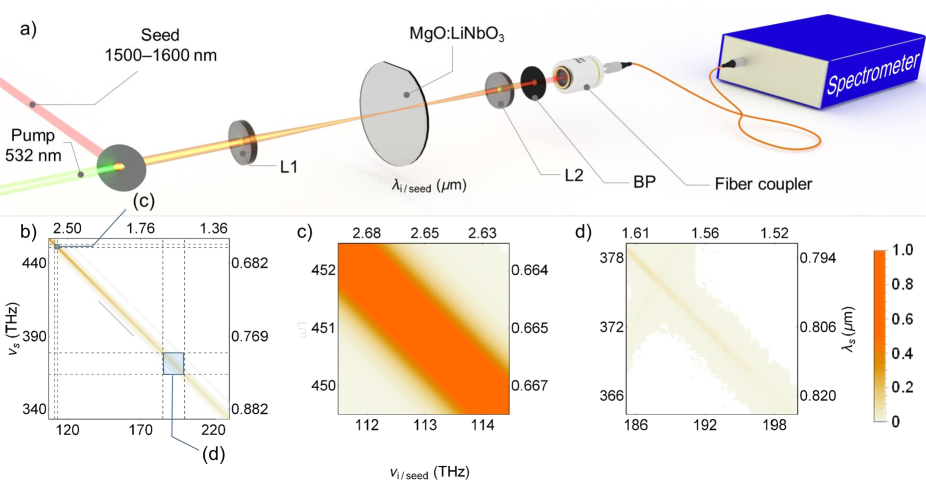
By pumping with the second harmonic of the Nd:YAG laser at nm and tuning the seed beam wavelength between and nm, a small part of the JSI (Fig. 4b,c) was mapped out as shown in Fig. 4 d. Due to the narrow tuning range of the seed, the full spectral range of SPDC could not be obtained. Still, the SET results demonstrate tight frequency correlations ( THz), within a THz range of the JSI, which confirms a degree of entanglement of at least , a value that becomes far higher when taking into account the broad spectral width.
Generating entangled photons with a broad spectral and angular width has been a long standing goal in the field of quantum optics nasr2008ultrabroadband ; bernhard2013shaping ; katamadze2015broadband . Highly non-linear ultrathin layers provide both a platform on which to achieve this goal and, due to their size and scale, a platform on which to design miniaturized quantum-photonic chips guo2017parametric . To our knowledge, here we have reported the smallest source of SPDC () found to date. Several semiconductor materials, such as gallium arsenide, have much higher second-order susceptibilities than that of LN dmitriev2013handbook . In addition, structuring such materials to enhance their resonance response can further improve the SPDC efficiency Liu2018 , thus allowing even thinner samples to be made.
The two-photon time and space correlation widths, proportional to the inverse spectral and angular widths, respectively, promise to be tighter than anything currently observed. As such the correlations in space and time could become a new resolution standard. Whilst the ultrashort correlation time can be used to synchronize distant clocks valencia2004distant , the tight spatial correlations can dramatically improve the resolution of many quantum imaging techniques such as ghost imaging and imaging with undetected photons pittman1995optical ; lemos2014quantum ; brida2010experimental ; d2005resolution . In two-photon microscopy, such a source will allow imaging well beyond the diffraction limit denk1990two , as the resolution will be determined only by the non-phase matched SPDC interaction length.
Both the angle of emission and frequency can be used as variables for encoding quantum information olislager2010frequency ; rarity1990experimental . Due to the huge spectral and angular width of non-phase matched SPDC, the expected degree of entanglement, and thus the information capacity, for non-phase matched SPDC is almost an order of magnitude higher than for a phase matched process. Additionally, using the principle of hyperentanglement, whereby the biphoton state is entangled in more than one degree of freedom barreiro2005generation , the non-phase matched state increases the information capacity as the product of both the entanglement in the frequency and angular domain, leading to improvements by several orders of magnitude.
Finally, we expect that highly non-linear thin layers will also be suitable platforms on which to observe higher-order parametric down conversion effects, such as the generation of three-photon states from a cubic interaction okoth2019seeded . Phase matching for higher-order processes becomes increasingly challenging due to the larger refractive index difference between the pump photon and daughter photons. This restricts the number of non-linear materials to work with to a far greater extent than for second-order processes. Therefore working in the non-phase matched regime is a reasonable trade-off as it allows one to utilise materials with a huge cubic susceptibility.
I Methods
Longitudinal and transverse mismatch. In a material of length , with the nonlinear susceptibility , the probability of a pair emission is
| (1) |
where is the phase matching function,
| (2) |
and, assuming a Gaussian pump beam profile with a waist , is the pump function,
| (3) |
The phase matching function, which depends solely on the longitudinal mismatch , dictates the overall spectral and angular width of the two-photon emission if the length is not too large. Conversely, the pump function, which depends on the transverse mismatch component, , gives the angular correlation width between the signal and idler photons.
Scanning the sample thickness. The rate of non-phase matched SPDC emission has an oscillatory dependence on the layer thickness, being maximum for odd multiples of and zero for even multiples of . In the case of a nm pump and degenerate SPDC at nm the coherence length for LN is m. By varying the position of the pump beam on the sample, it was possible to scan its thickness (see Supplementary Information, Fig. 5). The maximal emission happened in the thicker region of the sample, which corresponded to about , as shown in Fig. 6 of the Supplementary material. Note that the rate of SPDC for thickness would be the same as for thickness , albeit with a broader spectrum (see Fig. 1 c and d), but only a thicker sample was available for technical reasons.
Registering coincidences. Two-photon coincidences were detected using a Hanbury Brown-Twiss setup (Fig. 2 a). The CW pump beam was centered at nm and had a maximum power output of mW (Omicron). The pump polarization and power were controlled using a polarizing beam splitter (PBS) and two half wave plates (HWP). The pump was focused, using a lens (L1) with a mm focal length, into the LN sample, which was placed on a translation stage to provide movement in the z-y plane of the crystal structure. To avoid additional sources of fluorescence the pump was filtered using a 405 nm bandpass (BP1) immediately after the L1. The resulting emission was filtered of the pump with an 810 nm bandpass filter (BP2), collected using a lens (L2) with a mm focal length and coupled into a multimode fiber beam splitter. To isolate the breakdown flash effect of the single-photon detectors in time newman1955visible , two m long MM fibers were placed after the fiber beam splitter. The photons were registered on two Perkin-Elmer visible-range single photon avalanche diodes (SPAD). The arrival time of each photon was recorded using a Swabian Instruments Time Tagger. To find the real coincidence rate, the accidental coincidence rate was subtracted,
| (4) |
where is the total coincidence rate and . are the single photon count rates into detector 1 and 2 respectively, and is the coincidence resolution time. The normalized second-order correlation was calculated using
| (5) |
From this it is clear that is inversely proportional to the number of photons detected: whilst the number of pairs scales linearly with the pump power the number of accidentals scales quadratically with the pump power.
For the optimised collection of correlated pairs the pump was switched from 405 nm to 500 nm ECD . To accommodate the change in pump the SPAD’s were swapped for single-mode superconducting nanowires with a large quantum efficiency in the near-infrared. The reduction in fluorescence meant a larger angle of emission could be collected. For more efficient coupling to the detectors, the pump was focused into a 10 micron spot size.
Single-photon spectroscopy. To measure the SPDC spectrum, we introduced a m SMF28 fibre into the setup shown in Fig. 2 a, between the LN output and the MM fiber beam splitter. L1 was replaced with a lens that had a 20 mm focal distance to decrease the pump beam waist in an effort to lower the number of spatial modes and increase the coupling efficiency into the SMF28 fiber. Finally, a 645 nm long-pass filter was used for BP2. The dispersive temporal walk-off in the fibre led to a difference in photon arrival times corresponding to a specific frequency difference. To calibrate the arrival time differences, the radiation in one arm of the fiber beam splitter was sent through a nm broad interference filter centered at the calibration wavelength. The emission was recoupled into the m MM fibre after passing through the filter and the coincidences between the first and the second detector were measured as a function of the difference in photon arrival times. This was done for six interference filters and a calibration curve between time differences and frequency differences was fitted with a cubic polynomial (see Fig. 7 of the Supplementary material). As this type of measurement was based on collecting correlated photons, any frequency dependent loss on one photon was mirrored on its conjugate. This affected the spectral sensitivity of the detectors when operating as coincidence counters which, accounting for the mirrored quantum efficiency of the near-infrared to the visible region, is shown as the red curve in Fig. 3 d.
Stimulated emission tomography. A custom optical parametric amplifier (OPA) was built using a pair of bismuth triborate (BiBO) crystals (see Fig. 8 of the Supplementary material) with type-I phase matching. It was pumped by a frequency doubled Nd:YAG laser (532 nm) with a ps pulse width and 1 kHz repetition rate. The pump was used to amplify a tunable (1500-1620 nm) CW source. The output idler radiation of the OPA had the same pulse properties as the pump beam and was used to seed the SPDC in LN for the SET measurement. To compensate for any temporal walk-off between the pump and the seed, a delay line between the two beams was built. A PBS and HWP were added to both arms to control both the power and the polarization of the seed and the pump locally. The signal beam of the OPA was suppressed by the PBS in the pump arm and a frequency filter in the seed arm. The seed and pump beams were overlapped spatially and temporally (see Fig. 4 a) and focused into the LN sample using a mm lens (L1). The seed wavelength was scanned and the stimulated PDC radiation was registered with an Avantes visible-range spectrometer. The resulting spectra were plotted for each seed frequency probed to reconstruct the JSI.
The expected JSI, in frequency space, for collinear SPDC is
| (6) |
where is given by (2) with and, for a Gaussian pump,
| (7) |
is the central pump frequency and is the pump spectral width hendrych2007tunable .
The degree of entanglement. Due to the lack of phase information in our experiment we estimate the degree of entanglement using a measure introduced by Fedorov fedorov2004packet . It is defined as the ratio , where is the unconditional width of the JSI, i.e., the spectral width of the signal (idler) radiation, and is the corresponding conditional (correlation) width i.e. the spectral width of the idler (signal) radiation once its conjugate has been measured. The Fedorov ratio is a valid measure under certain conditions, in particular where the so-called double Gaussian approximation is valid. We estimate, by comparing simulated phase matched and non-phase matched JSI’s, that it deviates from the Schmidt number Mikhailova2008 ; Brida2009 by less than a factor of two for the non-phase matched regime. In Fig. 4 c, is the width of the JSI cross-section, THz. As to , it was measured to be THz but it is limited by the range probed in experiment. Therefore, we can confirm but in reality, the degree of entanglement should be at least an order of magnitude larger, according to Fig. 4 b.
Acknowledgements
We acknowledge the financial support by Deutsche Forschungsgemeinschaft (DFG) (CH-1591/3-1).
I.1 Additional Information
Author Contributions All authors conceived, contributed and discussed the final results published in this manuscript. A. C., T. S-C. and C.O. performed the experimental work and carried out the data analysis. M.C. initiated and supervised the project.
Data Availability The data that support the findings of this study are available from the corresponding author upon reasonable request.
Competing Interests The authors declare that there are no competing interests.
References
- (1) G. B. Lemos, V. Borish, G. D. Cole, S. Ramelow, R. Lapkiewicz, and A. Zeilinger, “Quantum imaging with undetected photons,” Nature, vol. 512, no. 7515, p. 409, 2014.
- (2) T. Pittman, Y. Shih, D. Strekalov, and A. Sergienko, “Optical imaging by means of two-photon quantum entanglement,” Physical Review A, vol. 52, no. 5, p. R3429, 1995.
- (3) G. Brida, M. Genovese, and I. R. Berchera, “Experimental realization of sub-shot-noise quantum imaging,” Nature Photonics, vol. 4, no. 4, p. 227, 2010.
- (4) Y. Adachi, T. Yamamoto, M. Koashi, and N. Imoto, “Simple and efficient quantum key distribution with parametric down-conversion,” Physical review letters, vol. 99, no. 18, p. 180503, 2007.
- (5) T. Jennewein, C. Simon, G. Weihs, H. Weinfurter, and A. Zeilinger, “Quantum cryptography with entangled photons,” Physical Review Letters, vol. 84, no. 20, p. 4729, 2000.
- (6) L.-A. Wu, H. Kimble, J. Hall, and H. Wu, “Generation of squeezed states by parametric down conversion,” Physical review letters, vol. 57, no. 20, p. 2520, 1986.
- (7) A. Valencia, G. Scarcelli, and Y. Shih, “Distant clock synchronization using entangled photon pairs,” Applied Physics Letters, vol. 85, no. 13, pp. 2655–2657, 2004.
- (8) Y. Shih and C. O. Alley, “New type of einstein-podolsky-rosen-bohm experiment using pairs of light quanta produced by optical parametric down conversion,” Physical Review Letters, vol. 61, no. 26, p. 2921, 1988.
- (9) H. D. Saleh, S. Vezzoli, L. Caspani, A. Branny, S. Kumar, B. D. Gerardot, and D. Faccio, “Towards spontaneous parametric down conversion from monolayer mos 2,” Scientific reports, vol. 8, no. 1, p. 3862, 2018.
- (10) M. Tokman, Z. Long, S. AlMutairi, Y. Wang, V. Vdovin, M. Belkin, and A. Belyanin, “Purcell enhancement of the parametric down-conversion in two-dimensional nonlinear materials,” APL Photonics, vol. 4, no. 3, p. 034403, 2018.
- (11) S. Yamashita, “Nonlinear optics in carbon nanotube, graphene, and related 2d materials,” APL Photonics, vol. 4, no. 3, p. 034301, 2018.
- (12) G. Marino, A. S. Solntsev, L. Xu, V. F. Gili, L. Carletti, A. N. Poddubny, M. Rahmani, D. A. Smirnova, H. Chen, G. Zhang, et al., “Spontaneous photon-pair generation at the nanoscale,” arXiv preprint arXiv:1903.06956, 2019.
- (13) R. W. Boyd, Nonlinear optics. Elsevier, 2003.
- (14) C. Yuan, W. Zhang, and Y. Huang, “Spatiotemporally separable biphoton state generated by spontaneous four wave mixing in ultrathin nonlinear films,” arXiv preprint arXiv:1903.10936, 2019.
- (15) A. V. Burlakov, M. V. Chekhova, D. N. Klyshko, S. P. Kulik, A. N. Penin, Y. H. Shih, and D. V. Strekalov, “Interference effects in spontaneous two-photon parametric scattering from two macroscopic regions,” Phys. Rev. A, vol. 56, pp. 3214–3225, Oct 1997.
- (16) C. H. Monken, P. H. S. Ribeiro, and S. Pádua, “Transfer of angular spectrum and image formation in spontaneous parametric down-conversion,” Phys. Rev. A, vol. 57, pp. 3123–3126, Apr 1998.
- (17) T. E. Keller and M. H. Rubin, “Theory of two-photon entanglement for spontaneous parametric down-conversion driven by a narrow pump pulse,” Phys. Rev. A, vol. 56, pp. 1534–1541, Aug 1997.
- (18) W. P. Grice and I. A. Walmsley, “Spectral information and distinguishability in type-ii down-conversion with a broadband pump,” Phys. Rev. A, vol. 56, pp. 1627–1634, Aug 1997.
- (19) M. V. Fedorov, M. A. Efremov, P. A. Volkov, E. V. Moreva, S. S. Straupe, and S. P. Kulik, “Anisotropically and high entanglement of biphoton states generated in spontaneous parametric down-conversion,” Phys. Rev. Lett., vol. 99, p. 063901, Aug 2007.
- (20) G. Brida, V. Caricato, M. V. Fedorov, M. Genovese, M. Gramegna, and S. P. Kulik, “Characterization of spectral entanglement of spontaneous parametric-down conversion biphotons in femtosecond pulsed regime ,” EPL, vol. 87, p. 64003, 2009.
- (21) O. A. Ivanova, T. S. Iskhakov, A. N. Penin, and M. V. Chekhova, “Multiphoton correlations in parametric down-conversion and their measurement in the pulsed regime,” Quantum Electronics, vol. 36, no. 10, p. 951, 2006.
- (22) A. Valencia, M. V. Chekhova, A. Trifonov, and Y. Shih, “Entangled two-photon wave packet in a dispersive medium,” Physical review letters, vol. 88, no. 18, p. 183601, 2002.
- (23) M. Avenhaus, A. Eckstein, P. J. Mosley, and C. Silberhorn, “Fiber-assisted single-photon spectrograph,” Optics letters, vol. 34, no. 18, pp. 2873–2875, 2009.
- (24) M. Liscidini and J. Sipe, “Stimulated emission tomography,” Physical review letters, vol. 111, no. 19, p. 193602, 2013.
- (25) M. B. Nasr, S. Carrasco, B. E. Saleh, A. V. Sergienko, M. C. Teich, J. P. Torres, L. Torner, D. S. Hum, and M. M. Fejer, “Ultrabroadband biphotons generated via chirped quasi-phase-matched optical parametric down-conversion,” Physical review letters, vol. 100, no. 18, p. 183601, 2008.
- (26) C. Bernhard, B. Bessire, T. Feurer, and A. Stefanov, “Shaping frequency-entangled qudits,” Physical Review A, vol. 88, no. 3, p. 032322, 2013.
- (27) K. Katamadze, N. Borshchevskaya, I. Dyakonov, A. Paterova, and S. Kulik, “Broadband biphotons in a single spatial mode,” Physical Review A, vol. 92, no. 2, p. 023812, 2015.
- (28) X. Guo, C.-l. Zou, C. Schuck, H. Jung, R. Cheng, and H. X. Tang, “Parametric down-conversion photon-pair source on a nanophotonic chip,” Light: Science & Applications, vol. 6, no. 5, p. e16249, 2017.
- (29) V. G. Dmitriev, G. G. Gurzadyan, and D. N. Nikogosyan, Handbook of nonlinear optical crystals, vol. 64. Springer, 2013.
- (30) S. Liu, P. P. Vabishchevich, A. Vaskin, J. L. Reno, G. A. Keeler, M. B. Sinclair, I. Staude, and I. Brener, “An all-dielectric metasurface as a broadband optical frequency mixer,” Nature Communications, 2018.
- (31) M. D’Angelo, A. Valencia, M. H. Rubin, and Y. Shih, “Resolution of quantum and classical ghost imaging,” Physical Review A, vol. 72, no. 1, p. 013810, 2005.
- (32) W. Denk, J. H. Strickler, and W. W. Webb, “Two-photon laser scanning fluorescence microscopy,” Science, vol. 248, no. 4951, pp. 73–76, 1990.
- (33) L. Olislager, J. Cussey, A. T. Nguyen, P. Emplit, S. Massar, J.-M. Merolla, and K. P. Huy, “Frequency-bin entangled photons,” Physical Review A, vol. 82, no. 1, p. 013804, 2010.
- (34) J. Rarity and P. Tapster, “Experimental violation of bell’s inequality based on phase and momentum,” Physical Review Letters, vol. 64, no. 21, p. 2495, 1990.
- (35) J. T. Barreiro, N. K. Langford, N. A. Peters, and P. G. Kwiat, “Generation of hyperentangled photon pairs,” Physical review letters, vol. 95, no. 26, p. 260501, 2005.
- (36) C. Okoth, A. Cavanna, N. Y. Joly, and M. V. Chekhova, “Seeded and unseeded high-order parametric down-conversion,” Physical Review A, vol. 99, no. 4, p. 043809, 2019.
- (37) R. Newman, “Visible light from a silicon p- n junction,” Physical review, vol. 100, no. 2, p. 700, 1955.
- (38) “Ecd-x documentation.” http://www.m2lasers.com/images/Datasheet_SolsTiS_ECD-X.pdf. Accessed: 2019-05-24.
- (39) M. Hendrych, M. Micuda, and J. Torres, “Tunable control of the frequency correlations of entangled photons,” Optics letters, vol. 32, no. 16, pp. 2339–2341, 2007.
- (40) M. Fedorov, M. Efremov, A. Kazakov, K. Chan, C. Law, and J. Eberly, “Packet narrowing and quantum entanglement in photoionization and photodissociation,” Physical Review A, vol. 69, no. 5, p. 052117, 2004.
- (41) Y. M. Mikhailova, P. A. Volkov, and M. V. Fedorov, “Biphoton wave packets in parametric down-conversion: Spectral and temporal structure and degree of entanglement,” Physical Review A, vol. 78, p. 062327, 2008.
II Supplementary information