Mg ii 2797, 2803 emission in a large sample of low-metallicity star-forming galaxies from SDSS DR14
A large sample of Mg ii emitting star-forming galaxies with low metallicity [O/H] = log(O/H) – log(O/H)⊙ between –0.2 and –1.2 dex is constructed from Data Release 14 of the Sloan Digital Sky Survey. We selected 4189 galaxies with Mg ii 2797, 2803 emission lines in the redshift range 0.3 – 1.0 or 35% of the total Sloan Digital Sky Survey star-forming sample with redshift 0.3. We study the dependence of the magnesium-to-oxygen and magnesium-to-neon abundance ratios on metallicity. Extrapolating this dependence to [Mg/Ne] = 0 and to solar metallicity we derive a magnesium depletion of [Mg/Ne] –0.4 (at solar metallicity). We prefer neon instead of oxygen to evaluate the magnesium depletion in the interstellar medium because neon is a noble gas and is not incorporated into dust, contrary to oxygen. Thus, we find that more massive and more metal abundant galaxies have higher magnesium depletion. The global parameters of our sample, such as the mass of the stellar population and star formation rate, are compared with previously obtained results from the literature. These results confirm that Mg ii emission has a nebular origin. Our data for interstellar magnesium-to-oxygen abundance ratios relative to the solar value are in good agreement with similar measurements made for Galactic stars, for giant stars in the Milky Way satellite dwarf galaxies, and with low-metallicity damped Lyman-alpha systems.
Key Words.:
galaxies: abundances — galaxies: irregular — galaxies: evolution — galaxies: formation — galaxies: ISM — H ii regions — ISM: abundances
1 Introduction
Magnesium is one of the most abundant elements of stellar nucleosynthesis produced in massive stars and the ninth most abundant element in the Universe; it is widely used in studies of damped Lyman- absorber (DLA) systems, the local interstellar medium (LISM), the Galactic halo and disk stars, stars in the Milky Way satellite dwarf galaxies, and in star-forming galaxies. It is a moderately refractory element with a condensation temperature of 1340K (Savage & Sembach 1996). Magnesium is thus an important constituent of dust grains. There are several motivations for this study of Mg ii in star-forming galaxies. Although many studies of the Mg ii resonant doublet in emission and/or absorption have been carried out in recent years (Chen et al. 2000; Bonifacio et al. 2004; Monaco et al. 2005; Sbordone et al. 2007; Lai et al. 2008; Bensby et al. 2014; Roederer et al. 2014; Cooke et al. 2015; Cia et al. 2016; Finley et al. 2017; Henry et al. 2018; Feltre et al. 2018; Hill et al. 2018), physical mechanisms explaining the collected data are not completely clear, specifically for galaxies. Among others factors, the resonant scattering of nebular continuum photons in outflows or resonant scattering in low ionisation or neutral gas have to be considered. An accurate Mg abundance determination in the interstellar medium and its comparison to stellar magnesium abundances and to model yield predictions allow us to estimate the quantity of magnesium as a refractory element incorporated into interstellar dust grains.
Large surveys of galaxies such as the Sloan Digital Sky Survey (SDSS) offer a good opportunity to substantially expand the statistics of previous studies. It is also interesting to extend the redshift range, the range of stellar population masses, metallicities, star formation rates (SFRs), specific star formation rates (sSFRs), and types of galaxies with Mg ii in emission and/or absorption. A statistical increase of databases of star-forming galaxies with Mg ii emission is necessary, similar to investigations performed recently for Galactic stars where sample sizes have grown from hundreds of stars to several hundred thousand stars with magnesium detections (e.g. the second data release of the GALAH survey containing more than 300 thousand stars, Buder et al. 2018a, b).
This study is a continuation of our earlier study of 45 Mg ii emission low-metallicity star-forming galaxies with Mg ii 2797, 2803 emission performed on the base of SDSS/DR7 (Guseva et al. 2013). Now we consider many more Mg ii emitting galaxies selected from the SDSS/Baryon Oscillation Spectroscopic Survey (BOSS) DR14 containing significantly more distant galaxies.
2 Sample selection
A large sample of 30000 star-forming galaxies selected from the spectroscopic database of the SDSS/BOSS DR14 (Abolfathi et al. 2018) was used to construct the Mgii sample. A detailed description of the selection criteria for the extraction of galaxies with active star formation is presented in Izotov et al. (2014a). Strong emission lines of H and [O iii] 4959,5007, EW(H) 10 Å characterise the spectra of all selected galaxies. Galaxies with evidence of AGN features were excluded from the sample. SDSS/BOSS data releases contain many more galaxies at higher redshifts compared with earlier data releases. Moreover, a wider range of the SDSS/BOSS DR14 spectra with the blue edge at 3600Å also allows us to select galaxies with lower redshifts compared to our earlier study (Guseva et al. 2013). The redshift of 0.3 permits us to detect the Mg ii 2797, 2803 emission doublet in the spectrum. Thus, out of 30000 low-metallicity star-forming galaxies, more than 4100 Mg ii emitters were extracted, increasing the sample size by about two orders of magnitude compared to the study by Guseva et al. (2013). The redshift distribution of the Mgii sample corresponds to the range of 0.3 – 1.05 (see Fig. 2).
The line fluxes and the errors of the fluxes were derived using the IRAF111IRAF is the Image Reduction and Analysis Facility distributed by the National Optical Astronomy Observatory, which is operated by the Association of Universities for Research in Astronomy (AURA) under cooperative agreement with the National Science Foundation (NSF). SPLOT routine. The line fluxes were corrected simultaneously for both reddening and underlying hydrogen stellar absorption in the iterative procedure described by Izotov et al. (1994). The reddening effect was taken into account adopting the extinction curve of Cardelli et al. (1989) in two steps: (1) line fluxes at observed wavelengths were first corrected for the extinction in the Galaxy and (2) the internal extinction of each of our targets was derived in the rest-frame spectrum from the Balmer hydrogen decrement with the average value of C(H)=AV/2.18 near 0.2–0.3, which is typical for the type of galaxies considered here. The Mg ii 2797, 2803 emission line fluxes were also corrected for the underlying stellar absorption following Bruzual & Charlot (2003) (see details in Guseva et al. 2013).
The SDSS spectra were fitted to determine stellar masses as integrated characteristics of our sample galaxies. Luminosity distances for the determination of stellar masses, H luminosities and star formation rates were obtained using a cosmological calculator (NED, Wright 2006), based on the cosmological parameters =67.1 km s-1Mpc-1, =0.682, =0.318 (Planck Collaboration 2014).
3 Element abundances
To determine heavy element abundances in low-metallicity galaxies by the direct method, we generally follow the prescriptions of Izotov et al. (1994, 1997, 2006). The direct method for (O iii) determination is generally used if measurable [O iii] 4363 emission is present. Then (O iii) is derived from the line ratio [O iii] 4363/(4959+5007). In the case when [O iii] 4363 is not detected we estimate (O iii) by the semi-empirical method by Izotov & Thuan (2007) using strong oxygen emission lines. For (O ii) the relation between (O iii) and (O ii) from photoionisation models of H ii regions is adopted (see e.g. Izotov et al. 2006; Stasińska & Izotov 2003), for the direct and for the semi-empirical method. For ionic and total oxygen and neon abundance determinations we follow the Izotov et al. (2006) prescription. Guseva et al. (2013) calculated the relation between (Mg ii) and (O ii) using the CLOUDY photoionisation H ii region models. The fit to this relation gives (Mg ii) (see equation 2 in their paper), whereas Mg+ and total Mg abundances were obtained from their equations 3, 4, and 5. The heavy element abundances were derived using the direct method in more than 35% of our sample. The solar magnesium and oxygen abundances of Asplund et al. (2009) were adopted as a reference following the recommendations of Lodders et al. (2009) on whether to choose photospheric abundances, meteoritic abundances, or an average of the two values.

4 Results
Depletion onto dust of some refractory elements can be studied using correlations between ratios of refractory or possibly refractory to non-refractory elements, and metallicity or some indicator of metallicity. The higher depletion of a refractory element is manifested in the steepening of the slope of the relation between relative abundances and metallicity, for example, in a decrease of Mg/O with increasing metallicity, indicating that at higher metallicity a larger fraction of magnesium is incorporated into dust.
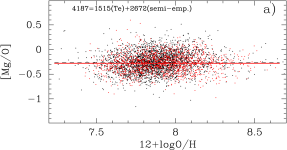
To find the dependence of magnesium depletion on metallicity, we plot a magnesium-to-oxygen abundance ratio Mg/O relative to solar value [Mg/O] = log(Mg/O) – log(Mg/O)⊙ vs. 12 + log(O/H) (see Fig. 1a). The average value of [Mg/O] calculated for all data regardless of the methods used for temperatures (O iii) and (O ii), and oxygen abundance determination is –0.26. We note that for the direct method and for the semi-empirical method the average values of [Mg/O] are very similar, –0.28 and –0.26, respectively. There is no appreciable trend in Fig. 1a, which means that there is no dependence of magnesium depletion (relative to that of oxygen) on metallicity, at least not in the metallicity range of 12 + logO/H 7.3 – 8.6 (–1.4 [O/H] –0.1). This may indicate that similar fractions of Mg and O are locked in dust.
A small fraction of oxygen is, among other candidate constituents, part of the interstellar dust. Thus, Esteban et al. (1998), assuming a certain composition for the dust grains containing oxygen and the three most depleted elements (Mg, Si, and Fe) evaluated the fraction of oxygen embedded in dust grains. They proposed a correction factor equal to 1.2 (or 0.08 dex for log O/H) for the oxygen abundance derived from nebular spectra, taking into account the oxygen depletion onto grains. According to Esteban et al. (1998) the gas-phase fraction of oxygen is near 80%, at least for the Orion nebula. The oxygen depletion factor at solar metallicity of –0.22 is used in the models of Dopita et al. (2005) and in the paper of Kewley & Dopita (2002). Later Dopita et al. (2013) proposed an updated version of Dopita et al. (2005) and adopted an oxygen depletion factor of –0.07 dex. Peimbert & Peimbert (2010) and Mesa-Delgado et al. (2009) accepted a depletion factor approximately –0.1 dex. Simón-Díaz & Stasińska (2010) assumed a depletion factor –0.15 dex for the Orion star-forming regions. More recently Cirpiano et al. (2017), following Bresolin et al. (2016), recommended to use –0.1 dex for the correction of measured gas phase oxygen abundances due to its depletion onto dust grains. Izotov et al. (2006) derived an increase of the Ne/O abundance ratio by 0.1 dex in the 12 + log O/H range of 7.1 and 8.6. They interpreted this dependence suggesting zero depletion of oxygen at the lowest metallicity and 0.1 dex depletion at solar metallicity. Although the precise values for the amount of oxygen locked up in dust have not been clearly established, a fraction of 10 – 20% of oxygen can be incorporated in interstellar dust grains.
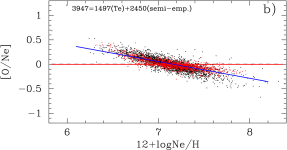
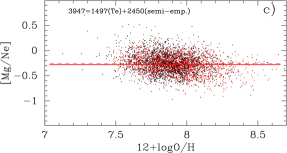
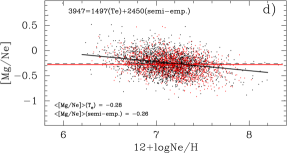
A hint supporting this is the slight slope of the dependence of the neon-to-oxygen ratio on metallicity in Fig.12 by Guseva et al. (2011). The figure was obtained using a large precise database collected from a sample for the primordial He abundance determination (HeBCD sample, Izotov & Thuan 2004; Izotov et al. 2004) and based on data from the SDSS DR3 (Izotov et al. 2006). The same effect is seen in Fig. 1b (this paper) for our large Mg ii sample selected from SDSS DR14. Because neon is a noble gas this trend might be explained assuming that some amount of oxygen is likely coupled to dust, which led us to use neon instead of oxygen in our study of magnesium dust depletion. In agreement with the chemical evolution model predictions for Mg and Ne by Prantzos et al. (2018) (their Fig. 13) for both rotating and non-rotating massive star yields, we assume here that the intrinsic [Mg/Ne] value is a constant at least in the range of –1.5 [O/H] 0.0. In Fig. 1 we show the correlation between [Mg/Ne] and the metallicity expressed either in 12 + log(O/H) (Fig. 1c) or in 12 + log(Ne/H) (Fig. 1d). Some small trends are present in these plots with almost the same average levels of depletion. The linear regression to all data (black solid line in Fig. 1d) is as follows:
| (1) |
Thus, [Mg/Ne] = 0.0 at [Ne/H] –2.4, whereas [Mg/Ne] = –0.388 at solar metallicity ([Ne/H] = 0.0).
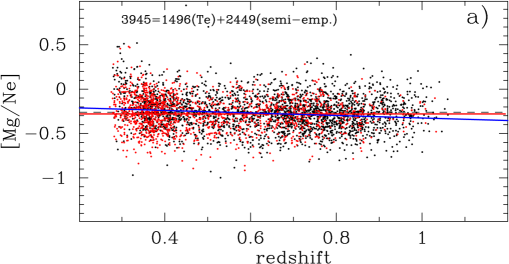
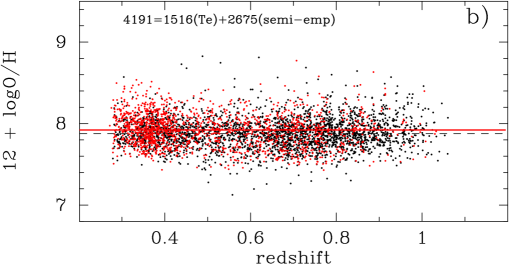
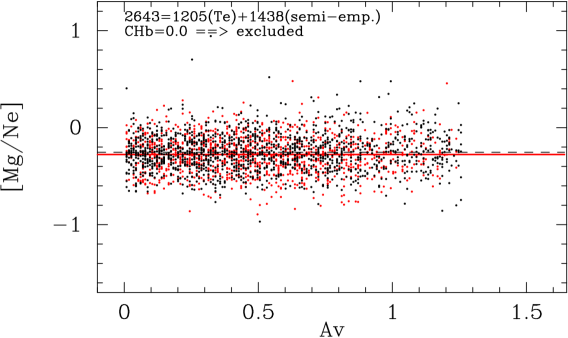
In Fig. 2a the relation between [Mg/Ne] and redshift is plotted. We do not find any obvious trend of [Mg/Ne] with redshift. Metallicity is also uniformly distributed with redshift (Fig. 2b). This means that for our sample we do not expect evolutionary effects in the range between 0.3 and 1. The total extinction AV in band derived from the extinction coefficient C(H) varies from 0.0 to more than 1.0, but [Mg/Ne] remains unchanged at any AV (Fig. 3).
4.1 Dependence of [Mg/Ne] on stellar mass
Because the [Mg/Ne] ratio exhibits a small trend with metallicity (section 3, Figs. 1c and d) we may expect a similar trend of the [Mg/Ne] ratio with galaxy stellar masses: the stellar masses of galaxies correlate with metallicities through a well-known mass–metallicity relation (see e.g. Tremonti et al. 2004; Lee et al. 2006; Maiolino et al. 2008; Manucci et al. 2010; Amorín et al. 2010; Zahid et al. 2011, 2012, 2013; Steidel et al. 2014; Maier et al. 2014; Izotov et al. 2015; Guseva et al. 2017), in the sense that the more massive galaxies are more metal abundant. The presence of such a trend is well established even though different types of galaxies and adopted methods give different slopes in the relation.
Stellar masses were derived following detailed prescription by Guseva et al. (2006, 2007) and Izotov et al. (2011b). Briefly, adjusting the modelled spectral energy distributions (SEDs) to the observed spectra we were able to derive stellar masses after subtraction of nebular continuum and nebular emission lines from the observed spectra in the entire wavelength range 3600-10300Å of the SDSS DR14 spectra. We calculated a series of model SEDs and chose the best fit from minimisation of the deviation between the observed and the modelled continuum. Star formation history was modelled by a short burst of star-forming galaxies with age less than 10 Myr, which represents the young stellar population in addition to continuous star formation responsible for older stars with ages and ( ) randomly varied in the range between 10 Myr and 15 Gyr. The derived age of the oldest stars is 10 Gyr in most of galaxies.
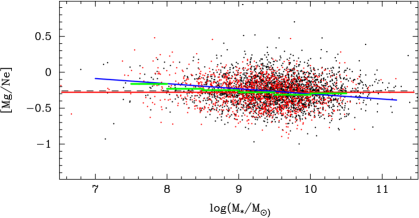
The relation between [Mg/Ne] and stellar mass is shown in Fig. 4. The linear regression to all Mg ii galaxies is shown by a solid blue line and average values in bins of stellar masses by solid green lines. A slight slope is seen, meaning that more massive galaxies have higher magnesium depletion. In particular, [Mg/Ne] –0.15 for low-mass galaxies with 3 107 and –0.35 for high-mass galaxies with 3 1010. A similar behaviour is seen for the magnesium depletion, which increases with metallicity (Fig. 1c and d).
4.2 Dependence of [Mg/Ne] on O32
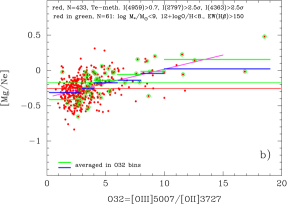
O32=[O iii]5007/[O ii]3727 is an important parameter to search for galaxies with Lyman continuum (LyC) escaping radiation. The parameter O32 is usually used for the selection of galaxy candidates able to ionise the intergalactic medium, which is interesting in connection with the problem of the reionisation of the Universe at redshifts 5–10. The dependence of [Mg/Ne] on O32 is shown in Fig. 5. There is very large scatter of [Mg/Ne] for Mg ii galaxies with O32 0 – 3 (Fig. 5a). Nevertheless, in galaxies with O32 below 3 – 4 [Mg/Ne] is constant, but at higher O32 [Mg/Ne] increases with increasing O32. Linear regression to all the galaxies (purple line) and average values in bins of O32 (blue lines) demonstrate an increase in [Mg/Ne] with increasing O32, which depends on the ionisation parameter. Moreover, the galaxies with O32 5 are above the average value of [Mg/Ne] (long solid red and dashed black lines). We note that almost all galaxies with O32 5 have low masses (log(/) 9.0), low metallicities (12 + logO/H 8) and high EW(H) 150Å (dots inside green circles). In Fig. 5b we only show galaxies with abundances derived by the direct method and accuracies better than 40% (more than 2.5) for the weak but important Mg ii 2797Å and [O iii]4363Å emission lines. Galaxies with flux ratios [O iii]4959/(H) less than 0.7 were also excluded to ensure that we use only high-excitation galaxies whose [O iii]4363Å emission lines are reliably detected. The trend of increasing [Mg/Ne] with increasing O32 becomes even more evident (purple line in Fig. 5b).
Such a strong trend in Fig. 5 cannot be explained by metallicity effects because there is no dependence on metallicity in the models of Prantzos et al. (2018) (see also Fig. 6 in this paper), especially in the range of [O/H] from 0.0 to –1.5 dex occupied by our Mg ii sample. It is also found in the present paper that the dependence of [Mg/Ne] on metallicity is not too strong (see Fig. 1d). Let us consider possible reasons for this effect: 1) density bounded models are often adopted to explain the large O32 in star-forming galaxies (Jaskot & Oey 2013; Nakajima et al. 2016; Izotov et al. 2017). We can also take into account that the Mg ionisation potential of 7.65 eV is much lower than that for Ne (21.56 eV), but if this is the case [Mg/Ne] must be even lower for high O32 galaxies; 2) efficient warming-up and possible destruction of interstellar dust grains by the intense ionising UV radiation of young stars, which is characterised by high EW(H) (Izotov et al. 2011a, 2014a, 2014b), because the number of massive O stars reaches 102–104 in super star clusters (Schaerer et al. 2000). Then Mg as a refractory element could not be locked in the dust and depletion of the magnesium would be near zero; and 3) uncertainties in the ionisation correction factor (Mg+) at high O32 corresponding to O2+/O 0.9 (see for details Guseva et al. 2013).
4.3 Comparison with data from the literature
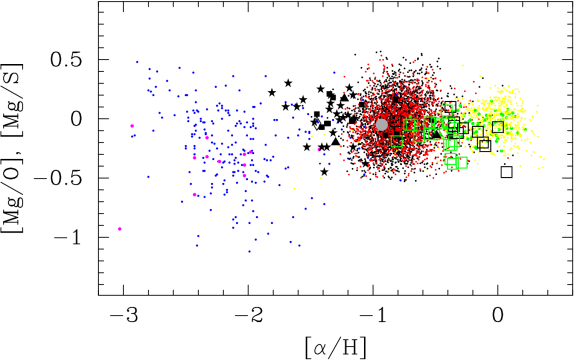
[Mg/O] vs. metallicity [/H]. In Fig. 6 the relation between [Mg/O] and [O/H] is given for our data and other data collected from the literature in a wide range of metallicity. Only elements (Mg, O, and S) are used for the sake of a direct comparison of different data. Roederer et al. (2014) (blue dots) obtained element abundances for more than 300 very metal-poor Galactic halo stars down to [O/H] –3.0 dex. We selected 240 stars with precise measurements of magnesium and oxygen abundances. Out of 28 very low-metallicity stars from Lai et al. (2008), 15 stars in a metallicity range [O/H] from –2 to –3 dex are shown in purple and 78 Galactic disk stars out of 90 from Chen et al. (2000) with –0.7 [O/H] +0.2 dex are plotted in green. Bensby et al. (2014) studied a large sample of 714 Galactic disk and thin disk stars with nearly solar [O/H] (yellow dots). Giant stars in the Milky Way satellite dwarf galaxies by Bonifacio et al. (2004); Sbordone et al. (2007) are shown by large black and green open squares, respectively. Red giant branch stars in the centre of the Sculptor dwarf galaxy by Hill et al. (2018) are shown by black filled stars.
Abundances of Mg, S, and O are given for DLAs in the paper of Cia et al. (2016), Wiseman (2017), and averaged over many DLAs in Guseva et al. (2013). These data represent the relative abundances obtained for the interstellar medium (filled black squares and triangles, and large filled grey circle, respectively). To correct our Mg sample for dust depletion, the [Mg/O] for each galaxy was shifted by +0.28 or +0.26 depending on whether the or the semi-empirical method was used (Fig. 1a). The [Mg/O] values reported here are in good agreement with similar measurements made in stars and DLAs. There is no appreciable trend of the [Mg/O] ratio with metallicity for all of the data presented in Fig. 6.
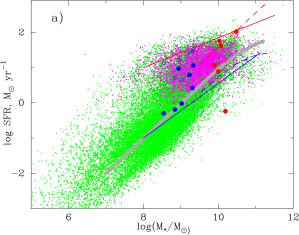
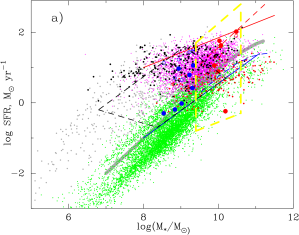
SFR vs. M⋆. The star formation rate is one of the regularly used parameters of star-forming activity of a galaxy, and is derived from the H luminosity (H) following Kennicutt (1998). The behaviour of star-forming galaxies in the SFR versus stellar mass diagram (the so-called main sequence) in terms of evolution of the relation with increasing redshift has been actively investigated in recent years by many authors (see e.g. Bouché et al. 2014; Karim et al. 2011; Whitaker et al. 2012, 2014; Schreiber et al. 2015; Mitra et al. 2017). One of the conclusions from these studies is that the main sequence is almost linear and does not demonstrate a significant evolution with redshift from lowest masses up to 109.5 . In Fig. 7 we show the position of our Mg ii sample (purple dots) and entire SDSS DR14 sample of low-metallicity star-forming galaxies (30000, green dots) on the log SFR – log(/) diagram and compare it with the corresponding distributions obtained by others authors.
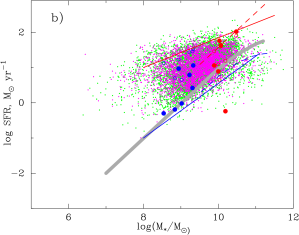
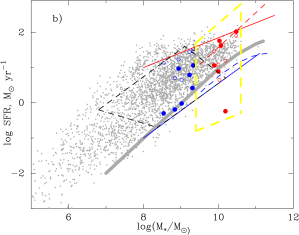
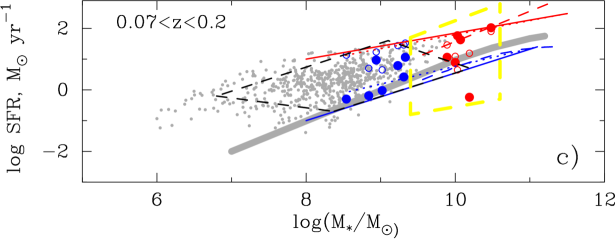
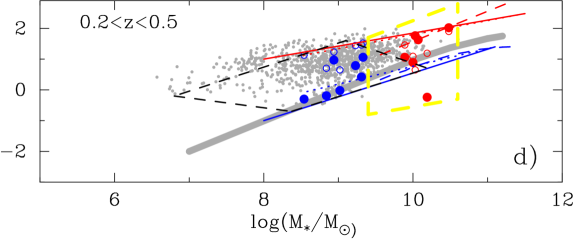
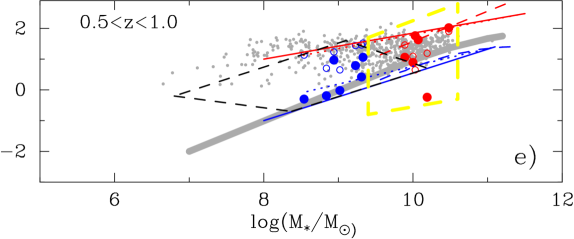
About three hundred Mg ii and Fe ii∗ emitting galaxies, which were identified by Finley et al. (2017) with the VLT/MUSE in the Ultra Deep Field South (Bacon et al. 2015), are located along the galaxy main sequence, but their distribution shows a dichotomy such that the galaxies with masses log(/) 9.0 are Mg ii emitters, whereas galaxies with masses higher than 1010 exhibit solely Fe ii∗ emission without accompanying Mg ii emission. Mg ii and Fe ii∗ emitters from the Finley et al. (2017) UDF-10 field are shown in Fig. 7. In particular, Mg ii emitting galaxies are denoted by blue filled circles (SFR values obtained from SED fitting) and by blue open circles (SFR values obtained from the luminosity of the [O ii] lines). Fe ii∗ emitters are represented by the same symbols, but in red. In general our entire SDSS DR14 star-forming sample, which also includes our Mg ii sample (Fig. 7a), is stretched along the galaxy star formation main sequence from Finley et al. (2017), but the bulk of our Mg ii emitters at a fixed mass is shifted to higher SFRs (higher H luminosities) or at a fixed SFR to lower masses compared to the main sequence. Only galaxies from our entire SDSS DR14 sample with redshift 0.3 are presented in Fig. 7b. The redshift restriction is used because of the SDSS DR14 blue wavelength limit of 3600Å. In the absence of this limit we could likely detect Mg ii emitting galaxies located above the main sequence and extended to lower masses. Both Mg ii and Fe ii∗ emitting samples from Finley et al. (2017) are located within our magnesium sample.
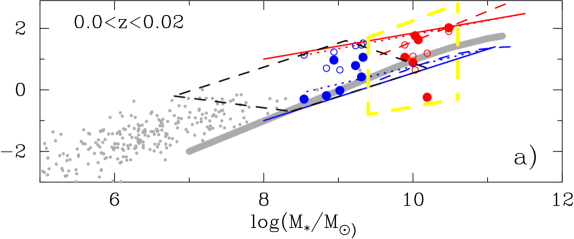
In Fig. 8 there is a clear shift between our Mg ii emitters with high EW(H) (small black dots) and those with low EW(H) (small red dots). A similar shift between galaxies with high and low EW(H) is seen for the SDSS DR14 sample (grey and green dots). The latter galaxies extend to lower SFRs and lower stellar masses. The magnesium resonant doublet in emission and absorption was investigated by Feltre et al. (2018) using data from the MUSE Ultra Deep Field Survey (Bacon et al. 2017). Exploiting photoionisation models by Gutkin et al. (2016) and their own sample of almost 400 star-forming galaxies [0.7 2.3], Feltre et al. (2018) found that Mg ii emission has a nebular origin. This conclusion verifies our earlier finding (Guseva et al. 2013) obtained using the CLOUDY code by Ferland et al. (1998). Feltre et al. (2018) also derived that Mg ii emitters have lower stellar masses than Mg ii absorbers.
The Mg ii emitting galaxies in both studies (large blue filled and open circles, Finley et al. 2017) and (quadrilateral delineated by black dashed lines, Feltre et al. 2018) are located in the region preferably occupied by our Mg ii emitters with high EW(H) (black dots), whereas Mg ii absorbers of Feltre et al. (2018) (quadrilateral delineated by thick yellow dashed lines) as well as Fe ii∗ emitting galaxies of Finley et al. (2017) (large red filled and open circles) are located in the region where our Mg ii emitters with low EW(H) are preferably located (red dots).
We note that our entire Mg ii sample shows a spread in stellar masses from 106.5 to 1011.5 . The higher redshift [0.70 2.34] Mg ii emitters of Feltre et al. (2018) have, on average, lower masses and lower SFRs compared to our Mg ii sample and to the Mg ii emitters from Finley et al. (2017), and extend to low masses of 107 and to low SFRs of 0.2–0.3 yr-1. It is interesting that they are mainly located in the region of high EW(H) (black and grey dots). The emission of nebular magnesium is quite expected in galaxies with young age of a recent strong burst of star formation activity, which have the lowest masses. Once the magnesium in the star-forming galaxies has a nebular origin, the Mg ii emitters could be observed in the galaxies with high EW(H), i.e. at an early stage of the bursty star formation. In principle, Mg ii emitters are expected even at the lowest masses and lowest SFRs (region along the sequence of grey dots). However, they are too faint and have redshifts that are too low to be detected. Mg ii emitters from Feltre et al. (2018) with higher redshift have the same shift from the star-forming main sequence and the same slope as star-forming galaxies with EW(H) 100Å from this paper.
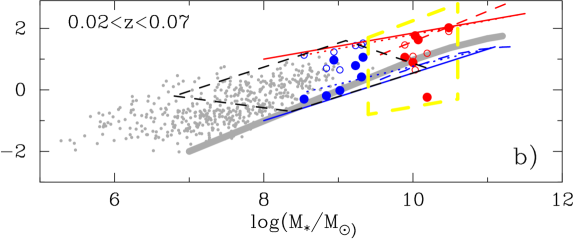
Effects of the observational selection result in a smaller slope of the galaxy star formation main sequence at the high-mass end because at higher redshifts low-mass galaxies become too faint. The observed data and extrapolations to lower masses for star-forming galaxies from Whitaker et al. (2012) for their two limiting cases of =0.0 (solid blue line) and =2.5 (solid red line) match quite well our high EW(H) sequence (grey and black dots in Fig. 8a). In Fig. 9 the sequence of SFR vs. with progressively increasing redshifts for SDSS DR14 star-forming galaxies with EW(H) 100Å is shown. In any redshift bin excluding the lowest redshift bin there is a deficiency of galaxies with lowest masses. Moreover, this effect is greater at greater redshifts. The left side envelope in each bin shows the same shift from the main sequence. Thus, we can conclude that the star-forming galaxy main sequence is universal with the same slope at any redshift (see Fig.10 in Izotov et al. 2015) if the effect of observational selection is correctly taken into account.
5 Summary
We present the determination of the interstellar magnesium abundance as derived from the resonance emission-line doublet Mg ii 2797, 2803 in 4189 SDSS spectra of low-metallicity emission-line star-forming galaxies with redshifts 0.3 – 1.05. This emission is detected in 35% of the entire sample of low-metallicity star-forming galaxies with redshifts 0.3 selected from SDSS DR14 (Abolfathi et al. 2018).
We study the dependence of the magnesium-to-oxygen and magnesium-to-neon abundance ratios on metallicity. We use the magnesium-to-neon ratio relative to the solar value [Mg/Ne] instead of [Mg/O] in evaluation of magnesium depletion in the interstellar medium because neon is a noble gas and does not incorporate into dust. The dependence of [O/Ne] on metallicity is explained by the coupling of a small amount of oxygen into dust grains. We derive magnesium depletion of [Mg/Ne] –0.4 at solar metallicity.
The global parameters of the magnesium sample such as the mass of the stellar population, star formation rate, and extinction coefficient C(H) are derived and compared with investigations of other authors. More massive and more metal abundant galaxies are found to have higher magnesium depletion. Our data for interstellar magnesium-to-oxygen abundance ratios relative to the solar value are in good agreement with similar measurements made for Galactic stars, for giant stars in the Milky Way satellite dwarf galaxies, and with low-metallicity DLAs.
Finley et al. (2017); Feltre et al. (2018) reported that the galaxies with Mg ii both in emission or in absorption are located along the star-forming galaxy main sequence but their distribution shows a dichotomy with the dependence of SFR on stellar mass of the galaxies. We show that the Mg ii emitting galaxies from Finley et al. (2017) and Feltre et al. (2018) in the SFR – relation are located in the region occupied by our Mg ii emitters with high EW(H), whereas Mg ii absorbers of Feltre et al. (2018) and Fe ii∗ emitters from Finley et al. (2017) are located in the region where our Mg emitters with low EW(H) are preferably located. This also confirms that Mg ii emission has a nebular origin. In this case the presence of emission or absorption is determined mainly by the mass of the old stellar population and by the age of the present burst of star formation.
Acknowledgements.
N.G.G. and Y.I.I. thank the Max-Planck Institute for Radioastronomy, Bonn, Germany, for the hospitality. They acknowledge support from the National Academy of Sciences of Ukraine (Project No. 0116U003191). This research has made use of the NASA/IPAC Extragalactic Database (NED), which is operated by the Jet Propulsion Laboratory, California Institute of Technology, under contract with the National Aeronautics and Space Administration. Funding for the Sloan Digital Sky Survey (SDSS) has been provided by the Alfred P. Sloan Foundation, the Participating Institutions, the National Science Foundation, the U.S. Department of Energy, the National Aeronautics and Space Administration, the Japanese Monbukagakusho, the Max Planck Society, and the Higher Education Funding Council for England.References
- Abolfathi et al. (2018) Abolfathi, B., Aguado, D. S., Aguilar, G. et al., 2018, ApJS, 235, 42
- Amorín et al. (2010) Amorín, R. O., Pérez-Montero, E., Vílchez, J. M., 2010, ApJ, 715, L128
- Asplund et al. (2009) Asplund, M., Grevesse, N., Sauval, A. J., & Scott, P., 2009, ARAA, 47, 481
- Bacon et al. (2015) Bacon, R., Brinchmann, J., Richard, J., et al., 2015, A&A, 575, A75
- Bacon et al. (2017) Bacon, R., Simon Conseil, S., Mary, D., et al., 2017, A&A, 608, A1
- Bensby et al. (2014) Bensby, T., Feltzing, S., & Oey, M. S., 2014, A&A, 562, A71
- Bonifacio et al. (2004) Bonifacio, P., Sbordone, L., Marconi, G., et al., 2004, A&A, 414, 503
- Bouché et al. (2014) Bouché, N., Dekel, A., Genzel, R., et al., 2010, ApJ, 718, 1001
- Bresolin et al. (2016) Bresolin, F., Rudritzki, R.-P., Urbaneja, M. A., et al., 2016, ApJ, 830, 64
- Bruzual & Charlot (2003) Bruzual, G., & Charlot, S., 2003, MNRAS, 344, 1000
- Buder et al. (2018a) Buder, S., Asplund, M., Duong, L., et al., 2018a, MNRAS, 478, 4513B
- Buder et al. (2018b) Buder, S., Lind, K., Ness, M. K., et al., 2018b, A&A, preprint ArXiv: 1804.05869v1
- Cardelli et al. (1989) Cardelli, J. A., Clayton, G. C., & Mathis, J. S., 1989, ApJ, 345, 245
- Chen et al. (2000) Chen, Y. Q., Nissen, P. E., Zhao, G, et al., 2000, A&AS, 141, 491
- Cia et al. (2016) Cia, A. De, Ledoux, C., Mattsson, L., et al., 2016 A&A, 596, 97
- Cirpiano et al. (2017) Cirpiano, L. T. S., Domínguez-Guzmán, G., Esteban, C., et al., 2017, MNRAS, 467, 3759
- Cooke et al. (2015) Cooke R. J., Pettini M., & Jorgenson R. A., 2015, ApJ, 800, 12
- Dopita et al. (2005) Dopita, M. A., Groves, B. A., Fischera, J., et al., 2005, ApJ, 619, 755
- Dopita et al. (2013) Dopita, M. A., Sutherland, R. S., Nicholls, D. C., et al., 2013, ApJS, 208, 10
- Esteban et al. (1998) Esteban, C., Peimbert, M., Torres-Peimbert, S., & Escalante, V., 1998, MNRAS, 295, 401
- Feltre et al. (2018) Feltre, A., Bacon, R., Finley, H., et al., 2018 A&A, 617, A62
- Ferland et al. (1998) Ferland, G. J., Korista, K. T., Verner, D. A., et al., 1998, PASP, 110, 761
- Finley et al. (2017) Finley, H., Bouché, N., Contini, T., et al., 2017 A&A, 608, A7
- Guseva et al. (2006) Guseva, N. G., Izotov, Y. I., & Thuan, T. X., 2006, ApJ, 644, 890
- Guseva et al. (2007) Guseva, N. G., Izotov, Y. I., Papaderos, P. & Fricke, K. J., 2007, A&A, 464, 885
- Guseva et al. (2011) Guseva, N. G., Izotov, Y. I., Stasińska, G., Fricke, K. J., Henkel, C., & Papaderos, P., 2011, A&A, 529, 149
- Guseva et al. (2013) Guseva, N. G., Izotov, Y. I., Fricke, K. J., & Henkel, C., 2013, A&A, 555, A90
- Guseva et al. (2017) Guseva, N. G., Izotov, Y. I., Fricke, K. J., & Henkel, C., 2017, A&A, 599, A65
- Gutkin et al. (2016) Gutkin, J., Charlot, S. & Bruzual, G., 2016, MNRAS, 462, 1757
- Henry et al. (2018) Henry, A., Berg, D. A., Csarlata, C. et al., 2018 ApJ, 855, 96
- Hill et al. (2018) Hill, V., Skúladóttir, Á., Tolstoy, E., et al., 2018, A&A, preprint arXiv:1812.01486v1
- Izotov et al. (1994) Izotov, Y. I., Thuan, T. X., & Lipovetsky, V. A., 1994, ApJ, 435, 647
- Izotov et al. (1997) Izotov, Y. I., Thuan, T. X., & Lipovetsky, V. A., 1997, ApJS, 108, 1
- Izotov & Thuan (2004) Izotov, Y. I., & Thuan, T. X., 2004, ApJ, 602, 200
- Izotov & Thuan (2007) Izotov, Y. I., & Thuan, T. X., 2007, ApJ, 665, 1115
- Izotov et al. (2004) Izotov, Y. I., Stasińska, G., Guseva, N. G., & Thuan, T. X., 2004, A&A, 415, 87
- Izotov et al. (2006) Izotov, Y. I., Stasińska, G., Meynet, G., Guseva, N. G., & Thuan, T. X., 2006, A&A, 448, 955
- Izotov et al. (2011a) Izotov, Y. I., Guseva, N. G., Fricke, K. J., & Henkel, C., 2011a, A&A, 536, L7
- Izotov et al. (2011b) Izotov, Y. I., Guseva, N. G., & Thuan, T. X., 2011b, ApJ, 728, 161
- Izotov et al. (2014a) Izotov, Y. I., Guseva, N. G., Fricke, K. J., & Henkel, C., 2014a, A&A, 561, A33
- Izotov et al. (2014b) Izotov, Y. I., Guseva, N. G., Fricke, K. J., Krügel, E. & Henkel, C., 2014b, A&A, 570, A97
- Izotov et al. (2015) Izotov, Y. I., Guseva, N. G., Fricke, K. J., & Henkel, C. 2015, MNRAS, 451, 2251
- Izotov et al. (2017) Izotov, Y. I., Thuan, T. X., & Guseva, N. G., 2017, MNRAS, 471, 548
- Jaskot & Oey (2013) Jaskot, A. E. & Oey, M. S., 2013, ApJ, 766, 91
- Karim et al. (2011) Karim, A., Schinnerer, E., Martínez-Sansigre, A., et al., 2011, ApJ, 730, 61
- Kennicutt (1998) Kennicutt, R. C., Jr., 1998, ARA&A, 36, 189
- Kewley & Dopita (2002) Kewley, L. J. & Dopita, M. A., 2002, ApJS, 142, 35
- Lai et al. (2008) Lai, D. K., Bolte, M., Johnson, J. A., et al., 2008, 681, 1524
- Lee et al. (2006) Lee H., Skillman E. D., Cannon J. M., et al., 2006, ApJ, 647, 970
- Lodders et al. (2009) Lodders, K., Palme, H., & Gail, H.-P., 2009, in Landolt-Börnstein – Group VI Astronomy and Astrophysics Numerical Data, ed. J. E. Trümper, 44
- Maier et al. (2014) Maier C., Lilly S. J., Ziegler B. L., et al., 2014, ApJ, 792, 3
- Maiolino et al. (2008) Maiolino, R., Nagao, T., Grazian, A., et al., 2008, A&A, 488, 463
- Manucci et al. (2010) Manucci F., Cresci G., Maiolino R., et al., 2010, MNRAS, 408, 2115
- Mesa-Delgado et al. (2009) Mesa-Delgado, A., Esteban, C., García-Rojas, J., et al., 2009, MNRAS, 395, 855
- Mitra et al. (2017) Mitra, S., Davé, R., Simha, V., & Finlator, K., 2017, MNRAS, 464, 2766
- Monaco et al. (2005) Monaco, L., Bellazzini, M., Bonifacio, P., et al., 2005, A&A, 441, 141
- Nakajima et al. (2016) Nakajima, K., Ellis, R. S., Iwata I., et al., 2016, ApJ, 831, L9
- Peimbert & Peimbert (2010) Peimbert, A. & Peimbert, M., 2010, ApJ, 724, 791
- Planck Collaboration (2014) Planck Collaboration, 2014, A&A, 571, A16
- Prantzos et al. (2018) Prantzos, N., Abia, C., & Limongi, M., 2018, MNRAS, 476, 3432
- Roederer et al. (2014) Roederer, I. U., Preston, G. W., Thompson, I. B., et al., 2014, AJ, 147, 136
- Savage & Sembach (1996) Savage, B. D. & Sembach, K. R., 1996, ARA&A, 34, 279
- Sbordone et al. (2007) Sbordone, L., Bonifacio, P., Buonanno, R. et al., 2007, A&A, 465, 815
- Simón-Díaz & Stasińska (2010) Simón-Díaz, S. & Stasińska, G., 2010, A&A, 526, 48
- Schaerer et al. (2000) Schaerer, D., Guseva, N.G., Izotov, Y.I., & Thuan, T.X., 2000, A&A, 362, 53
- Schreiber et al. (2015) Schreiber, C., Pannella, M., Elbaz, D., et al., 2015, A&A, 575, A74
- Stasińska & Izotov (2003) Stasińska, G. & Izotov, Y. I., 2003, A&A, 397, 71
- Steidel et al. (2014) Steidel, C. C., Rudie, G. C., Strom, A. L., et al., 2014, ApJ, 795, 165
- Tremonti et al. (2004) Tremonti, C. A., Heckman, T. M., Kauffmann, G., et al., 2004, ApJ, 613, 898
- Whitaker et al. (2012) Whitaker, K. E., van Dokkum, P. G., Brammer, G., et al., 2012, ApJ, 754, L29
- Whitaker et al. (2014) Whitaker, K. E., Franx, M., Leja, J., et al., 2014 ApJ, 795, 104
- Wiseman (2017) Wiseman, P., Schady, P., Bolmer, J., et al., 2017, A&A, 599, A24
- Wright (2006) Wright, E. L., 2006, PASP, 118, 1711
- Zahid et al. (2011) Zahid H. J., Kewley L. J., Bresolin F., 2011, ApJ, 730, 137
- Zahid et al. (2012) Zahid H. J., Bresolin F., Kewley L. J., et al., 2012, ApJ, 750, 120
- Zahid et al. (2013) Zahid H. J., Geller M. J., Kewley L. J., et al., 2013, ApJ, 771, L19
- Zahid et al. (2014) Zahid H. J., Dima G. I., Kudritzki R.-P.,et al., 2014, ApJ, 791, 130