Avalanche dynamics in higher dimensional fiber bundle models
Abstract
We investigate how the dimensionality of the embedding space affects the microscopic crackling dynamics and the macroscopic response of heterogeneous materials. Using a fiber bundle model with localized load sharing computer simulations are performed from 1 to 8 dimensions slowly increasing the external load up to failure. Analyzing the constitutive curve, fracture strength and avalanche statistics of bundles we demonstrate that a gradual crossover emerges from the universality class of localized behavior to the mean field class of fracture as the embedding dimension increases. The evolution between the two universality classes is described by an exponential functional form. Simulations revealed that the average temporal profile of crackling avalanches evolves with the dimensionality of the system from a strongly asymmetric shape to a symmetric parabola characteristic for localized stresses and homogeneous stress fields, respectively.
I Introduction
A large variety of heterogeneous materials respond to a slow external driving in a jerky way where sudden outbreaks of activity are separated by silent periods Sethna et al. (2001); Alava et al. (2006). From the propagation of imbibition fronts in heterogeneous materials Santucci et al. (2011), through dislocation bursts of plastically deforming crystals Ispánovity et al. (2014), and Barkhausen noise in ferromagnets Durin and Zapperi (2000), to fracture phenomena Laurson et al. (2013); Danku et al. (2015) and earthquakes Dahmen et al. (2011), crackling noise has been observed over a broad range of length scales. It was found that crackling noise is characterized by scaling laws, i.e. the statistics of the quantities of single bursts is described by power law distributions which may be the fingerprint of an underlying phase transition Sethna et al. (2001); Miguel et al. (2001); Durin and Zapperi (2000).
Recently, it has been pointed out that the average temporal profile is a fundamental feature of crackling avalanches. Experimental and theoretical studies have revealed that the precise shape of the average profile of bursts is sensitive to the details of the physics of the system and it encodes valuable information about the underlying intermittent dynamics of pulse generation Colaiori (2008); Friedman et al. (2012); Zapperi et al. (2005); Papanikolaou et al. (2011); Dahmen et al. (2011). For the fracture of heterogeneous materials careful experiments have been performed where the temporal evolution of individual bursts formed at a propagating crack front was determined by direct optical observation using high speed imaging Laurson et al. (2010); Måløy et al. (2006); Laurson et al. (2013). These investigations provided symmetric parabolic profiles mainly attributed to long range elastic forces acting along the crack front Laurson et al. (2013). Measurements of magnetic noise induced by the dynamic fracture of steal revealed similar pulse profiles, however, with a right handed asymmetry Kun et al. (2004); Danku et al. (2015). The front propagation was modeled as the driven motion of an elastic line in a disordered environment of pinning centers. Varying the range of interaction it was found that the degree of asymmetry depends on the range of stress redistribution, i.e. profiles evolve with the universality class of fracture from a strongly asymmetric shape (localized interaction) to a symmetric parabola (long range interaction) Laurson et al. (2013). Simulation studies of the dynamics of breaking bursts in the fiber bundle model underlined the general validity of this behavior Danku and Kun (2013).
In the present paper we take the opposite strategy and address the question how the dimensionality of the sample affects the fracture process when the range of interaction is kept constant. We performed computer simulations in the framework of a fiber bundle model with nearest neighbor load sharing after local failure events varying the dimensionality of the system from 1 to 8. Both on the macro- and micro-scales the system exhibits a crossover between the universality classes of localized behavior and the mean field class of fracture phenomena. We show that this evolution is described by a genuine exponential form. The temporal profile of breaking avalanches can be well described by the scaling form suggested in Ref. Laurson et al. (2013) where the parameters clearly confirm the crossover between the two universality classes. Our study shows that the upper critical dimension of the fracture of heterogeneous materials is infinite in agreement with a recent theoretical prediction Sinha et al. (2015). We give numerical evidence that the critical exponents change as an exponential function of the dimension.
II Local load sharing fiber bundle model in 1 to 8 dimensions
The fiber bundle model provides an efficient modeling framework for the fracture of heterogeneous materials Pradhan et al. (2010); Hansen et al. (2015); Kun et al. (2006). In spite of its simplicity it captures the essential ingredients of fracture phenomena allowing also for analytical solutions for the most important quantities Kloster et al. (1997); Hidalgo et al. (2009a). The classical fiber bundle model consists of parallel fibers which are organized on a regular lattice. In fibers are placed equidistantly next to each other along a line, while in the fibers are assigned to the sites of a square lattice of side length . The fibers are assumed to have a perfectly brittle behavior, i.e. they exhibit a linearly elastic response with a Young modulus up to breaking at a threshold load . The Young modulus is assumed to be constant such that the disorder of the material is solely represented by the randomness of the breaking threshold : to each fiber a threshold value is assigned , sampled from the probability density . In the present calculations we used exponentially distributed breaking thresholds
| (1) |
over the range . The scale parameter was fixed to in all the calculations.
In the bundle is loaded in the direction parallel to the fibers, which represents the uniaxial loading of a bar shaped specimen. Under stress controlled loading, when the local load on a fiber reaches its failure strength the fiber breaks and its load has to be redistributed over the remaining intact fibers. We assume localized load sharing (LLS) so that the load of a broken fiber is redistributed equally over its intact nearest neighbors in the square lattice Hidalgo et al. (2002); Raischel et al. (2006); Kovács et al. (2013). When the breaking fiber is entirely surrounded by intact ones in the square lattice, four fibers share the load, however, when the breaking fiber is at the perimeter of a growing broken cluster (crack) typically 2-3 fibers receive the excess the load. As a consequence, high stress concentration builds up along the perimeter of cracks and local stress fluctuations develop.
In higher dimensions the generalization of the model is straightforward although it does not have a direct relevance for practical applications: the fibers are assigned to sites of cubic lattices and the load on them is represented by a scalar variable. After failure events the load is redistributed over the intact nearest neighboring sites along the edges of the lattice. The emerging stress concentration is controlled by the coordination number of the underlying lattice which depends on the embedding dimension as in our setup. In all dimensions periodic boundary conditions are implemented in all lattice directions.
Computer simulations were performed by quasi-statically increasing the external load which is realized by increasing to provoke the breaking of a single fiber. After the fiber has been removed its load gets redistributed according to the rules discussed above. The enhanced load on the neighboring fibers may induce further breaking which is followed again by a local stress redistribution. As the result of this repeated breaking and stress redistribution the breaking of a single fiber can give rise to an avalanche of breakings. The loading process stops when a catastrophic avalanche is triggered in which all remaining intact fibers break.
In order to keep the problem numerically tractable for the dimensions the lattice size was set to , which ensures nearly the same number of fibers in all dimensions. To obtain reliable results statistical averaging was done over simulations.
III Macroscopic response
The mean field limit of FBMs is realized by the equal load sharing (ELS) of the load of broken fibers over the intact ones. Under ELS conditions all intact fibers receive the same amount of load irrespective of their distance from the broken one. It follows that no stress fluctuations can emerge, all fibers keep the same load during the entire loading process.
Hence, in the mean field limit the random strength of fibers is the only source of disorder in the system. For ELS the macroscopic stress-strain relation of the bundle can simply be obtained from the general expression . Here denotes the cumulative distribution of the failure thresholds so that the term yields the fraction of intact fibers which all keep the same load . Substituting the exponential distribution Eq. (1) we obtain
| (2) |
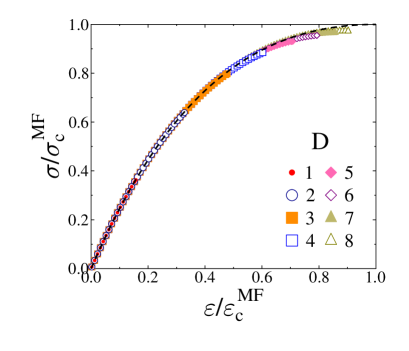
In Fig. 1 the curve of Eq. (2) is presented up to the maximum where catastrophic failure occurs under stress controlled loading. The constitutive curve has a quadratic maximum the value and position of which determine the fracture stress and strain of the bundle, respectively
| (3) | |||||
| (4) |
Note that the fracture strength and of FBMs depend on the system size even in the mean field limit Smith (1980); McCartney and Smith (1983); Kádár et al. (2017). Although the convergence is rapid, strictly speaking the above expressions give the bundle strength in the limit of infinite system size.
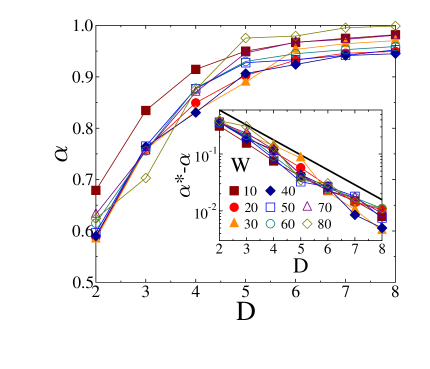
For finite dimensions the curves were determined by computer simulations averaging over a large number of loading processes with different realizations of the threshold disorder. It can be seen in Fig. 1 that for all dimensions the mechanical response of LLS bundles follows the mean field solution Eq. (2). However, for low dimensional bundles the curves stop significantly earlier implying a lower fracture strength and a higher degree of brittleness. As increases the LLS constitutive response completely recovers the mean field behavior. This tendency becomes more transparent when analyzing the average fracture stress and strain as a function of . In Figure 2 both quantities gradually converge to their mean field counterpart, however, the convergence is somewhat faster for . For the highest dimension considered only a few percent difference is observed from the value of of Eq. (3).
The most remarkable result is that the convergence to the mean field limit can be described by an exponential form. The inset of Fig. 2 demonstrates that subtracting a constant from a straight line is obtained on a semi-logarithmic representation which implies the functional form
| (5) |
Here denotes a characteristic value of the dimension.
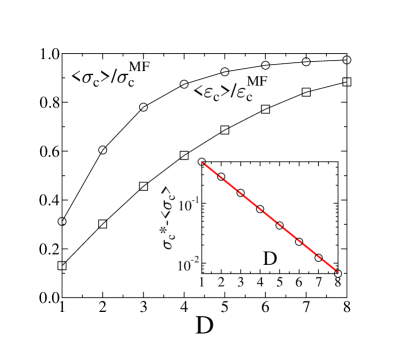
Formally, is a free parameter in Eq. (5) which was tuned to to obtain the best straight line in Fig. 2. Note that this value falls very close to . The characteristic dimension was obtained by fitting .
The results show that in higher dimensions the role of stress fluctuations is diminishing in the fracture process and the behavior of the system gradually approaches the one of the completely homogeneous stress field of the infinite dimensional ELS solution. It follows that, in spite of the highly localized stress redistribution, in high the stochastic breaking process is completely controlled by the quenched disorder of the failure strength of fibers.
IV Avalanche dynamics
The bundle is loaded in a quasi-static way such that the external load is increased to provoke solely the breaking of a single fiber. In the simulations the cascade of breaking fibers, emerging due to the repeated steps of load redistribution and breaking, is followed until it stops while keeping the external load fixed. The size of avalanches is characterized by the number of fibers breaking in the avalanche. These breaking avalanches are analogous to crackling bursts measured in experiments with acoustic Garcimartin et al. (1997); Stojanova et al. (2014) or electromagnetic Kun et al. (2004); Danku et al. (2015) techniques. Under simple geometrical conditions such as during the slow propagation of a planar crack direct optical observation has also proven very successful Maloy et al. (2006); Tallakstad et al. (2011); Laurson et al. (2013).
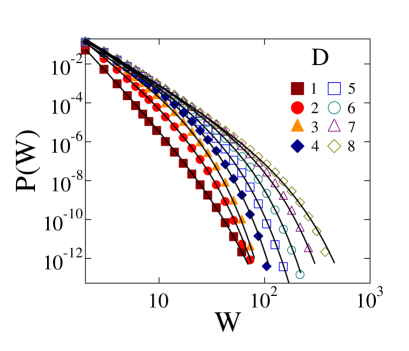
The probability distribution of avalanche sizes is presented in Fig. 3.
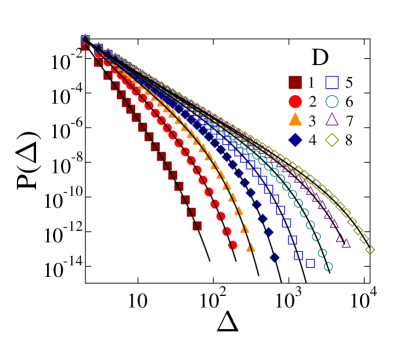
In all dimensions the probability density is described by the same functional form, i.e. power law distributions are obtained followed by an exponential cutoff
| (6) |
where both the exponent and the characteristic burst size depend on the dimensionality of the bundle. In Fig. 3 Eq. (6) provides excellent fits of the numerical data where the exponent decreases while increases with . The result implies that in higher dimensions the system can tolerate larger avalanches without catastrophic collapse. It has been shown by analytical calculations that in mean field FBMs the size distribution exponent takes the value which has proven to be universal for a broad class of threshold distributions Kloster et al. (1997); Hansen et al. (2015); Hidalgo et al. (2009b).

For our LLS system it can be observed in Fig. 4 that has high values in low dimensions but with increasing it approaches the mean field exponent. The inset of Fig. 4 demonstrates that the convergence is again described by an exponential form similar to Eq. (5)
| (7) |
where best fit was obtained with the same value of the characteristic dimension as for the fracture strength Eq. (5). The value of providing the best straight line is which falls very close to the mean field exponent .
V Temporal profile of avalanches
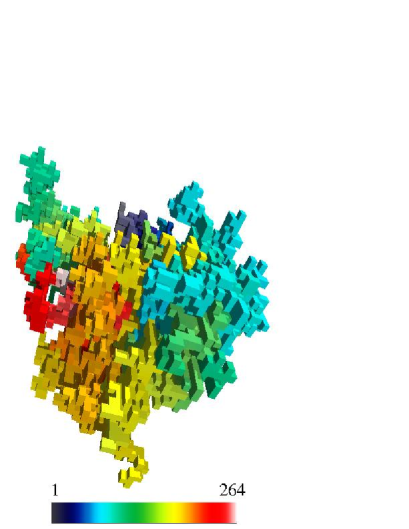
Recently, we have shown that breaking avalanches in fiber bundles have a complex time evolution Danku and Kun (2013): an avalanche typically starts with the breaking of a single fiber which in turn triggers the breaking of 1-2 additional fibers after load redistribution. The subsequent load redistribution steps involve a larger and larger number of fibers giving rise to a spatial spreading of the avalanche. The avalanche stops when all the fibers involved in the last redistribution step are able to sustain the elevated load. This dynamics implies that avalanches are composed of discrete growth steps of size , which is the number of fibers breaking in a single load redistribution step. The total number of subsequent redistribution - breaking steps defines the duration of the avalanche. The time evolution of a single burst of size and duration is illustrated in Fig. 5 for a three-dimensional bundle, where cubes represent fibers. The color code corresponding to the growth steps of the avalanche facilitates to follow the breaking sequence.
The temporal evolution of an avalanche is characterized by the function, where is a time variable taking integer values in the interval . Similarly to the size of bursts , their duration is also a stochastic quantity which varies over a broad range.
It can be observed in Fig. 6 that the probability distribution of the burst duration has the same functional form as , i.e. power law behaviour followed by an exponential cutoff is evidenced. In higher dimensions the system can tolerate larger bursts of longer duration, hence, the power law exponent of decreases from of to the vicinity of for , while the cutoff duration gradually increases with the dimensionality.
For single bursts is a stochastic curve, hence, quantitative characterization of the internal dynamics of avalanches is provided by the average temporal profile , where the step size is averaged at fixed values of for avalanches of the same duration W Danku and Kun (2013). Average profiles are illustrated in Fig. 7 for different durations for all dimensions considered. It can be observed that, except for , the shape of avalanches obtained is similar to the experimental findings Laurson et al. (2013); Danku et al. (2015). For the stress concentration is so high at the tip of growing broken clusters that all steps of the breaking sequence have a size , since a larger number of breaking fibers would trigger a catastrophic avalanche. Consequently, the emerging pulse profile is completely flat. At low dimensions the profiles have a strong right handed asymmetry at all durations , which means that these bursts start slowly, they gradually accelerate while their stopping is more sudden. As the dimensionality of the system increases the degree of asymmetry decreases and eventually a symmetric parabolic shape is obtained which is characteristic for mean field avalanches Sethna et al. (2001); Danku and Kun (2013); Dahmen et al. (2011). Recently, similar asymmetric avalanche shapes have been obtained in a fiber bundle model of creep rupture with localized load sharing Danku and Kun (2013). Since in those calculations the external load was fixed, bursts were triggered by ageing induced slow breaking of fibers. However, the cascading breaking sequence of avalanches had essentially the same dynamics as in the present study.
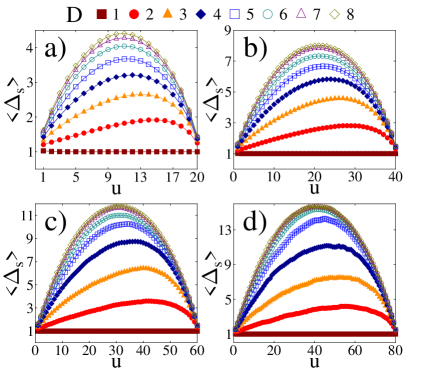
It has been shown in Ref. Danku and Kun (2013) for that the short range load sharing and the heterogeneous stress field built up along the perimeter of cracks are responsible for the right handed asymmetry of pulse profiles.
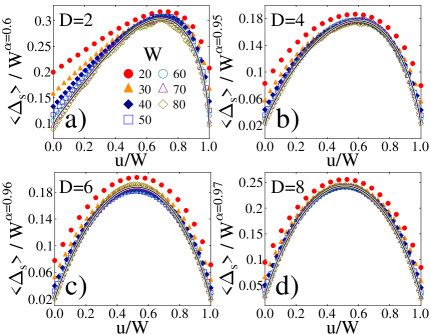
Comparing the curves in Figs. 7 for a fixed dimension it can be inferred that bursts of a longer duration have a larger average height and average size . Figure 8 demonstrates that rescaling the pulse profiles with an appropriate power of pulses of different duration can be collapsed on the top of each other. The good quality data collapse implies the scaling form
| (8) |
where the value of the exponent and the scaling function both depend on the dimensionality of the system . In Figure 8 the value of was tuned to achieve the best collapse. Deviations from the scaling function occur for the shortest durations which confirms that Eq. (8) is asymptotically valid.
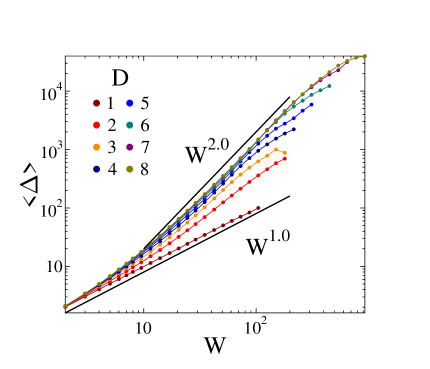
It follows from the scaling structure Eq. (8) that the average avalanche size has a power law dependence on the duration Danku and Kun (2013); Mehta et al. (2002); Sethna et al. (2001); Zapperi et al. (2005); Baldassarri et al. (2003)
| (9) |
which provides an alternative way to determine the exponent , as well. Figure 9 shows that the asymptotic behaviour of the average size of bursts of the same duration can be well described by a power law. The value of the exponent obtained by fitting the curves with Eq. (9) is presented in Fig. 10 as a function of the embedding dimension . Since in the step size does not exceed 1, the total size of an avalanche is proportional to its duration so that and follows. As increases, gradually approaches , and hence tends to its mean field value . Based on Eq. (9) a scaling relation can be established between and the exponents and of the probability distribution of the size and duration of bursts
| (10) |
In Figure 10 we compare the prediction of the scaling law by substituting the numerical values of and on the right hand side of Eq. (10), to the value of obtained by direct fitting of the average burst size in Fig. 9. A reasonable agreement can be observed between the two curves which confirms the consistency of the results.
Avalanche profiles have an asymmetric functional form in all dimensions, however, the degree of asymmetry depends on the embedding dimension . In Ref. Laurson et al. (2013) the following expression has recently been suggested to quantify avalanche shapes
| (11) |
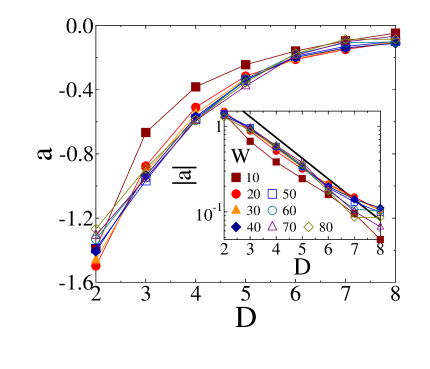
Note that the scaling laws Eqs. (8,9) are consistent with the generic form of Eq. (11) with the same value of the exponent . The pulse asymmetry is represented by the parameter such that zero value of implies symmetry, while negative and positive values of capture right and left handed asymmetry, respectively. It can be observed in Fig. 8 that Eq. (11) provides excellent fits of pulse profiles for all dimensions. Figures 11 and 12 present the value of the parameters and obtained by fitting for several avalanche durations . The careful analysis revealed that the parameter values practically do not depend on the avalanche duration , except for some statistical fluctuations the numerical values of and agree with each other
at different s. In agreement with the results presented in Fig. 10, for low dimensions the exponent starts from the vicinity of and it increases to at high dimensions (see Fig. 11). At the same time the observed right handed asymmetry of profiles in Fig. 7 gives rise to negative values of in Fig. 12. As the event duration increases from 10 to 80, in Figs. 11 and 12 the numerical error of the determination of the parameters and increases from to , and from to , respectively. The reason is that due to the rapidly decreasing duration distribution of bursts, the statistics of events of higher duration decreases. In higher dimensions approaches one and increases to the vicinity of zero which imply that the profile shape evolves towards a simple symmetric parabola of mean field crackling systems Danku and Kun (2013); Dahmen et al. (2011); Zapperi et al. (2005); Baldassarri et al. (2003). The inset of Fig. 11 demonstrates that subtracting from a proper limit value straight lines are obtained on a semi-logarithmic plot. For each the value of was varied in the range independently until best straight lines were achieved. Similarly, the inset of Fig. 12 presents the absolute value of where again an exponential dependence is evidenced. The results imply that the behaviour of the pulse parameters and is consistent with that of the macroscopic strength and avalanche exponent, i.e. they approach their mean field values with an exponential dependence on the dimensionality.
VI Discussion
The fracture of heterogeneous materials is strongly affected by the degree of disorder, which controls the spatial variation of microscopic materials’ strength, and the stress fluctuations emerging due to localized stress redistribution after micro-fracturing events. The competition of these two sources of disorders, i.e. strength and stress disorders, gives rise to a highly complex fracture process which manifests itself in the variation of macroscopic strength, in the statistics of crackling bursts, and in the temporal evolution of single crackling events. At a fixed amount of quenched strength disorder stress fluctuations are mediated by the range of load redistribution. Former studies have revealed two universality classes of fracture, i.e. the localized load sharing (LLS) class and the mean field class (ELS), characterized by a high degree of brittleness and a quasi-brittle response with a large amount of avalanche precursors of failure, respectively.
In order to understand the competing role of different disorder sources between the limiting cases of the LLS and ELS classes, in our study we considered a fiber bundle model with a fixed amount of strength disorder and varied the dimensionality of the system from 1 to 8 at a fixed range of load sharing. The strength disorder is represented by an exponential distribution of the failure threshold of fibers, which falls in the well understood universality classes both in the ELS and LLS limits of load sharing. In all dimensions nearest neighbor load redistribution was implemented on cubic lattices with periodic boundary conditions in all lattice directions.
Our study revealed a very interesting dimensional crossover between the two universality classes of fracture: Both on the macro and micro-levels fracture characteristics evolve with the dimensionality from the highly brittle response of low dimensional systems controlled by stress fluctuations, to the quasi-brittle behavior in high dimensions where the strength disorder dominates. For the macroscopic strength of the bundle and for the power law exponent of the size distribution of crackling bursts the convergence to the mean field limit is described by an exponential functional form.
Avalanche profiles have been found before to be very sensitive to models’ details, especially to the degree of correlations of microscopic events leading to collective avalanches of local failures. We showed that the symmetry of avalanche profiles depends on the dimensionality of the system, gradually shifting from a strongly asymmetric shape at low dimensions to a symmetric parabolic form in the mean field limit. The parameters of pulse profiles were found to evolve towards their mean field values with an exponential dependence on the dimensionality similarly to the macroscopic strength and avalanche exponent of the system.
Increasing the dimensionality of the bundle implies a decreasing stress concentration along broken clusters by increasing the connectivity of the system. As a consequence, stress fluctuations have a diminishing role with increasing dimension giving more room for the quenched disorder of fibers’ strength. The evolution of avalanche temporal profiles we observe with the embedding dimension is similar to what has been obtained recently for avalanches of a propagating crack front when increasing the range of interaction in a fracture model of fixed dimensions Laurson et al. (2013).
Recently, the effect of the long range connection of fibers on the fracture process has been studied. Instead of a regular lattice, fibers were assigned to the nodes of a complex network with small world properties D.-H.Kim et al. (2005). Redistributing the load along the edges of the network simulations revealed that a small amount of long range connection is sufficient to converge the system from the LLS to the mean field universality class. Eventually, the dominance of quenched structural disorder is responsible for the ELS behavior similarly to our case.
Fiber bundles in higher dimensions have recently been investigated in Ref. Sinha et al. (2015). Focusing on the amount of damage accumulated up to failure and on the distribution of avalanches a crossover from the LLS to the mean field universality class was pointed out. However, the crossover is described by a power law functional form contrary to our exponential behavior. This difference may arise due to the different protocols of load redistribution used in the simulations. In agreement with Ref. Sinha et al. (2015), our results imply that the upper critical dimension of the fracture of heterogeneous materials is infinite. Further support of this remarkable feature of fracture phenomena could be obtained by a finite size scaling analysis in higher dimensions, however, it turned to be infeasible due to the overwhelming numerical costs.
In the broader context of critical phenomena, the absence of a finite upper critical dimension has also been found in Kardar-Parisi-Zhang type surface growth models Ódor (2008), where the critical exponents present an approximate exponential dependence on the dimensionality of the system Ódor et al. (2010). We conjecture that the quenched disorder of the system and the locally conserving nature of the dynamics (i.e. the entire load dropped by broken fibers is redistributed over the intact ones without loss) are responsible for the absence of a finite upper critical dimension beyond which mean field behavior is attained. The exponential crossover from the local to the mean field universality class of fracture involves a characteristic dimension which falls between 1 and 2. Since avalanche shapes of the one dimensional system do not conform with the higher dimensional ones, we propose the interpretation of as the lower critical dimension of fracture phenomena. Our simulations confirm that for all characteristic quantities of the system evolve through gradual quantitative changes but the qualitative behaviour remains robust as the embedding dimension increases.
Acknowledgements.
The work is supported by the EFOP-3.6.1-16-2016-00022 project. The project is co-financed by the European Union and the European Social Fund. This research was supported by the National Research, Development and Innovation Fund of Hungary, financed under the K-16 funding scheme Project no. K 119967 and K 109577. This work was supported through the New National Excellence Program of the Ministry of Human Capacities of Hungary. The research was financed by the Higher Education Institutional Excellence Programme of the Ministry of Human Capacities in Hungary, within the framework of the Energetics thematic programme of the University of Debrecen.References
- Sethna et al. (2001) J. P. Sethna, K. A. Dahmen, and C. R. Meyers, Nature 410, 242 (2001).
- Alava et al. (2006) M. Alava, P. K. Nukala, and S. Zapperi, Adv. Phys. 55, 349–476 (2006).
- Santucci et al. (2011) S. Santucci, R. Planet, K. J. Maloy, and J. O. n, EPL (Europhysics Letters) 94, 46005 (2011).
- Ispánovity et al. (2014) P. D. Ispánovity, L. Laurson, M. Zaiser, I. Groma, S. Zapperi, and M. J. Alava, Phys. Rev. Lett. 112, 235501 (2014).
- Durin and Zapperi (2000) G. Durin and S. Zapperi, Phys. Rev. Lett. 84, 4705 (2000).
- Laurson et al. (2013) L. Laurson, X. Illa, S. Santucci, K. Tore Tallakstad, K. J. Maloy, and M. J. Alava, Nat. Commun. 4, 4927 (2013).
- Danku et al. (2015) Z. Danku, G. B. Lenkey, and F. Kun, Applied Physics Letters 106, 064102 (2015).
- Dahmen et al. (2011) K. A. Dahmen, Y. Ben-Zion, and J. T. Uhl, Nat. Phys. 7, 554 (2011).
- Miguel et al. (2001) M. Miguel, A. Vespignani, S. Zapperi, J. Weiss, and J. Grasso, Nature 410, 667 (2001).
- Colaiori (2008) F. Colaiori, Adv. Phys. 57, 287 (2008).
- Friedman et al. (2012) N. Friedman, S. Ito, B. A. W. Brinkman, M. Shimono, R. E. L. DeVille, K. A. Dahmen, J. M. Beggs, and T. C. Butler, Phys. Rev. Lett. 108, 208102 (2012).
- Zapperi et al. (2005) S. Zapperi, C. Castellano, F. Colaiori, and G. Durin, Nature Phys. 1, 46 (2005).
- Papanikolaou et al. (2011) S. Papanikolaou, F. Bohn, R. L. Sommer, G. Durin, S. Zapperi, and J. P. Sethna, Nature Physics 7, 316 (2011).
- Laurson et al. (2010) L. Laurson, S. Santucci, and S. Zapperi, Phys. Rev. E 81, 046116 (2010).
- Måløy et al. (2006) K. J. Måløy, S. Santucci, J. Schmittbuhl, and R. Toussaint, Phys. Rev. Lett. 96, 045501 (2006).
- Kun et al. (2004) F. Kun, G. B. Lenkey, N. Takács, and D. L. Beke, Phys. Rev. Lett. 93, 227204 (2004).
- Danku and Kun (2013) Z. Danku and F. Kun, Phys. Rev. Lett. 111, 084302 (2013).
- Sinha et al. (2015) S. Sinha, J. T. Kjellstadli, and A. Hansen, Phys. Rev. E 92, 020401 (2015).
- Pradhan et al. (2010) S. Pradhan, A. Hansen, and B. K. Chakrabarti, Rev. Mod. Phys. 82, 499 (2010).
- Hansen et al. (2015) A. Hansen, P. Hemmer, and S. Pradhan, The Fiber Bundle Model: Modeling Failure in Materials, Statistical Physics of Fracture and Breakdown (Wiley, 2015).
- Kun et al. (2006) F. Kun, F. Raischel, R. C. Hidalgo, and H. J. Herrmann, in Modelling Critical and Catastrophic Phenomena in Geoscience: A Statistical Physics Approach, Lecture Notes in Physics, edited by P. Bhattacharyya and B. K. Chakrabarti (Springer-Verlag Berlin Heidelberg New York, 2006) pp. 57–92.
- Kloster et al. (1997) M. Kloster, A. Hansen, and P. C. Hemmer, Phys. Rev. E 56, 2615–2625 (1997).
- Hidalgo et al. (2009a) R. C. Hidalgo, F. Kun, K. Kovács, and I. Pagonabarraga, Physical Review E 80, 051108 (2009a).
- Hidalgo et al. (2002) R. C. Hidalgo, Y. Moreno, F. Kun, and H. J. Herrmann, Phys. Rev. E 65, 046148 (2002).
- Raischel et al. (2006) F. Raischel, F. Kun, and H. J. Herrmann, Phys. Rev. E 74, 035104 (2006).
- Kovács et al. (2013) K. Kovács, R. C. Hidalgo, I. Pagonabarraga, and F. Kun, Phys. Rev. E 87, 042816 (2013).
- Smith (1980) R. L. Smith, Proc. R. Soc. Lond. A 372, 539 (1980).
- McCartney and Smith (1983) L. N. McCartney and R. L. Smith, J. Appl. Mech 50, 601 (1983).
- Kádár et al. (2017) V. Kádár, Z. Danku, and F. Kun, Phys. Rev. E 96, 033001 (2017).
- Hidalgo et al. (2009b) R. C. Hidalgo, F. Kun, K. Kovács, and I. Pagonabarraga, Phys. Rev. E 80, 051108 (2009b).
- Garcimartin et al. (1997) A. Garcimartin, A. Guarino, L. Bellon, and S. Ciliberto, Phys. Rev. Lett. 79, 3202 (1997).
- Stojanova et al. (2014) M. Stojanova, S. Santucci, L. Vanel, and O. Ramos, Phys. Rev. Lett. 112, 115502 (2014).
- Maloy et al. (2006) K. J. Maloy, S. Santucci, J. Schmittbuhl, and R. Toussaint, Phys. Rev. Lett. 96, 045501 (2006).
- Tallakstad et al. (2011) K. T. Tallakstad, R. Toussaint, S. Santucci, J. Schmittbuhl, and K. J. Måløy, Phys. Rev. E 83, 046108 (2011).
- Mehta et al. (2002) A. P. Mehta, A. C. Mills, K. A. Dahmen, and J. P. Sethna, Phys. Rev. E 65, 046139 (2002).
- Baldassarri et al. (2003) A. Baldassarri, F. Colaiori, and C. Castellano, Phys. Rev. Lett. 90, 060601 (2003).
- D.-H.Kim et al. (2005) D.-H.Kim, B. J. Kim, and H. Jeong, Phys. Rev. Lett. 94, 025501 (2005).
- Ódor (2008) G. Ódor, Universality in Nonequilibrium Lattice Systems: Theoretical Foundations (World Scientific, 2008).
- Ódor et al. (2010) G. Ódor, B. Liedke, and K.-H. Heinig, Phys. Rev. E 81, 031112 (2010).