The stellar remnants of high redshift nuclear starburst discs: a potential origin for nuclear star clusters?
Abstract
Nuclear starburst discs (NSDs) are very compact star-forming regions in the centers of galaxies that have been studied as a possible origin for the absorbing gas around a central active galactic nucleus. NSDs may be most relevant at when obscured accretion onto supermassive black holes (SMBHs) is common. This paper describes the characteristics of the stellar remnants of NSDs at , taking into account the evolution from . Using a stellar synthesis model, the colours, masses, and luminosities of the stellar remnants are computed for a suite of 192 two-dimensional NSD models. These properties are compared to observations of local nuclear star clusters (NSCs), and a good match is found between the predicted and observed properties. Dynamical effects will likely cause the final remnant to be a rotating, nearly spherical distribution. In addition, % of the NSD remnants have half-light radii pc, consistent with NSCs hosted in both late-type and early-type galaxies, and all the remnants follow similar size-luminosity relationships as observed in nearby NSCs. NSDs require the presence of a central SMBH and the most massive and compact stellar remnants are associated with the most massive SMBHs, although stellar clusters with a variety of sizes can be produced by all considered SMBH masses. Overall, NSDs at appear to be a promising origin for the Gyr NSC population in early- and late-type galaxies with large SMBHs.
keywords:
galaxies: active – galaxies: Seyfert – galaxies: formation – galaxies: nuclei – galaxies: star clusters: general1 Introduction
Nuclear starburst discs (NSDs) — extremely compact, Eddington-limited starbursts in the cores of galaxies — have been proposed as a potential method for fueling and obscuring active galactic nuclei (AGNs; Ballantyne 2008; Gohil & Ballantyne 2017). A key prediction of both 1-dimensional (1D) and 2-dimensional (2D) NSD models is the presence of a pc-scale burst of star-formation caused by the loss of dust opacity which inflates the disc atmosphere and results in significant obscuration along most lines-of-sight to the central AGN (Thompson, Quataert & Murray, 2005; Ballantyne, 2008; Gohil & Ballantyne, 2017). This pc-scale starburst is more likely to occur when galaxies have high gas fractions, and therefore NSDs are a possible candidate for obscuring AGNs at and influencing the shape of the X-ray Background (Gohil & Ballantyne, 2018).
If NSDs are obscuring AGNs at high redshifts, then the remnants of these discs may be detectable in the nuclei of local galaxies. Interestingly, over the last several years Hubble Space Telescope (HST) observations have revealed that nuclear star clusters (NSCs) are found at the center of most (%) nearby early and late-type galaxies (e.g., Carollo et al., 1997; Matthews et al., 1999; Böker et al., 2002; Côté et al., 2006; Seth et al., 2008a; Georgiev & Böker, 2014; Carson et al., 2015; Georgiev et al., 2016). The effective radii (i.e., the half-light radii) of many NSCs is smaller than a few tens of pc (e.g., Böker et al., 2004; Côté et al., 2006; Turner et al., 2012; Georgiev et al., 2016), and they show evidence for a complex star-formation history with the presence of multiple generations of stars (e.g., Walcher et al., 2005; Rossa et al., 2006; Seth et al., 2006, 2010; Lyubenova et al., 2013; Kacharov et al., 2018), including an older population with ages Gyr. In addition, NSCs are also observed to be rotating (Seth et al., 2008b), and many of them co-exist with a central SMBH (e.g., Seth et al., 2008a; Graham & Spitler, 2009; Georgiev et al., 2016) in their host galaxies. Two broad class of mechanisms have been suggested for the formation of NSCs. The first focuses on the migration of dense clusters via dynamical friction (e.g., Andersen et al., 2008; Antonini, 2013; Arca-Sedda & Capuzzo-Dolcetta, 2014), while the second one considers in situ nuclear star-formation from gas inflows (e.g., Milosavljević, 2004; Seth et al., 2006). Given the wide range of NSC properties observed in both early- and late-type galaxies, both of these mechanisms are likely relevant and operating with various efficiencies in different galaxies (e.g., Antonini, Barausse & Silk, 2015; Guillard, Emsellem & Renaud, 2016).
A very compact ( pc), rotating, multi-Gyr-old stellar population associated with a SMBH is very suggestive as a potential remnant from a NSD that was obscuring an AGN at . However, to test this idea the stellar content of a NSD must be evolved to the present day to compare with observations of nearby NSCs. This paper presents the result of such an experiment. The next section provides a brief overview of the NSD models, and then Section 3 describes the procedure to compute various properties of the stellar remnants of NSDs. The predicted properties of the resulting star clusters are presented in Section 4, where a comparison to observed NSCs is also performed. Finally, Section 5 contains a short discussion and a summary of the results. A standard CDM model cosmology is assumed with km s-1 Mpc-1, , and (Hinshaw et al., 2013).
2 Overview of Nuclear Starburst Disc Models
The 1D theory of NSDs was first presented by Thompson et al. (2005), and was extended to 2D by Gohil & Ballantyne (2017). Those papers present a complete description of the model, but a brief overview of the fundamental properties and assumptions of the 2D model is presented here.
The 2D NSD models used in this paper are time-independent, equilibrium calculations of a Keplerian gas disc orbiting in the potential of a SMBH and galactic bulge. The disc midplane is always assumed to be critically unstable to star-formation (i.e., the Toomre parameter is very close to one), and the radiation pressure of starlight on dust is fundamental to the vertical support of the disc. The calculation does not compute the formation of individual stars, but rather determines the radial and vertical structure of the NSD by finding the radial distribution of the star-formation rate that leads to hydrostatic, thermal and energy balance.
An interesting aspect of the NSD theory is that gas is assumed to slowly accrete through the disc with a radial velocity , where is the local sound speed and is a constant Mach number. This results in a constant competition between star-formation and accretion at every radius. If gas reaches a radius pc from the SMBH, then the temperature of the gas may be high enough to sublimate dust. This results in a large burst of star-formation as well as a vertical expansion of an atmosphere. The vertically inflated atmosphere is supported by the radiation pressure from the bursty star-formation (Thompson et al., 2005; Gohil & Ballantyne, 2017). Gohil & Ballantyne (2017) computed the two-dimensional structure of 192 NSDs across its input parameter space and showed that 52% of these models possess the starburst phenomenon at the parsec-scale.
The structure of an individual NSD depends on four input parameters: the disc size (), the gas fraction at the outer radius (), the Mach number (), and the SMBH mass (). The distribution of parameters used in the Gohil & Ballantyne (2017) model set is shown in Table 1, and were not chosen nor optimised for describing local NSCs. Therefore, the NSD remnants derived from this parameter set will provide an unbiased sample to compare against the observed NSC properties.
| log(M⊙) | (pc) | |||
|---|---|---|---|---|
| 6.5 | 240 | 0.2 | 0.1 | |
| 7.0 | 180 | 0.4 | 0.3 | |
| 7.5 | 120 | 0.6 | 0.5 | |
| 8.0 | 60 | 0.8 | – |
Each of these 192 models calculated from the different combination of parameters yields a radial distribution of star-formation rates (SFR) needed to vertically support the NSD. The distribution of SFRs can vary widely among the models depending on the input parameters. Two examples of the derived equilibrium SFRs are shown in Figure 1.
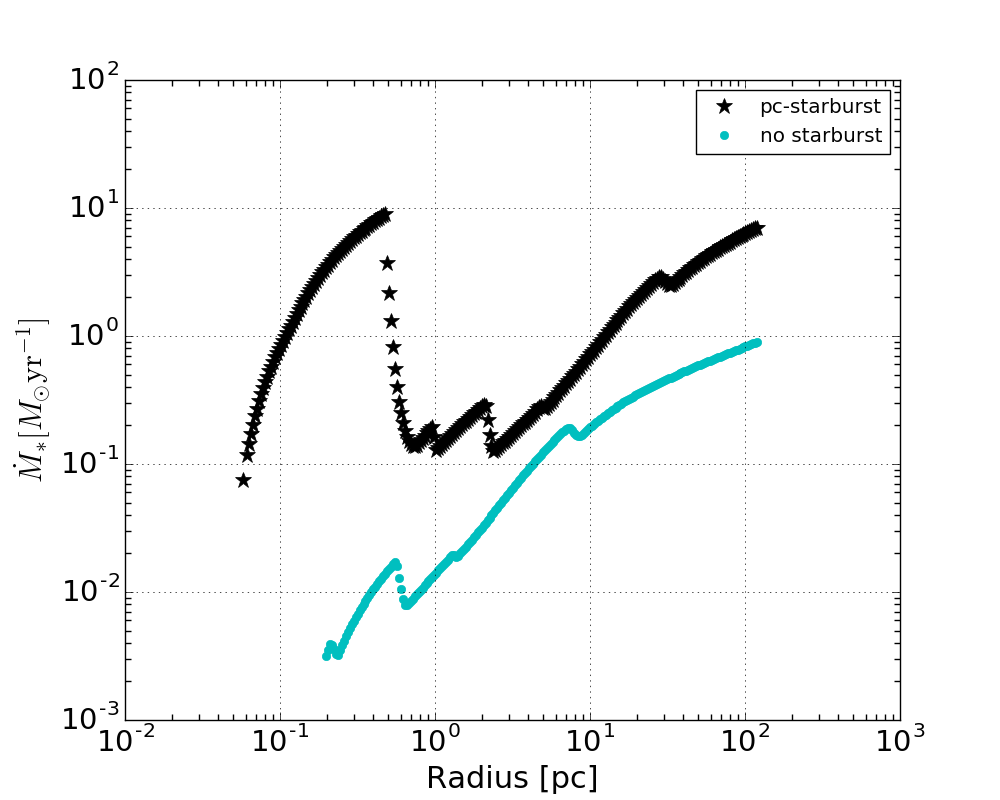
The profile with the black stars exhibits a pc-scale burst of star-formation resulting from the loss of dust opacity as described above, while the SFR distribution shown with the cyan circles has most of the star-formation at the outer edge of the disc. In general, all of the 192 NSD models fall into one of the two profiles shown in Fig. 1, but with significant variations in the magnitude of the SFRs (e.g., Ballantyne, 2008; Ballantyne, Armour & Indergaard, 2013). These 192 time-independent SFR profiles derived from the NSD models are then used to derive the predicted properties of the relic star cluster long after the end of the starburst.
3 Calculation of Properties of Remnant Star Cluster
3.1 Timescales and Half-light Radius
As the SFR profiles computed by Gohil & Ballantyne (2017) are time-independent, a characteristic timescale must be identified in order to predict the final star cluster properties. Here, we use the dynamical time of the NSD, , which appears to explain observed star-formation efficiencies in both low- and high- environments (e.g., Silk, 1997; Elmegreen, 1997; Kennicutt, 1998; Genzel et al., 2010). The dynamical time is computed for all 192 NSD models by
| (1) |
where is the Keplerian angular frequency at .
If the NSD structure does not change significantly over , then the final distribution of light in the remnant cluster will follow the SFR profile predicted by the NSD theory (e.g., Fig. 1). Therefore, the half-light radius of the final remnant, (also known as the effective radius), can be predicted directly from the NSD model. As described by Thompson et al. (2005) and Gohil & Ballantyne (2017), the total radiative flux due to star-formation is known at each radius in a NSD, so the bolometric spectrum can be computed by assuming each annulus emits as a blackbody with an effective temperature . Then for each NSD is given by the following equation:
| (2) |
where
| (3) |
and and are computed based on the maximum and minimum . This bolometric can then be compared to measurements of NSCs in the local Universe since the observed values depend weakly on wavelength (e.g., Georgiev & Böker, 2014).
Figure 2 plots and for all 192 NSD models considered here, including those with (black stars) and without (cyan circles) the pc-scale burst of star-formation.
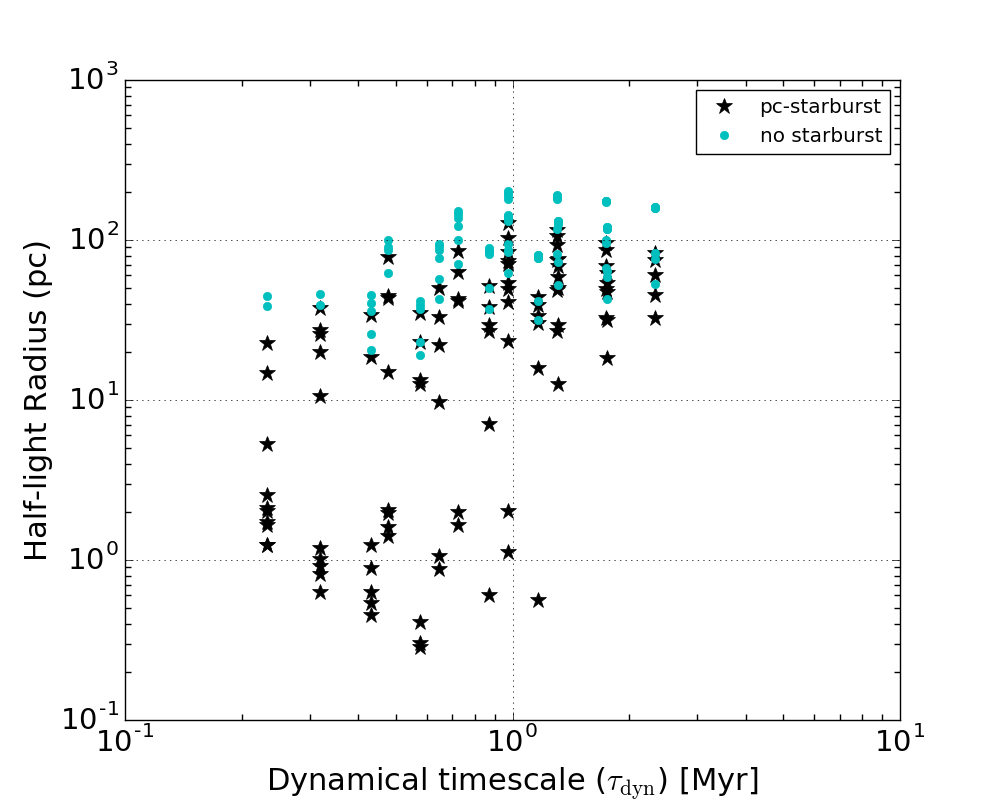
The figures show that the NSDs without pc-scale starbursts all have pc, but that the ones with the small scale bursts are clustered in two groups. There is one group of black stars with intermediate sizes (10s of pc), and a second group with pc. The first group are models where there is roughly equal amounts of star-formation in the outer disc and in the pc-scale burst, leading to a that is roughly in the middle of the disc. The NSDs with the small are ones where the SFR in the pc-scale burst overwhelms all other star-formation in the disc. The dynamical times are Myrs for all models and are spread in vertical stripes because the Keplerian frequency of a disc at the outer radius depends only on and . For a fixed pair of and , there are 12 models exhibiting the same due to degeneracy into other parameters. Interestingly, the plot shows that the NSDs with pc-scale bursts are found at all , with a preference for the small NSDs to be found at the smaller , corresponding to lower and/or smaller disc sizes.
To help determine if a smaller or is more important in producing the pc-scale bursts, Figure 3 plots versus the at the center of the NSD.
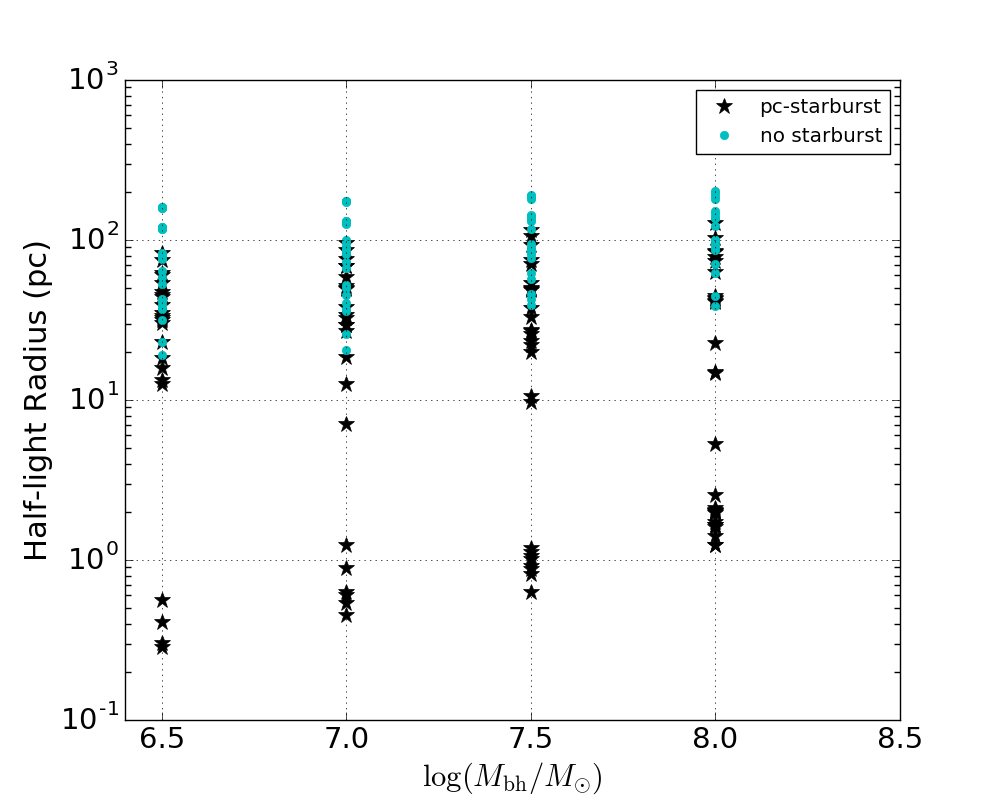
Compact NSDs with pc are seen at all , but are actually more common at larger with 15 at , as compared to only 4 at . This implies that a larger is a stronger factor than in producing the most powerful pc-scale bursts, in agreement with the results of the 1D calculations (Ballantyne, 2008). More massive black holes cause hotter and denser NSDs which more readily lead to dust sublimation and a small scale burst of star-formation. However, Fig. 3 also shows that the smallest are found in NSDs around the lowest mass SMBHs, so the size of the stellar remnant will be weakly correlated with .
3.2 Mass, Luminosity and Colours
The predicted mass and spectral properties of the remnant cluster at low redshift can only be calculated by assuming a star-formation history for the NSD models and evolving the stellar population in time. As before, the equilibrium radial structure computed for each NSD is assumed to be fixed during its lifetime. The radially-dependent SFR (e.g., Fig. 1) is then averaged to yield for each model, i.e.,
| (4) |
The star-formation history of each NSD model is then assumed to be a narrow Gaussian in time with a lifetime :
| (5) |
where , , and . The normalization constant () is chosen so that the stellar mass formed in the NSDs is equal to . The time corresponds to the age of the Universe at (i.e., Gyrs), when such NSDs may be common due to larger galaxy gas fractions (Gohil & Ballantyne, 2018).
The star cluster formed by this star-formation history is then evolved forward in time using Python-FSPS, the Python wrapper of the Flexible Stellar Population Synthesis code (FSPS v3.0) developed by Conroy, Gunn & White (2009) and Conroy & Gunn (2010). All FSPS calculations assume solar metallicity and a Kroupa (2001) initial mass function. The Kriek & Conroy (2013) model is used for the attenuation by dust around old stars. The characteristics of the remnant star clusters are computed assuming an observed redshift , giving an age of the stellar population of Gyr111The properties of the remnant cluster show negligible differences for other starting redshifts (e.g., or ) that yield final cluster ages Gyr.. Each FSPS calculation yields the survived stellar mass at , , and absolute magnitudes in a number of HST and Johnson filters.
3.3 Dynamical Evolution of
The calculation of described above (Eq. 2) is based on the radial distribution of stars in each model NSD. It is possible that dynamical effects could significantly alter this radial distribution in the Gyrs between the NSD event and . Therefore, it is important to consider how dynamics within the remnant stellar discs may impact the values of before comparing them to observed NSCs at low redshifts.
The stellar cluster produced by a NSD will be a rotating disc spanning from pc to – pc from the galactic center. The dynamical effects relevant to stars in the disc are nicely summarized by Kocsis & Tremaine (2011) in their Figure 1. It shows that a number of dynamical processes have timescales below Gyrs for discs with these sizes, including standard two-body relaxation, disc eccentricity relaxation, Newtonian precession, relativistic precession, vector resonant relaxation (VRR), and warps by a massive perturber (e.g., a molecular torus). With larger SMBH masses (), Lense-Thirring precession timescale can also be shorter than Gyrs in the inner edge of the disc.
However, most of these dynamical processes do not change the radial distribution of the stars significantly. Specifically, Newtonian precession and relativistic precession only change the pericenter orientation of the stellar orbits in their orbital planes. Similarly, VRR, Lense-Thirring precession and the warp of the disc redistribute orbital plane orientations of stars in the disc, and have only a minimal effect on the semi-major axes and the value of . In particular, a recent numerical study of VRR in stellar discs by Szöglén & Kocsis (2018) showed an interesting mass dependence in the final stellar distribution. Their simulations found that massive young stars were in a warped disc, but the less massive older stars were in a rotating, mostly spherical distribution. If VRR is important for the NSD remnants, then these results imply that at the stellar cluster will more closely resemble a rotating spheroidal system.
The effects of non-resonant relaxation (standard two-body relaxation and disc eccentricity relaxation) on stellar discs have been investigated numerically by Šubr & Haas (2014). These authors find that the relaxation processes scatter stars both inwards and outwards, which causes peaks in the semi-major axis distribution to be smoothed out to both higher and lower values. This numerical result can be rescaled for different SMBH masses and disc sizes, as noted by Šubr & Haas (2014). Therefore, even in cases where there is a peak in stellar density, such as in NSDs with pc, there will be no systematic shift in stellar density over time.
The stellar discs produced by NSDs may also be subject to spiral-arm instabilities (e.g., Lee & Goodman, 1999) at different points in its evolution. These instabilities cause mixing of stellar orbits as they pass through the gas, but, as with two-body relaxation, roughly equal numbers of stars are scattered inwards as outwards and there is no significant change in the surface density profile of the disc (Sellwood & Binney, 2002).
From the above discussion we conclude that the values of computed by eq. 2 will be an adequate estimate of the effective radii of the stellar remnants of NSDs at and can be compared to the measurements of nearby NSCs. In addition, the effects of VRR will likely produce a rotating, quasi-spherical remnant at low redshift.
4 Comparison to Low Redshift Nuclear Star Clusters
In this section the computed properties of the NSD remnants at are compared to observations of NSCs observed by HST in the local Universe. For reference, Table 2 provides the median , , , and absolute V-band magnitude, , for four different samples of the NSD models.
| Sample | Number | (Myr) | (pc) | ) | (mag) |
|---|---|---|---|---|---|
| All models | 192 | 0.92 | 50 | 6.3 | |
| No pc-scale burst | 88 | 0.98 | 87 | 6.1 | |
| pc-scale burst ( pc) | 69 | 0.98 | 43 | 6.6 | |
| pc-scale burst ( pc) | 35 | 0.4 | 1.2 | 6.3 |
We begin in Figure 4 by comparing and computed from the NSD models to a large number of NSC observations collected from the literature (Carollo et al., 1997; Carollo, Stiavelli & Mack, 1998; Böker et al., 2004; Seth et al., 2006, 2010; Leigh, Böker & Knigge, 2012; Georgiev et al., 2016).
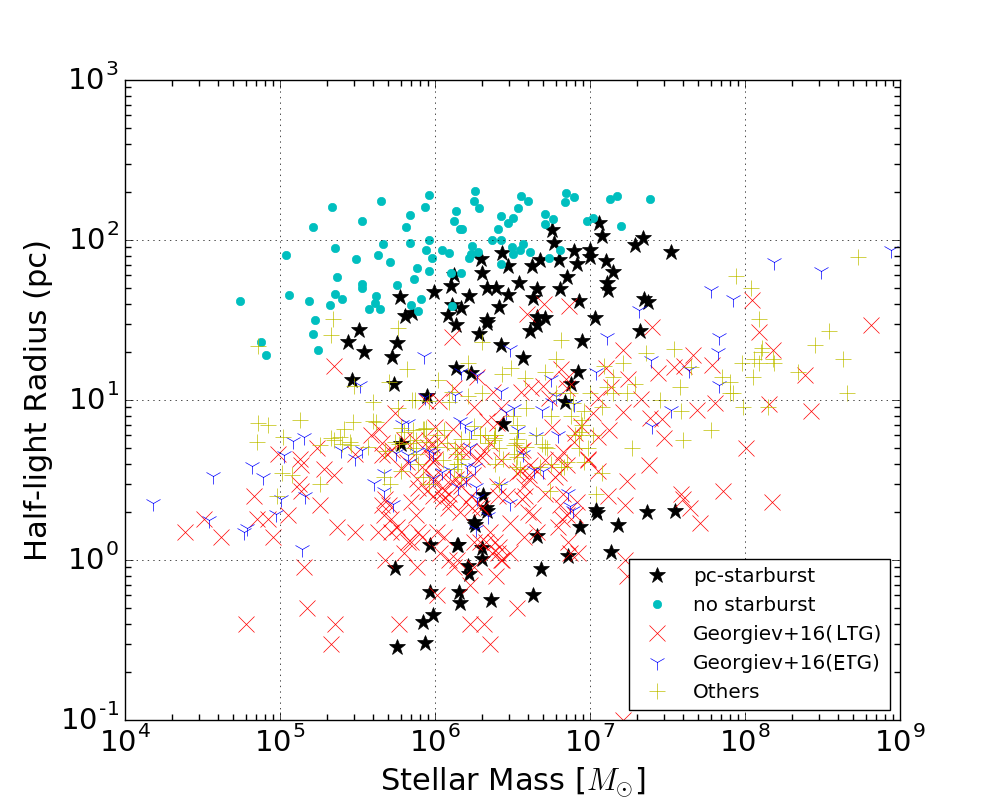
The majority of the NSC masses are computed photometrically using mass-to-light ratios (e.g., Georgiev et al., 2016), which could lead to an underestimate of the mass if a young stellar population was dominating the observed flux. However, dynamical NSC mass measurements (e.g., Seth et al., 2008a; Nguyen et al., 2018) agree with the photometric ones to within a factor of about , indicating that there is no large systematic error with the photometric masses. Therefore, the NSC masses plotted in Fig. 4 are likely good estimates of the mass of the older stellar population in NSCs, and the comparison to the NSD remnant masses will be valid.
Figure 4 shows that for all 192 models is in good agreement with the majority of the observed masses of local NSCs. In fact, the median remnant mass of predicted by the NSD models (Table 2) is in exact agreement with the median mass of the NSCs shown in the figure. However, there are disagreements at the edges of the mass distribution. In particular, the maximum NSD remnant mass is M⊙, more than an order of magnitude smaller than the maximum observed NSC masses. This supports the view that some NSCs are likely built up by a variety of processes over time, and a high- NSD may only be one of the possible mechanisms. It is also possible that the mismatch in maximum mass is due to our limited sampling of the potential parameter space and considering only a single NSD event during the lifetime of a galaxy. Overall, the strong agreement between and the observed NSC masses shows that the NSDs have the SFRs and lifetimes necessary to explain the old population of NSCs.
In contrast to the masses, most of the NSD remnants have significantly larger than the observed NSCs. The median predicted for the NSD remnants is pc (Table 2), an order of magnitude larger than the median of the observational sample ( pc). However, Fig. 4 shows that the group of NSD remnants with pc are in very good agreement with the properties of NSCs observed in predominantly late-type galaxies (LTGs; red ‘X’s; Georgiev et al. 2016) with median and very similar to the observations (last line of Table 2). These compact star clusters are predicted to arise from NSDs with the strongest pc-scale starbursts (e.g., Fig. 1). The scarcity of models at is likely due to the choice of model parameters. Fig. 3 shows that the smallest values obtained from the NSD models increase with the central mass. Therefore, NSD remnants with would be produced from models with M⊙ and M⊙ and would closely match the observed NSC sizes in early-type galaxies (ETGs; blue ‘Y’s; Georgiev et al. 2016). We conclude that NSDs with the strongest pc-scale starbursts can produce remnants with similar to those observed in local galaxies.
Figure 4 shows that the majority of NSD remnants have pc which is consistent with only a few observed NSCs hosted in both ETGs and LTGs. In general, such large values will be a common outcome from NSD models due to the relatively specific conditions needed to produce a strong pc-scale starburst (Ballantyne, 2008). This result implies that only the fraction of high- NSDs that produce the strongest smaller-scale bursts are a potential origin for the old population observed in local NSCs.
Another important observational property of local NSCs is a size-luminosity relation (Georgiev & Böker, 2014). Figure 5 compares this observed relation (red line; Georgiev & Böker 2014) with the predictions of the NSD remnants. The shaded uncertainty region encompasses the majority of the observed NSCs from Georgiev & Böker (2014).
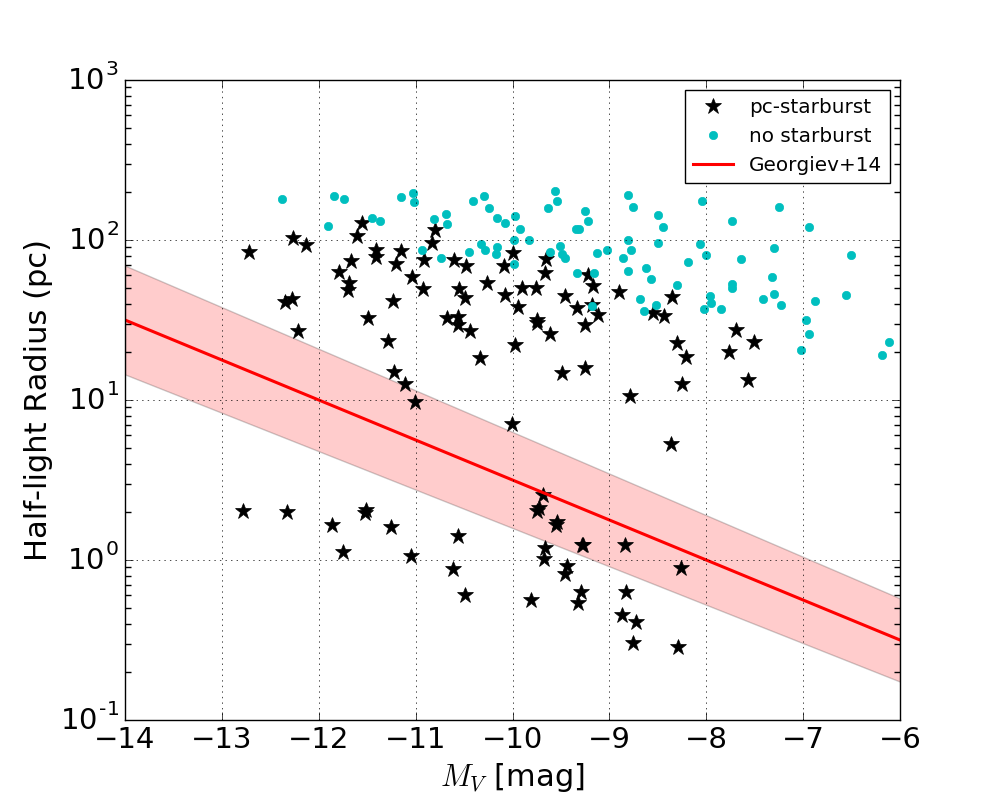
As seen in Fig. 4, most of the NSD remnants have too large for their luminosity, but there is a group of remnants that are predicted to lie within or very close to the observed size-luminosity relationship.
It is clear that all three sub-groups of NSD remnants follow a size-luminosity relationship of the form , with measured to be . This value is roughly smaller than the observed slope of found by Georgiev & Böker (2014). As the predicted slope does not take into account the effect of the local galaxy SMBH function on the weighting of the model parameters, the agreement of the two slopes is considered satisfactory. The values of predicted for the NSD remnants are also well matched with the observed values (median ; Table 2) which is not surprising since the masses are in good agreement and the luminosities are calculated using standard mass-to-light ratios (Conroy, Gunn & White, 2009).
The NSD models require the presence of a SMBH, and, as seen in Sect. 3, the more massive the central SMBH, the more likely a compact starburst will develop at high-. It is therefore interesting to consider the relationship between the observed properties of the predicted NSD remnant and the SMBH. Figure 6 plots as a function of for the NSD remnants.
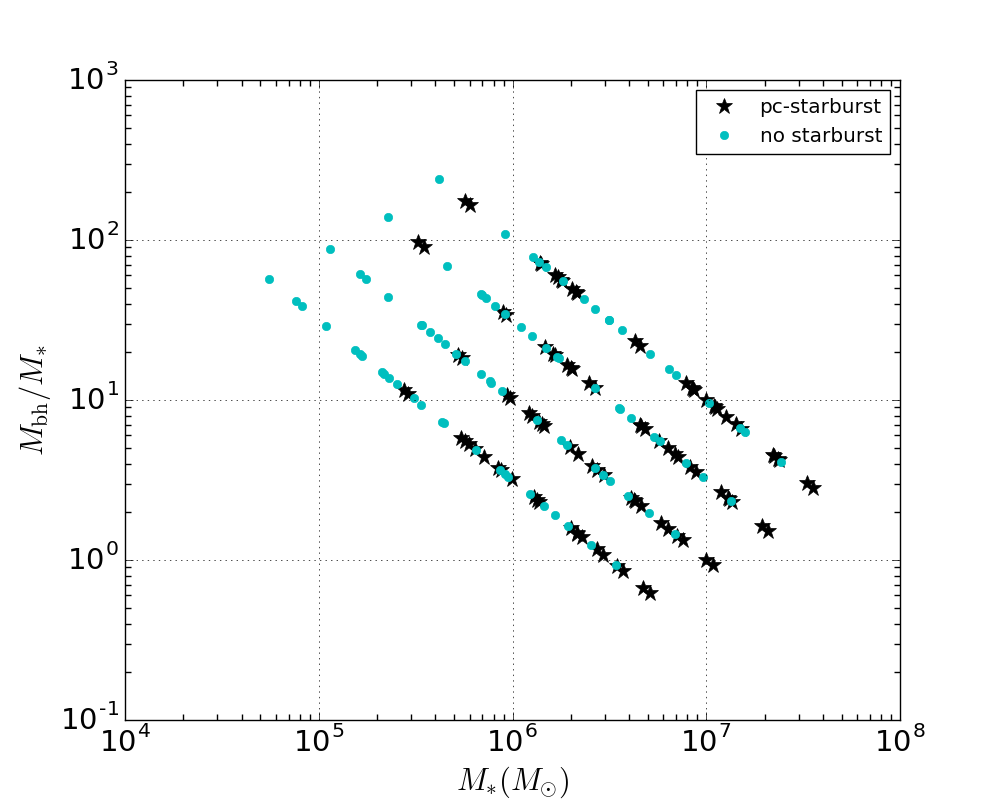
The four stripes on the figure correspond to the four SMBH masses used in the calculations (Table 1), with the values decreasing from M⊙ to M⊙ as one goes from top to bottom in the plot. The most massive and therefore the most luminous stellar remnants are produced by NSDs around the most massive SMBHs. However, these SMBHs can also produce much less massive remnants. Indeed, except at the most massive end, the NSD theory admits stellar remnants with similar masses and sizes to local NSCs at all SMBH masses. Measurements of NSC and SMBH masses from the same galaxies are relatively rare, but current data shows that ratios are frequently found in ETGs, but are observed for only a few LTGs (Georgiev et al., 2016; Nguyen et al., 2018).
As a final sanity check, the WFPC2 colours F606WF814W and F450WF814W were computed for the stellar remnants and were found to be and , respectively. These values are consistent with the NSC colours observed by Georgiev & Böker (2014) and the expectations for a Gyr-old population.
5 Discussion & Summary
The origin of NSCs and their relationship to SMBHs have long been an interesting question in galaxy formation studies. NSCs are frequently present in many types of galaxies, and possess a significant older stellar population, indicating that a large fraction of the cluster has been in place for several Gyrs. This paper argues that this old stellar population in NSCs may be the remnant of a NSD that was present in the galaxy at . NSDs may be a common feature around growing SMBHs during an AGN phase at high- due to the large gas fractions within galaxies at this time. Previous work has shown that they provide a natural origin for the absorbing gas that obscures most AGNs at (Gohil & Ballantyne, 2017, 2018). Importantly, NSDs require the presence of a SMBH, but the size and mass of the remnant cluster depend only weakly on the SMBH mass (e.g., Fig. 6). Therefore, the NSD theory provides an explanation for the complex observed relationship between NSCs and a central SMBH (e.g., Georgiev et al., 2016; Nguyen et al., 2018). However, as there are (typically, low-mass) galaxies with a NSC and no SMBH (e.g., NGC 205; Nguyen et al. 2018) the NSD mechanism proposed here will not be relevant for all galaxies.
We presented several quantitative comparisons in support of a NSD origin for the old stellar population of NSCs in galaxies with SMBHs. First, the predicted masses, colours and luminosities of the remnant stellar cluster correspond nearly exactly to those observed in NSCs (Figs. 4 and 5). This result only relied on the calculated equilibrium SFRs in each NSD and the dynamical time of the discs. Therefore, these predictions are a natural outcome of the star-forming properties of the disc. If NSDs are common in galaxies at than remnant clusters will likely exist with these properties. Secondly, the predicted of the remnant clusters follow a similar size-luminosity relations as observed in local NSCs (Fig. 5). Finally, the ratio of the remnants is also consistent with observations of local NSCs (Fig. 6).
Only % of the remnants had values consistent with the majority of local NSCs (Fig. 4), with the remainder being too large by about an order of magnitude, although this fraction depends on the sampling of the NSD parameter space that was explored (for example, models with larger would result in more remnants with pc). This result suggests that NSDs are a viable origin for NSCs only when there is a very powerful pc-scale starburst in the NSD at . This scenario is predicted to be most common in galaxies with a large SMBH mass (Fig. 3). Therefore, NSDs may be a viable origin for NSCs in early-type galaxies (as supported by the large ratios) and in late-type galaxies with large masses (e.g., M31). While dynamical evolution of the stellar distribution in NSD remnants will likely not significantly impact (Sect. 3.3), VRR will cause the final remnant to be both rotating and roughly spherical, consistent with the observed shape of the old populations of NSCs in some galaxies (Seth et al., 2008b; Carson et al., 2015).
In summary, it appears that the NSDs with strong pc-scale starbursts at could be the origin of the old populations of local NSCs around massive SMBHs. Indeed, the stellar remnants predicted by this type of NSDs have sizes, colours and luminosities similar to many nearby NSCs. The stellar remnants are also expected to be rotating and have evolved into a near spherical distribution. Testing the predictions presented here will require both new observational and theoretical work. A clear prediction of our NSD model is that the most massive NSCs will be associated with the most massive SMBHs. Based on this result, ETGs may provide the best test cases for the NSD origin hypothesis, as these galaxies appear to consistently have the large ratios predicted by the theory. Furthermore, the lower gas content in the nuclei of ETGs will allow for easier charcterization of the old NSC population. Increasing the number of accurate NSC and SMBH mass measurements in both early- and late-type galaxies will also be important in testing the theory. However, the most compelling test of the model will be to search for evidence of NSDs in galaxies at , either through a combination of multi-wavelength measurements (Ballantyne, 2008), or by direct imaging using instruments carried by the James Webb Space Telescope. Once the incidence of NSDs is known at high-, then the origin of many nearby NSCs may become much clearer. Lastly, it remains likely that most nearby NSCs will have undergone several episodes of growth, possibly driven by different mechanisms. Therefore, careful observational decomposition of the star clusters (e.g., Kacharov et al., 2018) will continue to be an important tool in understanding the origin of NSCs.
Acknowledgments
The authors thank A. Seth and D. Nguyen for providing the NSC observational data used in this paper, and the anonymous referee for helpful comments that improved the manuscript.
References
- Agarwal & Milosavljević (2011) Agarwal M., Milosavljević M., 2011, ApJ, 729, 35
- Andersen et al. (2008) Andersen D.R., Walcher C.J., Böker T., Ho L.C., van der Marel R.P., Rix, H.-W., Shields J.C., 2008, ApJ, 688, 990
- Antonini (2013) Antonini F., 2013, ApJ, 763, 62
- Antonini, Barausse & Silk (2015) Antonini F., Barausse E., Silk J., 2015, ApJ, 812, 72
- Arca-Sedda & Capuzzo-Dolcetta (2014) Arca-Sedda M., Capuzzo-Dolcetta R., 2014, MNRAS, 444, 3738
- Ballantyne (2008) Ballantyne D.R., 2008, ApJ, 685, 787
- Ballantyne, Armour & Indergaard (2013) Ballantyne D.R., Armour J.N., Indergaard J., 2013, ApJ, 765, 138
- Böker et al. (2002) Böker T., Laine S., van der Marel R.P., Sarzi M., Rix H.-W., Ho L.C., Shields J.C., 2002, AJ, 123, 1389
- Böker et al. (2004) Böker T., Sarzi M., McLaughlin D.E., van der Marel R.P., Rix H.-W., Ho L.C., Shields J.C., 2004, AJ, 127, 105
- Carollo et al. (1997) Carollo C.M., Stiavelli M., de Zeeuw P.T., Mack J., 1997, AJ, 114, 2366
- Carollo, Stiavelli & Mack (1998) Carollo C.M., Stiaveilli M., Mack, J., 1998, AJ, 116, 68
- Carson et al. (2015) Carson D.J., Barth A.J., Seth A.C., den Brok, M., Cappellari M., Greene J.E., Ho L.C., Neumayer N., 2015, AJ, 149, 170
- Conroy, Gunn & White (2009) Conroy C., Gunn J.E., White M., 2009, ApJ, 699, 486
- Conroy & Gunn (2010) Conroy C., Gunn J.E., 2010, ApJ, 712, 833
- Côté et al. (2006) Côté P., et al., 2006, ApJS, 165, 57
- Elmegreen (1997) Elmegreen B., 1997, Rev. Mex. Astron. Astrofis., 6, 165
- Genzel et al. (2010) Genzel R., et al., 2010, MNRAS, 407, 2091
- Georgiev & Böker (2014) Georgiev I.Y., Böker T., 2014, MNRAS, 441, 3570
- Georgiev et al. (2016) Georgiev I.Y., Böker T., Leigh N., Lützgendorf N., Neumayer N., 2016, MNRAS, 457, 2122
- Gohil & Ballantyne (2017) Gohil R., Ballantyne D.R., 2017, MNRAS, 468, 4944
- Gohil & Ballantyne (2018) Gohil R., Ballantyne D.R., 2018, MNRAS, 475, 3543
- Graham & Spitler (2009) Graham A.W., Spitler L.R., 2009, MNRAS, 397, 2148
- Guillard, Emsellem & Renaud (2016) Guillard N., Emsellem E., Renaud F., 2016, MNRAS, 461, 3620
- Hinshaw et al. (2013) Hinshaw G., et al., 2013, ApJS, 208, 19
- Kacharov et al. (2018) Kacharov N., Neumayer N., Seth A.C., Cappellari M., McDermid R., Walcher C.J., Böker T., 2018, MNRAS, 480, 1973
- Kennicutt (1998) Kennicutt R.C., Jr, 1998, ApJ, 498, 541
- Kocsis & Tremaine (2011) Kocsis B., Tremaine S., 2011, MNRAS, 412, 187
- Kriek & Conroy (2013) Kriek M., Conroy C., 2013, ApJ, 775, L16
- Kroupa (2001) Kroupa P., 2001, MNRAS, 322, 231
- Lee & Goodman (1999) Lee E., Goodman J., 1999, MNRAS, 308, 984
- Leigh, Böker & Knigge (2012) Leigh N., Böker T., Knigge C., 2012, MNRAS, 424, 2130
- Lyubenova et al. (2013) Lyubenova M., et al., 2013, MNRAS, 431, 3364
- Matthews et al. (1999) Matthews L.D., et al., 1999, AJ, 118, 208
- Milosavljević (2004) Milosavljević M., 2004, ApJ, 605, L13
- Nguyen et al. (2018) Nguyen D.D. et al., 2018, ApJ, 858, 118
- Rossa et al. (2006) Rossa J., van der Marel R.P., Böker T., Gerssen J., Ho L.C., Rix H.-W., Shields J.C., Walcher C.J., 2006, AJ, 132, 1074
- Sellwood & Binney (2002) Sellwood J.A., Binney J.J., 2002, MNRAS, 336, 785
- Seth et al. (2006) Seth A.C., Dalcanton J.J., Hodge P.W., Debattista V.P., 2006, AJ, 132, 2539
- Seth et al. (2008a) Seth A., Agüeros M., Lee D., Basu-Zych A., 2008a, ApJ, 678, 116
- Seth et al. (2008b) Seth A., Blum R.D., Bastian N., Caldwell N., Debattista V.P., 2008b, ApJ, 687, 997
- Seth et al. (2010) Seth A.C., et al., 2010, ApJ, 714, 713
- Silk (1997) Silk J., 1997, ApJ, 481, 703
- Šubr & Haas (2014) Šubr L., Haas J., 2014, ApJ, 786, 121
- Szöglén & Kocsis (2018) Szölgyén Á., Kocsis B., 2018, Phys. Rev. Lett., 121, 101101
- Thompson et al. (2005) Thompson T.A., Quataert E., Murray N., 2005, ApJ, 630, 167
- Turner et al. (2012) Turner M.L., Côté P., Ferrarese L., Jordán A., Blackslee J.P., Mei S., Peng E.W., West M.J., 2012, ApJS, 203, 5
- Walcher et al. (2005) Walcher C.J., van der Marel R.P., McLaughlin D., Rix H.-W., Böker T., Häring N., Ho L.C., Sarzi M., Shields J.C., 2005, ApJ, 618, 237