Challenges of interpreting dielectric dilatometry for the study of pressure densification
Abstract
We report an experimental study documenting the challenge of employing dielectric dilatometry for the study of pressure densification in glass-forming materials. An influence of the dielectric cell geometry on the resulting capacitance of 5-poly-phenyl-ether upon vitrification under different thermobaric pathways is documented. The capacitive response is studied for two different multilayer capacitors: one with, in principle, fixed plate distance and one with Kapton spacers allowing for contraction/expansion. A combination of changes in the dielectric permittivity of the material and modifications of the capacitor geometry determines the final capacitance. We conclude that, in order to convert the measured capacitance to material density, it is of paramount importance to understand the geometry. The data presented do not make it possible to conclude on whether or not simple glass formers such as 5-poly-phenyl-ether can be pressure densified, but our work highlights the challenge of utilizing dielectric spectroscopy to tackle this problem effectively.
- PACS numbers
-
64.70.kj, 64.70.pm, 62.50.-p, 77.22.-d.
pacs:
Valid PACS appear hereI Introduction
Density as a function of temperature and pressure is among the most fundamental thermodynamic and structural parameters of a glass-forming liquid, and the abrupt change in the temperature and pressure derivatives of density, the thermal expansion coefficient and the compressibility, are a principal signature of the glass transition Niss and Hecksher (2018). Low-molecular-weight glass-forming liquids are often used in fundamental research on the glass transition Ediger (2000); Debenedetti and Stillinger (2001); Qin and McKenna (2006); Nielsen et al. (2009); Hecksher et al. (2008). However, measuring the density in the glass transition region is difficult for these liquids due to their low glass transition temperatures. Most techniques for measuring density rely on a confining liquid and are limited by the temperature-pressure range where it is in its liquid state, e.g. mercury which has a melting point of 234.3 K at atmospheric pressure. This challenge has the consequence that a fundamental result like density scaling to a large extent is based on extrapolated density data when it comes to molecular liquids Romanini et al. (2017); Grzybowski et al. (2011); Hansen et al. (2018a).
An alternative method for measuring density is dielectric dilatometry Bauer et al. (2000); Niss et al. (2012). This technique makes use of the fact that the dielectric constant of a material depends on the number density of molecules (and number density is proportional to mass density, as long as no chemical reactions take place). The advantage of dielectric dilatometry is that it can be measured with very high precision and that it can be applied at low temperatures. The method has been used in several studies of scanning dilatometry of polymer films where it has the additional advantage of getting more precise with a thinner film Bauer et al. (2000); Fukao and Miyamoto (2001); Yin et al. (2012); Inoue et al. (2018). It has also been used for measuring the dynamic linear expansion coefficient where the high precision gained by this method is crucial for obtaining the resolution needed to measure in the linear range Bauer et al. (2000); Niss et al. (2012); Niss (2017). Recently, the method has been employed to study pressure densification of a molecular glass Casalini and Roland (2017a). While dielectric dilatometry has potential to be used more in the field, it also has some limitations. In this paper we investigate these limitations with a focus on the challenges connected to study pressure densification.
Pressure densification refers to a situation where a glass formed by cooling at elevated pressures and subsequently decompressed in the glassy state, has a higher density than a glass of the same material formed by cooling at low pressures. It is a physical phenomenon widely known in inorganic glasses, such as silica Tse et al. (1992); Della Valle and Venuti (1996); Rouxel et al. (2008), that can be used for tuning its optical properties Masuno et al. (2016). Roland and colleagues recently proposed a new approach for examining pressure densification from a more fundamental point of view. They suggested examining the problem under the framework of the isomorph theory Casalini and Roland (2017a); Fragiadakis and Roland (2017); Casalini and Roland (2017b), which predicts the existence of isomorphs in the so-called R-simple systems Dyre (2014). Pressure densification is also a long-standing topic in the physics of polymeric materials that has been investigated both experimentally and theoretically, for instance in polymethylmethacrylate (PMMA) and in other amorphous polymers Kimmel and Uhlmann (1970); Destruel et al. (1984); Casalini and Roland (2017b). Pressure densification has also been studied in polymeric systems by computer simulations Fragiadakis and Roland (2017). The fact that PMMA can be pressure densified is somewhat surprising since this polymer conforms with isochronal superposition and density scaling Casalini and Roland (2004), and therefore it is likely to behave as a ”Roskilde-simple system” (R-simple) according to the isomorph theory Gnan et al. (2009); Dyre (2014).
The increase in density of glasses prepared under high pressure was found to vary from 1-2 % in molecular glasses and polymers to more than 15 % in inorganic materials Danilov et al. (2016); Kimmel and Uhlmann (1970); Rouxel et al. (2008). Casalini and Roland proposed a metric for the degree of densification in terms of the relative changes in specific volume for vitrification at high and low pressures. This so-called pressure densification ratio, , was estimated to be around 25 % for densification pressures between 300 and 570 MPa in the molecular glass-former tetramethyl-tetraphenyl-siloxane (DC704) Casalini and Roland (2017a).
The recent interest in pressure densification from a more fundamental point of view is sparked by the prediction that R-simple liquids cannot be pressure densified Gnan et al. (2010); Fragiadakis and Roland (2017). Isomorph theory predicts that all glasses formed along the same glass-transition isochrone (for example formed with the same cooling rate at different pressures) will have the same microscopic structure, except for the average distance between the molecules which will scale with the qubic root of the inverse density. If the pressure is released on a glass formed at high pressure, then the average molecular distance will increase, and the glass will attain the same density as the glass formed at lower pressures. This has been supported by simulations but some experiments contradict this prediction Danilov et al. (2016); Casalini and Roland (2017a, b).
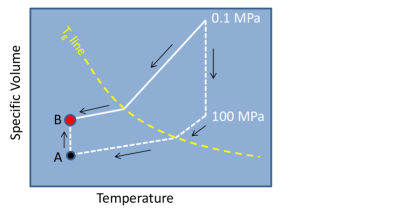
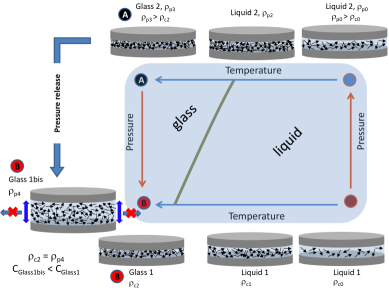
In this study, we have investigated experimentally two temperature-pressure protocols, using two different dielectric cells in order to highlight the role of macroscopic geometry in these experiments. A schematic description of the phase diagram explored in this work is illustrated in Fig. 1.
In the following section we present the fundamental principle of dielectric dilatometry. In section III we present the experimental method. Section IV presents the results which are analyzed and discussed in section V.
II Background: Dielectric dilatometry
The fundamental assumption that needs to be fulfilled in order to use dielectric dilatometry is that the high-frequency dielectric permittivity, , only depends on density in the part of pressure-temperature diagram where it is measured. On a quantitative level, the high-frequency dielectric permittivity is connected to molecular properties using the Clausius-Mossotti (CM) relation Böttcher (1973):
| (1) |
where is the polarizability of a single molecule, is the number density of molecules and is the vacuum permittivity. It is seen from this expression that needs to be temperature and pressure independent in order for the method to be viable for determining . In contrast, the polarization due to rotation of permanent dipoles is highly pressure and temperature dependent in glass-forming liquids. In fact, dielectric spectroscopy is among the most commonly applied techniques to investigate dynamics of glass-formers Schönhals and Kremer (2003); Hecksher et al. (2008). However, the rotational contribution is frozen out as the glass transition is approached, and if measurements are performed at high frequencies close to the glass transition, the rotational contribution can in many cases be assumed to be negligible. Besides rotation of permanent dipoles, the other contribution to is the atomic polarization due to deformation of the electron cloud. The atomic polarization takes place instantaneously and it can be assumed to be constant as long as temperatures are much lower than the electronic binding energies. Given the local character of the induced atomic polarization and the modest pressures used in the present study, atomic polarization can be considered pressure-independent, as well.
The CM-relation is derived as a mean field approximation, and is not expected to be exact. Deviations from CM may influence the absolutes values found from the method, but will not affect temperature, pressure or time dependence found of the thermal expansion coefficient or the bulk modulus (see Ref. Niss et al. (2012) for details).
Given the connection between density and dielectric constant, the next step is to connect the measured capacitance with the dielectric constant. In the simple case with a capacitor completely filled with sample liquid one has
| (2) |
where is the empty capacitance which is determined by the geometry of the capacitor. For a parallel plate geometry it is given by , with the distance between the plates and the area.
The measured change in capacitance, following an applied temperature or pressure variation, is a combined effect of the change in dielectric constant and the change in the geometric capacitance
| (3) |
The use of dielectric dilatometry consequently relies on assumptions regarding how the geometrical capacitance responds to pressure and temperature changes. What the adequate assumptions are, depend on the design and materials of the capacitor.
In the studies of polymeric films by dielectric dilatometry, the standard construction is one where the electrodes of the capacitor are directly mounted on the sample, such that the distance between the electrodes is determined by the thickness of the polymeric film Schönhals and Kremer (2003). In this case, both terms in Eq. (3) contribute and they are both proportional to the density. In our previous studies of molecular liquids, a similar assumption was used Niss et al. (2012); Niss (2017). The electrodes were separated by soft spacers which made it possible to fill the capacitor with the sample in its fluid state at room temperature. In the glass transition region, where the measurements were performed, it was assumed that the sample determined the electrode distance. This assumption is based on the consideration that a glass (or a liquid close to the glass-transition) is unable to flow in the small gap between the electrodes, and that the stiffness of the glassy (or almost glassy) sample outmatches that of the soft spacers (see Ref. Niss et al. (2012) for details).
In the studies of pressure densification in Ref. Casalini and Roland (2017a), the capacitor used was an air capacitor of the kind similar to those used in old radios. In this case, there are no spacers between the electrodes, and it is a metallic scaffold which keeps the distance between electrodes. The authors therefore assumed that the geometric capacitance was unchanged during the experiment and that the measured capacitance was only affected by the change in dielectric constant, determined by the number of molecules in the fixed sample volume. This assumption implies that the sample is able to flow in and out of the capacitor. However, when working with a sample below the glass transition (as was the case in the crucial part of the experiment) this assumption is questionable. A glass or even a highly viscous liquid does not flow unless waiting times several orders of magnitude longer than the alpha relaxation time are inferred Niss et al. (2012) (depending on the capacitor geometry).
III EXPERIMENTAL DETAILS AND MEASURING PRINCIPLE
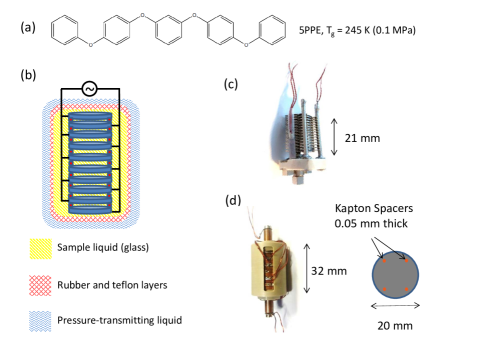
To investigate the role of capacitor geometry and boundary conditions on pressure densification results, we have studied the same sample with different protocols using two different capacitors. The sample studied is the van der Waals liquid 5-poly-phenyl-ether (5PPE). The sample, with chemical structure shown in Fig. 2(a), was purchased from Santolubes and used as received. Due to its relatively high glass transition temperature () at atmospheric pressure, 245 K, 5PPE suits the technical specifications of our high-pressure dielectric setup. Furthermore, 5PPE fulfils several prerequisites to be considered an R-simple liquid Roed et al. (2013, 2015); Hansen et al. (2018a, b), just like tetramethyl-tetraphenyl-siloxane studied in Ref. Casalini and Roland (2017a). In 5PPE we thus expect the existence of isomorphs, that is, lines in the phase diagram along which several structural, dynamic and thermodynamic properties are invariant Roed et al. (2013); Dyre (2014); Roed et al. (2015); Hansen et al. (2018a, b). Isomorphs are also isochrones, which are curves in the phase diagram with constant relaxation time.
Two different multilayer capacitors were used in the study; an air capacitor and a home-built capacitor with Kapton spacers. Figure 2(c) shows a picture of the air capacitor. It is similar to that used in Ref. Casalini and Roland (2017a) and has no spacer material, because the electrode plates are kept apart by the metallic scaffold. The distance between the electrode plates is in the order of half a millimeter and the empty capacitance is 85 pF when measured at ambient conditions. Figure 2(d) shows the home-built multilayer capacitor. The separation between the metallic electrodes is maintained by four spacers made of Kapton (50 m thick). The spacers determine the distance when the capacitor is empty or filled with a low viscosity liquid, while the sample itself will determine the distance between the plates for viscosities high enough that the sample cannot flow Niss et al. (2012). Twelve plates are stacked on top of each other forming eleven capacitors in parallel giving a total empty capacitance at ambient conditions of approximately 560 pF.
In both cases, once the dielectric capacitor is filled with the liquid under study at room temperature, it is immersed in a rubber container full of the same sample liquid. This reservoir makes it possible for extra liquid to flow into the capacitor as the liquid contracts upon cooling, a flow that, notably, is only possible at low-viscosity conditions. Successive rubber and teflon layers shield the sample from the pressure-transmitting medium. This configuration is illustrated in the schematic drawing of Fig. 2(b). Detailed information about the dielectric hardware and high-pressure equipment can be found elsewhere Igarashi et al. (2008); Xiao et al. (2015).
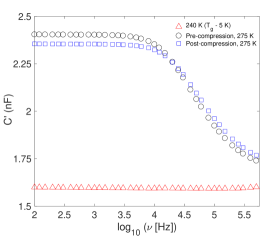
We explored the phase diagram of Fig. 1 by controlling pressure and temperature along the two different pathways. Figure 3 shows the real part of the capacitance for 5PPE at atmospheric pressure at two different temperatures, 275 and 240 K, where the signal is dominated by rotational and atomic polarization respectively. In order to evaluate the phenomenon of pressure densification, similar spectra to that shown in Fig. 3 for 240 K ( - 5 K) were analyzed. At 275 K, the signal is dominated by the alpha relaxation of 5PPE and Fig. 3 displays two curves at this temperature, taken before and after compression to 100 MPa. Given the fact that both data at 275 K look similar, it seems plausible that the geometry of the home-built multilayer capacitor is nearly unmodified by compression to 100 MPa. To ensure that rotational polarization does not interfere with our data, the material density was inferred from the capacitance at 240 K and only the high-frequency flank of the spectra was taken into account.
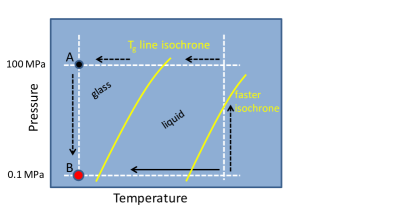
The protocol used for the experiment is shown in Fig. 4. The state-point designated by the red circle (point B) was reached by the routes indicated by the solid and dashed black lines. In one case, the sample was cooled at atmospheric pressure, while in the second scenario the sample was first compressed at high temperatures, then cooled to the same temperature (point A), and finally decompressed to 0.1 MPa. We employed the same cooling rate in both cases. The same thermobaric protocol was applied on both capacitors.
IV RESULTS FROM THE TWO DIFFERENT CAPACITORS
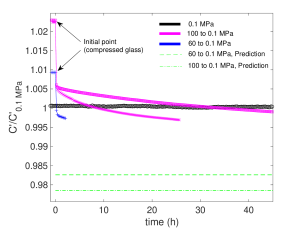
Data from the air capacitor shown in Fig. 2(c) are presented in Fig. 5. We report the real part of the capacitance at a fixed frequency of 10 kHz for 5PPE glasses formed following the paths detailed in Fig. 4. Data are normalized to the capacitance of the 0.1 MPa glass and shown as a function of time. We studied decompression jumps from 100 and 60 MPa to ambient pressure. Black symbols correspond to a glass formed upon cooling at 0.1 MPa. When the glass is produced at the same cooling rate but starting from a liquid compressed at 100 (magenta) or 60 MPa (blue), the capacitance is significantly higher in comparison to the low-pressure glass, which is expected for a denser material Naoki and Koeda (1989); Schönhals and Kremer (2003). Then, pressure was released to 0.1 MPa, producing an immediate effect on the capacitive response as shown in Fig. 5. The capacitance suddenly decreases upon decompression and further decreases as a function of time. In the case of the pressure jump from 60 MPa, the capacitance immediately goes below the ambient pressure value, and this also happens after 8-30 hours in the case of the jumps from 100 MPa.
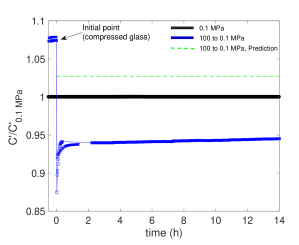
In Fig. 6 we show data from the home-built capacitor with Kapton spacers. As stated above, the protocol used was the same as for the air capacitor. In this case, data are shown for 100-to-0.1 MPa jumps. It is seen that the capacitance of the post-compressed glass sample immediately goes below the normal glass value. It makes a fast undershoot and stays stable already after less than an hour.
V DISCUSSION
Studying the same sample using the same protocol but in two different capacitors clearly shows that the results depend not only on the properties of the glass but also on the sample capacitor. This emphasizes how important it is to understand the sample geometry when analyzing dielectric data in the aim of extracting density information. Another important result is that the capacitance measured after releasing pressure depends on time, particularly when using the air capacitor, which was also used in Ref. Casalini and Roland (2017a), where the authors unfortunately do not report how the the pressure release affects the measured permittivity as a function of time.
If the glass formed at high pressure has higher ambient-pressure density than the glass formed at lower pressure, as is the case if the sample experiences pressure densification, the measured capacitance is higher in the densified sample. This would be the case due to the higher number density if the geometry is identical at the end of the two protocols, as assumed in Ref. Casalini and Roland (2017a). Moreover, if the sample is compressed in the direction normal to the electrodes, the effect would be enhanced due to the shorter distance between the plates.
What we find in Fig. 5 and 6 is not a higher measured capacitance after the high pressure protocol, but in fact the opposite, a lower capacitance. This can be understood by the following argument. The glass at high pressure (point A) has a higher density than the glass at lower pressure (point B). With the higher density, most scenarios also lead to more dipoles in absolute numbers between the electrodes of the capacitor than in the low pressure glass. It is for example obvious that high density leads to a larger number of dipoles in the case where it is assumed that the capacitor has the same geometry at high and low pressures. If there is no pressure densification, then the glass formed at high pressure will attain the density of the low pressure glass when the pressure is released. However, since it is a glass, it cannot flow, and it will be clamped in the tangential direction to the electrode plates. The only way to expand is normal to the electrodes and this will be done by pushing the electrodes apart (point B in Fig. 7, Glass 1bis). Consequently, the final result will be one where the glass formed at high pressure is in a capacitor with a larger distance between the electrodes and thus lower empty capacitance, while the actual density and dielectric constant of the two samples is the same. In the home-built capacitor, where there is no force keeping the electrodes together, this will happen abruptly, while it will happen to a lesser extent, and possible over time, in the air capacitor where it requires bending of the electrodes. The slow response seen in the air capacitor could also be due to actual flow taking place. At 240 K, the alpha relaxation time for 5PPE is estimated to be s and with a distance between the plates of 0.2 mm (air capacitor), this gives a characteristic flow-time of s, following the argument in Ref. Niss et al. (2012). This flow time is long compared to the time scale of our experiment.
Considering the case of the home-built capacitor, we can try to make a quantitative prediction of what a pure longitudinal expansion would give, starting from the value of the capacitance measured at high pressure. Assuming that the glass does not expand tangentially to the electrodes as the pressure drops, i.e., that it can only expands along the normal direction, the derivative of with respect to pressure following Eq. (2) is given by
| (4) |
Given that the longitudinal isothermal compressibility is defined as
| (5) |
where l corresponds to the distance between the electrodes (dimension in the direction of the flow), Eq. (4) can be written as Niss et al. (2012)
| (6) |
with .
At 0.1 MPa and 240 K, for 5PPE takes a value of 3.4 approximately. Thus, Eq. (6) can be reduced to
| (7) |
where M is the isothermal longitudinal modulus which is defined as the inverse of the longitudinal isothermal compressibility Kittel (1996). The longitudinal modulus is given by the bulk, , and shear, , moduli for isotropic solids through the equation . From the longitudinal modulus and, by means of Eq. (7), we can make a prediction of the measured capacitance for a 5PPE glass after releasing pressure. This is possible thanks to the availability of data for and for 5PPE at temperatures close to 240 K Hecksher (2011).
The decrease in capacitance calculated from this procedure for the home-built capacitor is shown as a green dashed line in Fig. 6. Curiously, the measured decrease in capacitance is much stronger, than what we get from this calculation. This could be due to cracking of the sample as a consequence of the abrupt change in pressure. This would lead to an even larger distance between the electrodes than a simple expansion. The resulting capacitance after decompression predicted by Eq. 7 is also shown in Fig. 5 for the air capacitor.
In Fig. 7 we show a schematic description of the situation explained above that allows one to understand why the post-compression glass presents a lower capacitance than the normal one. The number density of dipoles between the electrodes as a function of temperature and pressure is illustrated for the normal (Glass 1), compressed (Glass 2) and post-compression (Glass 1bis) glasses. The existence of isomorphs in strongly correlating liquids gives a theoretical foundation for arguing that, on cooling, both normal and compressed glasses of 5PPE explore state points in the phase diagram that remain quasi-isomorphic Gnan et al. (2009); Fragiadakis and Roland (2017). Therefore, post-compression and normal glass should have similar densities that, together with the longitudinal expansion of the glass in the normal direction, would give rise to a lower value of the capacitance for the post-compression glass as indicated at the bottom of Fig. 7 (Glass 1bis, point B).
VI CONCLUSIONS
Our data do not match the results reported by Casalini Casalini and Roland (2017a) on DC704 and do not indicate any significant pressure densification effects in 5PPE. While a signature of pressure densification would have given rise the capacitance to values higher than those shown by the 0.1 MPa glass, we observe here that the post-compression glasses present even lower values. In the case of the air capacitor we only see the lower values after significant waiting time. The discrepancy between the results could be explained if the data shown in Ref. Casalini and Roland (2017a) were measured immediately after the pressure was released.
We cannot determine on whether or not simple glass formers such as 5PPE can be pressure densified, but this investigation has highlighted the challenge of utilizing dielectric spectroscopy to tackle this problem effectively. The measured capacitance depends not only on the dielectric constant, but also on the geometry of the capacitor. In order to convert the measurements to density it is therefore crucial to understand the geometry. By comparing the results from two different capacitors with the same sample and protocol, we have demonstrated the importance of the geometry. Moreover, it should be stressed that a glass cannot be assumed to flow until waiting times are much longer than the alpha relaxation time. Density changes when releasing pressure in the glassy state therefore must take place by a solid-like type of deformation, which involves distortion of the dielectric cell.
Acknowledgements.
This work is supported by the VILLUM Foundation grant Matter (16515).References
- Niss and Hecksher (2018) K. Niss and T. Hecksher, The Journal of Chemical Physics 149, 230901 (2018).
- Ediger (2000) M. D. Ediger, Annual Review of Physical Chemistry 51, 99 (2000).
- Debenedetti and Stillinger (2001) P. Debenedetti and F. Stillinger, Nature 410, 259 (2001).
- Qin and McKenna (2006) Q. Qin and G. B. McKenna, Journal of Non-Crystalline Solids 352, 2977 (2006).
- Nielsen et al. (2009) A. I. Nielsen, T. Christensen, B. Jakobsen, K. Niss, N. B. Olsen, R. Richert, and J. C. Dyre, The Journal of Chemical Physics 130, 154508 (2009).
- Hecksher et al. (2008) T. Hecksher, A. I. Nielsen, N. B. Olsen, and J. C. Dyre, Nature Physics 4, 737 (2008).
- Romanini et al. (2017) M. Romanini, M. Barrio, R. Macovez, M. D. Ruiz-Martin, S. Capaccioli, and J. L. Tamarit, Scientific Reports 7, 1346 (2017).
- Grzybowski et al. (2011) A. Grzybowski, K. Grzybowska, M. Paluch, A. Swiety, and K. Koperwas, Phys. Rev. E 83, 041505 (2011).
- Hansen et al. (2018a) H. W. Hansen, A. Sanz, K. Adrjanowicz, B. Frick, and K. Niss, Nat. Commun. 9, 518 (2018a).
- Bauer et al. (2000) C. Bauer, R. Böhmer, S. Moreno-Flores, R. Richert, H. Sillescu, and D. Neher, Phys. Rev. E 61, 1755 (2000).
- Niss et al. (2012) K. Niss, D. Gundermann, T. Christensen, and J. C. Dyre, Phys. Rev. E 85, 041501 (2012).
- Fukao and Miyamoto (2001) K. Fukao and Y. Miyamoto, Phys. Rev. E 64, 011803 (2001).
- Yin et al. (2012) H. Yin, S. Napolitano, and A. Schönhals, Macromolecules 45, 1652 (2012).
- Inoue et al. (2018) R. Inoue, T. Kanaya, T. Yamada, K. Shibata, and K. Fukao, Phys. Rev. E 97, 012501 (2018).
- Niss (2017) K. Niss, Phys. Rev. Lett. 119, 115703 (2017).
- Casalini and Roland (2017a) R. Casalini and C. Roland, Journal of Non-Crystalline Solids 475, 25 (2017a).
- Tse et al. (1992) J. S. Tse, D. D. Klug, and Y. Le Page, Phys. Rev. B 46, 5933 (1992).
- Della Valle and Venuti (1996) R. G. Della Valle and E. Venuti, Phys. Rev. B 54, 3809 (1996).
- Rouxel et al. (2008) T. Rouxel, H. Ji, T. Hammouda, and A. Moréac, Phys. Rev. Lett. 100, 225501 (2008).
- Masuno et al. (2016) A. Masuno, N. Nishiyama, F. Sato, N. Kitamura, T. Taniguchi, and H. Inoue, RSC Advances 6, 19144 (2016).
- Fragiadakis and Roland (2017) D. Fragiadakis and C. M. Roland, The Journal of Chemical Physics 147, 084508 (2017).
- Casalini and Roland (2017b) R. Casalini and C. M. Roland, The Journal of Chemical Physics 147, 091104 (2017b).
- Dyre (2014) J. C. Dyre, The Journal of Physical Chemistry B 118, 10007 (2014).
- Kimmel and Uhlmann (1970) R. M. Kimmel and D. R. Uhlmann, Journal of Applied Physics 41, 2917 (1970).
- Destruel et al. (1984) P. Destruel, B. Ai, and Hoang-The-Giam, Journal of Applied Physics 55, 2726 (1984).
- Casalini and Roland (2004) R. Casalini and C. Roland, Phys. Rev. E 69, 062501 (2004).
- Gnan et al. (2009) N. Gnan, T. B. Schrøder, U. R. Pedersen, N. P. Bailey, and J. C. Dyre, The Journal of Chemical Physics 131, 234504 (2009).
- Danilov et al. (2016) I. V. Danilov, E. L. Gromnitskaya, and V. V. Brazhkin, The Journal of Physical Chemistry B 120, 7593 (2016).
- Gnan et al. (2010) N. Gnan, C. Maggi, T. B. Schrøder, and J. C. Dyre, Phys. Rev. Lett. 104, 125902 (2010).
- Böttcher (1973) C. J. F. Böttcher, Theory of electric polarization, Vol. 1, 2 Edition, Elsevier Scientific Publishing Company (1973).
- Schönhals and Kremer (2003) A. Schönhals and F. Kremer, Broadband Dielectric Spectroscopy, Springer-Verlag Berlin Heidelberg (2003).
- Roed et al. (2013) L. A. Roed, D. Gundermann, J. C. Dyre, and K. Niss, Journal of Chemical Physics 139, 01101 (2013).
- Roed et al. (2015) L. A. Roed, K. Niss, and B. Jakobsen, The Journal of Chemical Physics 143, 221101 (2015).
- Hansen et al. (2018b) H. W. Hansen, B. Frick, S. Capaccioli, A. Sanz, and K. Niss, The Journal of Chemical Physics 149, 214503 (2018b).
- Igarashi et al. (2008) B. Igarashi, T. Christensen, E. H. Larsen, N. B. Olsen, I. H. Pedersen, T. Rasmussen, and J. C. Dyre, Review of Scientific Instruments 79, 045106 (2008).
- Xiao et al. (2015) W. Xiao, J. Tofteskov, T. V. Christensen, J. C. Dyre, and K. Niss, Journal of Non-Crystalline Solids 407, 190 (2015).
- Naoki and Koeda (1989) M. Naoki and S. Koeda, The Journal of Physical Chemistry 93, 948 (1989).
- Kittel (1996) C. Kittel, Introduction to Solid State Physics, Seventh Edition, John Wiley & Sons, Inc. (1996).
- Hecksher (2011) T. Hecksher, Relaxation in supercooled liquids: linear and nonlinear, mechanical and dielectric studies of molecular liquids, Ph.D. thesis, IMFUFA, Roskilde University (2011).