Driving massive molecular gas flows in central cluster galaxies with AGN feedback
Abstract
We present an analysis of new and archival ALMA observations of molecular gas in twelve central cluster galaxies. We examine emerging trends in molecular filament morphology and gas velocities to understand their origins. Molecular gas masses in these systems span , far more than most gas-rich galaxies. ALMA images reveal a distribution of morphologies from filamentary to disk-dominated structures. Circumnuclear disks on kiloparsec scales appear rare. In most systems, half to nearly all of the molecular gas lies in filamentary structures with masses of a few that extend radially several to several tens of kpc. In nearly all cases the molecular gas velocities lie far below stellar velocity dispersions, indicating youth, transience or both. Filament bulk velocities lie far below the galaxy’s escape and free-fall speeds indicating they are bound and being decelerated. Most extended molecular filaments surround or lie beneath radio bubbles inflated by the central AGN. Smooth velocity gradients found along the filaments are consistent with gas flowing along streamlines surrounding these bubbles. Evidence suggests most of the molecular clouds formed from low entropy X-ray gas that became thermally unstable and cooled when lifted by the buoyant bubbles. Uplifted gas will stall and fall back to the galaxy in a circulating flow. The distribution in morphologies from filament to disk-dominated sources therefore implies slowly evolving molecular structures driven by the episodic activity of the AGN.
keywords:
galaxies:active — galaxies: jets — galaxies:evolution — galaxies:clusters:intracluster medium1 Introduction
Active Galactic Nuclei (AGN) release the energy of accreting material as intense bursts of radiation or jets of relativistic particles. These energetic outbursts are observed to drive fast () outflows of ionized, neutral and molecular gas on pc to kpc scales in the surrounding interstellar medium (eg. Morganti et al. 2005, 2013; Nesvadba et al. 2006, 2011; Feruglio et al. 2010; Alatalo et al. 2011; Rupke & Veilleux 2011; Sturm et al. 2011). The gas flows may be driven by wide-angle winds launched from a luminous accretion disk, via radiation pressure on dust or hot thermal winds, or instead accelerated by radio jets, through direct collisions or bubble buoyancy (for reviews see Veilleux et al. 2005; Fabian 2012; King & Pounds 2015). By driving cold gas from the host galaxy, AGN restrict the fuel available for star formation and engender the slowdown in massive galaxy growth since the peak of star formation activity at (Binney & Tabor 1995; Silk & Rees 1998; Di Matteo et al. 2005; Croton et al. 2006; Bower et al. 2006; Hopkins et al. 2006). This mechanism is also self-limiting, as the outflows also deprive the supermassive black hole (SMBH) of fuel, and therefore is known as AGN feedback.
Massive galaxies lie at the centres of nearby rich galaxy clusters and represent a challenge for AGN feedback. Without a heat source, the extensive hot gas atmospheres surrounding these galaxies would cool rapidly and flood the galaxy with cold gas and star formation (for reviews see Fabian 1994; Peterson & Fabian 2006). Encouragingly, the central AGN in these galaxies are preferentially radio-loud and essentially ubiquitous at the heart of cluster atmospheres with short radiative cooling times (eg. Burns 1990; Dunn & Fabian 2006; Best et al. 2007). Chandra X-ray observations reveal large surface brightness depressions, typically tens of kpc in size, where radio bubbles inflated by the jets have carved out cavities in the hot atmosphere (eg. Boehringer et al. 1993; Churazov et al. 2000; McNamara et al. 2000; Fabian et al. 2000). The jet power can be estimated from the sum of the internal energy of the radio bubbles and the work done displacing the hot X-ray gas. For radio bubbles dominated by relativistic particles, this is given by , where is the ambient hot gas pressure, is the bubble volume and is the rise time of the bubble (eg. Churazov et al. 2000, 2002; McNamara & Nulsen 2007). These bubbles rise buoyantly through the intracluster medium and are still visible as X-ray cavities even after the radio emission has spectrally aged and faded at higher radio frequencies. Studies of large cluster samples have shown that this energy input by the radio bubbles closely balances the radiative cooling losses from the surrounding hot atmosphere (eg. Bîrzan et al. 2004; Rafferty et al. 2006; Dunn & Fabian 2006; Nulsen et al. 2009). This observed balance, together with the prevalence of short central radiative cooling times below a Gyr requires a feedback loop that couples the AGN heating and gas cooling processes together (for a review see McNamara & Nulsen 2012).
A perfectly balanced feedback loop would fail. Some gas must cool into molecular clouds and accrete onto the galaxy and eventually onto the nuclear black hole to maintain it. AGN activity, luminous cool gas nebulae and star formation are preferentially detected in central cluster galaxies when the radiative cooling time of the hot atmosphere falls below the threshold value of (Rafferty et al. 2008; Cavagnolo et al. 2008). The cold molecular phase likely dominates the cool gas mass in these systems. Single dish sub-mm observations of CO emission detected molecular gas masses in excess of (Edge 2001; Salomé & Combes 2003). Like nebular emission, CO emission is detected preferentially in systems whose atmospheric cooling times fall below (Pulido et al. 2018). Furthermore, molecular gas mass is correlated with the X-ray gas mass measured on similar spatial scales within the galaxy (Pulido et al. 2018). These two relationships indicate that the bulk of the molecular gas cooled from the hot atmospheres. However, the cooling time threshold only indicates a high likelihood of molecular gas being present. It is not sensitive to the level or mass of molecular gas. Additional parameters are at play, which are likely uplift behind the rising bubbles leading to thermally unstable cooling (McNamara et al. 2016), and the mass of atmospheric gas available to cool (Pulido et al. 2018 and section 4 below).
However, the spatial structure of this cold gas could only be resolved in a few of the nearest systems (Edge et al. 2002; Salomé & Combes 2004; Salomé et al. 2006). IRAM and SMA observations of the massive reservoir of cold gas at the centre of the nearby Perseus cluster revealed a filamentary structure (Salomé et al. 2006; Salomé et al. 2011; Lim et al. 2008). The cold gas is spatially coincident with extended filaments of soft X-ray, ionized and warm molecular gas that are drawn up beneath radio bubbles (Fabian et al. 2003b; Hatch et al. 2006; Salomé et al. 2006; Lim et al. 2012).
With the arrival of the ALMA observatory, the relationship between the radio bubble activity and the cold gas reservoir can now be resolved in detail in large samples of central cluster galaxies. During the Early Science phase, studies have necessarily focused on individual, bright targets (eg. McNamara et al. 2014; Russell et al. 2014, 2016; David et al. 2014; Tremblay et al. 2016; Vantyghem et al. 2016). It was therefore initially difficult to draw many broader conclusions given the variety and complexity of the detected structure or to investigate potential correlations with jet power, X-ray gas mass and cooling rates. Here we present a uniform analysis of new and archival ALMA observations for a dozen central cluster galaxies. With this larger sample, we identify the most prevalent morphological and kinematical trends, investigate the origin of clear correlations with radio bubble activity, the mechanism and the fate of the observed cold gas flows.
We assume , and . All errors are unless otherwise noted.
2 Data reduction
| Target | Redshift | Scale | CO line | On source | Obs. date | No. of | References | |
|---|---|---|---|---|---|---|---|---|
| (kpc/) | (GHz) | (min) | Antennas | |||||
| A2052 | 0.0345 | 0.7 | J=2-1 | 222.856 | 82.0 | 2016-08-11, 2016-08-23 | 37, 35 | |
| PKS0745-191 | 0.1028 | 1.9 | J=1-0 | 104.526 | 25.3 | 2014-04-26, 2014-04-27 | 34, 36 | [4] |
| J=3-2 | 313.562 | 56.4 | 2014-08-19 | 32 | [4] | |||
| A1795 | 0.0633 | 1.2 | J=2-1 | 216.822 | 72.0 | 2016-06-11, 2016-06-14 | 38 | [9] |
| A2597 | 0.0821 | 1.5 | J=2-1 | 213.047 | 189.9 | 2013-11-17, 2013-11-18 | 29, 28 | [5] |
| 2013-11-19 | 28 | |||||||
| NGC5044 | 0.0093 | 0.2 | J=2-1 | 228.440 | 23.3 | 2012-01-13 | 18 | [3] |
| 2A0335+096 | 0.0346 | 0.7 | J=1-0 | 111.416 | 35.9 | 2014-07-22, 2015-03-08 | 33, 30 | [6] |
| J=3-2 | 334.232 | 34.3 | 2014-08-12 | 34 | [6] | |||
| RXJ0821.0+0752 | 0.111 | 2.0 | J=1-0 | 103.754 | 87.0 | 2016-10-30, 2016-11-04 | 41, 43 | [8] |
| J=3-2 | 311.248 | 22.7 | 2016-10-01 | 41 | [8] | |||
| RXCJ1504.1-0248 | 0.2169 | 3.5 | J=1-0 | 94.725 | 154.0 | 2016-10-27, 2016-10-27 | 40, 41 | [10] |
| 2016-11-02, 2017-05-10 | 38, 47 | |||||||
| J=3-2 | 284.161 | 34.5 | 2017-07-04 | 45 | [10] | |||
| Phoenix | 0.596 | 6.8 | J=3-2 | 216.664 | 58.5 | 2014-06-15, 2014-06-16 | 34, 35 | [7] |
| A1664 | 0.128 | 2.3 | J=1-0 | 102.191 | 50.4 | 2012-03-27, 2012-04-07 | 15, 17 | [1] |
| J=3-2 | 306.557 | 70.6 | 2012-03-28, 2012-03-28 | 17, 16 | [1] | |||
| A1835 | 0.252 | 3.9 | J=1-0 | 92.070 | 59.5 | 2012-03-27, 2012-04-07 | 15, 17 | [2] |
| J=3-2 | 276.190 | 59.5 | 2012-03-28, 2012-04-24 | 16, 20 | [2] | |||
| A262 | 0.0162 | 0.33 | J=2-1 | 226.863 | 11.1 | 2016-06-27 | 42 |
| Target | CO line | Beam | PA | Binning | rms | |
|---|---|---|---|---|---|---|
| (GHz) | (, ) | (deg) | () | () | ||
| A2052 | J=2-1 | 222.856 | , | 15 | 0.8 | |
| PKS0745-191 | J=1-0 | 104.526 | , | 10 | 0.6 | |
| J=3-2 | 313.562 | , | 10 | 1 | ||
| A1795 | J=2-1 | 216.822 | , | 10 | 0.64 | |
| A2597 | J=2-1 | 213.047 | , | 10 | 0.4 | |
| NGC5044 | J=2-1 | 228.440 | , | 10 | 1.5 | |
| 2A0335+096 | J=1-0 | 111.416 | , | 20 | 0.5 | |
| J=3-2 | 334.232 | , | 10 | 0.8 | ||
| RXJ0821.0+0752 | J=1-0 | 103.754 | , | 5 | 0.5 | |
| J=3-2 | 311.248 | , | 5 | 1.3 | ||
| RXCJ1504.1-0248 | J=1-0 | 94.725 | , | 20 | 0.2 | |
| J=3-2 | 284.161 | , | 10 | 0.6 | ||
| Phoenix | J=3-2 | 216.664 | , | -37.9 | 12 | 0.3 |
| A1664 | J=1-0 | 102.191 | , | -89.9 | 40 | 0.5 |
| J=3-2 | 306.557 | , | -83.7 | 30 | 1.5 | |
| A1835 | J=1-0 | 92.070 | , | -83.3 | 5 | 1.1 |
| J=3-2 | 276.190 | , | -80.0 | 5 | 3.0 | |
| A262 | J=2-1 | 226.863 | , | 10.9 | 5 | 1.4 |
We analysed new and archival ALMA observations of CO line emission in central cluster galaxies to investigate emerging trends in the molecular gas structure and kinematics. Targets were principally selected from single object studies in the literature (see Table 1) with the addition of new ALMA observations of the central galaxy in Abell 2052 and archival observations of NGC 708 at the centre of A262. This produced a total sample of 12 central cluster galaxies. The sample spans a wide range in molecular gas mass (), X-ray cavity power (), star formation rate (a few to ) and redshift (up to ). However, predominantly bright, gas-rich systems were preferentially, and necessarily, selected as early ALMA targets. They are therefore over-represented in our sample. This sample is neither complete nor unbiased and we are careful to consider this throughout our analysis.
For each target, we selected CO line observations from the ALMA archive as detailed in Table 1. The central galaxies were observed with the ALMA array at frequencies corresponding to the CO(1-0), CO(2-1) or CO(3-2) rotational transition lines with additional spectral windows used to image the sub-mm continuum emission. Each dataset consists of a single pointing centred on the galaxy nucleus and covers the ionized gas peak and the brightest filaments. The ALMA field of view ranges between in band 3 at and in band 7 at . The spatial resolution and sensitivity vary significantly from the earliest Cycle 0 observations (eg. A1664 and A1835) with antennas and baselines up to to the latest datasets (eg. RXCJ1504.1-0248) with antennas and baselines up to a few km. This variation is reflected in the synthesized beam size and rms of the final data cube as detailed in Table 2.
Each ALMA dataset was calibrated using the required version of casa (McMullin et al. 2007), which ranged from version 3.3.0 for the Early Science data to version 4.7.0 for the latest datasets. Datasets taken in the early ALMA cycles were manually calibrated with tailored data reduction scripts generated by ALMA staff while later datasets were reduced by the automated ALMA science pipeline. Several datasets did require additional flagging and other modifications, for example to the phase centre (eg. A1835) and total flux calibration (eg. Phoenix) and to limit the impact of poor phase solutions (eg. 2A0335+096, Vantyghem et al. 2016).
Continuum-subtracted data cubes were generated using the casa tasks uvcontsub and clean. Different weightings were tested for each dataset to determine the optimum for imaging. Briggs weighting with a robust parameter of 2 (close to natural weighting) was favoured for targets with extended filaments to provide the highest signal-to-noise in these structures. Otherwise, Briggs weighting with a robust parameter of 0 was used to produce a good compromise between spatial resolution and sensitivity. We note that ALMA’s good uv coverage ensured that images generated with a range of weightings did not show any major differences. The rms in each final datacube was compared with and found to be close to the corresponding theoretical rms, which is dependent on the array configuration, integration time, frequency and atmospheric conditions. The synthesized beam size, velocity binning and rms in each final datacube are detailed in Table 2.
Continuum images were produced from line-free channels in each baseband and using uniform weighting. Self-calibration was also employed to produce modest increases in continuum sensitivity for targets with continuum peaks greater than a few mJy. The continuum emission was due to nuclear point sources coincident with the AGN in all targets, except RXJ0821+0752 where the sub-mm continuum is spatially extended and offset from the AGN (Vantyghem et al. 2019).
3 Results
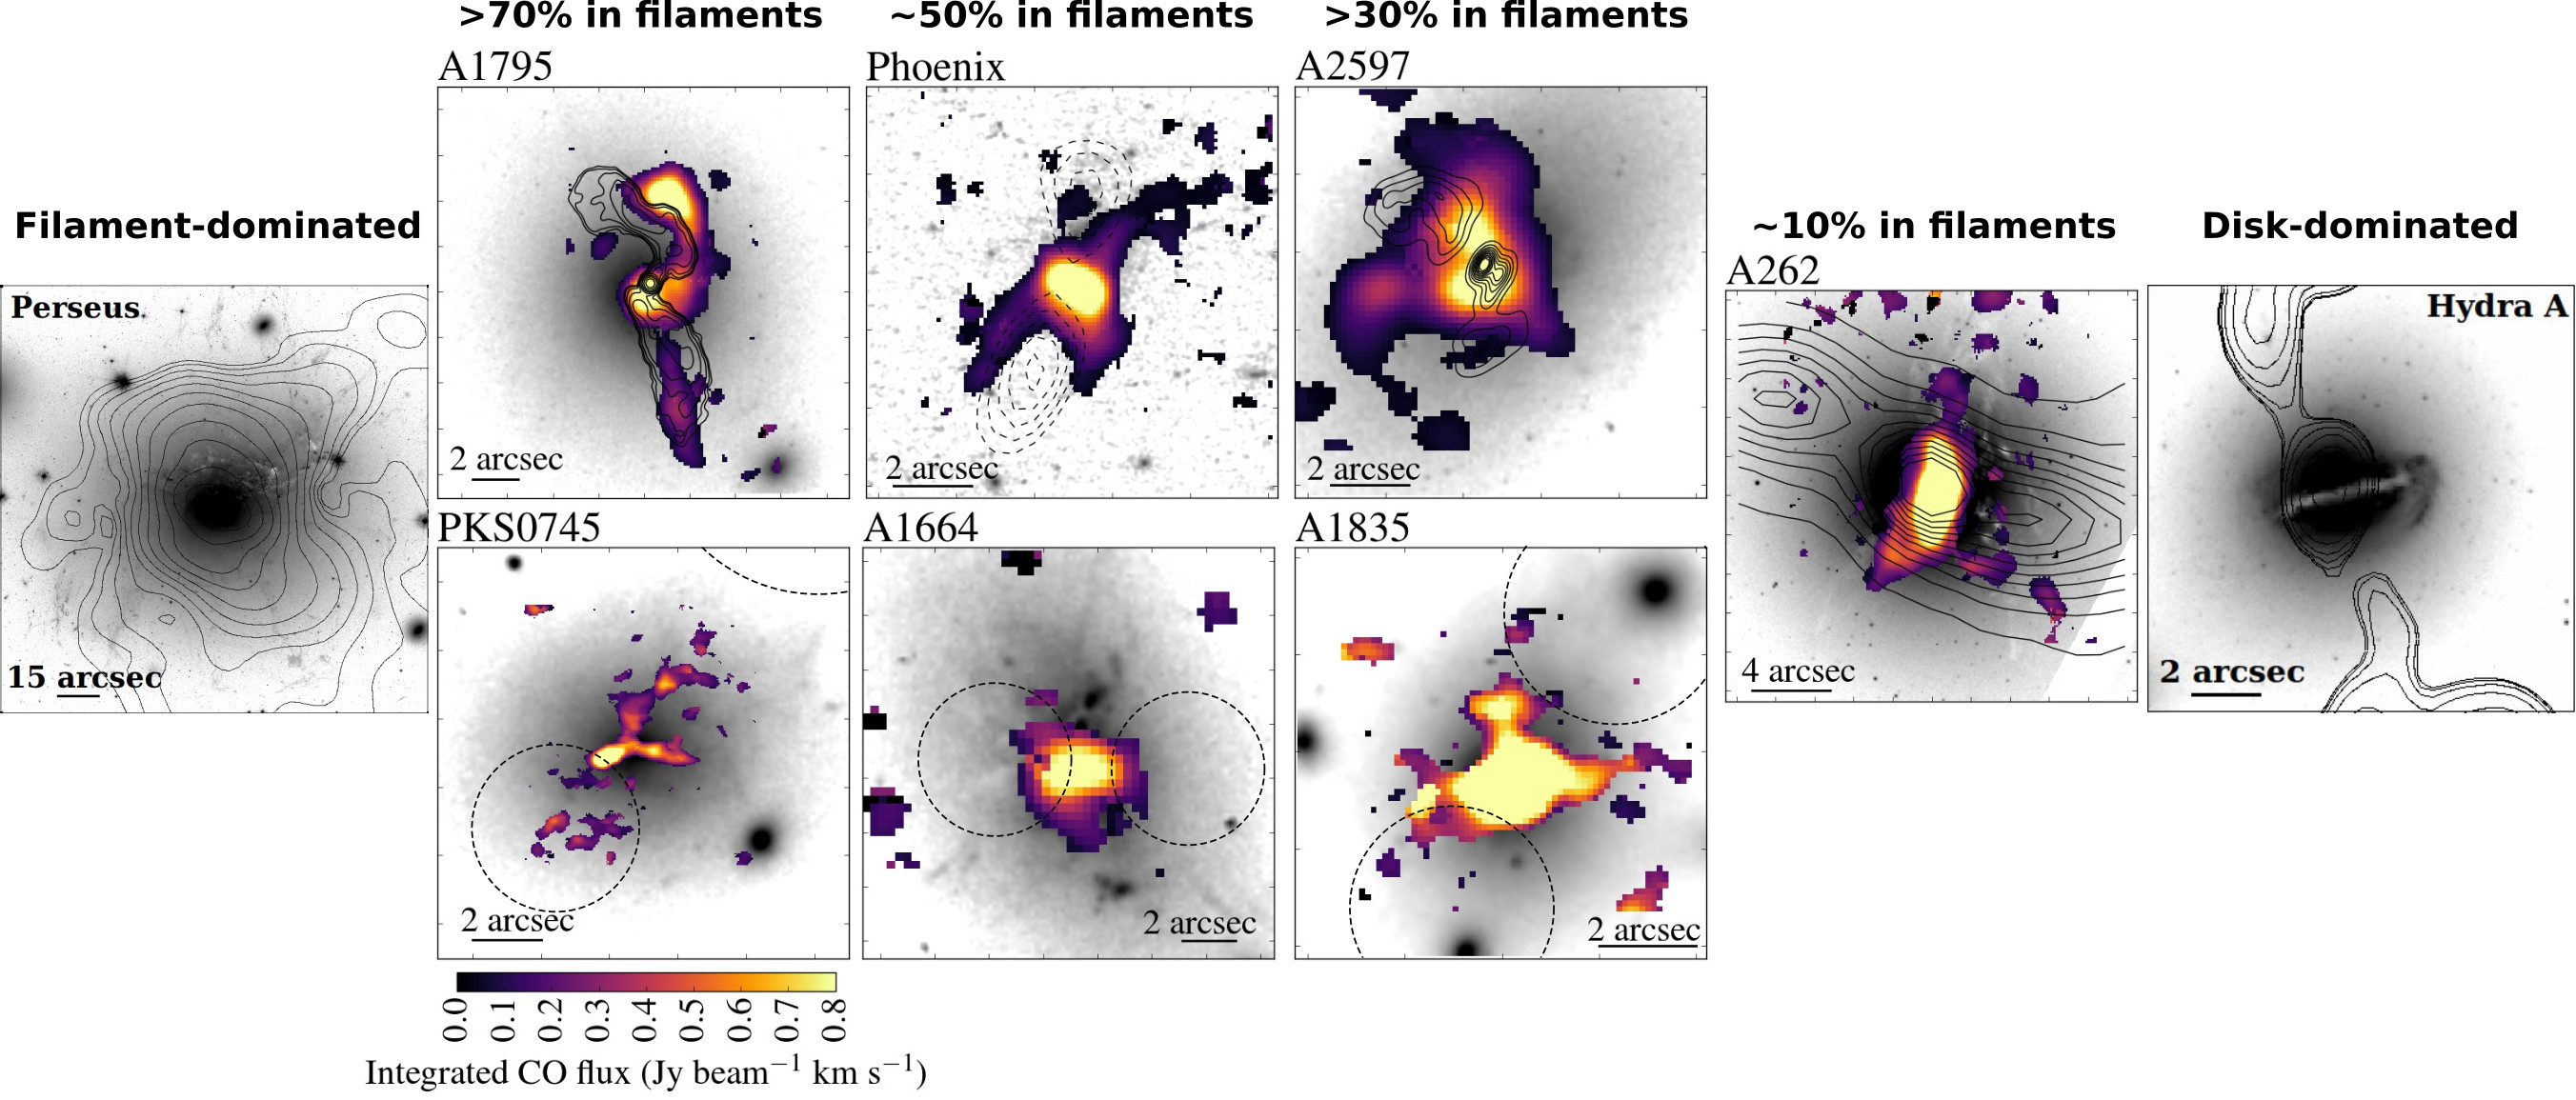
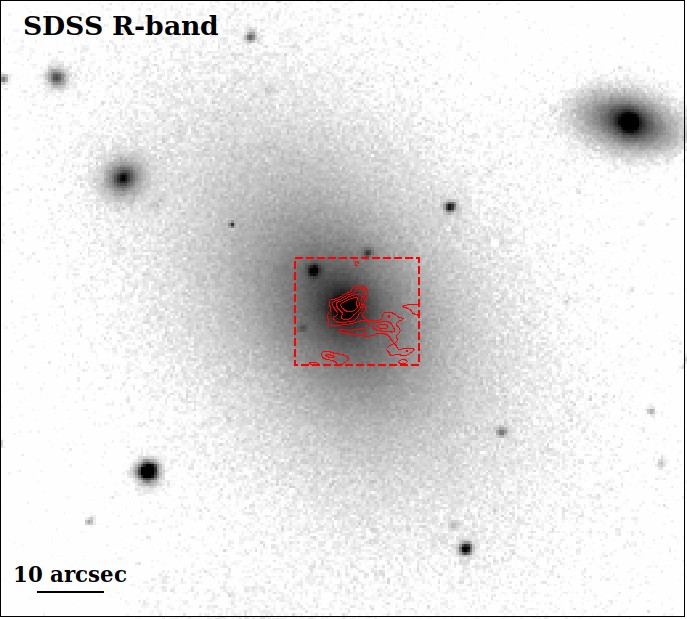
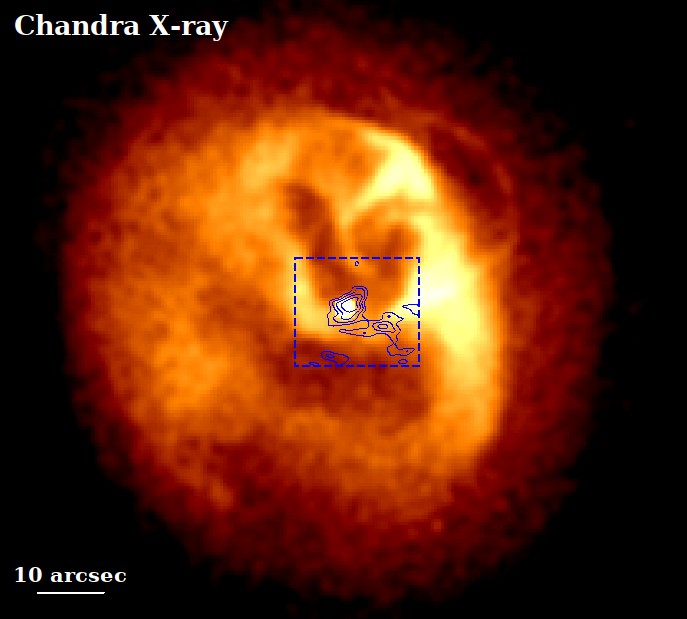
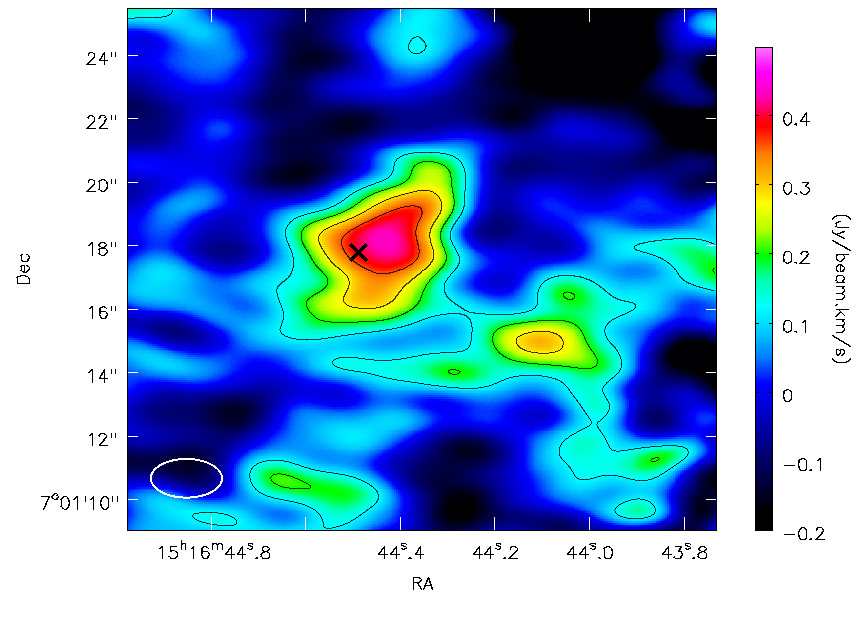
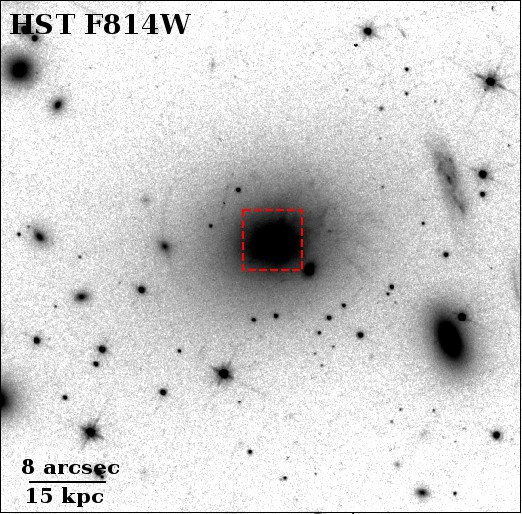
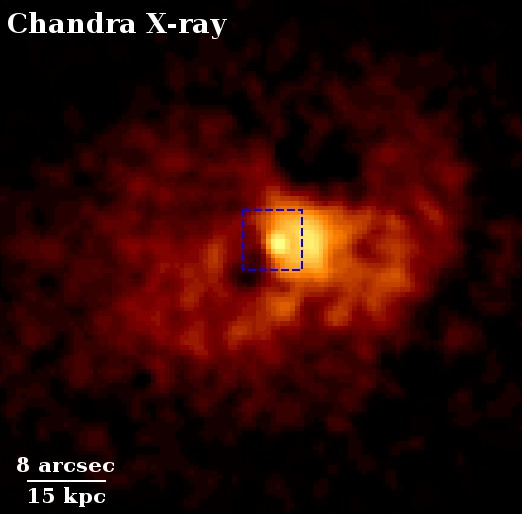
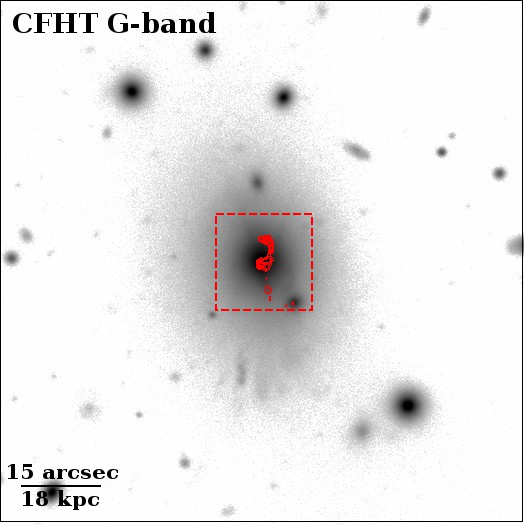
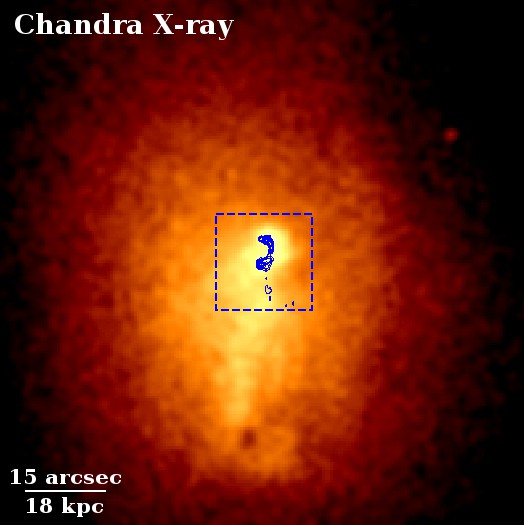
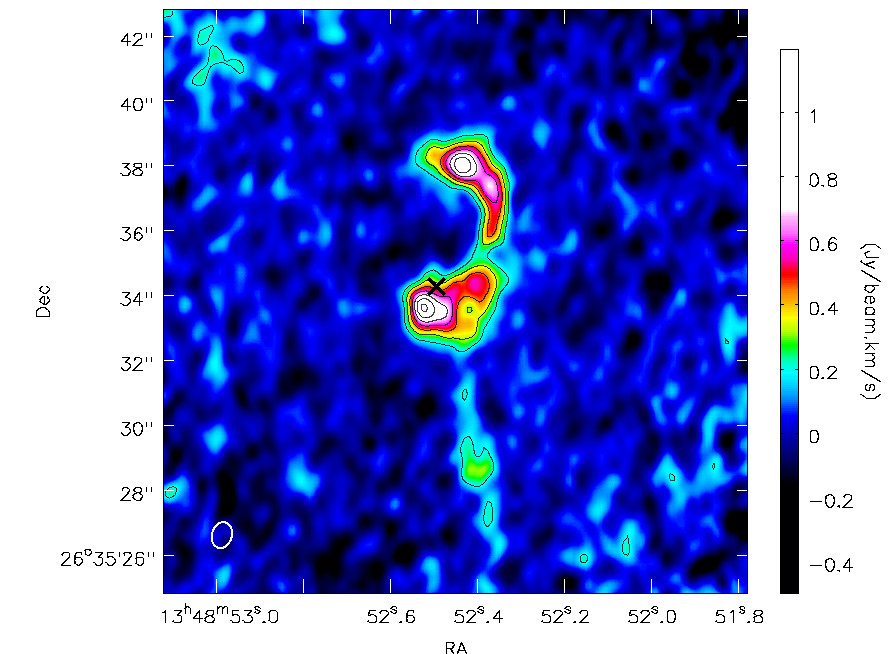
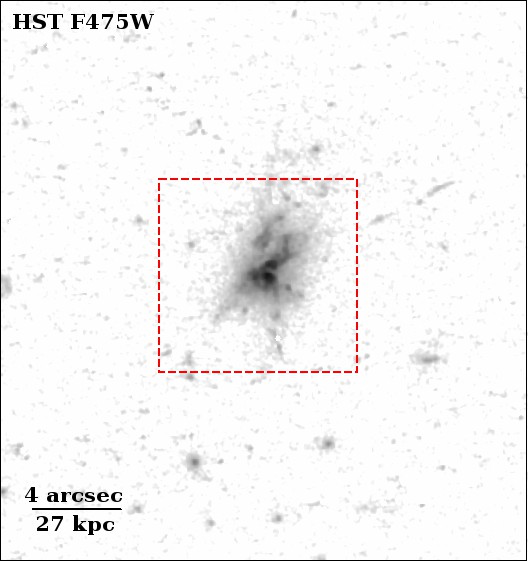
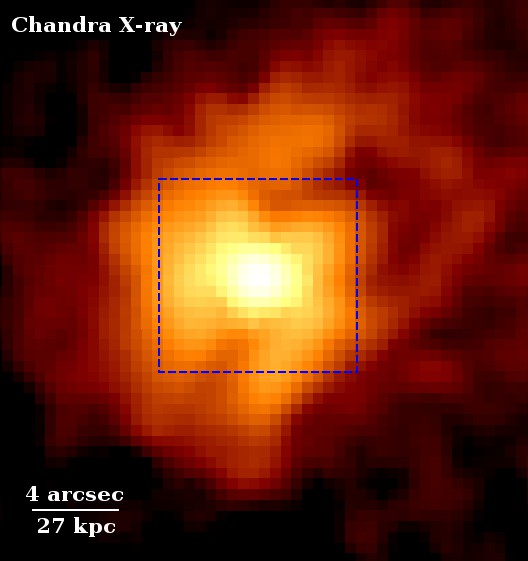
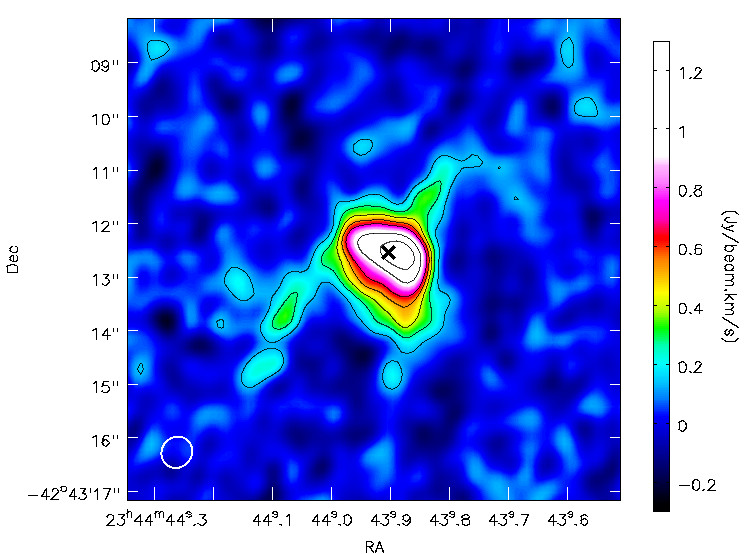
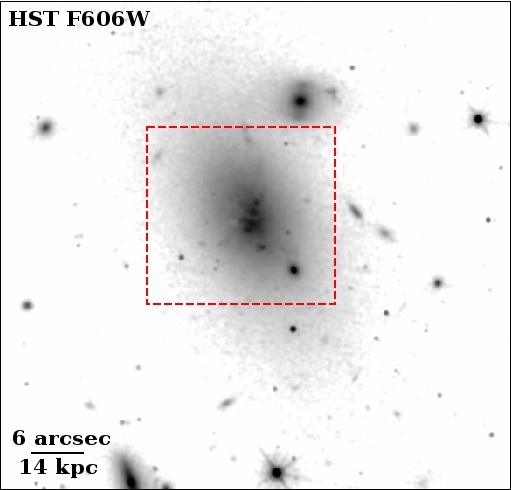
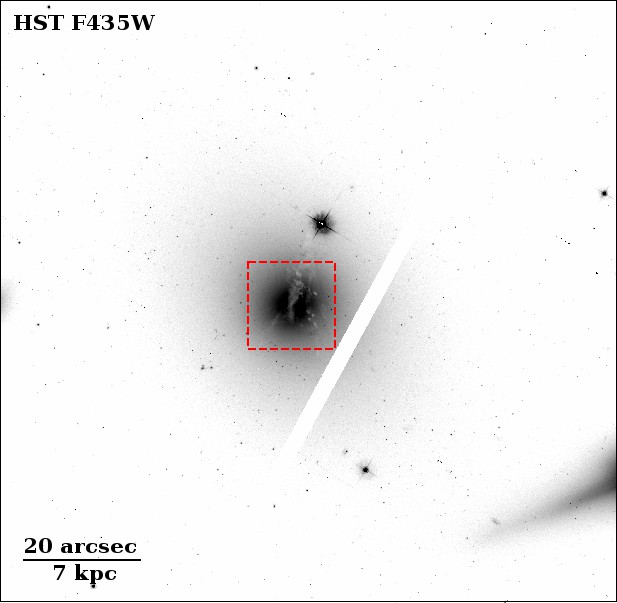
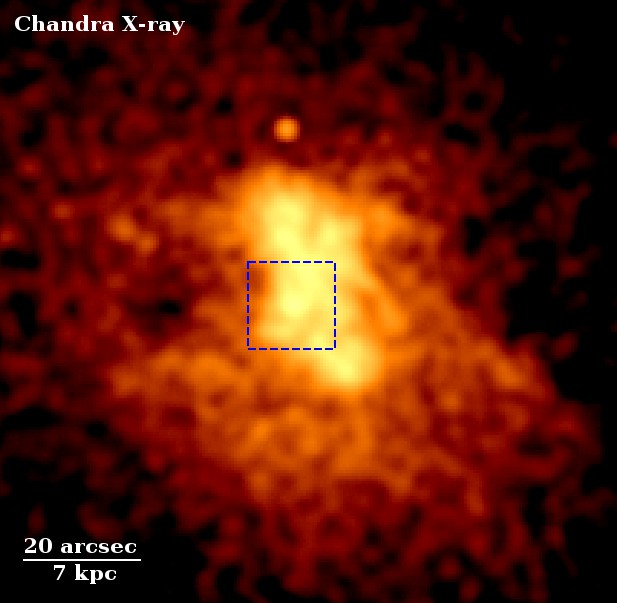
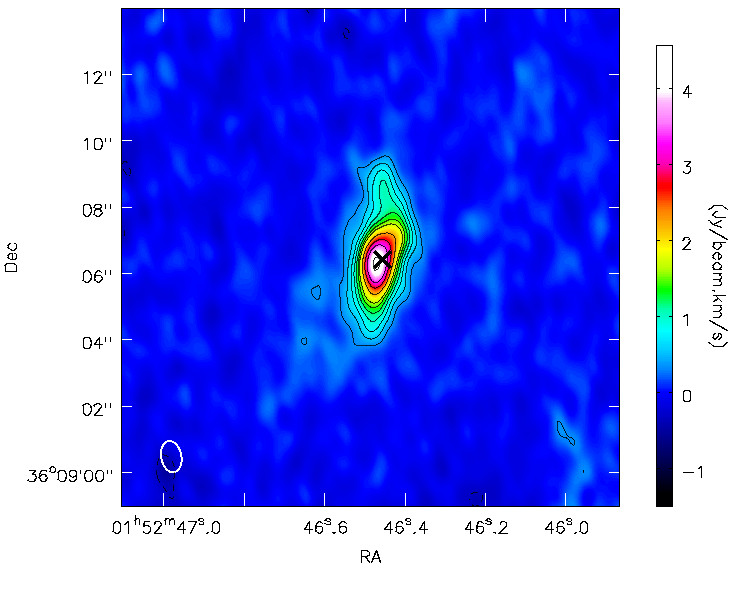
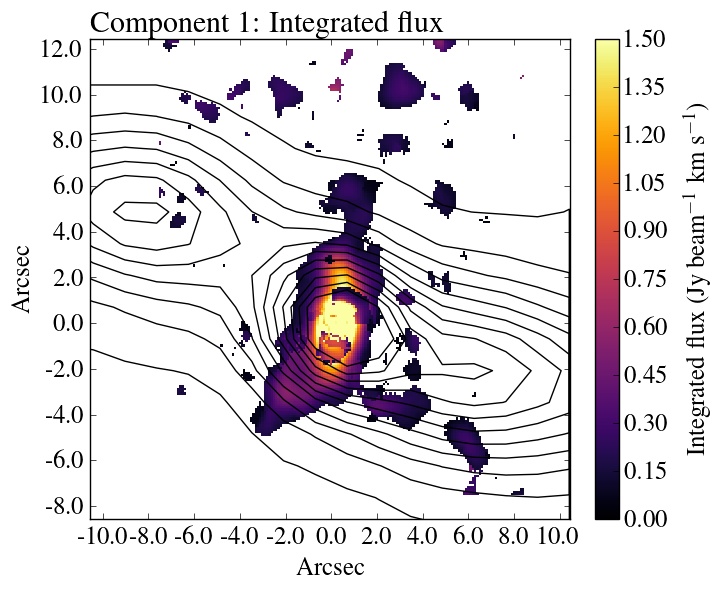
Maps of the integrated intensity, velocity centre and FWHM were produced for all twelve targets in our sample covering each CO line observed with ALMA. Integrated intensity maps were generated by integrating over the CO line profile in each spatial pixel (zeroth moment map). A subset of the integrated intensity maps are shown in Fig. 1 overlaid on optical images of the central galaxy’s stellar light, with radio contours, X-ray contours or regions showing the position of the X-ray cavities or radio bubbles. All CO images for each source are shown separately in the appendix together with optical and X-ray images.
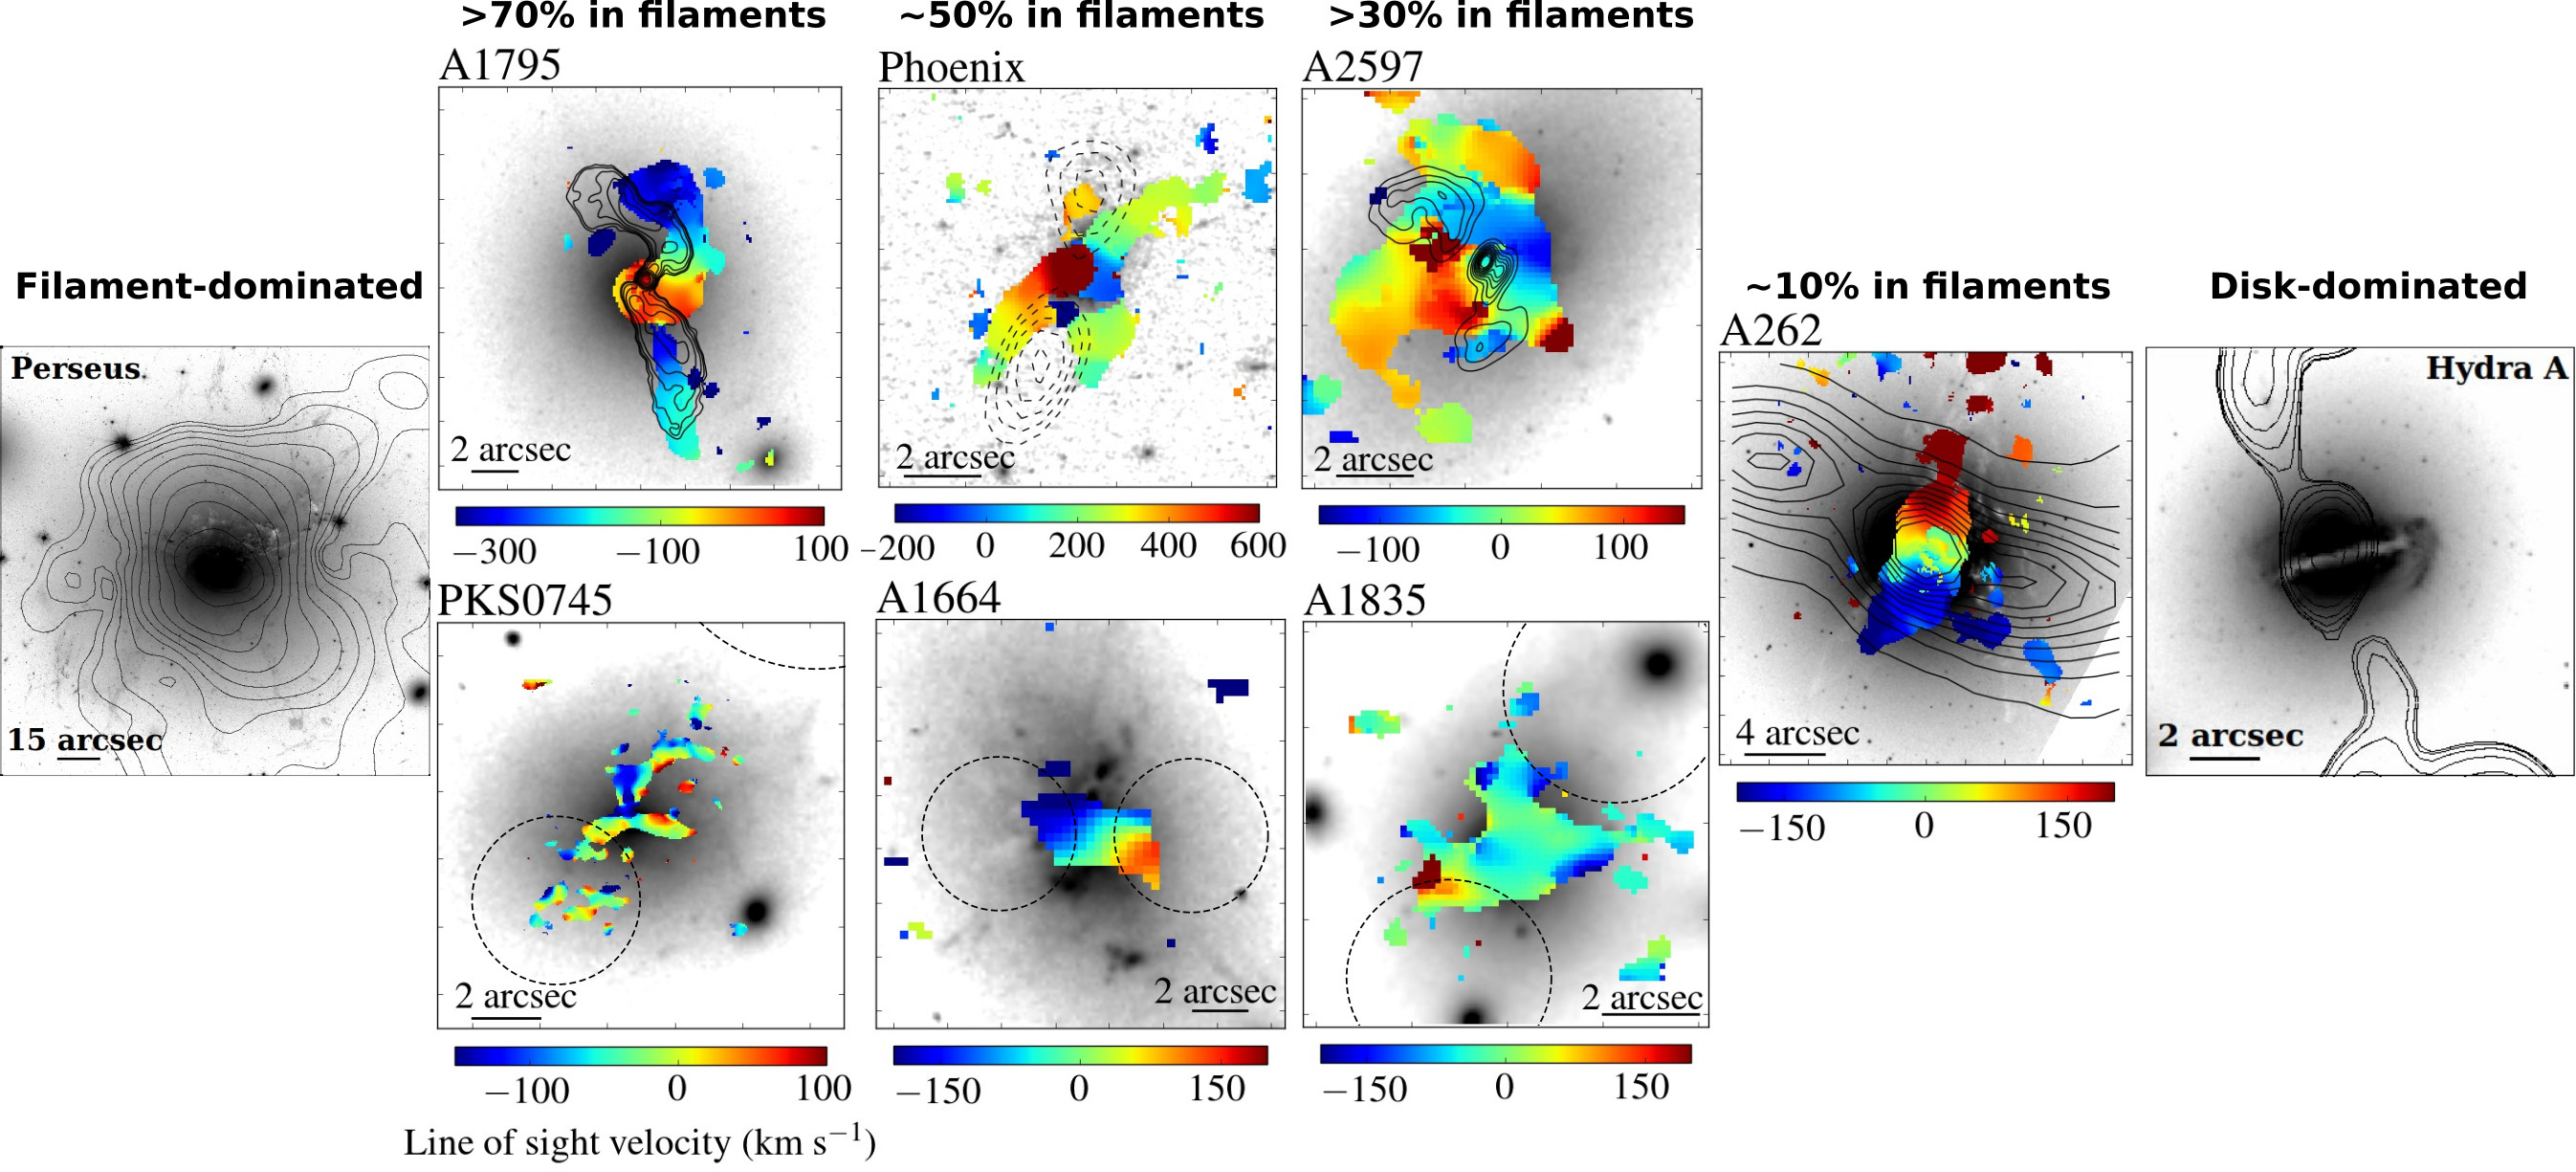
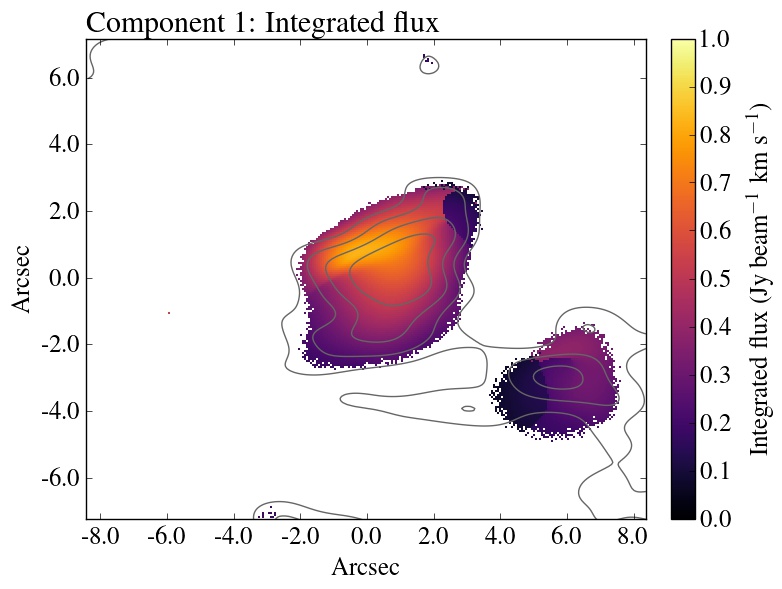
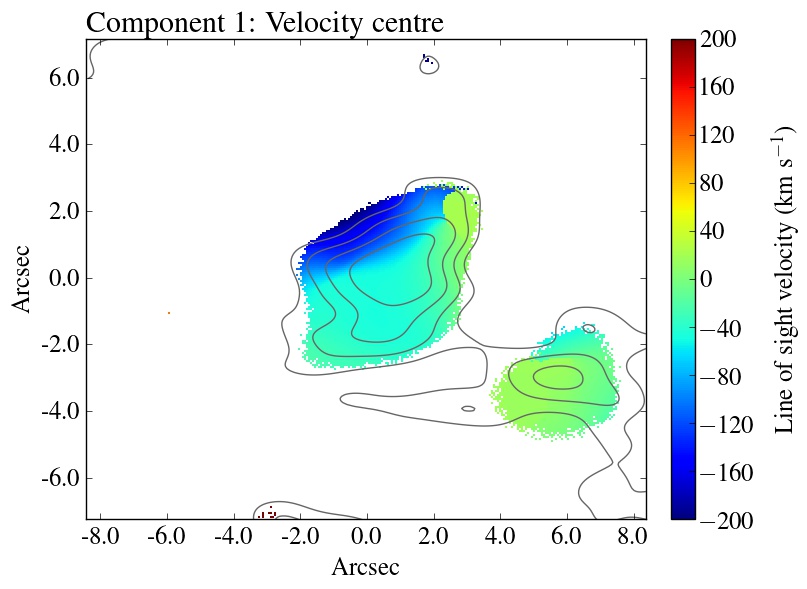
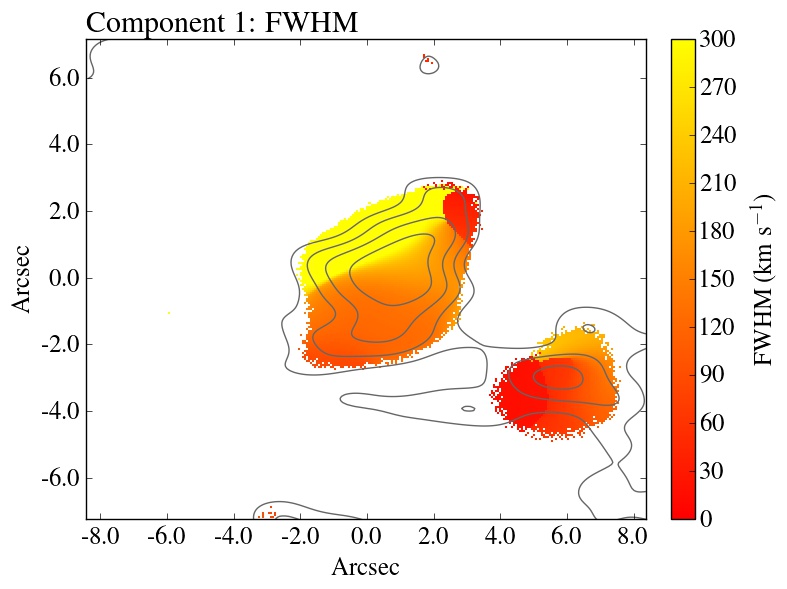
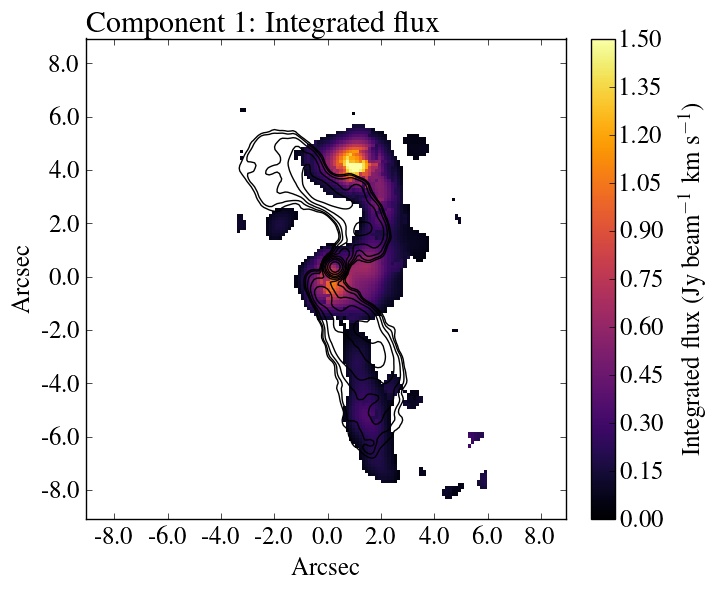
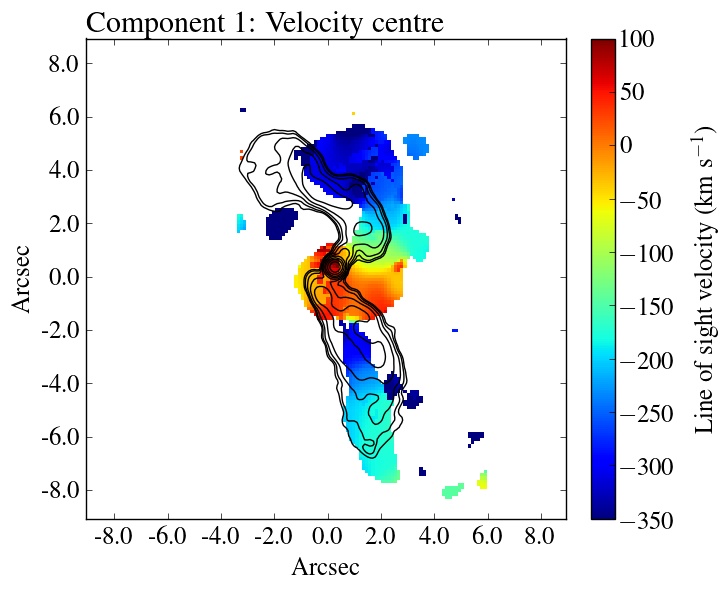
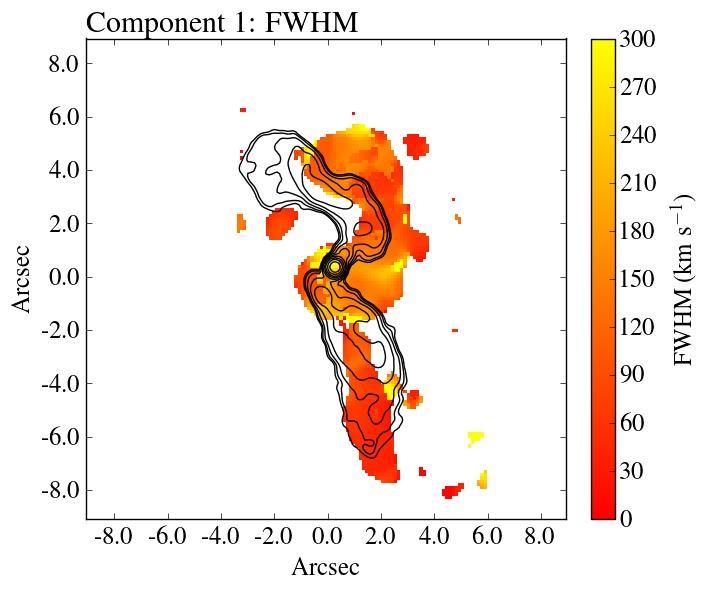
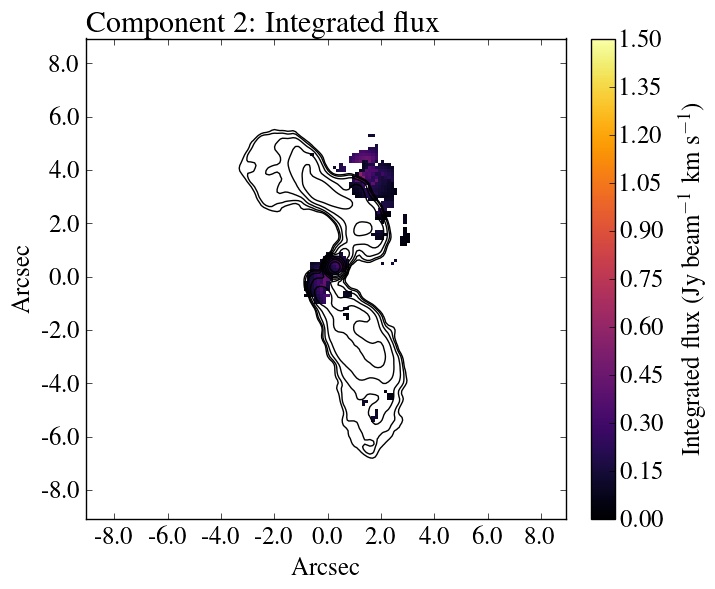
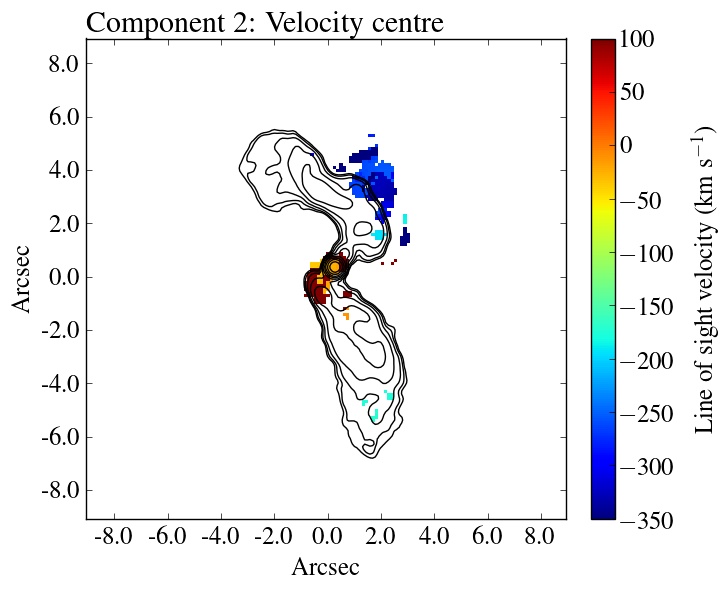
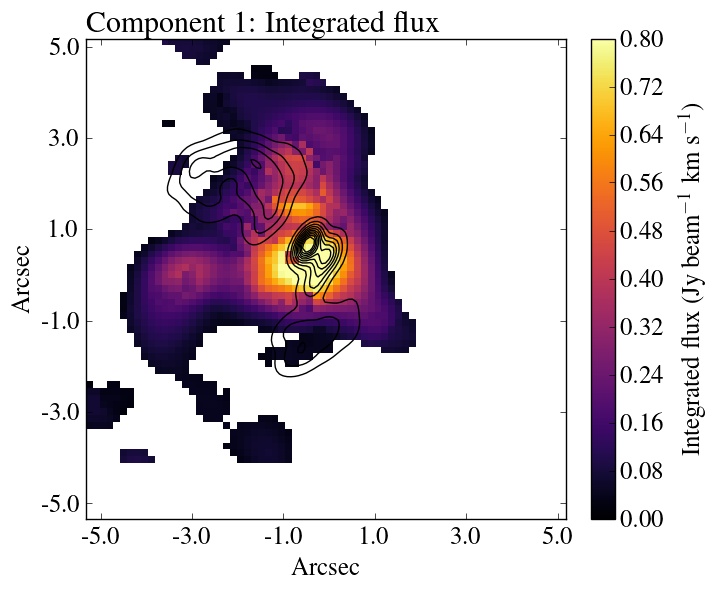
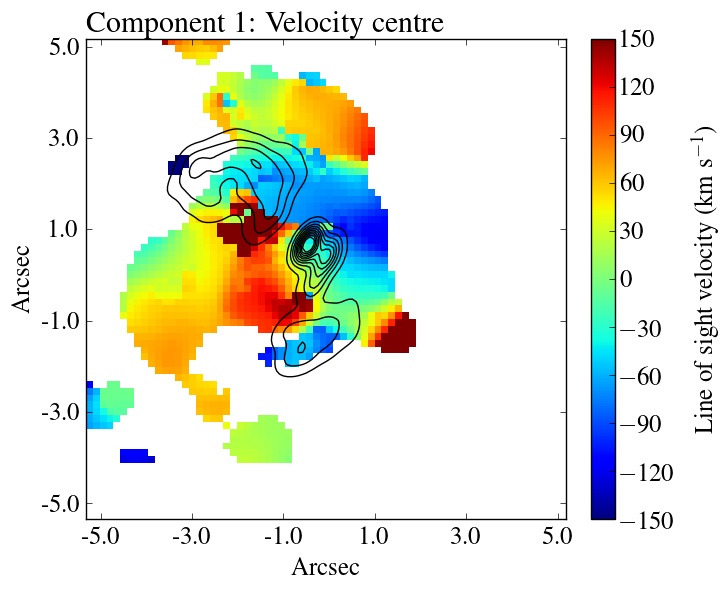
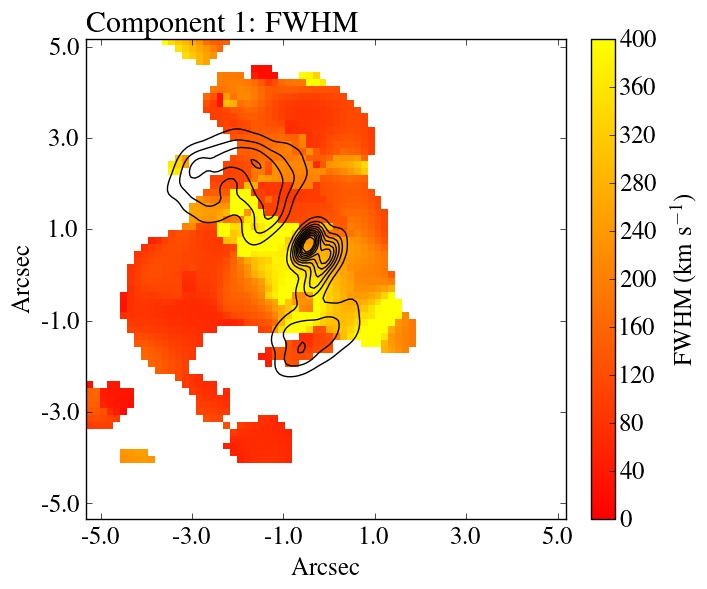
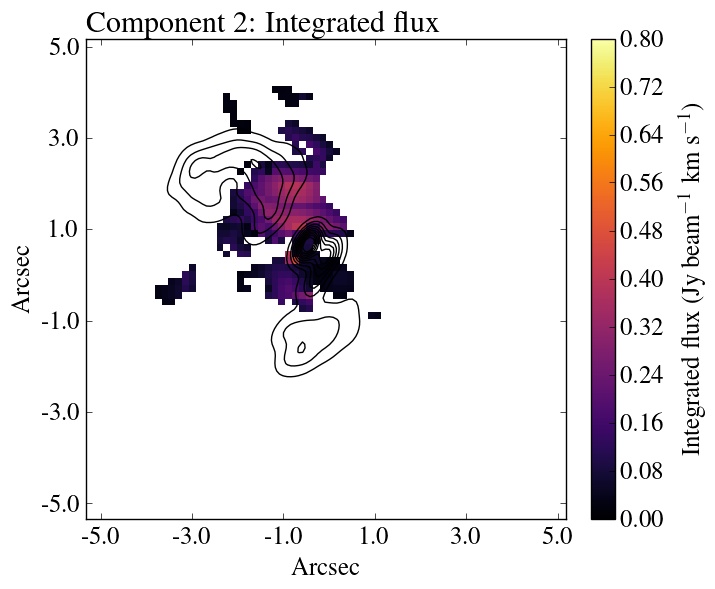
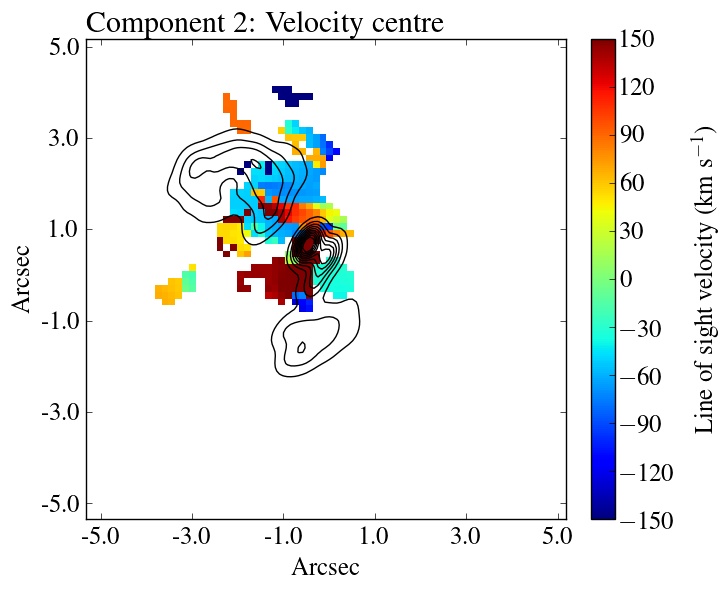
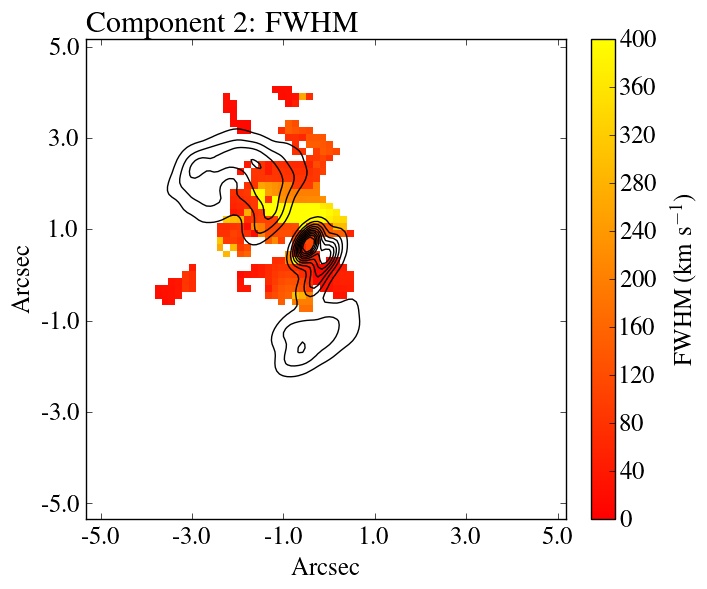
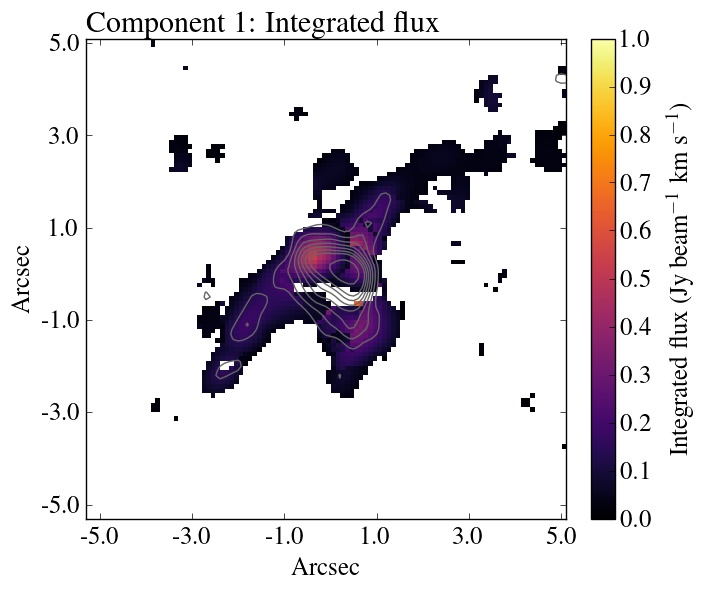
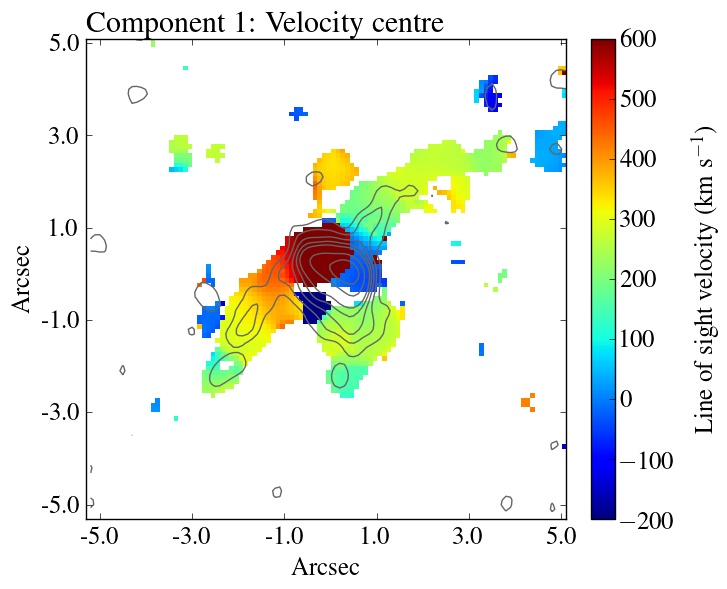
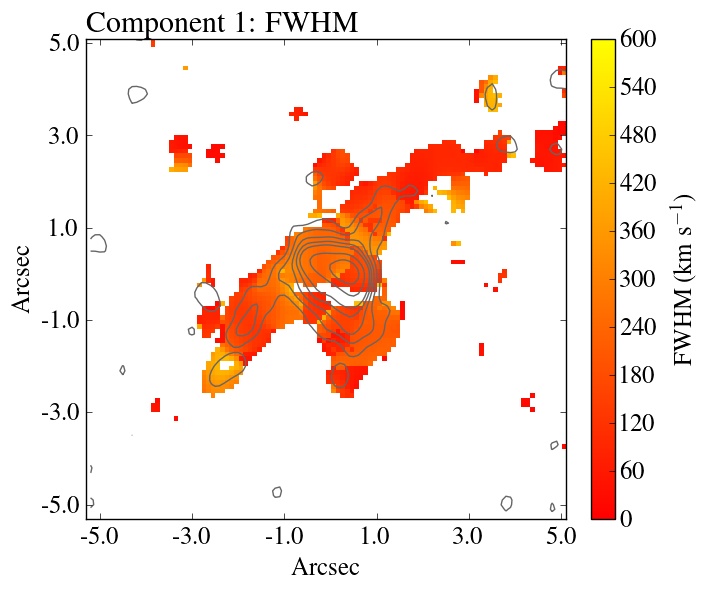
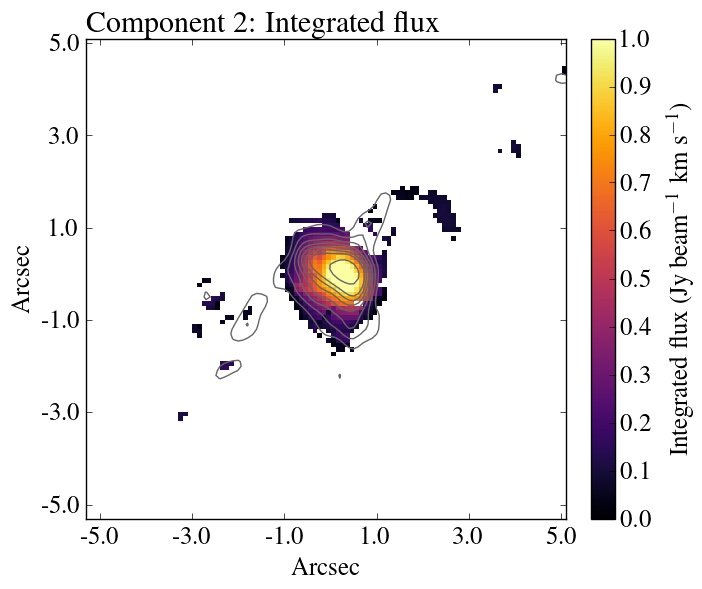
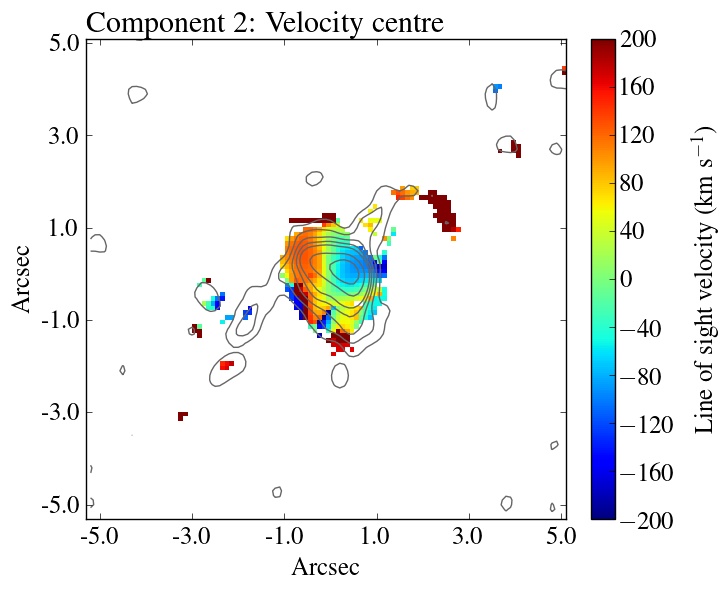
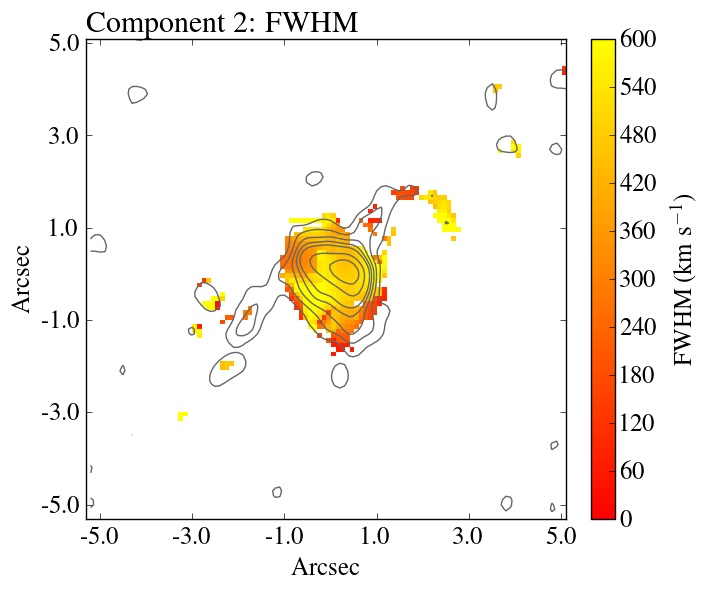
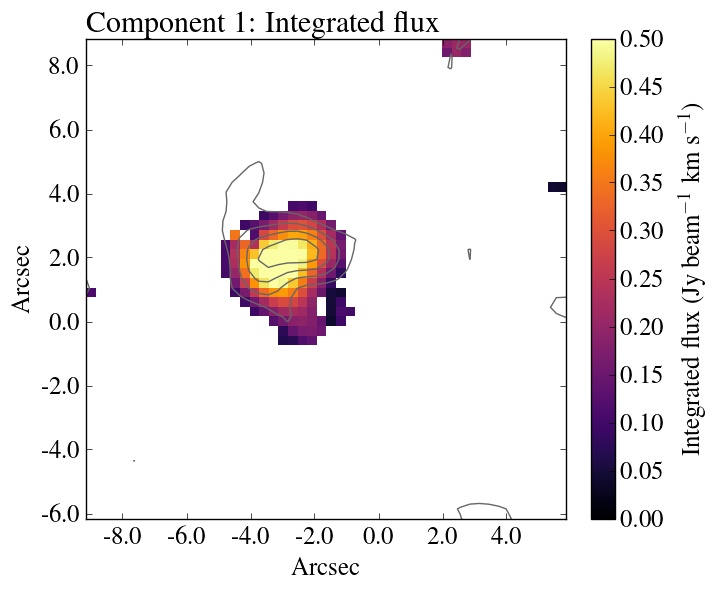
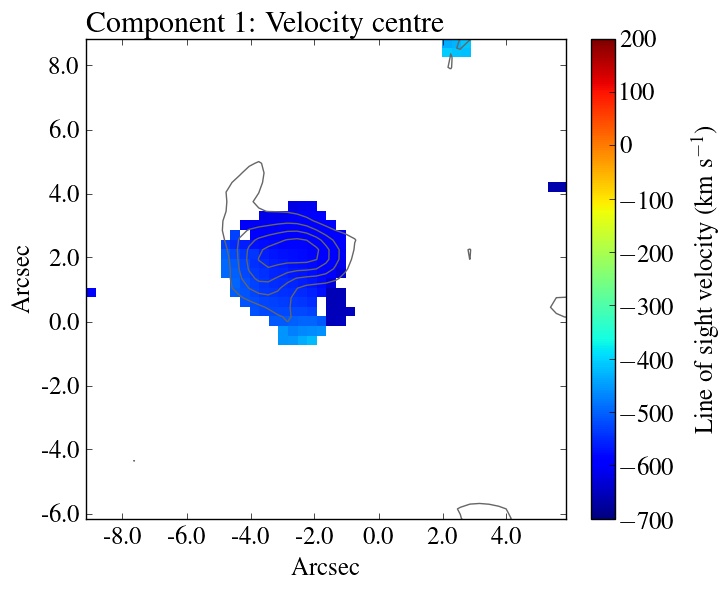
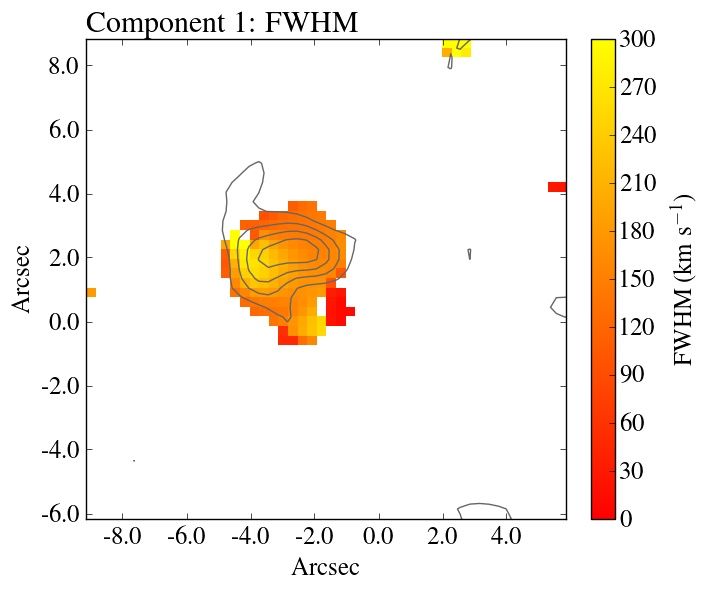
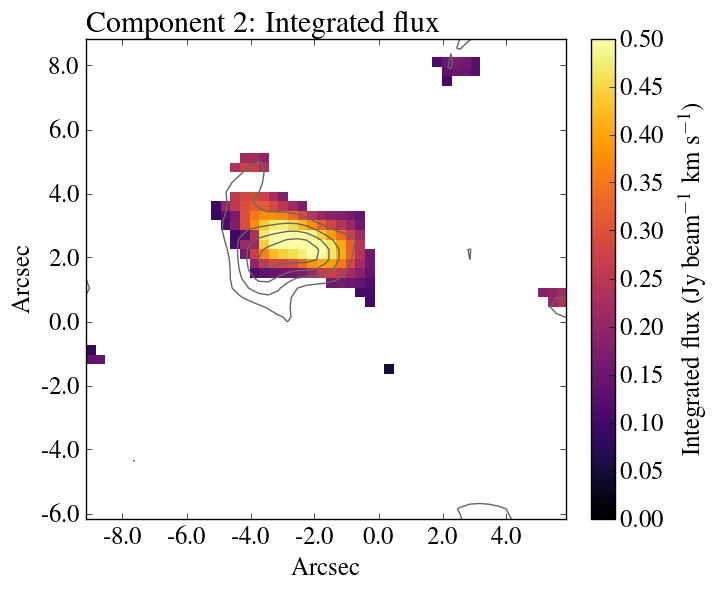
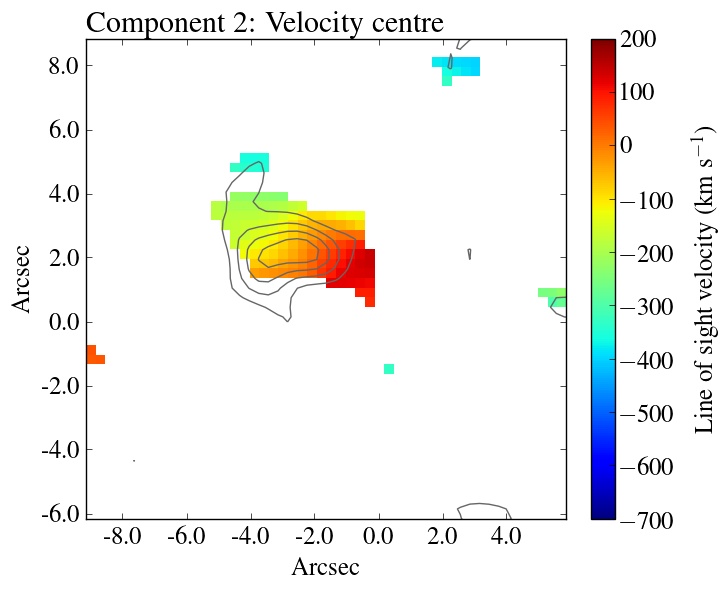
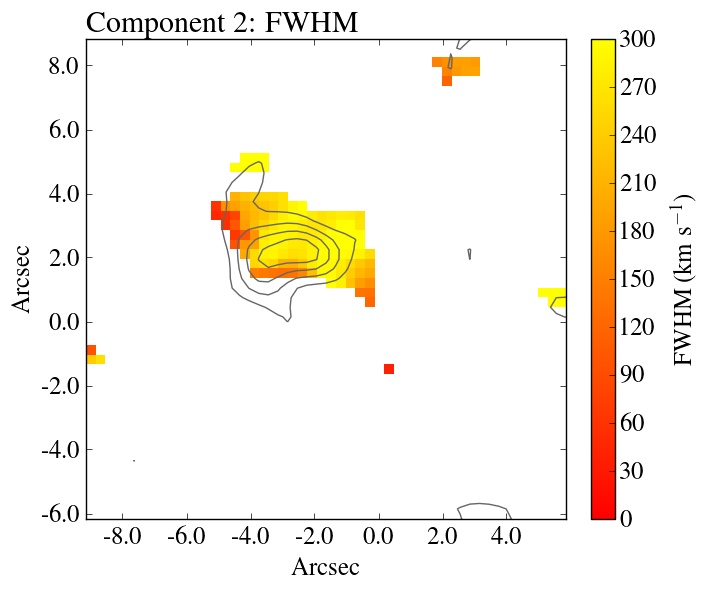
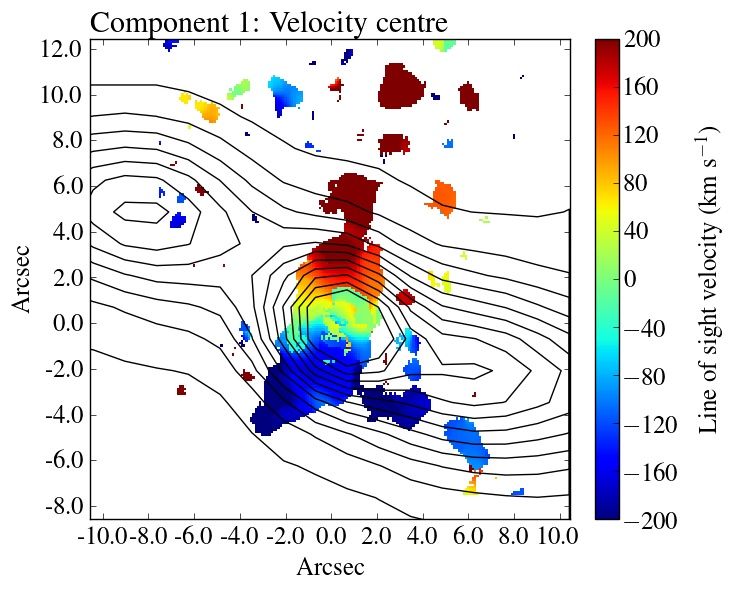
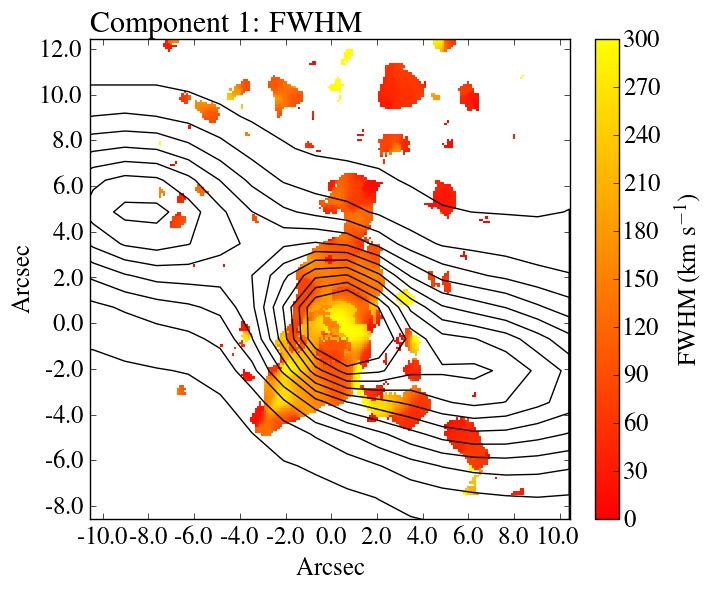
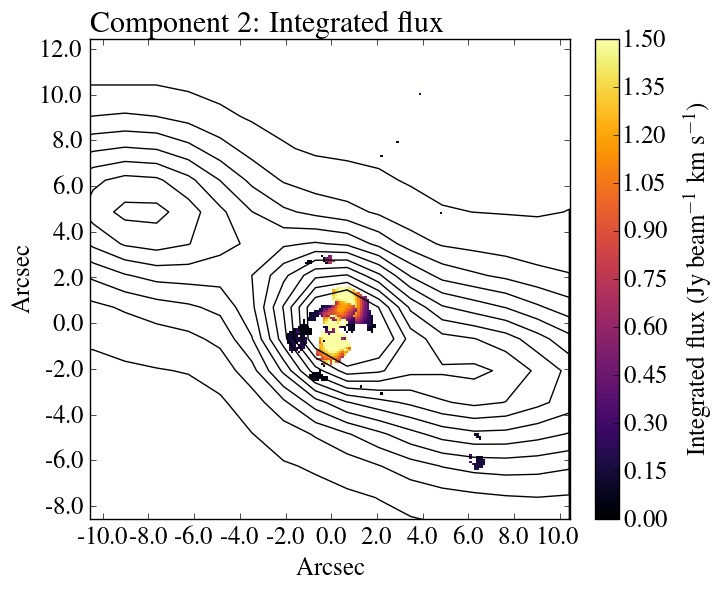
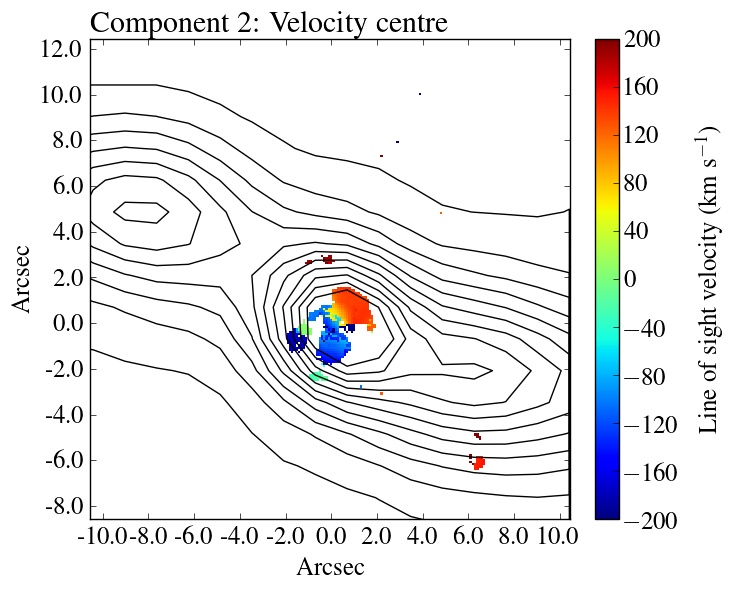
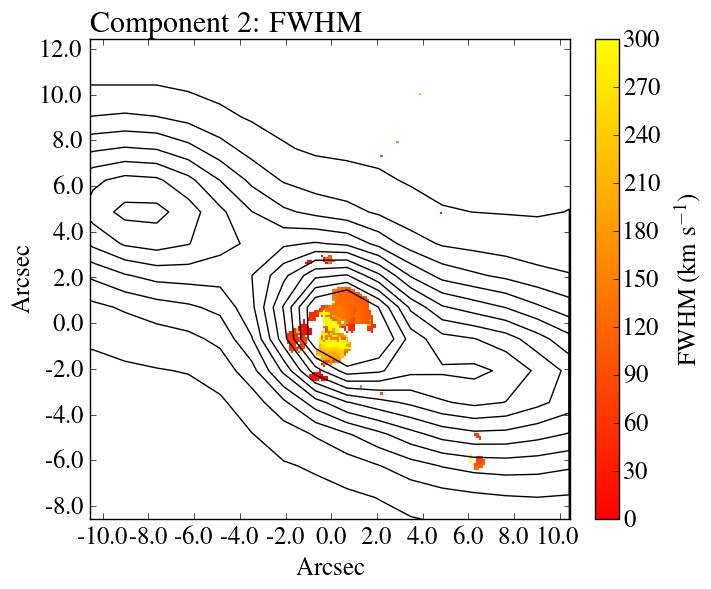
Maps of the gas velocities and line widths were generated by extracting spectra from each cube in synthesized beam-sized regions centred on each spatial pixel across the field of view. Each extracted spectrum was fitted with a model consisting of one, two and then three Gaussian components using mpfit. At least significance was required for the detection of an emission line in each region analysed. The significance was assessed by evaluating the number of false detections in Monte Carlo simulations based on a null hypothesis model with no emission line and the observed rms. Fig. 2 shows the velocity structure of the dominant component for a subset of the sample and maps of the best-fit line centre, FWHM and integrated intensity are shown for the full sample in the appendix (Figs. 8 to 21). We also extracted spectra from regions covering the full extent of the emission and individual structures, such as filaments. These spectra were similarly fitted with multiple Gaussian components as required and the best-fit parameters are detailed in the appendix.
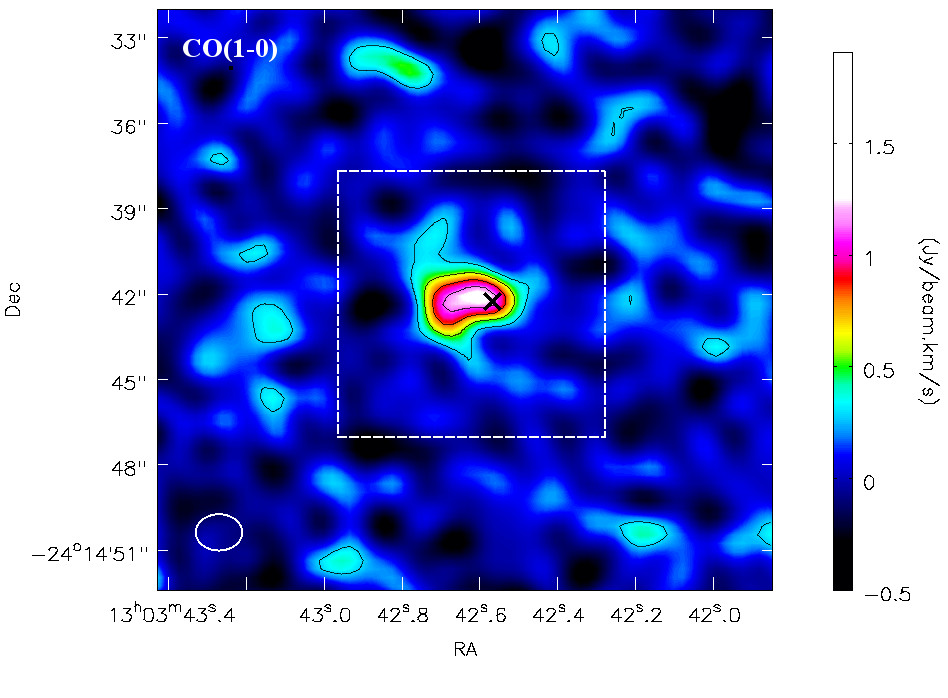
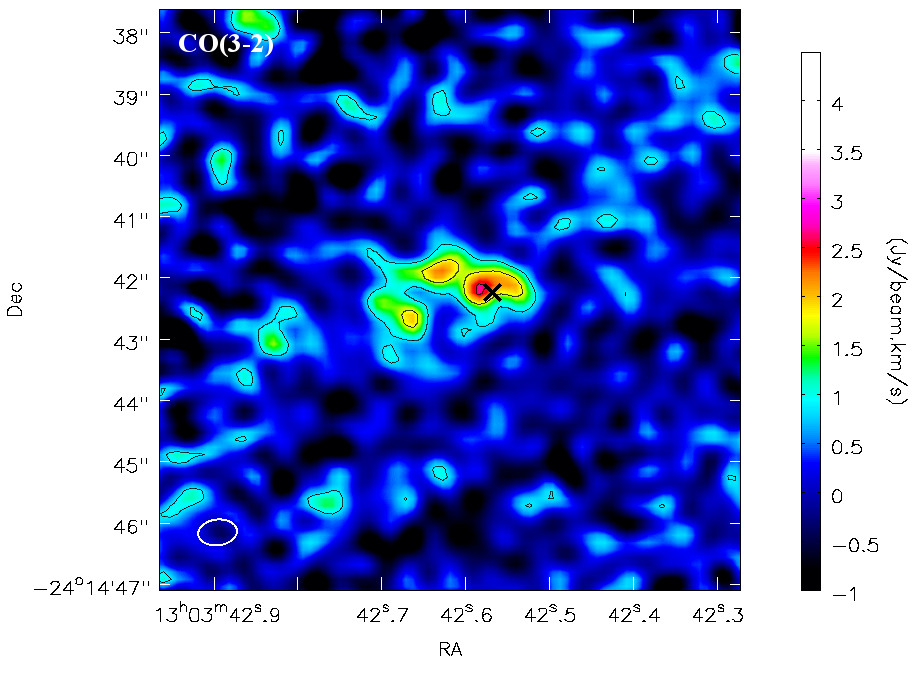
In several systems, the integrated intensity maps show distinct filaments of molecular gas that can be simply separated spatially. Note that the term ‘filament’ is used to describe an elongated molecular structure, at least a few kpc in length, that extends approximately radially from the galaxy centre (eg. PKS 0745, Phoenix, A1795). These filaments are not resolved in our observations and likely consist of many smaller strands (eg. Perseus cluster, Fabian et al. 2008; Gendron-Marsolais et al. 2018). We also identify clear and possible kpc-scale circumnuclear molecular gas disks in several systems where the emisson peak of a kpc-scale molecular structure is centred on the nucleus and the velocity structure is consistent with rotation about the galaxy’s systemic velocity. Whilst nearby Hydra A clearly hosts an edge-on molecular gas disk (Rose et al. 2019), the molecular emission peaks at the centre of the majority of our more distant targets are not resolved (eg. A1835, Phoenix). Higher resolution ALMA observations may therefore reveal smaller scale circumnuclear gas disks.
Molecular structures that are superimposed on the sky can instead often be separated spectrally. For example in A1664 and Phoenix, an additional velocity component at the galaxy centre is consistent with a circumnuclear gas disk. In A2597, although the majority of the molecular structure is difficult to disentangle, a second velocity component is detected in the emission around the NE and S radio lobes, which could indicate entrained gas. The CO line flux is detailed in the appendix for each molecular structure that could be cleanly separated spatially and/or spectrally for each target and the unresolved emission centred on the nucleus.
3.1 Molecular gas morphology
The molecular gas morphology ranges from filament-dominated sources, for which the archetype is the Perseus cluster (eg. Salomé et al. 2006; Salomé et al. 2011), to disk-dominated sources, such as Hydra A (eg. Hamer et al. 2014, Rose et al. 2019). The ALMA targets form a continuous distribution within these extremes (Fig. 1). In A1795 and PKS 0745, of the molecular gas reservoir lies in extended filaments. In Phoenix and A1664, the molecular gas is split more evenly between a possible circumnuclear disk (see section 3.2), and extended filaments. For A2597 and A1835, the filaments and circumnuclear structures are more difficult to cleanly disentangle and we estimate that at least a third of the molecular gas lies in the filaments. By comparison, in A262 and Hydra A, the majority of the molecular gas is resolved in a rotating circumnuclear gas disk (eg. Prandoni et al. 2007; Hatch et al. 2007) and only extends to larger radii. Disk-dominated sources are rare in our sample () with only these two clear examples. Improved spatial resolution may increase estimates of the fraction of molecular gas in the filaments (eg. A1835 and A2597) and could reveal smaller scale, low mass circumnuclear gas disks (eg. Perseus, Scharwächter et al. 2013; Nagai et al. 2019).
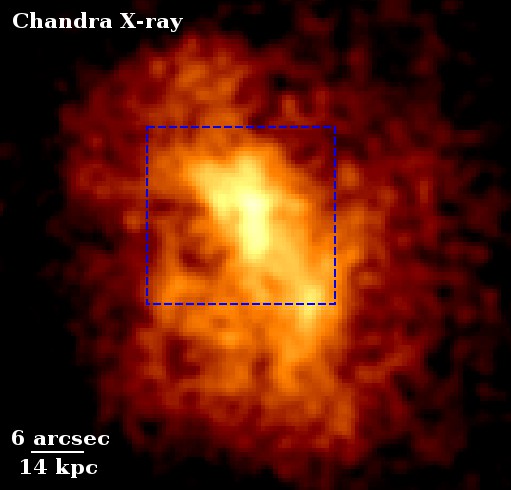
Filaments are entrained around or clearly extend toward X-ray cavities or radio bubbles in at least six of the twelve targets (A1795, Phoenix, PKS 0745, A1835, A2597, A262). In PKS 0745, for example, the SE filament extends toward the SE cavity, the N filament extends towards the more distant NW cavity. The SW filament is aligned with a lobe of radio emission that may originate in a new AGN outburst (Russell et al. 2016). The extended molecular emission coincides exclusively with the soft X-ray rim of a cavity and ionized gas filaments drawn up around this structure in a further three objects (RXJ 0821, RXCJ 1504, A2052). Whilst molecular structures in the remaining targets, 2A 0335, A1664 and NGC 5044, are apparently elongated toward X-ray cavities, the mismatch in spatial scales probed by ALMA and Chandra is too large to conclude a clear link (David et al. 2014; Vantyghem et al. 2016; Calzadilla et al. 2018).
The filaments are typically a few kpc in length on the sky but can extend up to (eg. Phoenix and Perseus). The measured filament extent will be dependent on the depth of each observation and the maximum resolvable scale of the array configuration (typically for these observations). Whilst comparisons between single dish and ALMA flux measurements suggest that the bulk of the molecular gas is captured by these ALMA observations (eg. Russell et al. 2014; McNamara et al. 2014; David et al. 2014), more extended, fainter filaments may have gone undetected. Molecular gas filaments are known to spatially coincide with ionized and soft X-ray filaments (Salomé & Combes 2004; Salomé et al. 2006; Lim et al. 2008), which typically extend significantly beyond the filaments detected in the existing ALMA observations (eg. A2052 Fig. 8, A1795 Fig. 12). For example, CO emission coincident with H-emitting filaments has been detected out to radius in single dish observations of the Perseus cluster (Salomé et al. 2011). Star-forming filaments in the Phoenix cluster extend even further to radius (McDonald et al. 2015). Therefore, whilst deeper observations with more compact ALMA configurations will likely reveal fainter, more extended structure, the majority of the molecular gas mass lies in filaments that are a few to long.
A clumpy, thin shell of molecular gas that surrounds an X-ray cavity will appear brightest around the rim where the line of sight through this gas is greatest. This would explain why the molecular gas is preferentially detected as filaments around the outer edges of the X-ray cavities in several observations. However, this does not explain why molecular gas is preferentially detected along only the outer edge of each radio lobe in A1795 and the W side of the N X-ray cavity in the Phoenix cluster (Figs. 12 and 16). This uneven distribution could be due to the clumpy nature of the filaments or the collapse of some molecular filaments into stars (eg. A1795, Russell et al. 2017a). A particularly bright molecular gas clump in the N filament of A1795 is also spatially coincident with a notch in the radio lobe. The additional molecular velocity components in this region (Fig. 13), together with increases in the ionized gas velocity, line width and ionization state (Crawford et al. 2005), suggest possible collisions with the expanding radio lobe. The collision may enhance emission from the molecular gas.
In addition to the prevalence of extended molecular filaments, the molecular emission peak in the majority of the ALMA targets is offset from the AGN by projected distances of . The exceptions are the disk-dominated systems, such as A1664 and A262, where the nucleus appears spatially coincident with the molecular peak within the uncertainties. RXJ0821 features the largest projected offset of between the central galaxy’s nucleus and the molecular gas peak. Vantyghem et al. (2018) suggest the wholesale displacement of the molecular reservoir in this system is due to sloshing motions in the intracluster medium triggered by the close passage of a nearby galaxy. In the rest of the sample, the offsets between the AGN and the molecular peak are more typically and in several systems, where the filamentary structure is resolved, this is due to bright gas clumps in the filaments entrained around X-ray cavities (eg. PKS 0745, A1795, Figs. 10 and 12).
In summary, the cold gas morphology in our sample of central galaxies ranges between filament-dominated systems, including Perseus and A1795, and rarer disk-dominated systems, such as Hydra A and A262. In filament-dominated systems, over 70% of the molecular gas lies in several massive filaments that extend radially out to . For the majority of the central galaxies targeted, the molecular gas is split more evenly between the filamentary structure and a circumnuclear peak. Molecular filaments are entrained around or extended toward radio bubbles or X-ray cavities in at least 50% of the systems observed. Deeper observations with improved spatial resolution will likely increase this fraction. Disk-dominated systems also appear rare in our sample. Although we are limited by small number statistics, the ALMA targets were not selected on their dynamics so the low fraction of disks is likely to be representative.
3.2 Velocity structure
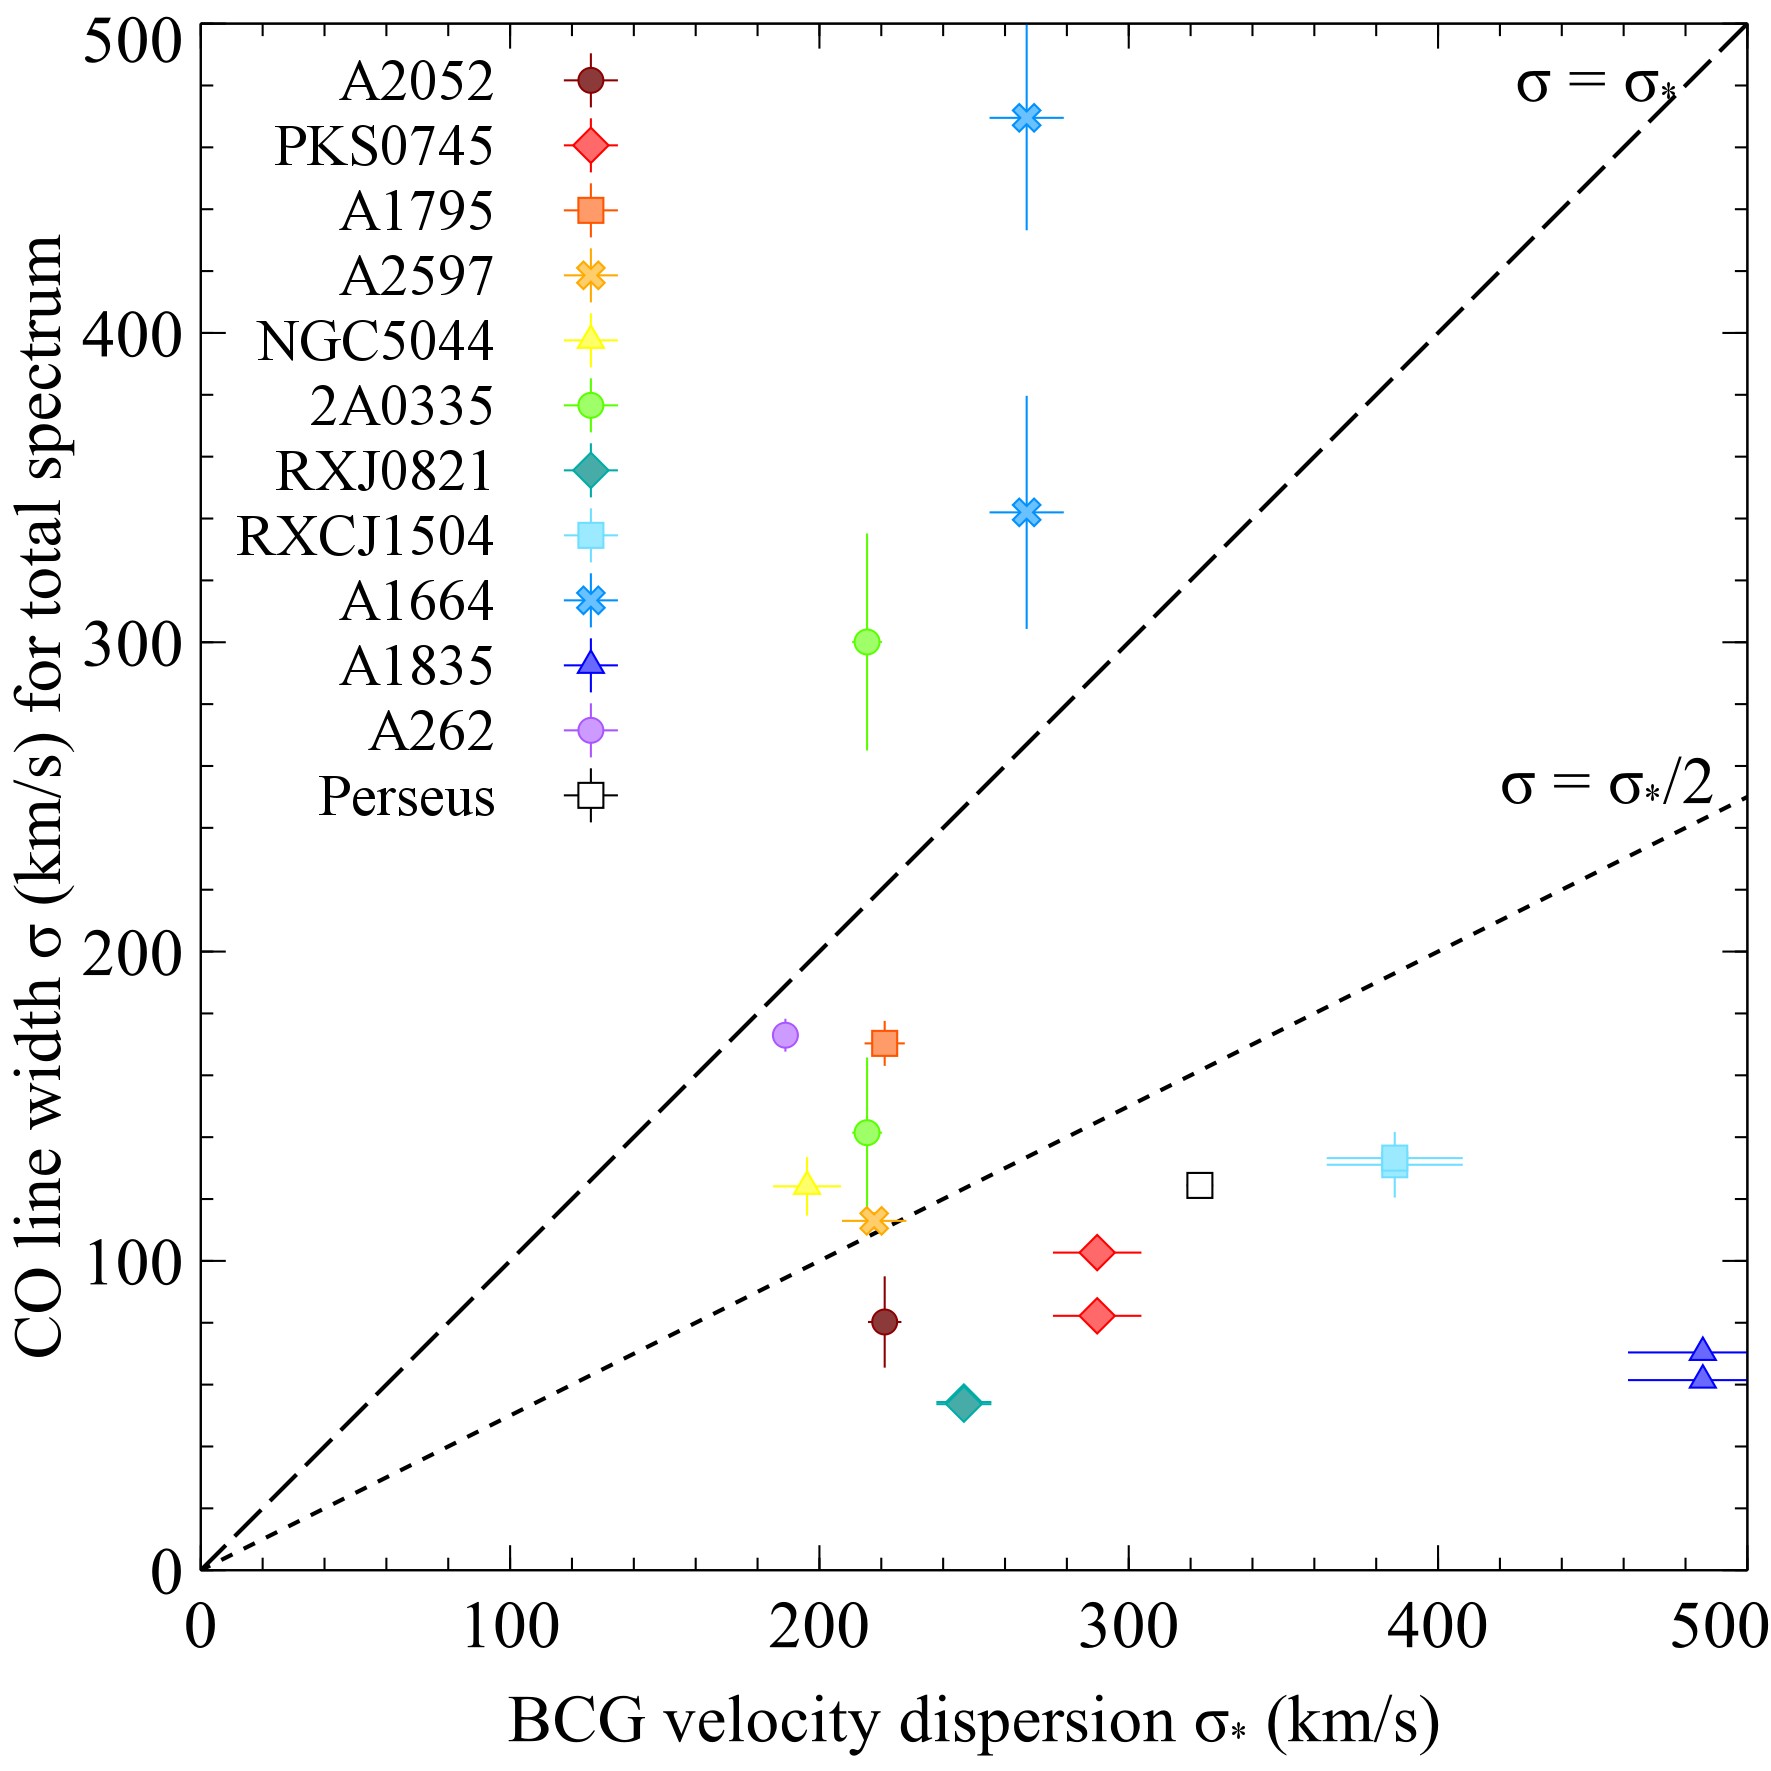
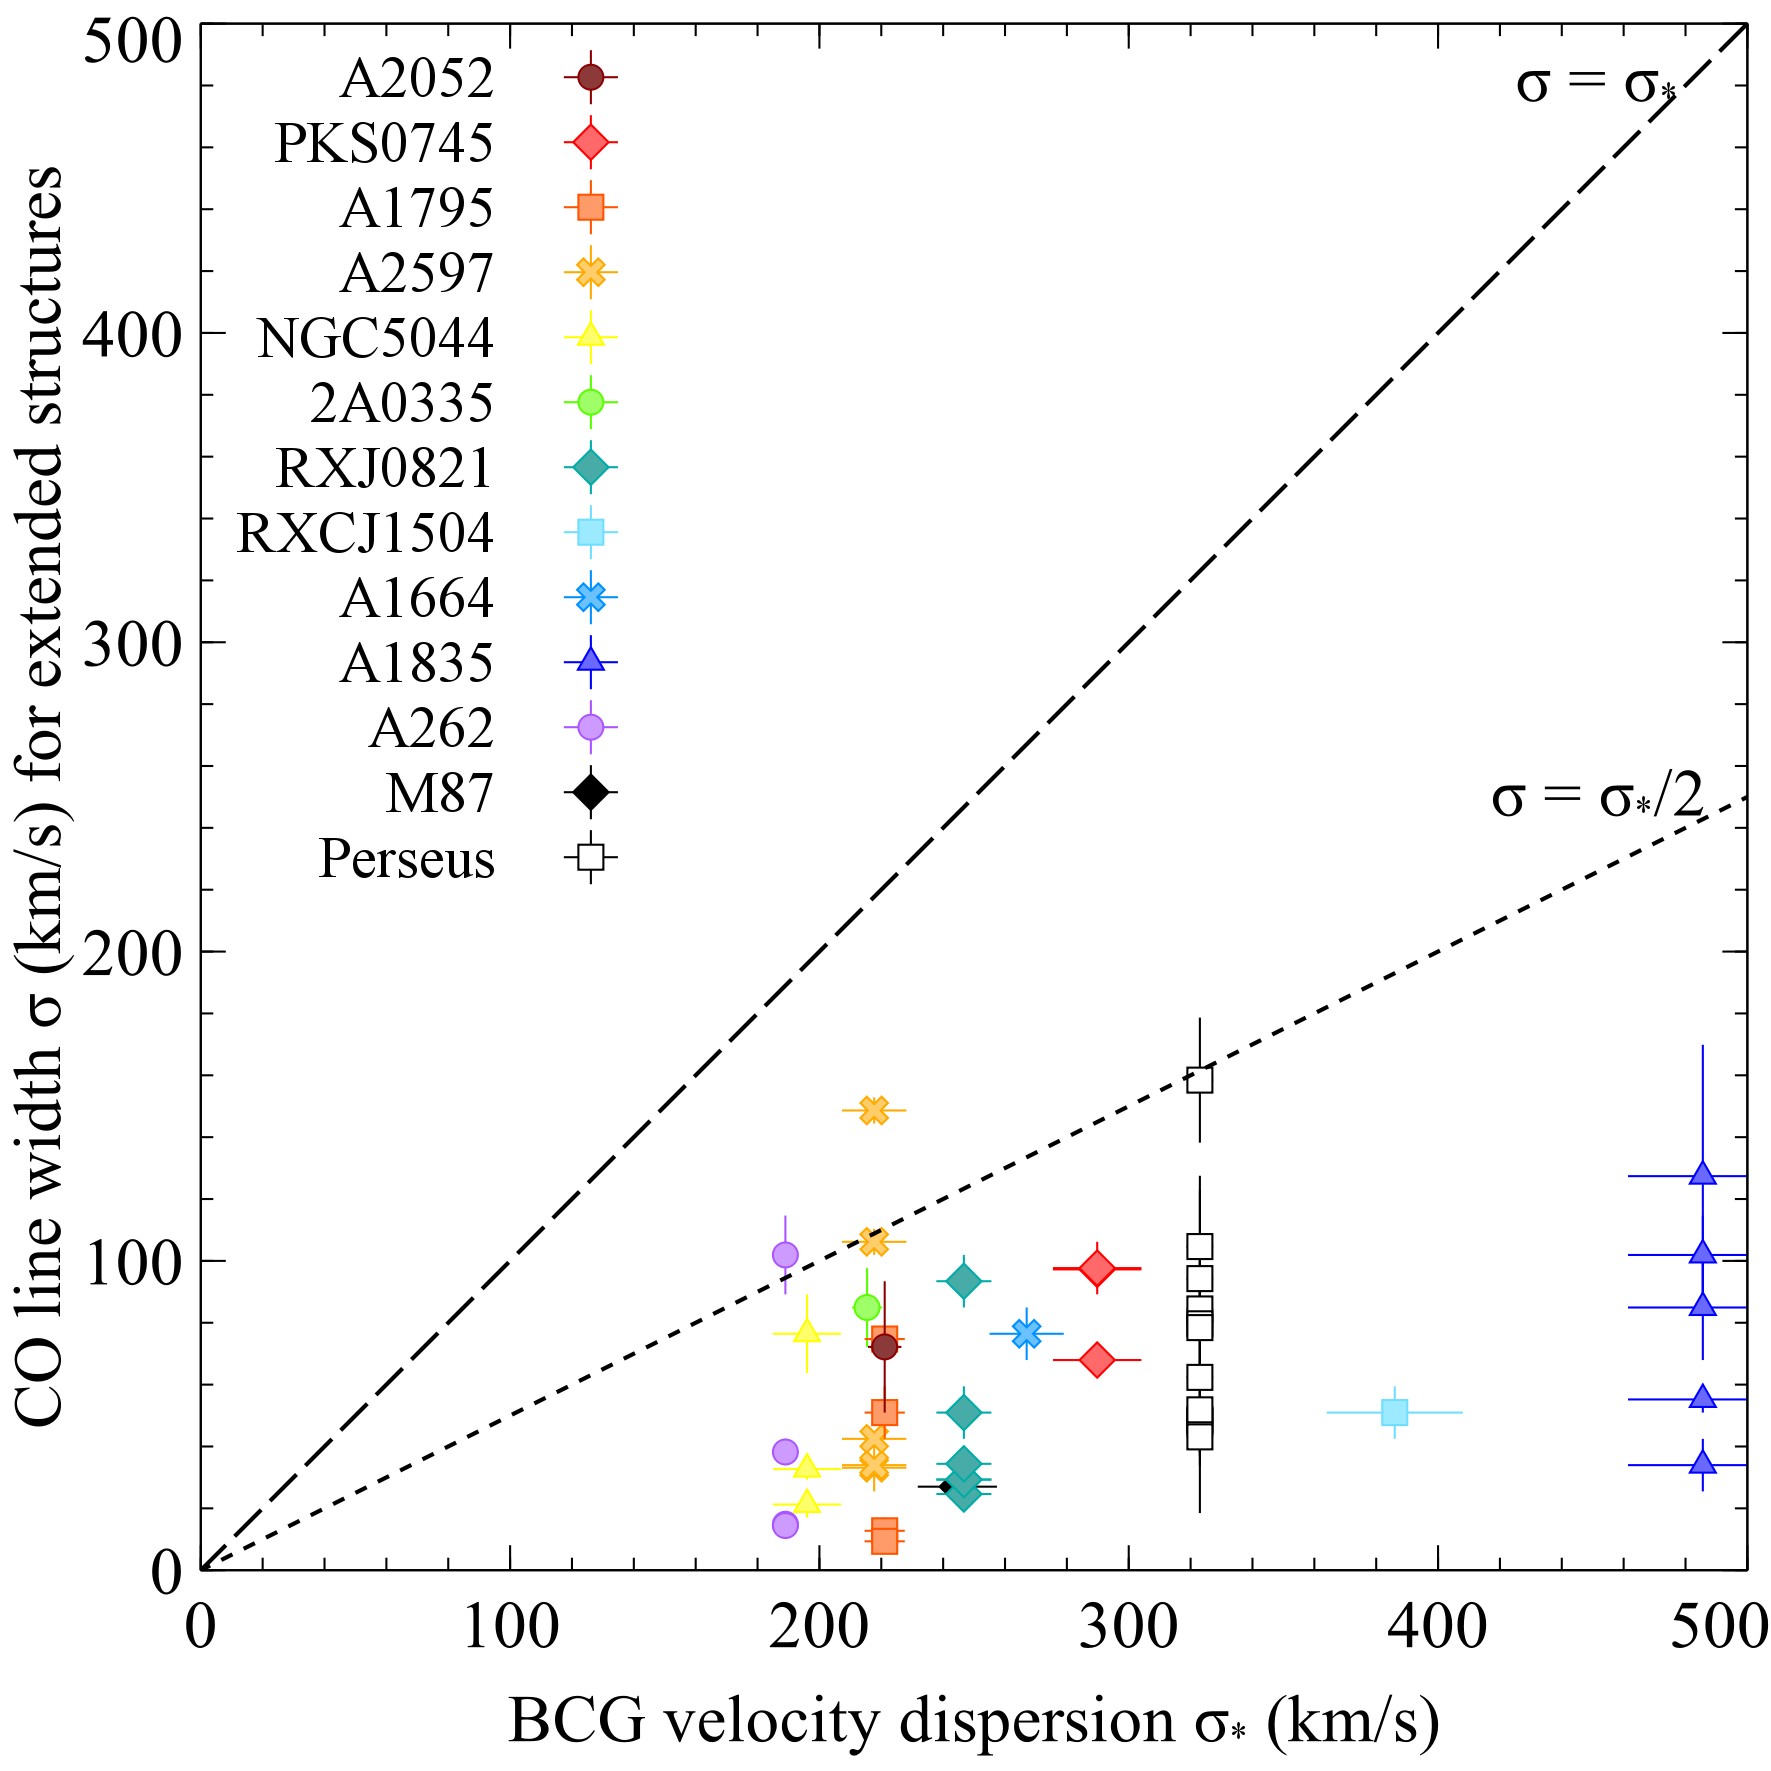
Fig. 2 shows a subset of the velocity maps to demonstrate the smooth velocity gradients along the extended filaments drawn up around radio bubbles and the ordered rotation in the circumnuclear disks. In the Perseus cluster, several extended ionized gas filaments have smooth velocity gradients along their lengths, which match molecular gas velocities in overlapping regions from single dish observations (Hatch et al. 2006; Revaz et al. 2008; Salomé et al. 2011). These gradients match simulations of streamlines behind buoyantly rising radio bubbles. We note that the smaller strands that make up these filaments may have more complex dynamics within this larger scale smooth gradient (eg. Hatch et al. 2006; Gendron-Marsolais et al. 2018).
Similarly, ALMA observations of the molecular filaments around or beneath radio bubbles in A1795, Phoenix, PKS 0745, 2A 0335, RXCJ 1504 and RXJ 0821 have smooth velocity gradients along their lengths or over few kpc-long sections. A1795 and Phoenix represent the most spectacular examples where filaments are exclusively drawn up around radio bubbles. The gas velocities are remarkably ordered over in length and several hundred . In A2052, the velocity of the molecular gas blobs is consistent with the spatially-coincident ionized filaments, which also have smooth gradients around the radio bubble rims (Balmaverde et al. 2018).
The disk-dominated systems also feature an ordered velocity structure consistent with rotation about the galaxy centre. The archetype Hydra A hosts an edge-on disk, across. IFU observations of the ionized and warm molecular hydrogen show rotation in a plane perpendicular to the radio jet axis (Hamer et al. 2014). ALMA observations of A262 show a similarly ordered circumnuclear disk from to centred on the AGN and oriented perpendicular to the radio jet axis (Fig. 21). The disk’s velocity structure matches that observed in the ionized gas (Hatch et al. 2007) and is consistent with the IRAM CO line profile (Prandoni et al. 2007). A1664 hosts two distinct velocity structures: a high velocity gas flow at and a possible nascent disk spanning to centred on the nucleus (Russell et al. 2014). Similarly, in addition to the extended filaments, the Phoenix cluster has a second velocity component in the circumnuclear peak which exhibits a smooth velocity shift from to across the nucleus over (Russell et al. 2017b). This could correspond to a rotating gas disk that is oriented perpendicular to the radio bubble axis. Other systems, such as A1835 and A2597, host more complex circumnuclear structure that is suggestive of rotation but is currently poorly resolved (McNamara et al. 2014; Tremblay et al. 2018).
In summary, both the circumnuclear disks and filaments entrained around radio bubbles exhibit ordered velocity structure. The filaments have smooth, shallow velocity gradients spanning a few hundred and a few to tens of kpc. Simulations have shown that these velocity gradients are consistent with gas flows tracing streamlines around the buoyantly rising radio bubbles. Circumnuclear gas disks are rarer in our sample. The clear examples in A262 and Hydra A show ordered rotation over and in a plane perpendicular to the radio jet or lobe axis.
3.2.1 Low molecular gas velocities
As has previously been noted for individual ALMA targets (McNamara et al. 2014; Russell et al. 2016), the molecular gas velocities in these systems are surprisingly low and generally fall significantly below the stellar velocity dispersion. The molecular gas velocities are also much lower than the escape velocity for the central galaxies in this sample, typically . Therefore the molecular gas remains firmly bound to the galaxy even in the highest velocity structures, such as the high velocity filament in A1664 at (Fig. 19).
Fig. 3 (left) compares the equivalent stellar velocity dispersion of the central galaxy (, Hogan et al. 2017; Pulido et al. 2018) with the CO velocity dispersion () for a single Gaussian component fit to each target. The CO line widths are particularly narrow compared to the stellar dispersions for the majority of our sample with . The exceptions are A262, which is dominated by a rotating gas disk, across, and A1664 and 2A0335, which feature multiple velocity components spread over a wide range in velocity and are therefore particularly poorly described by a single Gaussian model. In A1835, RXCJ1504, PKS0745, RXJ0821 and A2052, the CO line width falls significantly below half of the equivalent stellar velocity dispersion. Comparisons with single dish detections suggest that these ALMA observations detect the majority of the CO line emission and with similar line widths, which indicates that significant broader velocity components have not been missed. Therefore, for at least of the targets analysed, the cold molecular gas is not dynamically relaxed in the central galaxy’s gravitational potential.
Fig. 3 (right) demonstrates that the extended filaments are even more extreme. The CO velocity dispersion measured for the vast majority of the filaments falls significantly below half of the equivalent stellar velocity dispersion. The filaments are not rotationally supported. Unless supported by another mechanism, they should free-fall in the cluster’s deep gravitational potential. Using models for the cluster potential, previous studies have shown that free-falling gas blobs in these systems will be accelerated to velocities of at least a few hundred over distances of only a few kpc (eg. Lim et al. 2008; Russell et al. 2016, 2017b; Vantyghem et al. 2016). The observed velocity gradients along the filaments are therefore much too shallow compared to the predictions for free-fall. Unless all filaments in the sample are oriented within of the plane of the sky, the velocity gradients of the most extended filaments are generally inconsistent with free-fall.
We note that observations at higher spatial resolutions, particularly of the more distant sources Phoenix and A1835, may reveal strands within each filament with more complex velocity structure. Whilst single-dish observations of Perseus at spatial resolutions of several kpc showed no overall pattern in the gas kinematics, SMA interferometric observations at a spatial resolution of revealed three radial filaments, of which the outer two have a velocity structure consistent with free fall (Lim et al. 2008; Ho et al. 2009b). The majority of the targets in our sample are observed with spatial resolutions of a kpc or better in at least one CO emission line (eg. Table 2). However, observations of Phoenix and A1835 currently have spatial resolutions of a few to . Therefore, similar to Perseus, more detailed observations may reveal more complex velocity structure.
3.2.2 Inflow and outflow
Smooth, radial velocity gradients along the filaments, combined with the clear morphological alignments with X-ray cavities and radio bubbles, suggest that the filaments are gas flows either inflowing or outflowing in the bubbles’ wakes. Unless the gas clouds in the filaments are also detected in absorption, it is impossible to determine whether they are located on the near or far-side of the central galaxy with respect to the nucleus. An absorption signature against the continuum emission from the AGN would place the gas cloud on the near-side of the galaxy, in front of the AGN. A blueshifted line would then indicate an outflow and a redshifted line would indicate an inflow. Absorption lines have been detected against the sub-mm nuclear continuum emission in NGC 5044, A2597 and Hydra A (David et al. 2014; Tremblay et al. 2016; Rose et al. 2019). The absorbing clouds have similarly low velocities as the emitting clouds and cover the same narrow dynamical range. The apparent motion relative to the AGN may indicate that these clouds are inflowing (David et al. 2014; Tremblay et al. 2016) or on stable, low ellipticity orbits (Rose et al. 2019). In the absence of absorption lines for the vast majority of the observed structures, general conclusions can be drawn from a sample of these filaments.
Filament-dominated systems are difficult to understand in a pure outflow scenario where molecular clouds are directly lifted from the galaxy centre by the radio bubbles. The radio bubbles would have to efficiently couple to the molecular gas to draw such a large fraction of the gas, in some cases exceeding (section 3.1), into extended filaments. This must be maintained over large distances out to to explain the observed filament lengths. The coupling must also be gentle. The gas velocities in the filaments do not typically exceed a few hundred . This is consistent with the lack of strong shocks around the radio bubbles in the hot X-ray atmosphere. The bubbles expand approximately in pressure equilibrium with the surrounding intracluster medium and the gas rims around them are relatively cool rather than shock-heated (eg. McNamara et al. 2000; Fabian et al. 2000). The morphology and kinematics of these gas flows are therefore starkly different from the fast () molecular outflows in nearby Seyferts, which are directly accelerated by interactions between the relativistic jet and the circumnuclear gas disk (eg. Morganti et al. 2013; García-Burillo et al. 2014; Tamhane et al. in prep.).
The remarkably large lifted fractions of molecular gas in the filament-dominated systems could be explained if the cold filaments originate in rapid cooling from a hot gas flow (McNamara et al. 2014). X-ray observations show that the radio bubbles displace and lift a substantial mass of the low entropy X-ray gas surrounding the central galaxy. These hot gas flows can also be clearly traced as metal-rich plumes of gas along the radio bubble axis in nearby systems (Simionescu et al. 2008; Kirkpatrick et al. 2009) and are a feature of hydrodynamic simulations of AGN feedback in clusters (eg. Pope et al. 2010; Gaspari et al. 2011). Cool gas nebulae and star formation are preferentially detected in central cluster galaxies when the entropy index in the hot atmosphere falls below (Cavagnolo et al. 2008; Rafferty et al. 2008). This sharp threshold implies that the cold gas originates from the development of thermal instabilities in the hot atmosphere (Nulsen 1986; Pizzolato & Soker 2005; Gaspari et al. 2013; Voit et al. 2015), which are stimulated when low entropy gas is lifted in the wakes of radio bubbles (Salomé et al. 2006; Salomé et al. 2011; McNamara et al. 2016). The cool gas would then trace streamlines around and behind the radio bubble, similar to the observed radial filamentary morphology, and be spatially coincident with filaments of soft X-ray emission and intermediate temperature gas, as observed (Fabian et al. 2003a; Hatch et al. 2006; McDonald et al. 2012b; Lim et al. 2012). Hitomi X-ray microcalorimeter observations of the Perseus cluster also showed that the intracluster medium in the wake of the NW radio bubble has a similar velocity gradient and low dispersion to the spatially coincident cool gas filaments (Hitomi Collaboration 2016). We consider the formation, energetics and fate of these molecular flows in detail in section 4.
The molecular gas may retain the velocity structure of the hot gas flow or decouple from the hot flow and fall back towards the galaxy centre. Molecular gas that is still coupled or recently decoupled from a rising radio bubble may not have yet reached a high infall speed. In A1795, the gas velocity along the N filament transitions smoothly from the average velocity of the surrounding galaxies at the furthest extent to the central galaxy’s systemic velocity at the nucleus. Similarly in Phoenix, the remarkably similar gas velocity at the furthest extent of the filaments (regions that are apart) suggest that the cold gas is coupled or recently decoupled from the hot atmosphere, which is moving relative to the central galaxy. Unless all molecular gas blobs are decoupling simultaneously along the filament, which seems unlikely in our range of targets, we would expect to detect higher infall velocities at small radii. These higher velocity gas blobs are more likely to be superimposed on other structures at the galaxy centre and therefore potentially more difficult to disentangle. However, if the molecular gas was free-falling, we would still expect to detect the corresponding higher velocities or broader FWHM at small radii. We would also expect to detect many more circumnuclear disks, which would grow rapidly if fed by free-falling cold gas blobs. Only a very limited fraction of the massive molecular filaments can be consumed by the observed low levels of star formation and black hole activity. Instead, the filaments must be slowed and supported by an additional mechanism.
For typical ICM densities and average molecular filament densities of , ram pressure from the intracluster medium does not significantly affect the infalling velocity of the filaments unless the gas blobs are mists of smaller clouds (see section 4.2, eg. Nulsen 1986; Li et al. 2018). These structures would have a lower mean density and would be slowed by drag in the hot atmosphere. Observations at higher spatial resolution could resolve the filaments in the nearest targets to determine if they are thread-like or fluffier clouds (eg. Fabian et al. 2008).
Based on the survival of the extended, dense gas filaments in the nearby Perseus cluster for at least a dynamical timescale (of order ), Fabian et al. (2008) and Ho et al. (2009b) invoke the stabilizing mechanisms of magnetic stresses and turbulence to insulate and support the cold clouds in the hot, high pressure cluster atmosphere and prevent their collapse. For filament densities of and temperatures , the thermal pressure in the molecular gas is times the thermal pressure of the surrounding hot atmosphere. The molecular gas might be supported by another phase or partially by turbulence too, but another mechanism dominates the pressure and prevents collapse. Conditions are ripe for magnetic support, especially if the molecular clouds consist of many thin threads or mists of smaller clouds.
Our additional requirement that a supportive mechanism also slows infall of the filaments along their lengths requires a more complex magnetic field topology, such as helical fields. The demands on magnetic support are substantial for these massive molecular filaments and can require a magnetic pressure roughly an order of magnitude greater than the thermal pressure (eg. Russell et al. 2016, 2017a). It is not clear how such a magnetic field topology would be generated, although we note that simulations of buoyant radio bubbles also invoke helical field topologies to preserve them against hydrodynamical instabilities (eg. Ruszkowski et al. 2007; Bambic et al. 2018).
In summary, smooth, radial velocity gradients along the filaments and clear morphological alignments with X-ray cavities and radio bubbles suggest that the molecular filaments trace gas flows entrained by the buoyantly rising bubbles. The cold filaments likely originate from the development of thermal instabilities in low entropy X-ray gas, which is triggered when the gas is lifted in the wakes of the radio bubbles. The molecular gas clouds may decouple from the hot flow and fall back towards the galaxy centre. The smooth velocity gradients along their lengths are significantly shallower than expected for gravitational free-fall. The gas clouds must be slowed, potentially by magnetic stresses.
3.2.3 Multiple velocity components
The velocity maps generated for this sample (section 3.2) also reveal additional velocity components in particular regions for the majority of the targets analysed. These additional components are due to the superposition of different molecular structures along the line of sight. In the Phoenix cluster (Fig. 17), for example, the putative disk of gas with velocities from to at the galaxy centre is spatially coincident with the inner sections of the extended filaments at and . These different structures that overlap in projection can therefore be separated in velocity space. Similarly in A1664, the nascent disk is kinematically distinct from the high velocity filament at (Fig. 19).
The additional velocity components may also reveal direct interactions with the radio lobes and correspond to a superposition of infalling or outflowing filaments tracing streamlines in the wakes of bouyant bubbles (section 3.2.2). In A1795, A1835 and A2597, we detect additional blue- and redshifted velocity components either side of the nucleus that are aligned with the radio lobes and bubbles (Russell et al. 2017a; McNamara et al. 2014; Tremblay et al. 2018). For A1795, these additional components are clearly located along the outer edges of sharp bends in the radio lobes and are coincident with increases in the ionized gas velocity, line widths and higher ionization (Crawford et al. 2005). Whilst this indicates that some molecular gas is lifted directly by the radio jets and lobes, these additional velocity components comprise only a small fraction of the molecular flow. So it seems unlikely that a large fraction of the molecular gas is lifted in this way. Instead, gas lifted in the hot phase likely cools to form the bulk of the molecular clouds in situ (see section 3.2.2).
Although the additional velocity component at the centre of A262 may similarly indicate a bipolar gas flow, this structure is aligned in projection with the rotating gas disk and is oriented perpendicular to the larger scale radio lobe axis and extended filament (Fig. 21). The radio lobes may bend through large angles on small scales, similarly to A1795, or the additional velocity component may be related to non-circular motions within the disk. Similarly, for the remaining targets, including NGC 5044, RXJ0821 and RXCJ1504, the velocity structure is much more complex and the superimposed molecular structures overlap in both physical and velocity space.
3.3 Line ratios
| Target | Region | CO(3-2)/CO(1-0) |
|---|---|---|
| PKS0745 | Centre | |
| N filament | ||
| SE filament | ||
| SW filament | ||
| 2A0335 | Centre | |
| NW peak | ||
| SE peak | ||
| RXJ0821 | E peak | |
| W peak | ||
| RXCJ1504 | Peak | |
| Inner filament | ||
| Outer filament |
Four central galaxies in our sample were observed in detail at both CO(1-0) and CO(3-2) and were used to measure the corresponding line ratio. For an optically thick medium, as expected here, the line brightness ratio should be . Significantly higher CO line ratios in the extended filaments compared to the circumnuclear gas peaks could indicate that the gas in the filaments is more highly excited, optically thin and therefore more luminous than the material in the disk (eg. IC 5063, Dasyra et al. 2016). The fraction of the molecular gas in the filaments would therefore be significantly overestimated. We note that the CO(3-2) observations for the Cycle 0 targets, A1664 and A1835, resolve out the extended structure traced at CO(1-0) and the global line ratio is therefore not representative.
For the four remaining targets, PKS 0745, 2A 0335, RXJ 0821 and RXCJ 1504, the CO(3-2) cube was convolved with an appropriate 2D Gaussian so that the resulting synthesized beam matched that of the CO(1-0) observation. The integrated intensities (in ) for key molecular structures were then determined by extracting spectra from the same spatial regions in the CO(1-0) and CO(3-2) datasets and fitting a single Gaussian model. The measured line ratios are detailed in Table 3.
The CO(3-2)/CO(1-0) line ratio is consistent with for the vast majority of the regions and targets analysed. This is expected for a predominantly optically thick medium and in agreement with measurements of the global line ratios in earlier single dish observations (Edge 2001; Salomé & Combes 2003). There is also no clear spatial variation in the line ratio for the extended filaments compared to the central molecular gas peaks.
3.4 Molecular gas mass
The molecular gas mass can be estimated from the integrated CO intensity by assuming a CO-to-H2 () conversion factor and typical brightness line ratios for BCGs of CO(2-1)/CO(1-0) and CO(3-2)/CO(1-0) (eg. Salomé & Combes 2003; see section 3.3). From the integrated CO(1-0) intensity , the molecular gas mass is given by:
| (1) |
where is the redshift of the central galaxy, is the corresponding luminosity distance and (eg. Solomon et al. 1987; Solomon & Vanden Bout 2005). It is not clear, however, that the factor measured in the Milky Way and nearby spiral galaxies is applicable to central cluster galaxies (reviewed by Lim et al. 2017), for which equivalent measurements are not available. Measurements of the factor in nearby galaxies exhibit significant scatter and variations with environmental factors (for a review see Bolatto et al. 2013).
Previous studies of central cluster galaxies justified the use of by noting the approximately solar metallicity in the surrounding ICM, line ratios indicating optically thick gas and line widths for individual molecular clouds that are comparable to those in the Milky Way. The estimated factor of a few uncertainty introduced by this approach has now been verified by Vantyghem et al. (2017) who detected both 12CO(3-2) and 13CO(3-2) in RXJ 0821. The 13CO emission is generally optically thin and therefore traces the full volume of its emitting region, which allows an estimate of the total H2 column density, molecular gas mass and factor. Vantyghem et al. (2017) showed that adopting a Galactic conversion factor could overestimate the molecular gas mass by a factor of two in RXJ 0821. This is easily within the object-to-object scatter from extragalactic sources. Numerical simulations of molecular clouds with solar metallicity by Szűcs et al. (2016) have shown that the 13CO method of recovering the molecular gas mass systematically underpredicts the true mass by a factor of . This systematic would bring the estimated conversion factor in RXJ 0821 back in line with the Galactic value. We therefore used the Galactic CO-to-H2 conversion factor to calculate the molecular gas mass for the majority of the central galaxies in our sample with an associated factor of a few uncertainty.
The Phoenix cluster is an extreme example of a ULIRG with a star formation rate of (McDonald et al. 2012a). In the intensely star-forming environment of ULIRGs, the molecular gas exists at higher densities and temperatures and forms an extended warm phase, which results in far more luminous CO emission for the same gas mass and a lower by roughly a factor of 5 (eg. Downes et al. 1993; Solomon et al. 1997; Downes & Solomon 1998). For the Phoenix cluster, we therefore assume as appropriate for a ULIRG. As discussed in section 3.3, the observed lack of spatial variation in the CO line ratio in the subset of galaxies analysed suggests that the physical properties of the molecular gas are similar across the nebula. It therefore appears unlikely that the factor varies dramatically in the filaments compared to the central peak.
3.5 Continuum
For all central galaxies in our sample (except RXJ 0821, see Vantyghem et al. 2019), the continuum emission is unresolved and consistent with a nuclear point source. The measured sub-mm continuum fluxes are given in Table LABEL:tab:cont. The sub-mm continuum is typically coincident with an unresolved radio source (eg. Hogan et al. 2015a) and, for systems with deep Chandra observations, also detected as a faint hard X-ray point source (eg. Russell et al. 2013). The sub-mm continuum flux is also typically consistent, within the observed variability, with synchrotron emission from the flat spectrum radio core (Hogan et al. 2015b). The nuclear point source therefore likely corresponds to a radiatively inefficient AGN. The vast majority of the nuclei in these central galaxies are therefore currently accreting and active.
CO absorption lines have previously been detected in three sources considered here, NGC 5044, A2597 and Hydra A (David et al. 2014; Tremblay et al. 2016; Rose et al. 2019). We confirmed these detections but did not detect any further narrow CO absorption features against the generally weak nuclear continuum emission in the rest of our sample.
| Target | RA | Dec | Peak | |
|---|---|---|---|---|
| (GHz) | (mJy) | |||
| A2052 | 229.48 | 15:16:44.489 | +07:01:17.83 | |
| PKS0745 | 103.53 | 07:47:31.321 | -19:17:39.97 | |
| 314.58 | ||||
| A1795 | 225.76 | 13:48:52.495 | +26:35:34.32 | |
| A2597 | 221.33 | 23:25:19.733 | -12:07:27.18 | |
| NGC5044 | 235.20 | 13:15:23.961 | -16:23:07.49 | |
| 2A0335 | 110.35 | 03:38:40.548 | +09:58:12.07 | |
| 335.15 | ||||
| RXJ0821 | 98.80 | 08:21:02.198 | +07:51:48.81 | |
| 304.70 | ||||
| RXCJ1504 | 101.69 | 15:04:07.518 | -02:48:16.63 | |
| 291.36 | ||||
| Phoenix | 225.09 | 23:44:43.902 | -42:43:12.53 | |
| A1664 | 96.27 | 13:03:42.567 | -24:14:42.23 | |
| 300.63 | ||||
| A1835 | 97.89 | 14:01:02.083 | +02:52:42.65 | |
| 282.91 | ||||
| A262 | 235.74 | 01:52:46.456 | +36:09:06.42 |
4 Discussion
The molecular gas reservoirs in the central cluster galaxies form a continuous distribution in morphology from filament-dominated to disk-dominated (Fig. 1). Filament-dominated sources, such as the Perseus cluster, A1795 and PKS 0745, feature molecular filaments extending a few to tens of kpc, which encompass the majority of the molecular gas mass. In contrast, the molecular gas in disk-dominated sources, Hydra A and A262, is concentrated in a circumnuclear rotating disk with wispy filaments comprising of the molecular gas mass. Disk-dominated systems appear rare and the majority of the ALMA targets lie in a continuum between these extremes with the molecular gas split more evenly between a central peak and extended filaments.
The extended molecular filaments are clearly entrained around or drawn up in the wakes of radio bubbles inflated by the AGN in at least six of the twelve central galaxies. Although several molecular structures in the remaining targets appear aligned with X-ray cavities, any clear morphological link is weakened by the mismatch in spatial scales probed by ALMA and Chandra. A1795 represents the most spectacular example of this entrainment. Molecular gas in the central galaxy is exclusively projected around the outer edges of the radio lobes and particularly bright clumps of cold gas are coincident with notches and bends in the radio lobes (Fig. 12). Filaments typically have smooth velocity gradients along their lengths spanning a few hundred and narrow FWHM . The filaments are therefore gas flows tracing streamlines around and behind the radio bubbles, which may retain the velocity structure of the rising bubble or decouple and slowly fall back towards the galaxy centre.
The molecular gas velocities in these central galaxies are low and fall significantly below the galaxy’s stellar velocity dispersion. The gas flows are moving too slowly to escape the central galaxy and even the highest velocity structures at in the Phoenix cluster and A1664 will remain bound. With the exceptions of the large circumnuclear gas disks, the molecular gas structures have low velocities and dispersions and are therefore not settled in the gravitational potential. The gas flows are also not in free-fall and must be decelerated, potentially by some combination of ram pressure or magnetic fields. The distribution in morphology from disk- to filament-dominated sources suggests a slowly varying, dynamic environment dictated by the episodic activity of the jet-inflated bubbles (eg. in the Perseus cluster, Lim et al. 2008; Salomé et al. 2006; Salomé et al. 2011).
4.1 Origin of the molecular gas in central cluster galaxies
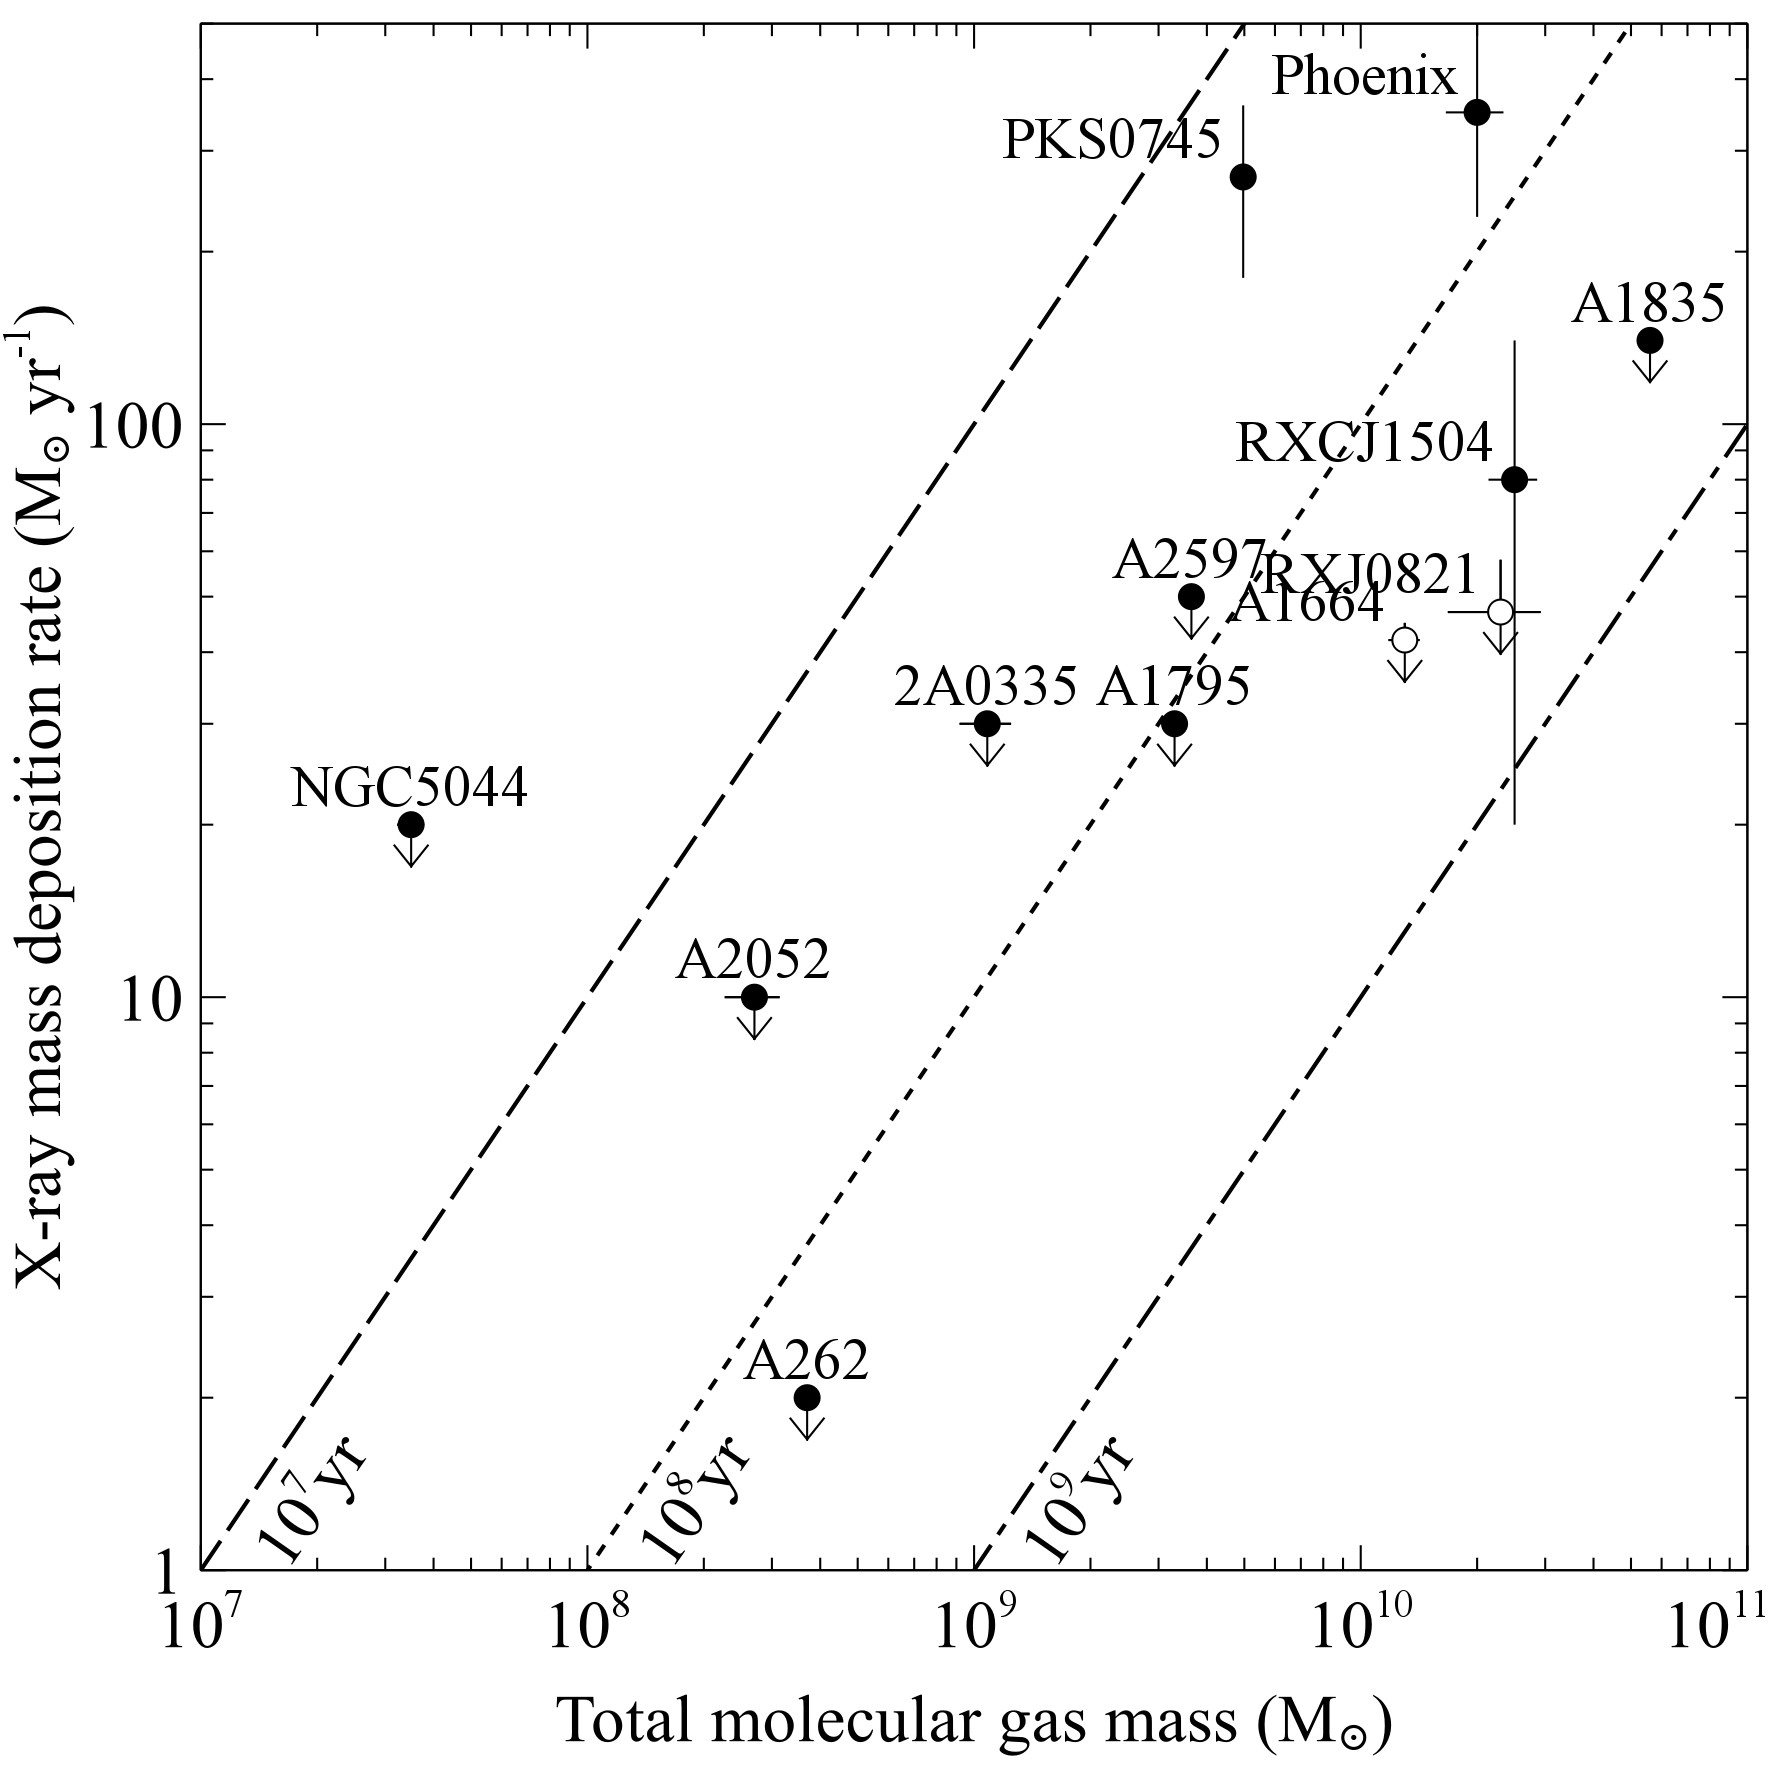
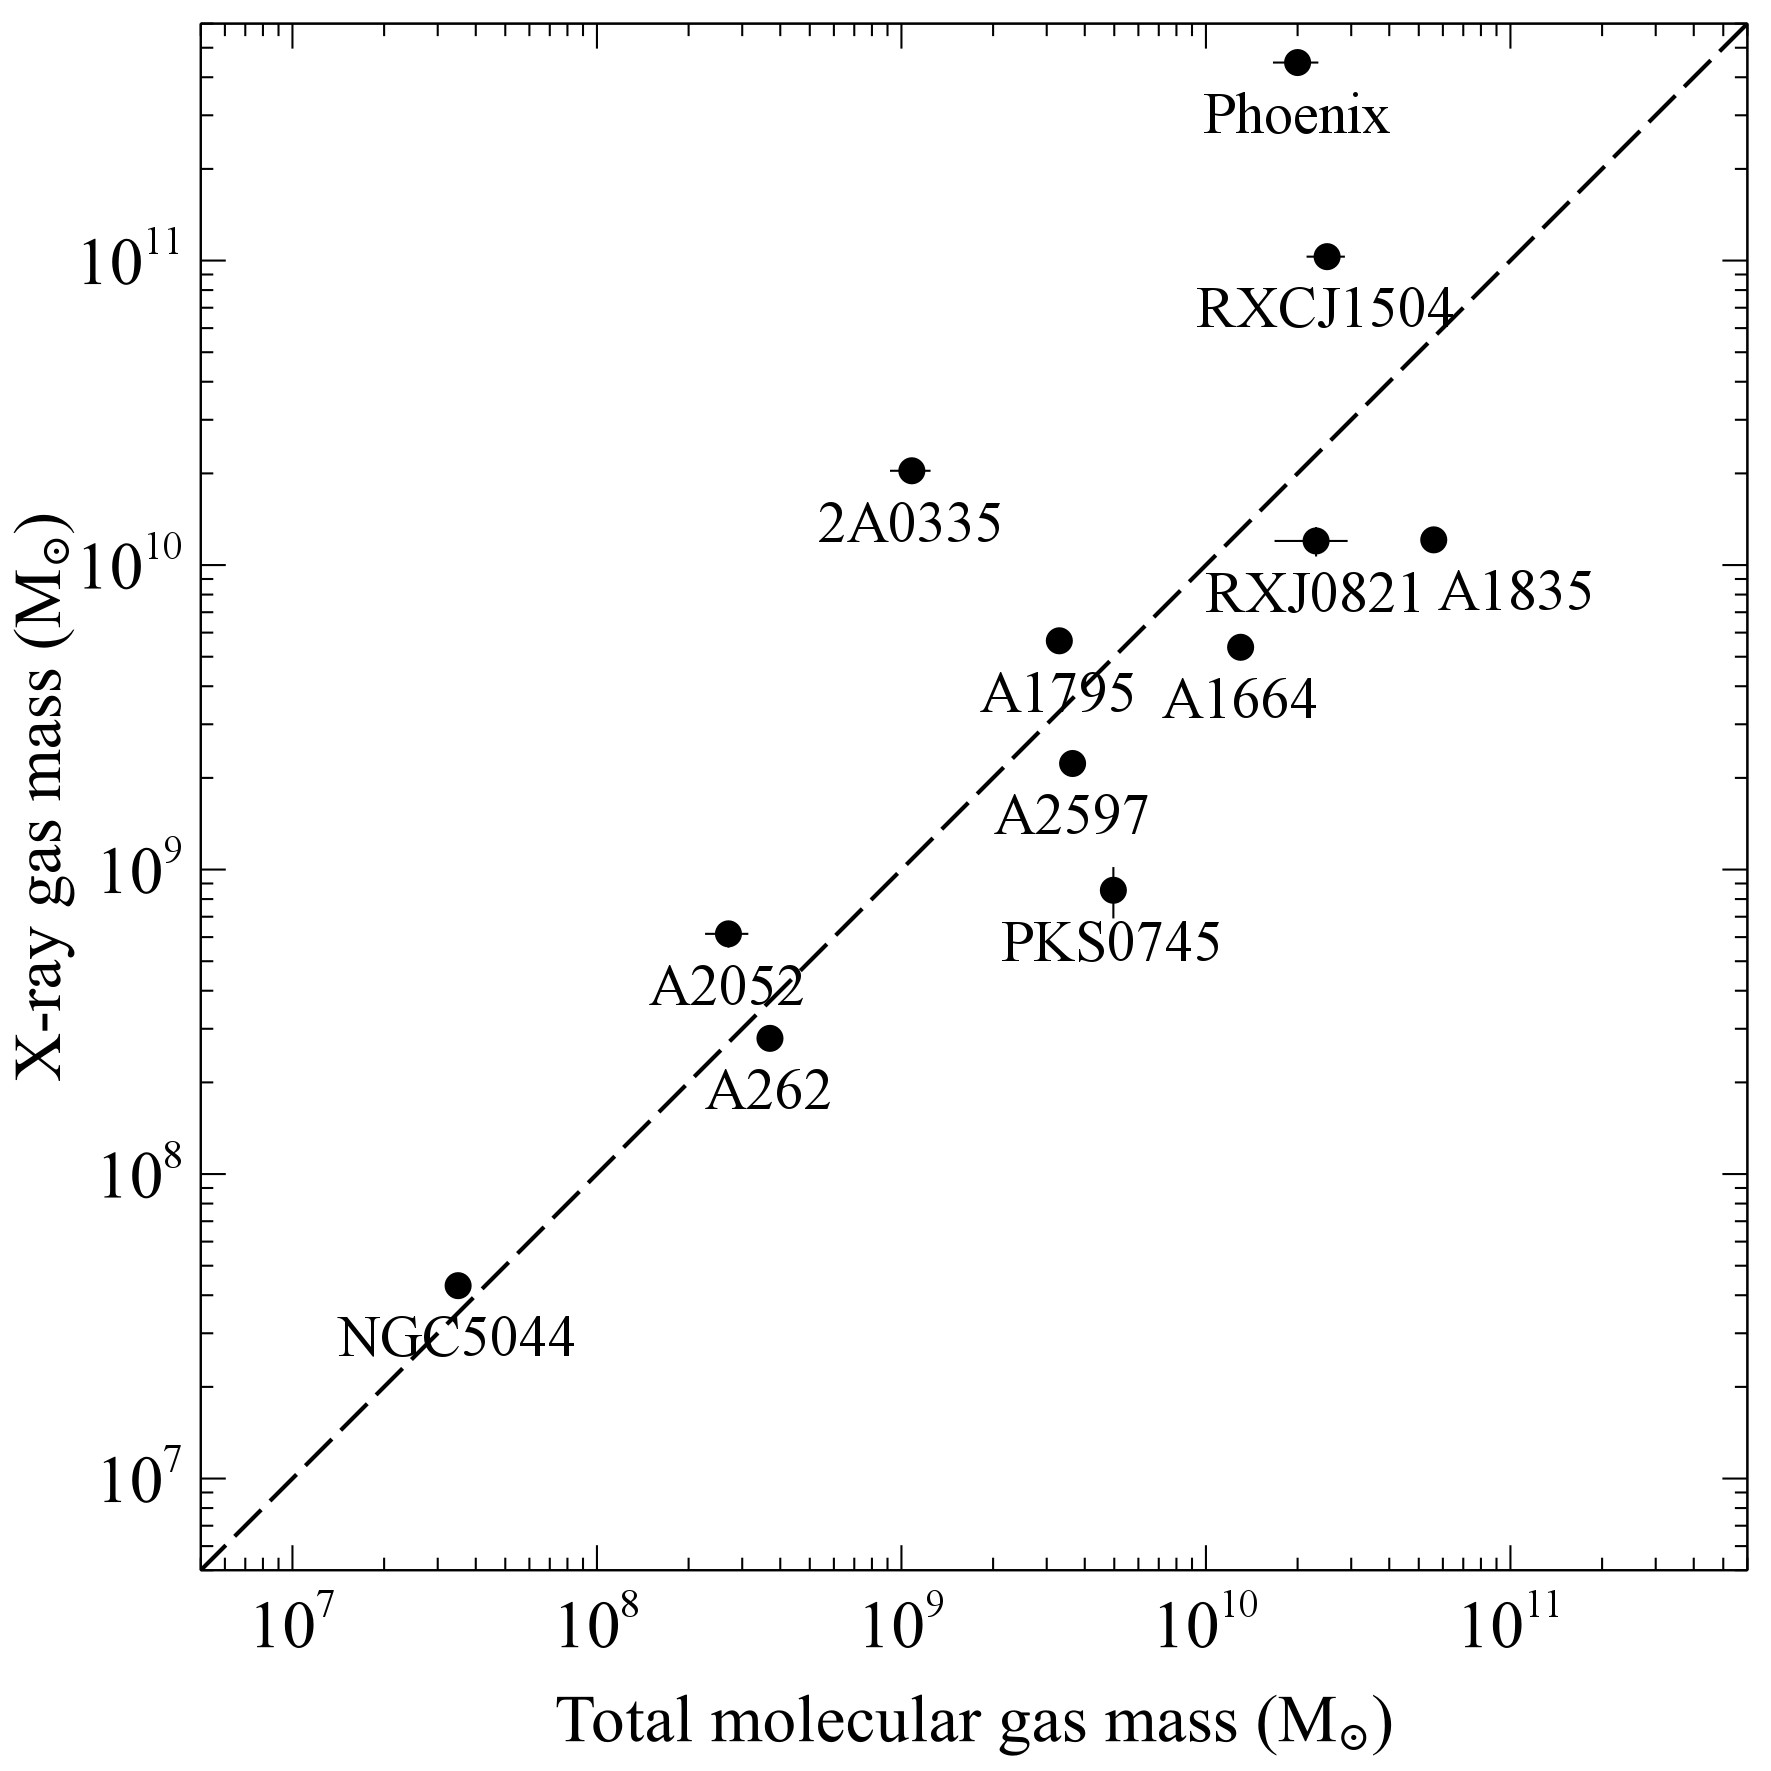
When the radiative cooling time of the surrounding hot atmosphere falls below a Gyr, the central galaxy lights up with star formation and ionized and molecular line emission from a burgeoning reservoir of cool gas (Rafferty et al. 2008; Cavagnolo et al. 2008; Pulido et al. 2018). These clear correlations have been consistently supported by observations for decades (eg. Heckman 1981; Hu et al. 1985; Heckman et al. 1989; Johnstone et al. 1987 and for reviews see McNamara & Nulsen 2012; Fabian 2012). ICM cooling is now included as the primary source of cool gas clouds in models and simulations of AGN feedback in clusters (Pizzolato & Soker 2005; Gaspari et al. 2013; Li & Bryan 2014; Voit et al. 2017). The substantial cold gas masses () and star formation rates (several to hundreds of solar masses) in the most massive central cluster galaxies cannot be sustained by stellar mass loss or gas stripped from donor galaxies. Not even gas-rich spirals can supply gas at this level and these sources are rare in the cores of clusters, where galaxies are predominantly devoid of cold gas and star formation (eg. Best et al. 2007). Although these mechanisms will make some contribution (eg. Sparks et al. 1989; Voit & Donahue 2011), the strong trends between the X-ray cooling time and the molecular gas mass and star formation rate are very difficult to account for without requiring significant gas cooling from the hot atmosphere.
Fig. 4 compares the total molecular gas mass (see appendix) with the best limits on the cooling rate from the X-ray hot atmosphere. The strongest X-ray constraints are produced from clear detections of Fe XVII emission and other key species in XMM RGS observations, which originate in gas cooling below (eg. Peterson et al. 2001; Tamura et al. 2001; Kaastra et al. 2001; Peterson & Fabian 2006). XMM RGS measurements were not available for A1664 and RXJ 0821, we therefore used Chandra limits on the cooling rate within radius (Bayer-Kim et al. 2002; Calzadilla et al. 2018). Based on the limits on the X-ray cooling rates, the molecular reservoirs typically form on timescales of or more. This timescale may be overestimated if the in situ cooling rate is increased by non-radiative cooling, where hot ionizing plasma penetrates the cold gas filaments (Fabian et al. 2002; Soker et al. 2004; Fabian et al. 2011b). However, a significant fraction of the molecular gas is likely consumed in star formation and deeper X-ray observations will place stronger limits on the cooling rate, which will lengthen the formation timescale.
For molecular filaments that form as gas cools in the wakes of buoyantly rising radio bubbles, the timescales are much more limited. The buoyant rise time for the bubbles in our sample is typically . The limits on X-ray cooling rates of are currently high enough to supply the inferred molecular gas masses of the filaments, typically a few on these timescales. However, this would require a large fraction of the hot X-ray atmosphere within the central galaxy to cool on these timescales. Fig. 5 compares the mass of X-ray gas within the extent of the detected molecular emission () with the total molecular gas mass (see Pulido et al. 2018 for the comparison using single dish observations). The molecular gas mass is within a factor of a few of the X-ray gas mass within the same region for the majority of our sample. Cooling to supply these molecular reservoirs would then deplete the X-ray atmosphere within this region and require significant inflow. Such an inflow would oppose the observed metal-rich hot gas flows along the jet axis (section 3.2.2). It is more likely that a lower level of X-ray cooling occurs over a larger region and this feeds more extended, fainter molecular filaments that are not yet detected in early shallow ALMA observations. This is supported by the greater extent of the ionized gas filaments, which are closely associated with the molecular filaments, and the fainter but far more extended molecular structures detected in IRAM and CARMA observations of the nearby, bright clusters Perseus and A1795 (Salomé et al. 2006; Salomé et al. 2011; McDonald et al. 2012b).
The formation and structure of cold gas clouds in the intracluster medium has been considered and modelled in detail by Ferland et al. (1994; 2009). Many unknowns remain and a model that reproduces the low-ionization spectra of the cool gas nebulae in central cluster galaxies has been a long-standing challenge (reviewed by eg. Johnstone et al. 2007). The formation of molecular hydrogen is the slowest step and must be catalyzed by dust grain surfaces to occur on the bubble rise timescales (eg. Ferland et al. 2009). Although dust grains will be sputtered rapidly () in cluster atmospheres (Draine & Salpeter 1979; Dwek & Arendt 1992), and we would expect cooling X-ray gas to be dust-free, many of the molecular filaments are observed to be spatially coincident with dust lanes (eg. Mittal et al. 2011, 2012; Russell et al. 2016, 2017b; Vantyghem et al. 2016, 2018). Little new star formation occurs in the majority of the filaments. However, dust could be distributed locally in the ejecta of the central galaxy’s older stellar population (Voit & Donahue 2011), form in situ within cooling gas clouds (Fabian et al. 1994) or have been lifted from the galaxy centre and shielded in dense gas clumps.
4.2 Gas flows lifted in the wakes of radio bubbles
Based on the observed close entrainment of the molecular gas flows around radio bubbles (sections 3.1 and 3.2), McNamara et al. (2016) proposed the stimulated feedback model where molecular clouds cool from low entropy X-ray gas lifted in the wakes of buoyant radio bubbles. Low entropy overdense gas blobs are expected to sink rapidly in a hot atmosphere to a radius where the ambient density is similar, and refind their equilibrium, before they can condense (Nulsen 1986). Therefore, for the blobs to become thermally unstable, their radiative cooling time () must be shorter than the time it takes them to sink to their equilibrium position (). Low entropy X-ray gas may therefore cool to low temperatures when lifted by radio bubbles to an altitude where . Since the free-fall time, the maximum radius that a radio bubble would need to lift cooler, denser gas to is where . This is typically a few tens of kpc for our sample. Although we cannot measure the velocities of the X-ray gas, the observed molecular gas velocities are considerably lower than the expectations for free fall in these central cluster galaxies (section 3.2.2). Therefore, the infall time is likely significantly longer than the free fall time and thermal instability will be triggered when low entropy gas is lifted smaller distances.
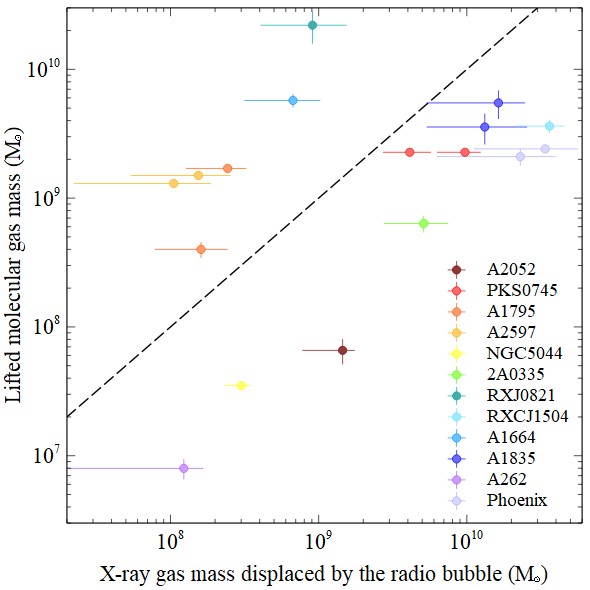
Stimulated feedback naturally explains the morphology and velocity structure of the molecular filaments, the close coupling with the radio bubbles and the large fraction of the molecular gas lying in extended filaments. Radio bubbles lift material in their wakes through buoyancy and, by Archimedes’ principle, cannot lift more gas than they displace. The displaced mass can be determined from the size of the cavities in the X-ray hot atmosphere, assuming spherical or prolate ellipsoids, and the density of the ambient hot gas from spectral fitting (eg. Cavagnolo et al. 2009). Fig. 6 compares the molecular gas mass in each filament that must be lifted by the bubbles with the mass of hot gas displaced by the corresponding radio bubble.
Both the cold and displaced gas masses have uncertainties of at least a factor of a few. For the cold gas mass, the uncertainty stems from the factor (section 3.4) but also from difficulties in separating each filament from other structures. The filaments may also subsequently be growing in mass due to interpenetration of the hot and cold gas (Fabian et al. 2011a; Liu et al. 2019). For the displaced gas mass, the uncertainty in the bubble volume dominates. The displaced gas mass could also be significantly underestimated if some cavities have collapsed or the filaments were formed by multiple generations of bubbles. Deep Chandra X-ray observations of nearby clusters can reveal a series of X-ray cavities at larger radii, where the outer cavities were generated by previous AGN outbursts and have buoyantly risen through the hot atmosphere. Whilst the radio emission from the bubble’s relativistic contents has spectrally aged and can only be detected in lower frequency observations, the bubble is still visible as a surface brightness depression or cavity in X-ray observations. Extended molecular filaments are detected toward multiple generations of X-ray cavities in the nearby Perseus cluster, which can be studied in detail. Extended luminous ionized gas filaments, which are spatially correlated with the molecular gas, are also associated with outer cavities in other nearby systems (eg. Salomé et al. 2011). Similarly, in A1795, a large outer bubble is detected in X-rays and low frequency radio observations (Crawford et al. 2005; Kokotanekov et al. 2018). This outer bubble has displaced more than an order of magnitude more hot gas than the two inner bubbles in this system.
Given the uncertainties, we conclude that the displaced and cold gas masses are of roughly comparable magnitude. Larger radio bubbles are also typically associated with more massive cold gas filaments. This is consistent with the stimulated feedback model. Although the discrepancies can generally be attributed to the expected scatter, there are known exceptions. For example, MS 0735 hosts a particularly powerful radio bubble outburst in excess of that has displaced of hot gas but the molecular gas supply is less than (Salomé & Combes 2008; McNamara et al. 2009; Vantyghem et al. 2014). The link between the radio bubble activity and molecular filament formation may therefore be more complex.
4.3 AGN fuelling
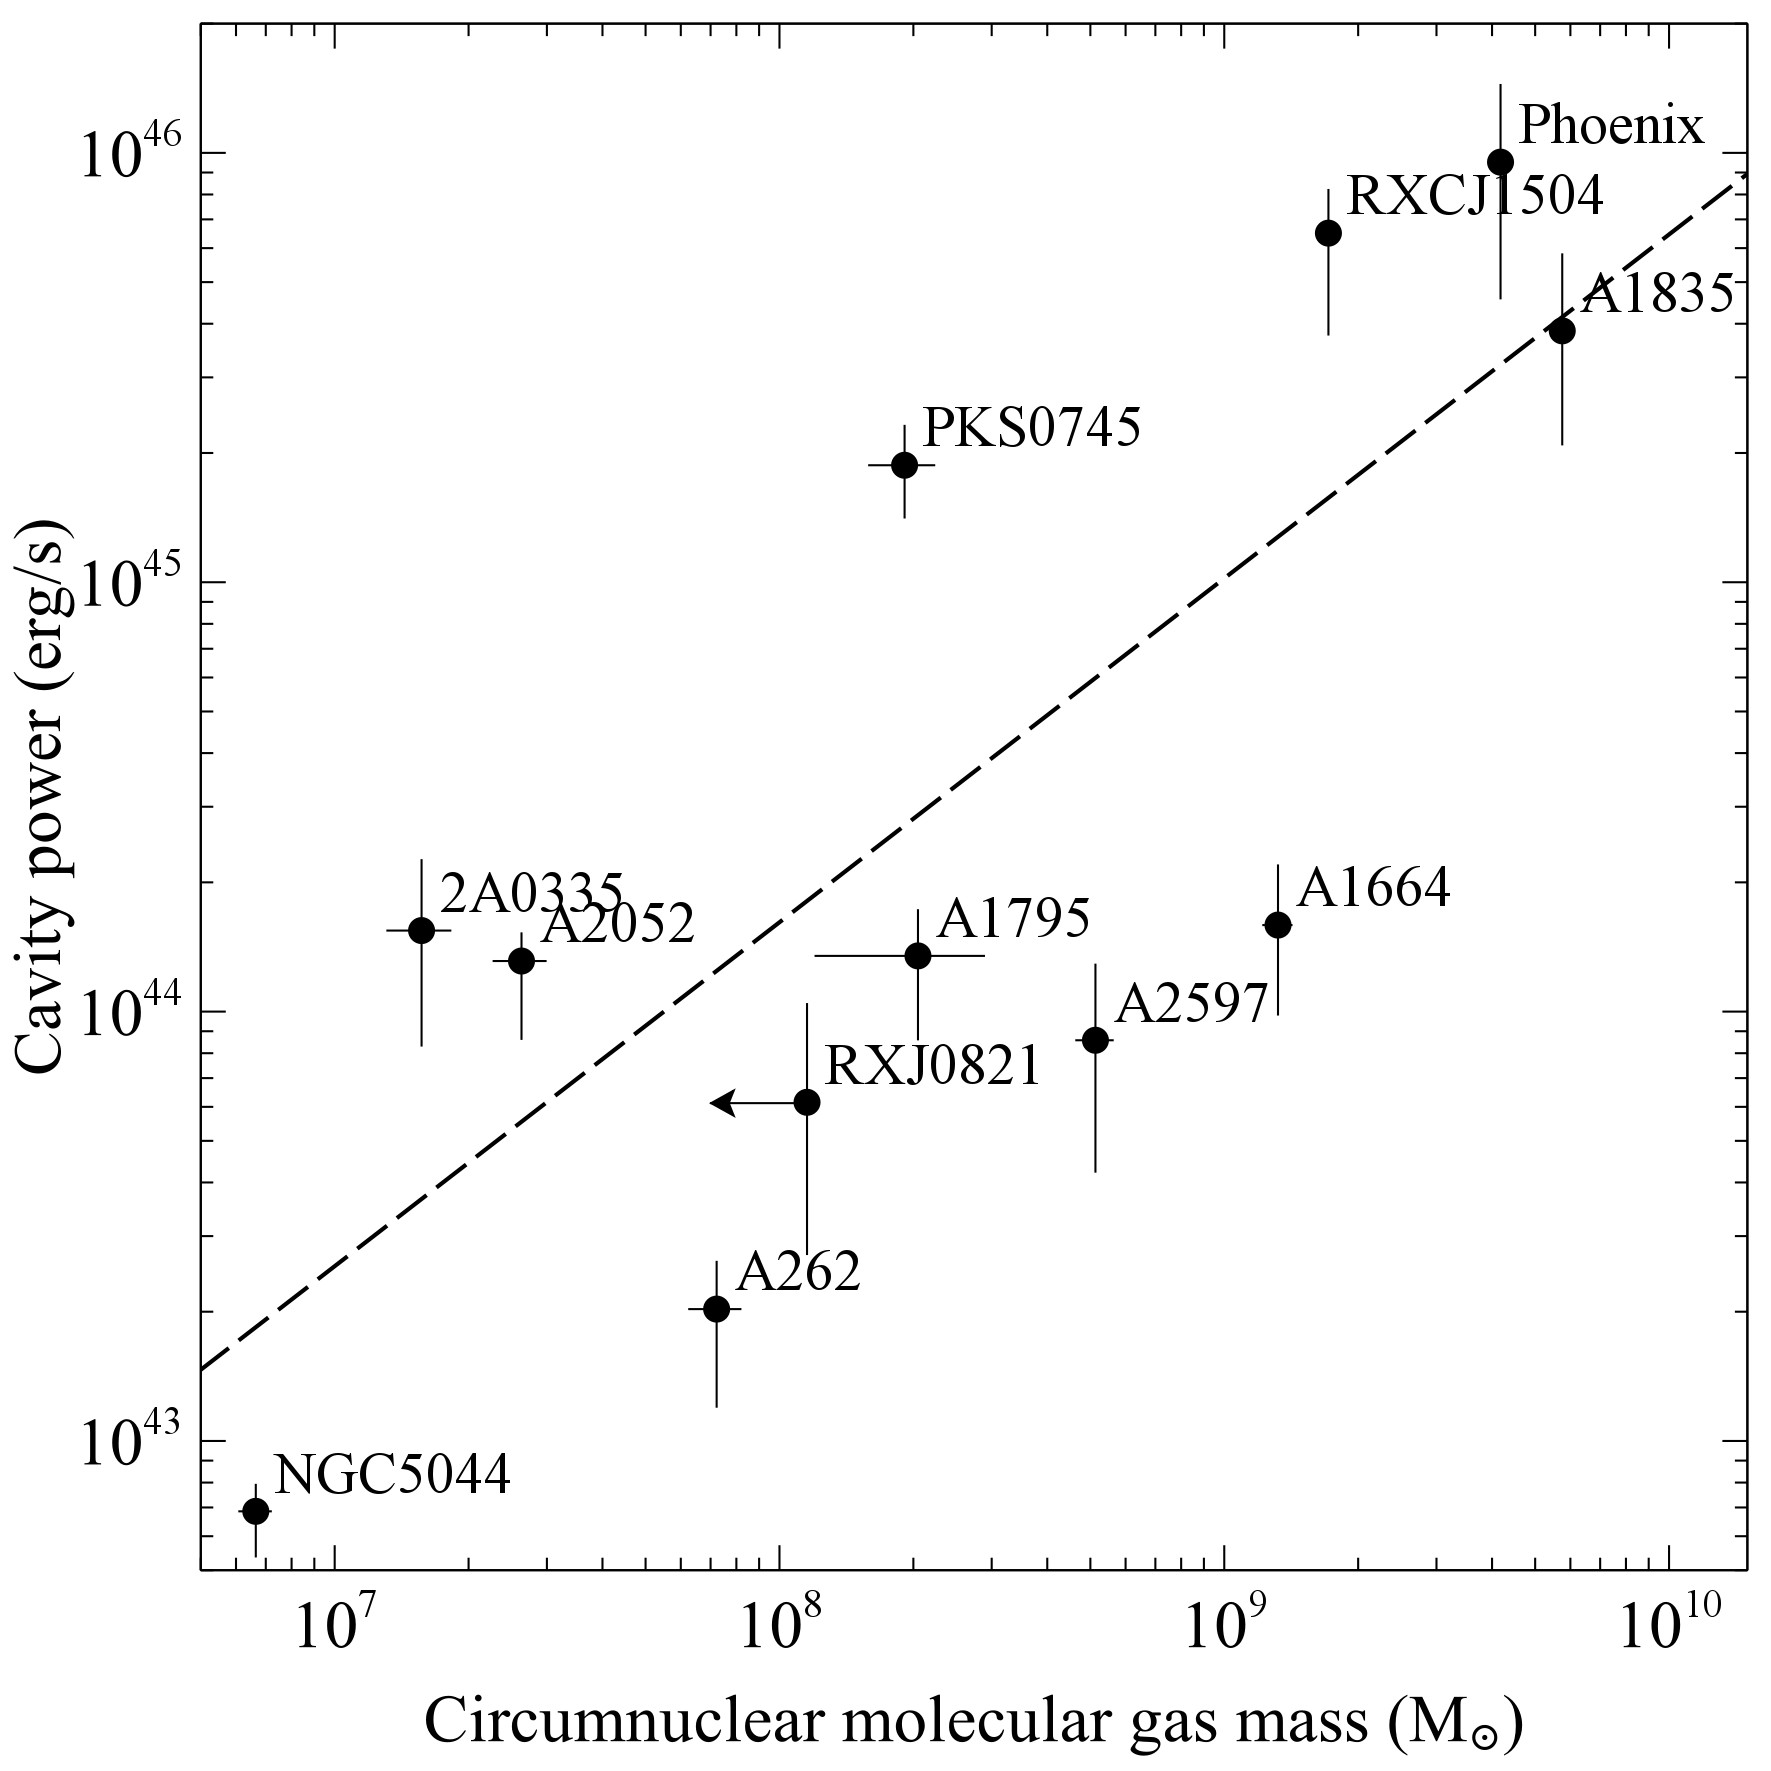
The observed balance between the AGN heating and radiative cooling rates in galaxy cluster atmospheres must be mediated through fuelling of the central SMBH. The accretion rate must be sensitive to overcooling or overheating on larger scales so that the AGN activity compensates on appropriately short timescales. Although the AGN must accrete at some level from the X-ray atmosphere (Bondi accretion, eg. Allen et al. 2006; Russell et al. 2013), the hot gas supply is not sufficient to power the most energetic radio jet outbursts (eg. Rafferty et al. 2006; McNamara et al. 2011). Molecular gas provides an alternative and plentiful supply of fuel and ALMA can now begin to resolve the circumnuclear structures from more extended filaments in these systems.
Although the ALMA observations of this sample were optimized for extended structure on kpc-scales, this still represents a significant improvement in spatial resolution over previous studies utilizing single dish observations (eg. Pulido et al. 2018). Fig. 7 compares the molecular gas mass within a single synthesized beam centred on the AGN (see appendix) with the jet power from the innermost radio bubbles. Using the BCES (YX) estimator from Akritas & Bershady (1996), we determine the best-fit powerlaw model
| (2) |
where is the X-ray cavity power and is the circumnuclear molecular gas mass. We also calculate the Spearman rank correlation coefficient of 0.75 with p-value 0.007, which suggests a tentative correlation. However, this does not account for the large uncertainties in the X-ray cavity power. If we employ a bootstrapping method to resample the data and perturb the resampled values according to the uncertainties, we do not find a significant correlation between the circumnuclear molecular gas mass and the AGN jet power as measured by the X-ray cavities. Although this may be partly due to the limited number of systems observed so far with ALMA (particularly lower mass systems) and large uncertainties on the X-ray cavity power, higher spatial resolution ALMA measurements will be required to probe the circumnuclear structure.
Smaller scale structure may also be probed by absorption lines detected against the nuclear continuum emission. CO absorption lines have been detected in three sources considered here, NGC 5044, A2597 and Hydra A. These narrow features are consistent with obscuring giant molecular clouds along the line of sight, which are likely located within a kpc of the nucleus (David et al. 2014; Tremblay et al. 2016; Rose et al. 2019).
5 Conclusions
Central cluster galaxies with short atmospheric cooling times are rich in molecular gas, with masses from to nearly . Unlike gas-rich spiral galaxies, molecular gas in these massive galaxies is rarely found in ordered motion, such as a disk or ring. Little gas is therefore centrifugally supported. Instead, the molecular gas is filamentary and/or in turbulent-like motion in the host galaxy. Their morphologies and velocity fields give strong clues to the origins of molecular clouds and their relationship to radio-mechanical feedback in galaxies.
Molecular gas filaments are found preferentially around or beneath rising X-ray bubbles formed by radio jets. Their ensemble velocity dispersions lie far below the host galaxy’s stellar velocity dispersions. Likewise, molecular filament bulk velocities lie far below free-fall speeds. Their velocity widths are only tens of kilometers per second. Therefore, the molecular clouds likely formed recently and have had little time to respond to gravity, and/or they are supported by a combination of ram pressure and magnetic fields.
Whether molecular clouds are falling in or flowing out is unclear in any given system as their locations along the line of sight with respect to the central galaxy are uncertain or unknown. In some instances the clouds are clearly moving out (A1835) while in others the gas may be falling inward (Phoenix). In all instances, molecular cloud velocities lie far below the central galaxy’s escape speed . Thus, molecular outflows will eventually stall, return and circulate within the galaxy. The association of molecular clouds and filaments with X-ray cavities and radio lobes indicates that the molecular flows are being driven by the expanding and rising radio bubbles.
Two lines of evidence indicate that the molecular clouds originated in cooling from hot atmospheres. Firstly, molecular clouds are found preferentially in central galaxies where the cooling time of the hot atmosphere lies below . In addition, in the systems studied here and elsewhere (eg. Pulido et al. 2018), the molecular gas mass correlates with the hot, atmospheric mass within the volume where molecular clouds are found. The mass of molecular clouds found in most systems is also comparable, generally within factors of a few, to the atmospheric mass displaced and/or lifted outward by the rising radio bubbles. This is consistent with the conjecture that molecular clouds form in the cooling updrafts of rising radio bubbles (Salomé et al. 2011; McNamara et al. 2014; McNamara et al. 2016). Molecular clouds may form prodigiously when cooling parcels of gas are lifted to an altitude where the ratio of their infall time to cooling time falls below unity, i.e., .
We identify a tentative trend between the unresolved molecular gas mass surrounding the central AGN and jet power. However, the correlation is marginally significant owing to large measurement uncertainties and small sample size. Higher spatial resolution ALMA observations are required to probe the circumnuclear structure and determine more effectively if the AGN activity is fuelled by the plentiful supply of molecular gas.
Acknowledgements
We thank the reviewer for helpful comments that improved the paper. HRR acknowledges support from an STFC Ernest Rutherford Fellowship and an Anne McLaren Fellowship. BRM acknowledges support from the Natural Sciences and Engineering Council of Canada and the Canadian Space Agency Space Science Enhancement Program. ACF acknowledges support from ERC Advanced Grant Feedback 340442. ACE acknowledges support from STFC grant ST/P000541/1. ALMA is a partnership of ESO (representing its member states), NSF (USA) and NINS (Japan), together with NRC (Canada), NSC and ASIAA (Taiwan), and KASI (Republic of Korea), in cooperation with the Republic of Chile. The Joint ALMA Observatory is operated by ESO, AUI/NRAO and NAOJ. The scientific results reported in this article are also based on data obtained from the Chandra Data Archive.
Appendix: Individual ALMA targets
A subset of the figures are reproduced here. Figures of A1835, NGC5044, RXJ0821, 2A0335 and RXCJ1504, together with the table of best-fit parameters, are available in supplementary material online.
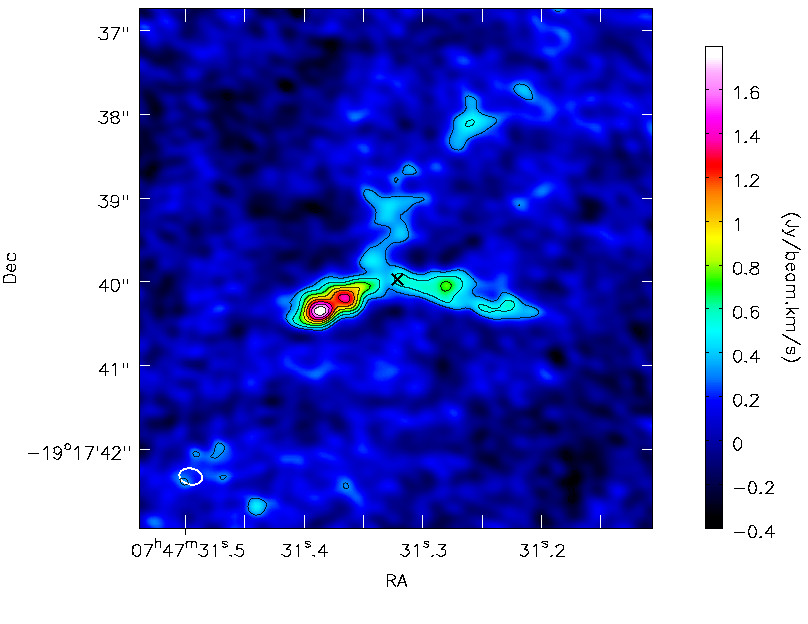
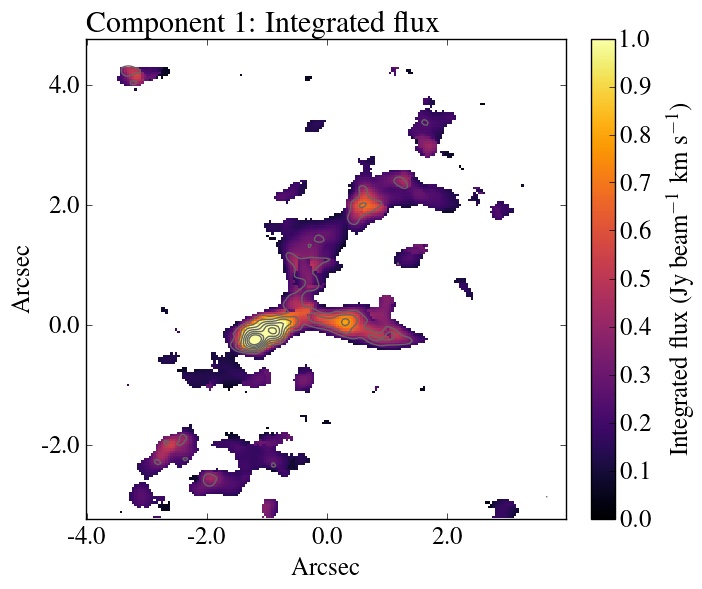
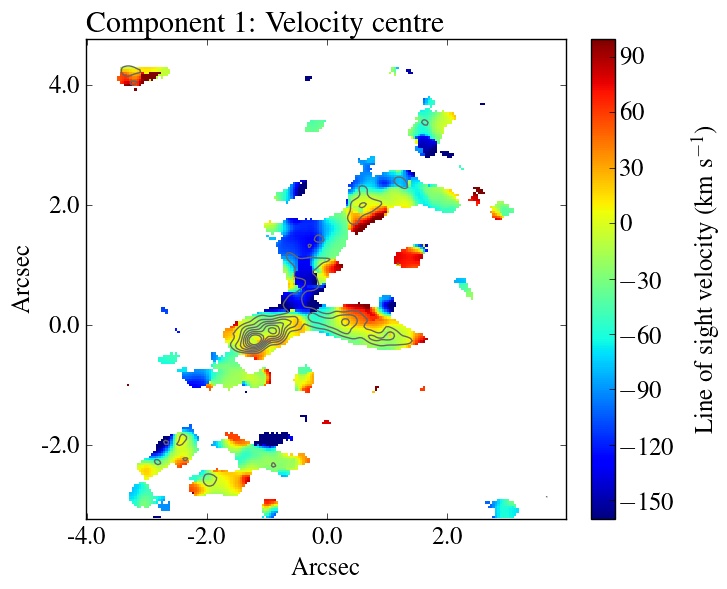
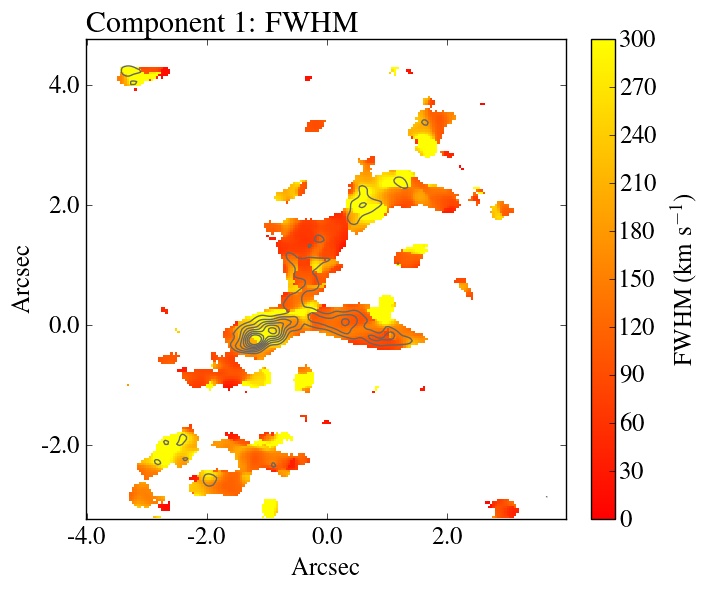
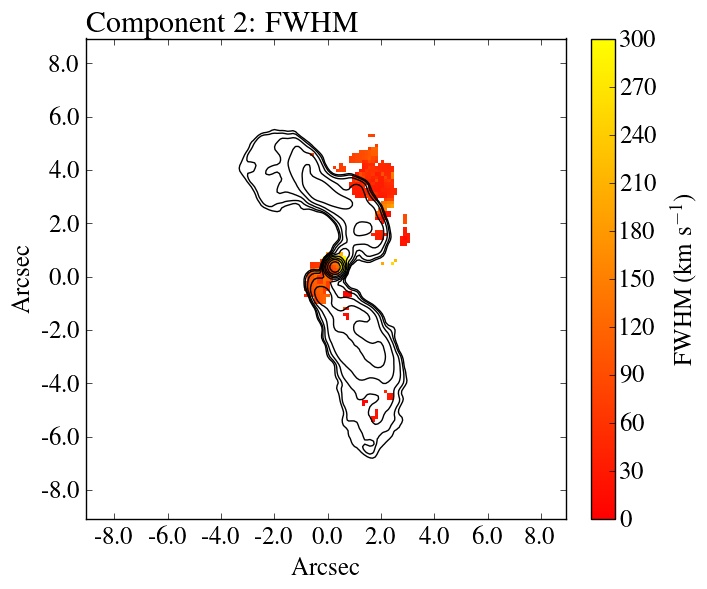
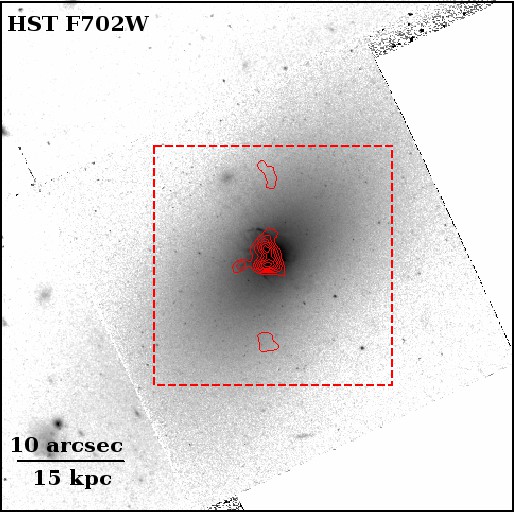
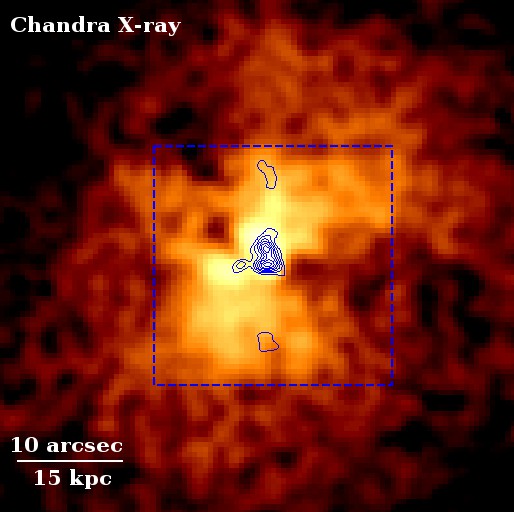
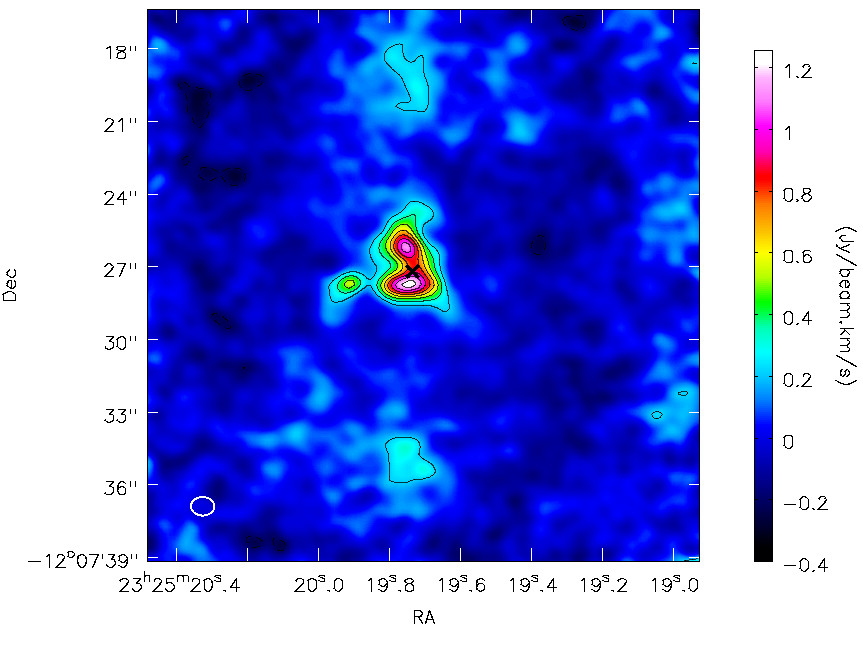
References
- Akritas & Bershady (1996) Akritas M. G., Bershady M. A., 1996, \hrefhttp://dx.doi.org/10.1086/177901 ApJ, \hrefhttp://adsabs.harvard.edu/abs/1996ApJ…470..706A 470, 706
- Alatalo et al. (2011) Alatalo K., et al., 2011, \hrefhttp://dx.doi.org/10.1088/0004-637X/735/2/88 ApJ, \hrefhttp://adsabs.harvard.edu/abs/2011ApJ…735…88A 735, 88
- Allen et al. (2006) Allen S. W., Dunn R. J. H., Fabian A. C., Taylor G. B., Reynolds C. S., 2006, \hrefhttp://dx.doi.org/10.1111/j.1365-2966.2006.10778.x MNRAS, \hrefhttp://adsabs.harvard.edu/abs/2006MNRAS.372…21A 372, 21
- Balmaverde et al. (2018) Balmaverde B., Capetti A., Marconi A., Venturi G., 2018, \hrefhttp://dx.doi.org/10.1051/0004-6361/201732022 A&A, \hrefhttp://adsabs.harvard.edu/abs/2018A%26A…612A..19B 612, A19
- Bambic et al. (2018) Bambic C. J., Morsony B. J., Reynolds C. S., 2018, \hrefhttp://dx.doi.org/10.3847/1538-4357/aab558 ApJ, \hrefhttps://ui.adsabs.harvard.edu/abs/2018ApJ…857…84B 857, 84
- Bayer-Kim et al. (2002) Bayer-Kim C. M., Crawford C. S., Allen S. W., Edge A. C., Fabian A. C., 2002, \hrefhttp://dx.doi.org/10.1046/j.1365-8711.2002.05969.x MNRAS, \hrefhttp://adsabs.harvard.edu/abs/2002MNRAS.337..938B 337, 938
- Best et al. (2007) Best P. N., von der Linden A., Kauffmann G., Heckman T. M., Kaiser C. R., 2007, \hrefhttp://dx.doi.org/10.1111/j.1365-2966.2007.11937.x MNRAS, \hrefhttp://adsabs.harvard.edu/abs/2007MNRAS.379..894B 379, 894
- Binney & Tabor (1995) Binney J., Tabor G., 1995, \hrefhttp://dx.doi.org/10.1093/mnras/276.2.663 MNRAS, \hrefhttp://adsabs.harvard.edu/abs/1995MNRAS.276..663B 276, 663
- Bîrzan et al. (2004) Bîrzan L., Rafferty D. A., McNamara B. R., Wise M. W., Nulsen P. E. J., 2004, \hrefhttp://dx.doi.org/10.1086/383519 ApJ, \hrefhttp://adsabs.harvard.edu/abs/2004ApJ…607..800B 607, 800
- Boehringer et al. (1993) Boehringer H., Voges W., Fabian A. C., Edge A. C., Neumann D. M., 1993, MNRAS, \hrefhttp://adsabs.harvard.edu/abs/1993MNRAS.264L..25B 264, L25
- Bolatto et al. (2013) Bolatto A. D., Wolfire M., Leroy A. K., 2013, \hrefhttp://dx.doi.org/10.1146/annurev-astro-082812-140944 ARA&A, \hrefhttp://adsabs.harvard.edu/abs/2013ARA%26A..51..207B 51, 207
- Bower et al. (2006) Bower R. G., Benson A. J., Malbon R., Helly J. C., Frenk C. S., Baugh C. M., Cole S., Lacey C. G., 2006, \hrefhttp://dx.doi.org/10.1111/j.1365-2966.2006.10519.x MNRAS, \hrefhttp://adsabs.harvard.edu/abs/2006MNRAS.370..645B 370, 645
- Burns (1990) Burns J. O., 1990, \hrefhttp://dx.doi.org/10.1086/115307 AJ, \hrefhttp://adsabs.harvard.edu/abs/1990AJ…..99…14B 99, 14
- Calzadilla et al. (2018) Calzadilla M. S., et al., 2018, preprint, \hrefhttp://adsabs.harvard.edu/abs/2018arXiv181000881C (\hrefhttp://arxiv.org/abs/1810.00881 arXiv:1810.00881)
- Cavagnolo et al. (2008) Cavagnolo K. W., Donahue M., Voit G. M., Sun M., 2008, \hrefhttp://dx.doi.org/10.1086/591665 ApJ, \hrefhttp://adsabs.harvard.edu/abs/2008ApJ…683L.107C 683, L107
- Cavagnolo et al. (2009) Cavagnolo K. W., Donahue M., Voit G. M., Sun M., 2009, \hrefhttp://dx.doi.org/10.1088/0067-0049/182/1/12 ApJS, \hrefhttp://adsabs.harvard.edu/abs/2009ApJS..182…12C 182, 12
- Churazov et al. (2000) Churazov E., Forman W., Jones C., Böhringer H., 2000, A&A, \hrefhttp://adsabs.harvard.edu/abs/2000A%26A…356..788C 356, 788
- Churazov et al. (2002) Churazov E., Sunyaev R., Forman W., Böhringer H., 2002, \hrefhttp://dx.doi.org/10.1046/j.1365-8711.2002.05332.x MNRAS, \hrefhttp://adsabs.harvard.edu/abs/2002MNRAS.332..729C 332, 729
- Clarke et al. (2005) Clarke T. E., Sarazin C. L., Blanton E. L., Neumann D. M., Kassim N. E., 2005, \hrefhttp://dx.doi.org/10.1086/429717 ApJ, \hrefhttps://ui.adsabs.harvard.edu/#abs/2005ApJ…625..748C 625, 748
- Clarke et al. (2009) Clarke T. E., Blanton E. L., Sarazin C. L., Anderson L. D., Gopal-Krishna Douglass E. M., Kassim N. E., 2009, \hrefhttp://dx.doi.org/10.1088/0004-637X/697/2/1481 ApJ, \hrefhttp://adsabs.harvard.edu/abs/2009ApJ…697.1481C 697, 1481
- Crawford et al. (2005) Crawford C. S., Sanders J. S., Fabian A. C., 2005, \hrefhttp://dx.doi.org/10.1111/j.1365-2966.2005.09149.x MNRAS, \hrefhttp://adsabs.harvard.edu/abs/2005MNRAS.361…17C 361, 17
- Croton et al. (2006) Croton D. J., et al., 2006, \hrefhttp://dx.doi.org/10.1111/j.1365-2966.2005.09675.x MNRAS, \hrefhttp://adsabs.harvard.edu/abs/2006MNRAS.365…11C 365, 11
- Dasyra et al. (2016) Dasyra K. M., Combes F., Oosterloo T., Oonk J. B. R., Morganti R., Salomé P., Vlahakis N., 2016, \hrefhttp://dx.doi.org/10.1051/0004-6361/201629689 A&A, \hrefhttp://adsabs.harvard.edu/abs/2016A%26A…595L…7D 595, L7
- David et al. (2014) David L. P., et al., 2014, \hrefhttp://dx.doi.org/10.1088/0004-637X/792/2/94 ApJ, \hrefhttp://adsabs.harvard.edu/abs/2014ApJ…792…94D 792, 94
- Di Matteo et al. (2005) Di Matteo T., Springel V., Hernquist L., 2005, \hrefhttp://dx.doi.org/10.1038/nature03335 Nat, \hrefhttp://adsabs.harvard.edu/abs/2005Natur.433..604D 433, 604
- Downes & Solomon (1998) Downes D., Solomon P. M., 1998, \hrefhttp://dx.doi.org/10.1086/306339 ApJ, \hrefhttp://adsabs.harvard.edu/abs/1998ApJ…507..615D 507, 615
- Downes et al. (1993) Downes D., Solomon P. M., Radford S. J. E., 1993, \hrefhttp://dx.doi.org/10.1086/186984 ApJ, \hrefhttp://adsabs.harvard.edu/abs/1993ApJ…414L..13D 414, L13
- Draine & Salpeter (1979) Draine B. T., Salpeter E. E., 1979, \hrefhttp://dx.doi.org/10.1086/157165 ApJ, \hrefhttp://adsabs.harvard.edu/abs/1979ApJ…231…77D 231, 77
- Dunn & Fabian (2006) Dunn R. J. H., Fabian A. C., 2006, \hrefhttp://dx.doi.org/10.1111/j.1365-2966.2006.11080.x MNRAS, \hrefhttp://adsabs.harvard.edu/abs/2006MNRAS.373..959D 373, 959
- Dwek & Arendt (1992) Dwek E., Arendt R. G., 1992, \hrefhttp://dx.doi.org/10.1146/annurev.aa.30.090192.000303 ARA&A, \hrefhttp://adsabs.harvard.edu/abs/1992ARA%26A..30…11D 30, 11
- Edge (2001) Edge A. C., 2001, \hrefhttp://dx.doi.org/10.1046/j.1365-8711.2001.04802.x MNRAS, \hrefhttp://adsabs.harvard.edu/abs/2001MNRAS.328..762E 328, 762
- Edge et al. (2002) Edge A. C., Wilman R. J., Johnstone R. M., Crawford C. S., Fabian A. C., Allen S. W., 2002, \hrefhttp://dx.doi.org/10.1046/j.1365-8711.2002.05790.x MNRAS, \hrefhttp://adsabs.harvard.edu/abs/2002MNRAS.337…49E 337, 49
- Fabian (1994) Fabian A. C., 1994, \hrefhttp://dx.doi.org/10.1146/annurev.aa.32.090194.001425 ARA&A, \hrefhttp://adsabs.harvard.edu/abs/1994ARA%26A..32..277F 32, 277
- Fabian (2012) Fabian A. C., 2012, \hrefhttp://dx.doi.org/10.1146/annurev-astro-081811-125521 ARA&A, \hrefhttp://adsabs.harvard.edu/abs/2012ARA%26A..50..455F 50, 455
- Fabian et al. (1994) Fabian A. C., Johnstone R. M., Daines S. J., 1994, MNRAS, \hrefhttp://adsabs.harvard.edu/abs/1994MNRAS.271..737F 271, 737
- Fabian et al. (2000) Fabian A. C., et al., 2000, MNRAS, \hrefhttp://adsabs.harvard.edu/abs/2000MNRAS.318L..65F 318, L65
- Fabian et al. (2002) Fabian A. C., Allen S. W., Crawford C. S., Johnstone R. M., Morris R. G., Sanders J. S., Schmidt R. W., 2002, \hrefhttp://dx.doi.org/10.1046/j.1365-8711.2002.05510.x MNRAS, \hrefhttp://adsabs.harvard.edu/abs/2002MNRAS.332L..50F 332, L50
- Fabian et al. (2003a) Fabian A. C., Sanders J. S., Allen S. W., Crawford C. S., Iwasawa K., Johnstone R. M., Schmidt R. W., Taylor G. B., 2003a, \hrefhttp://dx.doi.org/10.1046/j.1365-8711.2003.06902.x MNRAS, \hrefhttp://ukads.nottingham.ac.uk/cgi-bin/nph-bib_query?bibcode=2003MNRAS.344L..43F&db_key=AST 344, L43
- Fabian et al. (2003b) Fabian A. C., Sanders J. S., Crawford C. S., Conselice C. J., Gallagher J. S., Wyse R. F. G., 2003b, \hrefhttp://dx.doi.org/10.1046/j.1365-8711.2003.06856.x MNRAS, \hrefhttp://adsabs.harvard.edu/abs/2003MNRAS.344L..48F 344, L48
- Fabian et al. (2008) Fabian A. C., Johnstone R. M., Sanders J. S., Conselice C. J., Crawford C. S., Gallagher III J. S., Zweibel E., 2008, \hrefhttp://dx.doi.org/10.1038/nature07169 Nat, \hrefhttp://adsabs.harvard.edu/abs/2008Natur.454..968F 454, 968
- Fabian et al. (2011a) Fabian A. C., Sanders J. S., Williams R. J. R., Lazarian A., Ferland G. J., Johnstone R. M., 2011a, \hrefhttp://dx.doi.org/10.1111/j.1365-2966.2011.19034.x MNRAS, \hrefhttp://adsabs.harvard.edu/abs/2011MNRAS.417..172F 417, 172
- Fabian et al. (2011b) Fabian A. C., et al., 2011b, \hrefhttp://dx.doi.org/10.1111/j.1365-2966.2011.19402.x MNRAS, \hrefhttp://adsabs.harvard.edu/abs/2011MNRAS.418.2154F 418, 2154
- Ferland et al. (1994) Ferland G. J., Fabian A. C., Johnstone R. M., 1994, MNRAS, \hrefhttp://adsabs.harvard.edu/abs/1994MNRAS.266..399F 266, 399
- Ferland et al. (2009) Ferland G. J., Fabian A. C., Hatch N. A., Johnstone R. M., Porter R. L., van Hoof P. A. M., Williams R. J. R., 2009, \hrefhttp://dx.doi.org/10.1111/j.1365-2966.2008.14153.x MNRAS, \hrefhttp://adsabs.harvard.edu/abs/2009MNRAS.392.1475F 392, 1475
- Feruglio et al. (2010) Feruglio C., Maiolino R., Piconcelli E., Menci N., Aussel H., Lamastra A., Fiore F., 2010, \hrefhttp://dx.doi.org/10.1051/0004-6361/201015164 A&A, \hrefhttp://adsabs.harvard.edu/abs/2010A%26A…518L.155F 518, L155
- García-Burillo et al. (2014) García-Burillo S., et al., 2014, \hrefhttp://dx.doi.org/10.1051/0004-6361/201423843 A&A, \hrefhttp://ukads.nottingham.ac.uk/abs/2014A%26A…567A.125G 567, A125
- Gaspari et al. (2011) Gaspari M., Melioli C., Brighenti F., D’Ercole A., 2011, \hrefhttp://dx.doi.org/10.1111/j.1365-2966.2010.17688.x MNRAS, \hrefhttp://adsabs.harvard.edu/abs/2011MNRAS.411..349G 411, 349
- Gaspari et al. (2013) Gaspari M., Ruszkowski M., Oh S. P., 2013, \hrefhttp://dx.doi.org/10.1093/mnras/stt692 MNRAS, \hrefhttp://adsabs.harvard.edu/abs/2013MNRAS.432.3401G 432, 3401
- Gendron-Marsolais et al. (2018) Gendron-Marsolais M., et al., 2018, \hrefhttp://dx.doi.org/10.1093/mnrasl/sly084 MNRAS, \hrefhttps://ui.adsabs.harvard.edu/abs/2018MNRAS.479L..28G 479, L28
- Hamer et al. (2014) Hamer S. L., et al., 2014, \hrefhttp://dx.doi.org/10.1093/mnras/stt1949 MNRAS, \hrefhttp://adsabs.harvard.edu/abs/2014MNRAS.437..862H 437, 862
- Hatch et al. (2006) Hatch N. A., Crawford C. S., Johnstone R. M., Fabian A. C., 2006, \hrefhttp://dx.doi.org/10.1111/j.1365-2966.2006.09970.x MNRAS, \hrefhttp://ukads.nottingham.ac.uk/cgi-bin/nph-bib_query?bibcode=2006MNRAS.367..433H&db_key=AST 367, 433
- Hatch et al. (2007) Hatch N. A., Crawford C. S., Fabian A. C., 2007, \hrefhttp://dx.doi.org/10.1111/j.1365-2966.2007.12009.x MNRAS, \hrefhttp://adsabs.harvard.edu/abs/2007MNRAS.380…33H 380, 33
- Heckman (1981) Heckman T. M., 1981, \hrefhttp://dx.doi.org/10.1086/183674 ApJ, \hrefhttp://adsabs.harvard.edu/abs/1981ApJ…250L..59H 250, L59
- Heckman et al. (1989) Heckman T. M., Baum S. A., van Breugel W. J. M., McCarthy P., 1989, \hrefhttp://dx.doi.org/10.1086/167181 ApJ, \hrefhttp://adsabs.harvard.edu/abs/1989ApJ…338…48H 338, 48
- Hitomi Collaboration (2016) Hitomi Collaboration 2016, \hrefhttp://dx.doi.org/10.1038/nature18627 Nat, \hrefhttp://adsabs.harvard.edu/abs/2016Natur.535..117H 535, 117
- Ho et al. (2009a) Ho L. C., Greene J. E., Filippenko A. V., Sargent W. L. W., 2009a, \hrefhttp://dx.doi.org/10.1088/0067-0049/183/1/1 ApJS, \hrefhttp://adsabs.harvard.edu/abs/2009ApJS..183….1H 183, 1
- Ho et al. (2009b) Ho I.-T., Lim J., Dinh-V-Trung 2009b, \hrefhttp://dx.doi.org/10.1088/0004-637X/698/2/1191 ApJ, \hrefhttp://adsabs.harvard.edu/abs/2009ApJ…698.1191H 698, 1191
- Hogan et al. (2015a) Hogan M. T., et al., 2015a, \hrefhttp://dx.doi.org/10.1093/mnras/stv1517 MNRAS, \hrefhttp://adsabs.harvard.edu/abs/2015MNRAS.453.1201H 453, 1201
- Hogan et al. (2015b) Hogan M. T., et al., 2015b, \hrefhttp://dx.doi.org/10.1093/mnras/stv1518 MNRAS, \hrefhttps://ui.adsabs.harvard.edu/abs/2015MNRAS.453.1223H 453, 1223
- Hogan et al. (2017) Hogan M. T., et al., 2017, \hrefhttp://dx.doi.org/10.3847/1538-4357/aa9af3 ApJ, \hrefhttp://adsabs.harvard.edu/abs/2017ApJ…851…66H 851, 66
- Hopkins et al. (2006) Hopkins P. F., Hernquist L., Cox T. J., Di Matteo T., Robertson B., Springel V., 2006, \hrefhttp://dx.doi.org/10.1086/499298 ApJS, \hrefhttp://adsabs.harvard.edu/abs/2006ApJS..163….1H 163, 1
- Hu et al. (1985) Hu E. M., Cowie L. L., Wang Z., 1985, \hrefhttp://dx.doi.org/10.1086/191081 ApJS, \hrefhttp://adsabs.harvard.edu/abs/1985ApJS…59..447H 59, 447
- Johnstone et al. (1987) Johnstone R. M., Fabian A. C., Nulsen P. E. J., 1987, MNRAS, \hrefhttp://adsabs.harvard.edu/abs/1987MNRAS.224…75J 224, 75
- Johnstone et al. (2007) Johnstone R. M., Hatch N. A., Ferland G. J., Fabian A. C., Crawford C. S., Wilman R. J., 2007, \hrefhttp://dx.doi.org/10.1111/j.1365-2966.2007.12460.x MNRAS, \hrefhttps://ui.adsabs.harvard.edu/abs/2007MNRAS.382.1246J 382, 1246
- Kaastra et al. (2001) Kaastra J. S., Ferrigno C., Tamura T., Paerels F. B. S., Peterson J. R., Mittaz J. P. D., 2001, \hrefhttp://dx.doi.org/10.1051/0004-6361:20000041 A&A, \hrefhttp://adsabs.harvard.edu/abs/2001A%26A…365L..99K 365, L99
- King & Pounds (2015) King A., Pounds K., 2015, \hrefhttp://dx.doi.org/10.1146/annurev-astro-082214-122316 ARA&A, \hrefhttp://adsabs.harvard.edu/abs/2015ARA%26A..53..115K 53, 115
- Kirkpatrick et al. (2009) Kirkpatrick C. C., et al., 2009, \hrefhttp://dx.doi.org/10.1088/0004-637X/697/1/867 ApJ, \hrefhttp://adsabs.harvard.edu/abs/2009ApJ…697..867K 697, 867
- Kokotanekov et al. (2018) Kokotanekov G., Wise M. W., de Vries M., Intema H. T., 2018, \hrefhttp://dx.doi.org/10.1051/0004-6361/201833222 A&A, \hrefhttp://adsabs.harvard.edu/abs/2018A%26A…618A.152K 618, A152
- Li & Bryan (2014) Li Y., Bryan G. L., 2014, \hrefhttp://dx.doi.org/10.1088/0004-637X/789/2/153 ApJ, \hrefhttp://adsabs.harvard.edu/abs/2014ApJ…789..153L 789, 153
- Li et al. (2018) Li Y., Ruszkowski M., Tremblay G., 2018, \hrefhttp://dx.doi.org/10.3847/1538-4357/aaa843 ApJ, \hrefhttp://adsabs.harvard.edu/abs/2018ApJ…854…91L 854, 91
- Lim et al. (2008) Lim J., Ao Y., Dinh-V-Trung 2008, \hrefhttp://dx.doi.org/10.1086/523664 ApJ, \hrefhttp://adsabs.harvard.edu/abs/2008ApJ…672..252L 672, 252
- Lim et al. (2012) Lim J., Ohyama Y., Chi-Hung Y., Dinh-V-Trung Shiang-Yu W., 2012, \hrefhttp://dx.doi.org/10.1088/0004-637X/744/2/112 ApJ, \hrefhttp://adsabs.harvard.edu/abs/2012ApJ…744..112L 744, 112
- Lim et al. (2017) Lim J., Dinh-V-Trung Vrtilek J., David L. P., Forman W., 2017, \hrefhttp://dx.doi.org/10.3847/1538-4357/aa9275 ApJ, \hrefhttps://ui.adsabs.harvard.edu/abs/2017ApJ…850…31L 850, 31
- Liu et al. (2019) Liu H., Pinto C., Fabian A. C., Russell H. R., Sanders J. S., 2019, \hrefhttp://dx.doi.org/10.1093/mnras/stz456 MNRAS, \hrefhttp://adsabs.harvard.edu/abs/2019MNRAS.tmp..456L
- McDonald et al. (2012a) McDonald M., et al., 2012a, \hrefhttp://dx.doi.org/10.1038/nature11379 Nat, \hrefhttp://adsabs.harvard.edu/abs/2012Natur.488..349M 488, 349
- McDonald et al. (2012b) McDonald M., Wei L. H., Veilleux S., 2012b, \hrefhttp://dx.doi.org/10.1088/2041-8205/755/2/L24 ApJ, \hrefhttp://adsabs.harvard.edu/abs/2012ApJ…755L..24M 755, L24
- McDonald et al. (2015) McDonald M., et al., 2015, \hrefhttp://dx.doi.org/10.1088/0004-637X/811/2/111 ApJ, \hrefhttp://adsabs.harvard.edu/abs/2015ApJ…811..111M 811, 111
- McMullin et al. (2007) McMullin J. P., Waters B., Schiebel D., Young W., Golap K., 2007, in Shaw R. A., Hill F., Bell D. J., eds, Astronomical Society of the Pacific Conference Series Vol. 376, Astronomical Data Analysis Software and Systems XVI. p. 127
- McNamara & Nulsen (2007) McNamara B. R., Nulsen P. E. J., 2007, \hrefhttp://dx.doi.org/10.1146/annurev.astro.45.051806.110625 ARA&A, \hrefhttp://adsabs.harvard.edu/abs/2007ARA%26A..45..117M 45, 117
- McNamara & Nulsen (2012) McNamara B. R., Nulsen P. E. J., 2012, \hrefhttp://dx.doi.org/10.1088/1367-2630/14/5/055023 New Journal of Physics, \hrefhttp://adsabs.harvard.edu/abs/2012NJPh…14e5023M 14, 055023
- McNamara et al. (2000) McNamara B. R., et al., 2000, \hrefhttp://dx.doi.org/10.1086/312662 ApJ, \hrefhttp://adsabs.harvard.edu/abs/2000ApJ…534L.135M 534, L135
- McNamara et al. (2009) McNamara B. R., Kazemzadeh F., Rafferty D. A., Bîrzan L., Nulsen P. E. J., Kirkpatrick C. C., Wise M. W., 2009, \hrefhttp://dx.doi.org/10.1088/0004-637X/698/1/594 ApJ, \hrefhttp://adsabs.harvard.edu/abs/2009ApJ…698..594M 698, 594
- McNamara et al. (2011) McNamara B. R., Rohanizadegan M., Nulsen P. E. J., 2011, \hrefhttp://dx.doi.org/10.1088/0004-637X/727/1/39 ApJ, \hrefhttp://adsabs.harvard.edu/abs/2011ApJ…727…39M 727, 39
- McNamara et al. (2014) McNamara B. R., et al., 2014, \hrefhttp://dx.doi.org/10.1088/0004-637X/785/1/44 ApJ, \hrefhttp://adsabs.harvard.edu/abs/2014ApJ…785…44M 785, 44
- McNamara et al. (2016) McNamara B. R., Russell H. R., Nulsen P. E. J., Hogan M. T., Fabian A. C., Pulido F., Edge A. C., 2016, \hrefhttp://dx.doi.org/10.3847/0004-637X/830/2/79 ApJ, \hrefhttp://adsabs.harvard.edu/abs/2016ApJ…830…79M 830, 79
- Mittal et al. (2011) Mittal R., et al., 2011, \hrefhttp://dx.doi.org/10.1111/j.1365-2966.2011.19634.x MNRAS, \hrefhttp://adsabs.harvard.edu/abs/2011MNRAS.418.2386M 418, 2386
- Mittal et al. (2012) Mittal R., et al., 2012, \hrefhttp://dx.doi.org/10.1111/j.1365-2966.2012.21891.x MNRAS, \hrefhttps://ui.adsabs.harvard.edu/abs/2012MNRAS.426.2957M 426, 2957
- Morganti et al. (2005) Morganti R., Tadhunter C. N., Oosterloo T. A., 2005, \hrefhttp://dx.doi.org/10.1051/0004-6361:200500197 A&A, \hrefhttp://adsabs.harvard.edu/abs/2005A%26A…444L…9M 444, L9
- Morganti et al. (2013) Morganti R., Fogasy J., Paragi Z., Oosterloo T., Orienti M., 2013, \hrefhttp://dx.doi.org/10.1126/science.1240436 Science, \hrefhttp://adsabs.harvard.edu/abs/2013Sci…341.1082M 341, 1082
- Nagai et al. (2019) Nagai H., et al., 2019, arXiv e-prints, \hrefhttps://ui.adsabs.harvard.edu/abs/2019arXiv190506017N p. arXiv:1905.06017
- Nesvadba et al. (2006) Nesvadba N. P. H., Lehnert M. D., Eisenhauer F., Gilbert A., Tecza M., Abuter R., 2006, \hrefhttp://dx.doi.org/10.1086/507266 ApJ, \hrefhttp://adsabs.harvard.edu/abs/2006ApJ…650..693N 650, 693
- Nesvadba et al. (2011) Nesvadba N. P. H., Polletta M., Lehnert M. D., Bergeron J., De Breuck C., Lagache G., Omont A., 2011, \hrefhttp://dx.doi.org/10.1111/j.1365-2966.2011.18862.x MNRAS, \hrefhttp://adsabs.harvard.edu/abs/2011MNRAS.415.2359N 415, 2359
- Nulsen (1986) Nulsen P. E. J., 1986, \hrefhttp://dx.doi.org/10.1093/mnras/221.2.377 MNRAS, \hrefhttp://adsabs.harvard.edu/abs/1986MNRAS.221..377N 221, 377
- Nulsen et al. (2009) Nulsen P., Jones C., Forman W., Churazov E., McNamara B., David L., Murray S., 2009, in Heinz S., Wilcots E., eds, American Institute of Physics Conference Series Vol. 1201, American Institute of Physics Conference Series. pp 198–201 (\hrefhttp://arxiv.org/abs/0909.1809 arXiv:0909.1809), \hrefhttp://dx.doi.org/10.1063/1.3293033 doi:10.1063/1.3293033
- Peterson & Fabian (2006) Peterson J. R., Fabian A. C., 2006, \hrefhttp://dx.doi.org/10.1016/j.physrep.2005.12.007 Phys. Rep., \hrefhttp://adsabs.harvard.edu/abs/2006PhR…427….1P 427, 1
- Peterson et al. (2001) Peterson J. R., et al., 2001, \hrefhttp://dx.doi.org/10.1051/0004-6361:20000021 A&A, \hrefhttp://adsabs.harvard.edu/abs/2001A%26A…365L.104P 365, L104
- Pizzolato & Soker (2005) Pizzolato F., Soker N., 2005, \hrefhttp://dx.doi.org/10.1086/444344 ApJ, \hrefhttp://adsabs.harvard.edu/abs/2005ApJ…632..821P 632, 821
- Pope et al. (2010) Pope E. C. D., Babul A., Pavlovski G., Bower R. G., Dotter A., 2010, \hrefhttp://dx.doi.org/10.1111/j.1365-2966.2010.16816.x MNRAS, \hrefhttp://adsabs.harvard.edu/abs/2010MNRAS.406.2023P 406, 2023
- Prandoni et al. (2007) Prandoni I., Laing R. A., Parma P., de Ruiter H. R., Montenegro-Montes F. M., Wilson T. L., 2007, \hrefhttp://dx.doi.org/10.1016/j.newar.2006.10.003 NewA Rev., \hrefhttp://adsabs.harvard.edu/abs/2007NewAR..51…43P 51, 43
- Pulido et al. (2018) Pulido F. A., et al., 2018, \hrefhttp://dx.doi.org/10.3847/1538-4357/aaa54b ApJ, \hrefhttp://adsabs.harvard.edu/abs/2018ApJ…853..177P 853, 177
- Rafferty et al. (2006) Rafferty D. A., McNamara B. R., Nulsen P. E. J., Wise M. W., 2006, \hrefhttp://dx.doi.org/10.1086/507672 ApJ, \hrefhttp://adsabs.harvard.edu/abs/2006ApJ…652..216R 652, 216
- Rafferty et al. (2008) Rafferty D. A., McNamara B. R., Nulsen P. E. J., 2008, \hrefhttp://dx.doi.org/10.1086/591240 ApJ, \hrefhttp://adsabs.harvard.edu/abs/2008ApJ…687..899R 687, 899
- Revaz et al. (2008) Revaz Y., Combes F., Salomé P., 2008, \hrefhttp://dx.doi.org/10.1051/0004-6361:20078915 A&A, \hrefhttp://adsabs.harvard.edu/abs/2008A%26A…477L..33R 477, L33
- Rose et al. (2019) Rose T., et al., 2019, \hrefhttp://dx.doi.org/10.1093/mnras/stz406 MNRAS, \hrefhttps://ui.adsabs.harvard.edu/abs/2019MNRAS.485..229R 485, 229
- Rupke & Veilleux (2011) Rupke D. S. N., Veilleux S., 2011, \hrefhttp://dx.doi.org/10.1088/2041-8205/729/2/L27 ApJ, \hrefhttp://adsabs.harvard.edu/abs/2011ApJ…729L..27R 729, L27
- Russell et al. (2013) Russell H. R., McNamara B. R., Edge A. C., Hogan M. T., Main R. A., Vantyghem A. N., 2013, \hrefhttp://dx.doi.org/10.1093/mnras/stt490 MNRAS, \hrefhttp://adsabs.harvard.edu/abs/2013MNRAS.432..530R 432, 530
- Russell et al. (2014) Russell H. R., et al., 2014, \hrefhttp://dx.doi.org/10.1088/0004-637X/784/1/78 ApJ, \hrefhttp://adsabs.harvard.edu/abs/2014ApJ…784…78R 784, 78
- Russell et al. (2016) Russell H. R., et al., 2016, \hrefhttp://dx.doi.org/10.1093/mnras/stw409 MNRAS, \hrefhttp://adsabs.harvard.edu/abs/2016MNRAS.458.3134R 458, 3134
- Russell et al. (2017a) Russell H. R., et al., 2017a, \hrefhttp://dx.doi.org/10.1093/mnras/stx2255 MNRAS, \hrefhttp://adsabs.harvard.edu/abs/2017MNRAS.472.4024R 472, 4024
- Russell et al. (2017b) Russell H. R., et al., 2017b, \hrefhttp://dx.doi.org/10.3847/1538-4357/836/1/130 ApJ, \hrefhttp://adsabs.harvard.edu/abs/2017ApJ…836..130R 836, 130
- Ruszkowski et al. (2007) Ruszkowski M., Enßlin T. A., Brüggen M., Heinz S., Pfrommer C., 2007, \hrefhttp://dx.doi.org/10.1111/j.1365-2966.2007.11801.x MNRAS, \hrefhttps://ui.adsabs.harvard.edu/abs/2007MNRAS.378..662R 378, 662
- Salomé & Combes (2003) Salomé P., Combes F., 2003, \hrefhttp://dx.doi.org/10.1051/0004-6361:20031438 A&A, \hrefhttp://adsabs.harvard.edu/abs/2003A%26A…412..657S 412, 657
- Salomé & Combes (2004) Salomé P., Combes F., 2004, \hrefhttp://dx.doi.org/10.1051/0004-6361:20031744 A&A, \hrefhttp://adsabs.harvard.edu/abs/2004A%26A…415L…1S 415, L1
- Salomé & Combes (2008) Salomé P., Combes F., 2008, \hrefhttp://dx.doi.org/10.1051/0004-6361:200810262 A&A, \hrefhttp://adsabs.harvard.edu/abs/2008A%26A…489..101S 489, 101
- Salomé et al. (2006) Salomé P., et al., 2006, \hrefhttp://dx.doi.org/10.1051/0004-6361:20054745 A&A, \hrefhttp://adsabs.harvard.edu/abs/2006A%26A…454..437S 454, 437
- Salomé et al. (2011) Salomé P., Combes F., Revaz Y., Downes D., Edge A. C., Fabian A. C., 2011, \hrefhttp://dx.doi.org/10.1051/0004-6361/200811333 A&A, \hrefhttp://adsabs.harvard.edu/abs/2011A%26A…531A..85S 531, A85
- Sarazin et al. (1995) Sarazin C. L., Burns J. O., Roettiger K., McNamara B. R., 1995, \hrefhttp://dx.doi.org/10.1086/175899 ApJ, \hrefhttps://ui.adsabs.harvard.edu/#abs/1995ApJ…447..559S 447, 559
- Scharwächter et al. (2013) Scharwächter J., McGregor P. J., Dopita M. A., Beck T. L., 2013, \hrefhttp://dx.doi.org/10.1093/mnras/sts502 MNRAS, \hrefhttps://ui.adsabs.harvard.edu/abs/2013MNRAS.429.2315S 429, 2315
- Silk & Rees (1998) Silk J., Rees M. J., 1998, A&A, \hrefhttp://adsabs.harvard.edu/abs/1998A%26A…331L…1S 331, L1
- Simionescu et al. (2008) Simionescu A., Werner N., Finoguenov A., Böhringer H., Brüggen M., 2008, \hrefhttp://dx.doi.org/10.1051/0004-6361:20078749 A&A, \hrefhttp://adsabs.harvard.edu/abs/2008A%26A…482…97S 482, 97
- Simionescu et al. (2018) Simionescu A., Tremblay G., Werner N., Canning R. E. A., Allen S. W., Oonk J. B. R., 2018, \hrefhttp://dx.doi.org/10.1093/mnras/sty047 MNRAS, \hrefhttp://adsabs.harvard.edu/abs/2018MNRAS.475.3004S 475, 3004
- Soker et al. (2004) Soker N., Blanton E. L., Sarazin C. L., 2004, \hrefhttp://dx.doi.org/10.1051/0004-6361:20034415 A&A, \hrefhttp://adsabs.harvard.edu/abs/2004A%26A…422..445S 422, 445
- Solomon & Vanden Bout (2005) Solomon P. M., Vanden Bout P. A., 2005, \hrefhttp://dx.doi.org/10.1146/annurev.astro.43.051804.102221 ARA&A, \hrefhttp://adsabs.harvard.edu/abs/2005ARA%26A..43..677S 43, 677
- Solomon et al. (1987) Solomon P. M., Rivolo A. R., Barrett J., Yahil A., 1987, \hrefhttp://dx.doi.org/10.1086/165493 ApJ, \hrefhttp://adsabs.harvard.edu/abs/1987ApJ…319..730S 319, 730
- Solomon et al. (1997) Solomon P. M., Downes D., Radford S. J. E., Barrett J. W., 1997, ApJ, \hrefhttp://adsabs.harvard.edu/abs/1997ApJ…478..144S 478, 144
- Sparks et al. (1989) Sparks W. B., Macchetto F., Golombek D., 1989, \hrefhttp://dx.doi.org/10.1086/167890 ApJ, \hrefhttp://adsabs.harvard.edu/abs/1989ApJ…345..153S 345, 153
- Sturm et al. (2011) Sturm E., et al., 2011, \hrefhttp://dx.doi.org/10.1088/2041-8205/733/1/L16 ApJ, \hrefhttp://adsabs.harvard.edu/abs/2011ApJ…733L..16S 733, L16
- Szűcs et al. (2016) Szűcs L., Glover S. C. O., Klessen R. S., 2016, \hrefhttp://dx.doi.org/10.1093/mnras/stw912 MNRAS, \hrefhttps://ui.adsabs.harvard.edu/abs/2016MNRAS.460…82S 460, 82
- Tamura et al. (2001) Tamura T., et al., 2001, \hrefhttp://dx.doi.org/10.1051/0004-6361:20000038 A&A, \hrefhttp://adsabs.harvard.edu/abs/2001A%26A…365L..87T 365, L87
- Tremblay et al. (2016) Tremblay G. R., et al., 2016, \hrefhttp://dx.doi.org/10.1038/nature17969 Nat, \hrefhttp://adsabs.harvard.edu/abs/2016Natur.534..218T 534, 218
- Tremblay et al. (2018) Tremblay G. R., et al., 2018, preprint, \hrefhttp://adsabs.harvard.edu/abs/2018arXiv180800473T (\hrefhttp://arxiv.org/abs/1808.00473 arXiv:1808.00473)
- Vantyghem et al. (2014) Vantyghem A. N., McNamara B. R., Russell H. R., Main R. A., Nulsen P. E. J., Wise M. W., Hoekstra H., Gitti M., 2014, \hrefhttp://dx.doi.org/10.1093/mnras/stu1030 MNRAS, \hrefhttp://adsabs.harvard.edu/abs/2014MNRAS.442.3192V 442, 3192
- Vantyghem et al. (2016) Vantyghem A. N., et al., 2016, \hrefhttp://dx.doi.org/10.3847/0004-637X/832/2/148 ApJ, \hrefhttp://adsabs.harvard.edu/abs/2016ApJ…832..148V 832, 148
- Vantyghem et al. (2017) Vantyghem A. N., et al., 2017, \hrefhttp://dx.doi.org/10.3847/1538-4357/aa8fd0 ApJ, \hrefhttp://adsabs.harvard.edu/abs/2017ApJ…848..101V 848, 101
- Vantyghem et al. (2018) Vantyghem A. N., et al., 2018, \hrefhttp://dx.doi.org/10.3847/1538-4357/aad2e0 ApJ, \hrefhttp://adsabs.harvard.edu/abs/2018ApJ…863..193V 863, 193
- Vantyghem et al. (2019) Vantyghem A. N., et al., 2019, \hrefhttp://dx.doi.org/10.3847/1538-4357/aaf1b4 ApJ, \hrefhttp://adsabs.harvard.edu/abs/2019ApJ…870…57V 870, 57
- Veilleux et al. (2005) Veilleux S., Cecil G., Bland-Hawthorn J., 2005, \hrefhttp://dx.doi.org/10.1146/annurev.astro.43.072103.150610 ARA&A, \hrefhttp://adsabs.harvard.edu/abs/2005ARA%26A..43..769V 43, 769
- Voit & Donahue (2011) Voit G. M., Donahue M., 2011, \hrefhttp://dx.doi.org/10.1088/2041-8205/738/2/L24 ApJ, \hrefhttp://adsabs.harvard.edu/abs/2011ApJ…738L..24V 738, L24
- Voit et al. (2015) Voit G. M., Donahue M., Bryan G. L., McDonald M., 2015, \hrefhttp://dx.doi.org/10.1038/nature14167 Nat, \hrefhttp://adsabs.harvard.edu/abs/2015Natur.519..203V 519, 203
- Voit et al. (2017) Voit G. M., Meece G., Li Y., O’Shea B. W., Bryan G. L., Donahue M., 2017, \hrefhttp://dx.doi.org/10.3847/1538-4357/aa7d04 ApJ, \hrefhttp://adsabs.harvard.edu/abs/2017ApJ…845…80V 845, 80
- van Breugel et al. (1984) van Breugel W., Heckman T., Miley G., 1984, \hrefhttp://dx.doi.org/10.1086/161594 ApJ, \hrefhttp://adsabs.harvard.edu/abs/1984ApJ…276…79V 276, 79