Initial state radiation correction and its effect to data-taking scheme
for measurement
Abstract
The measurement of Born cross section of process is one of the major goals of the future Circular Electron Positron Collider, which may reach a precision of 0.5% at 240 GeV. Such unprecedented precision must be guaranteed by both theoretical and experimental sides, such as the calculations of high order corrections, the knowledge of the line shape. Uncertainty of the radiative correction factor at 240 GeV caused by the line shape is evaluated in this work. Therefore, dedicated data-taking schemes are proposed in order to precisely calculate the ISR correction factor.
keywords:
Higgs-strahlung; cross section; radiative correction; data-taking scheme.PACS numbers: 12.15.-y, 13.66.Jn, 12.15.Lk
1 Introduction
The historic observation of the Higgs boson in 2012 at the Large Hadron Collider (LHC) [1, 2] declared the discovery of the last missing piece of the most fundamental building blocks in the Standard Model (SM). Although the SM has been remarkably successful in describing experimental phenomena, a precision Higgs physics program will be critically important given that the SM does not predict the parameters in the Higgs potential, nor does it involves particle candidates for dark matters. In particular, potential observable deviations of the Higgs couplings from SM expectations would indicate new physics. Therefore, the Higgs discovery marks the beginning of a new era of theoretical and experimental explorations.
China has been investigating the feasibility of a high energy Circular Electron Positron Collider (CEPC) as a Higgs factory since 2013 [3, 4]. The CEPC will collide electrons and positrons at the center-of-mass energy of 240 GeV with an instantaneous luminosity of cm-2s-1. With a clean environment, CPEC will provide a much clearer picture of the nature of Higgs and reveal many of the most profound mysteries intimately connected with the Higgs particle. The three leading Higgs production processes at a 240 GeV CEPC are: Higgs-strahlung () and vector boson fusions ( and ). The CEPC is designed to collect 5.6 ab-1 of integrated luminosity with two detectors in seven years, producing about Higgs events.
One of the advantages at a collider like CEPC is that the center-of-mass energy is precisely defined and many absolute measurements could be performed for Higgs boson. In a event, where the boson decays to a pair of visible fermions (), the Higgs boson can be identified with the kinematics of these fermion pairs independent its decays. It is claimed that the CEPC is able to measure the observed cross section () of at 240 GeV to a precision of 0.5% by combining all three channels of boson decays [4].
The Born cross section () at 240 GeV, which is directly applicable to the theoretical analysis or independently comparing with results from other experiments, can then be obtained by applying corrections for initial state radiation (ISR) and other high order corrections. Unfortunately, the ISR correction at 240 GeV depends on not only the theoretical calculations but also the line shape of the cross section, which needs to be constrained by experimental data. In this paper, the dedicated data-taking schemes for the radiative correction to the cross section of at 240 GeV for CEPC is investigated. The data-taking schemes are optimized to collect data samples economically and effectively in order to achieve a significant better precision of the ISR correction factor at 240 GeV and to satisfy requirements experimentally and theoretically. Problems of determination of the center-of-mass energies and their integrated luminosities that need to be accumulated are carefully studied.
This paper is organized as follows: the ISR effect and theoretical formulas for the radiative correction are described in Sec. 2, followed by the procedure to calculate the radiative correction factor in Sec. 3, the data-taking schemes are suggested in Sec. 4, and finally summary and discussion about the results are presented.
2 ISR effect
The ISR effect is an issue that cannot be avoided at colliders. One of the incoming particles ( or ) emits photon(s) before the interaction with the other, which reduces the beam energy prior to the momentum transfer. The ISR effect can be described with the structure function approach [5, 6, 7, 8, 9, 10], which yields an accuracy of 0.1% due to the uncertainty of the radiative function . The uncertainty from is neglected because it’s much smaller than the statistical uncertainty and could be further reduced with more theoretical work in the future. The experimental of colliders can be mathematically factorized as the integral of the Born cross section with the high order correction factors and ,
| (1) |
where is the Born cross section at the center-of-mass energy of the colliding beam, and in the upper limit of the integral is the production threshold of the specific reaction, and represents all the high order corrections [12, 11, 13]. Since the high order factors are independent of experiments and not issues to concern in this paper, it is dropped hereafter.
The ISR correction factor is defined to extract the Born cross section from the observed one
| (2) |
where it should be noted that the and are usually calculated with some dedicated generator(s) with some experiment-dependent kinematic cuts and measured line shape from the threshold up to as inputs. Then the Born cross section at can be determined by
| (3) |
It should be noted that ISR correction factor is the function of center-of-mass energy, , and depends on not only theoretical calculations, but also experiment measurements. Furthermore its uncertainty directly contributes to the . For the sake of convenience, is used to represent relative uncertainty of the ISR correction factor throughout the paper. In this paper, only at 240 GeV is studied, which is easy to be replicated to other energy points.
3 Calculation of ISR correction factor
3.1 Model independent measurement of
In the Higgs-strahlung process, the annihilate into a virtual boson and becomes a real by emitting a Higgs boson, with the boson mainly decaying to a pair of fermions afterward. The center-of-mass energy is precisely controllable at a collider like the CEPC. The Higgs boson can be identified with the recoil mass of these fermion pairs with the following formula , where , and are the energy, momentum, and invariant mass of the fermion pair system, respectively. The event yield can be extracted independently of the Higgs decays with the spectrum.
Events with decaying to , and are three ideal ways to identify the recoil mass spectrum and cover a majority of 76.6% of the decay modes. The observed cross section is calculated using
| (4) |
where is the total number of events observed, is the integrated luminosity accumulated at a certain , is the branching fractions of decaying to , or . The efficiency of event selection for the reaction is obtained by a full detector simulation and digitalization procedures [4]. The major SM backgrounds are considered in the simulation and analysis as references [4, 14] and more details on the Higgs signal and standard model backgrounds samples can be found in this paper [15]. Then the three decay modes are combined to form the final in order to improve the precision.
3.2 Method to extract ISR correction factor
The ISR effect impacts on not only the production rate of process but the shape of the recoil mass spectrum, which is used to determine the signal yield. Therefore, a full knowledge of ISR correction is essential for both measurements of and Higgs boson mass. The expressions in Eq. (1)-(3) manifest mathematically that constraining the line shape of the Born cross section from production threshold to 240 GeV is needed to get a precise measurement of the ISR correction factor at 240 GeV. The only feasible way is to collect a series of scan data samples between the threshold and 240 GeV to constrain the line shape of .
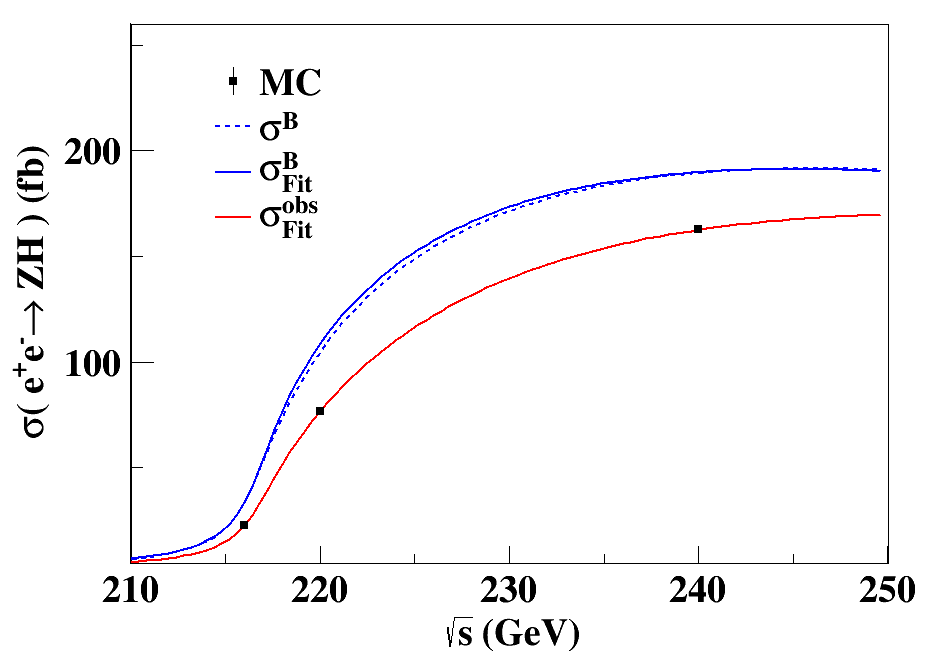
The procedure described here is used to demonstrate the dependence of the ISR correction factor at center-of-mass energy of 240 GeV on the line shape of . First, The Born cross section is assumed to be SM-like [16] and the radiative function, [5, 6, 7, 8, 9], is used to calculate the observed cross section. Then the MC signals of process are generated at 216, 220, and 240 GeV with luminosities of 0.2, 0.2, and 5.6 ab -1, respectively, and the background contributions are assumed to be the same as those at 240 GeV because their cross sections change rather slowly in this energy region [15]. Next, same analysis method [14] is repeated to get observed cross sections and evaluate their statistical uncertainties. And next, the observed cross section of all energy points are fitted using Eq. (1) and and are obtained simultaneously as shown in Fig. 1. Finally, the ISR correction factor is calculated using Eq. (2): at 240 GeV, where and are the best knowledge on the observed and Born cross sections and will be implemented into generators.
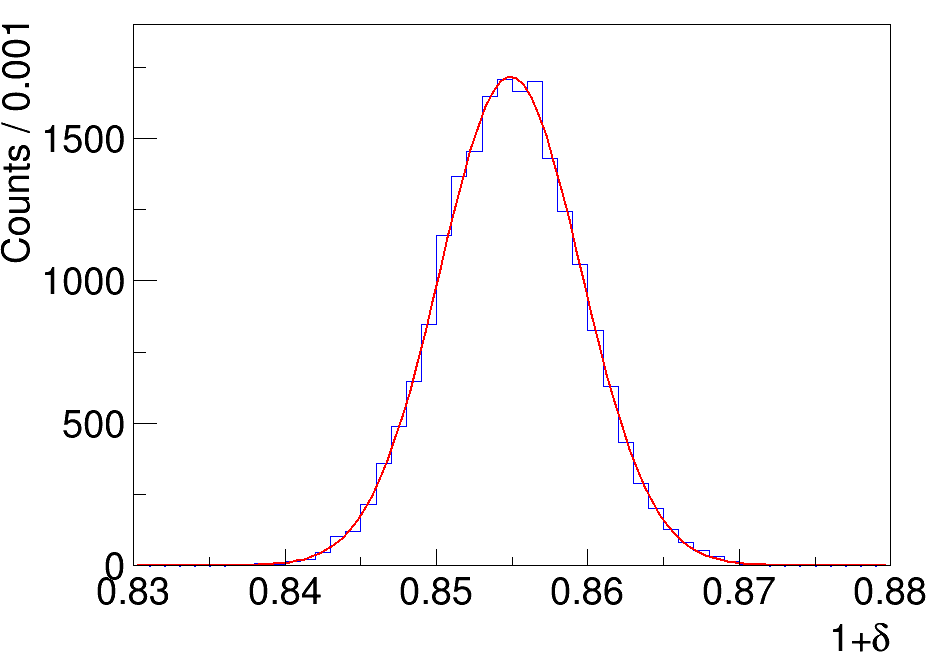
After repeat the above procedure 20,000 times, the distribution of the ISR correction factor at 240 GeV is found to satisfy a Gaussian distribution as expected. The fitted mean and standard deviation are taken as the central value and uncertainty of the ISR correction factor, respectively. Fig. 2 illustrates the fit results, and the relative uncertainty at 240 GeV is 0.54% in this case.
4 Optimization of Data-taking scheme
In Eq.(1), the integral kernel is Born cross section, which should be measured by experiments. The reason is that Higgs properties are still not yet solidly determined due to the limited experimental precision. On one hand, the present experimental results are sufficient to discriminate between distinct hypotheses in Higgs boson spin analysis [17, 18]. But on the other hand, the determination of the properties is in general much more difficult, since in principle the observed state could consist of any admixture of -even and -odd components [18, 19]. If physics is the SM, i.e., a single resonance with spin-0 and -even, the Born cross section of the Higgs-strahlung process is expected to reach its maximum at 250 GeV approximately, and then decreases with increasing center-of-mass energy. From the experimental point of view, the center-of-mass energies of the data samples determine the uncertainty of the fitted line shape of the cross section. Besides, the allocation of integrated luminosity, of the various energy points could also make differences on the uncertainty of the ISR correction factor and of the at 240 GeV. In conclusion, dedicated scan data samples between the threshold and 240 GeV are needed to constrain the line shape of process.
For a measurement of 0.5% statistical uncertainty, the sensitivity cannot be better than 0.5% according to the definition in Eq.(1) and (2). In order to achieve a relative comparable precision of 0.5% for the ISR correction factor at 240 GeV, an economical and effective way of collecting data samples should be proposed for the CEPC. The effects of energies and allocation of integrated luminosity are investigated systematically in this section.
4.1 Determination of the energies
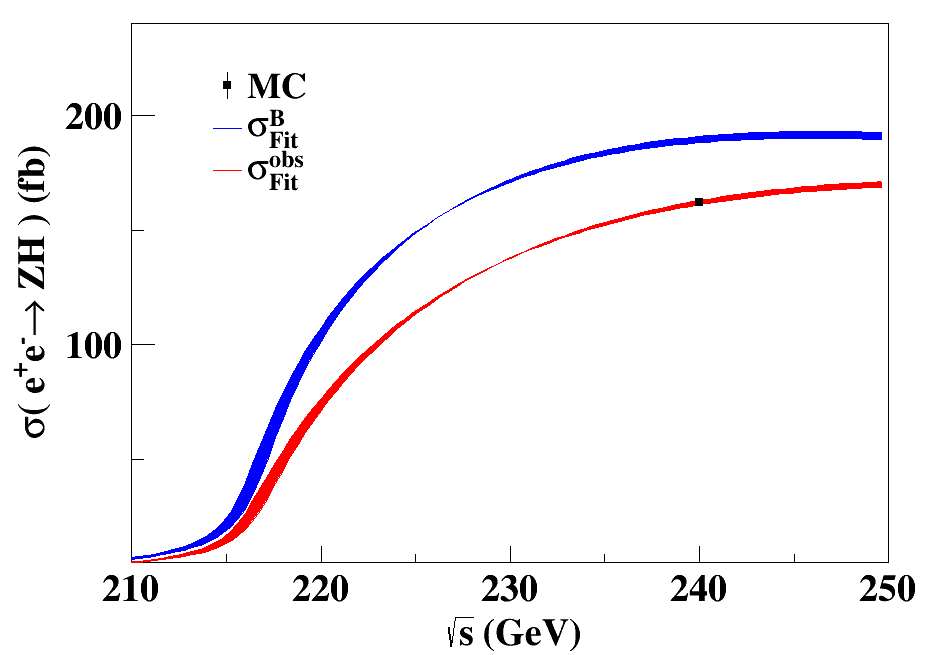
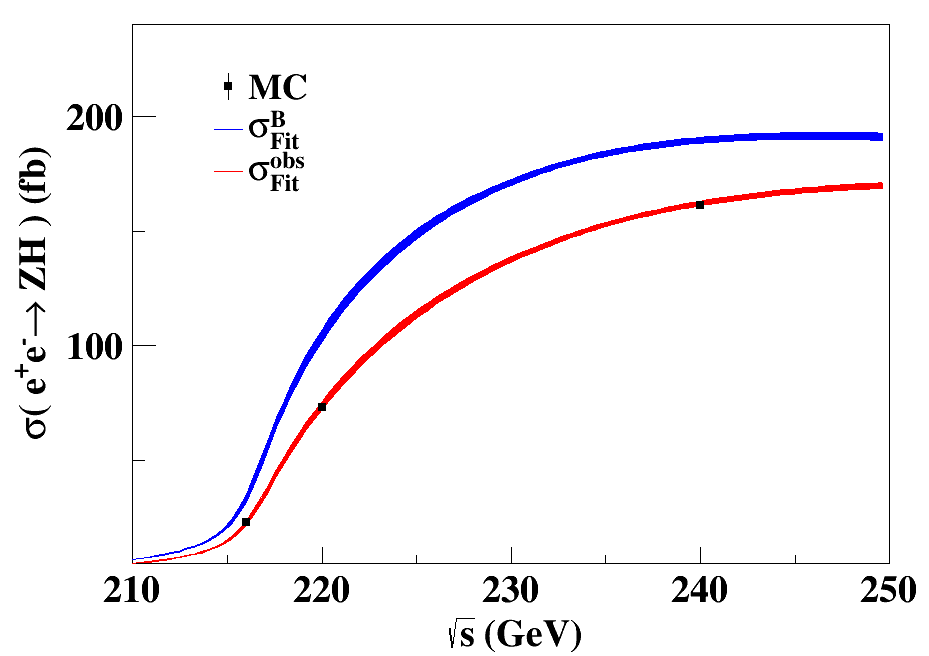
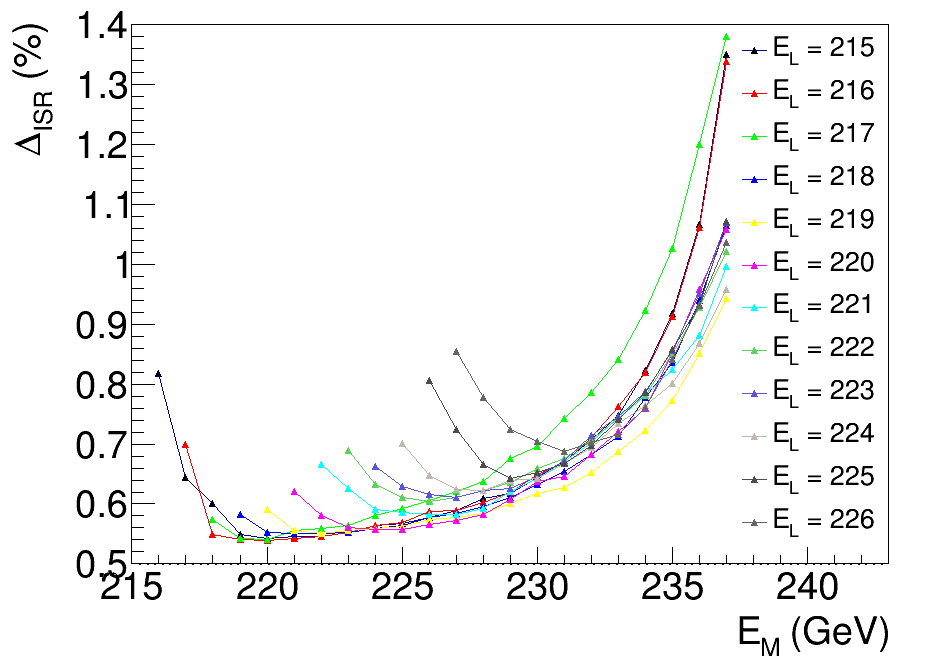
The impact of energies is studied by changing the combination of center-of-mass energies of MC samples. As a Higgs factory, CEPC is designed to accumulate a total of 5.6 ab-1 integrated luminosity running at 240 GeV. The line shape of the Born cross section based on MC sample at this single energy point of 240 GeV is shown in the left of Fig. 3. The Born cross sections are constrained to the blue band with a bad performance in the low energy region which indicates that more data are in need below 230 GeV. Our study shows that besides the established 5.6 ab-1 data-taking plan at 240 GeV, at least two more data samples at lower energy region are necessary to form a stable fit. With the luminosities fixed to 0.2 ab-1, MC samples are generated with center-of-mass energies varying from 215 to 239 GeV with a step of one GeV. Then fits are performed with the data sample at 240 GeV together with MC samples randomly picked at two other lower energy points. As illustrated in the right of Fig. 3, the Born cross sections are constrained to a much narrower band in the lower energy region.
Center-of-mass energies of three MC samples versus the uncertainty of the ISR factor at 240 GeV. The luminosities for the three samples (energies from low to high) are fixed to 0.2, 0.2, and 5.6 ab-1, respectively. \toprule (GeV) (%) 215 220 240 0.54 216 220 240 0.54 217 220 240 0.54 218 222 240 0.55 219 222 240 0.55 220 224 240 0.56 221 227 240 0.58 222 226 240 0.61 223 227 240 0.61 224 228 240 0.62 \botrule
The most accurate fit results of the energy combinations with the lowest energy of MC sample varies from 215 to 224 GeV are listed in Table 4.1 and the full-scale fit results can be found in Fig. 4. As an example, the red points refers to fit results with lowest energy MC sample generated at 216 GeV, the horizontal axis is the center-of-mass energy of MC sample at the middle energy point. Fit results with different lowest energy MC sample are shown in the same figure. The common feature is that decrease as a function of the center-of-mass energy of the MC sample at middle energy point, then increase above a certain point after three to four GeV interval approximately. The energy combination is the most critical factor for the accuracy of at 240 GeV. For example, with the same luminosity combination of 0.2, 0.2, and 5.6 ab-1, the uncertainty can differ from 0.54% to 14%. Other luminosity allocations are studied, besides the fit is also applied with more than three MC samples, we find that three MC samples at 216, 220, and 240 GeV gives a best accuracy on average in case of the same integrated luminosity.
4.2 Allocation of integrated luminosity
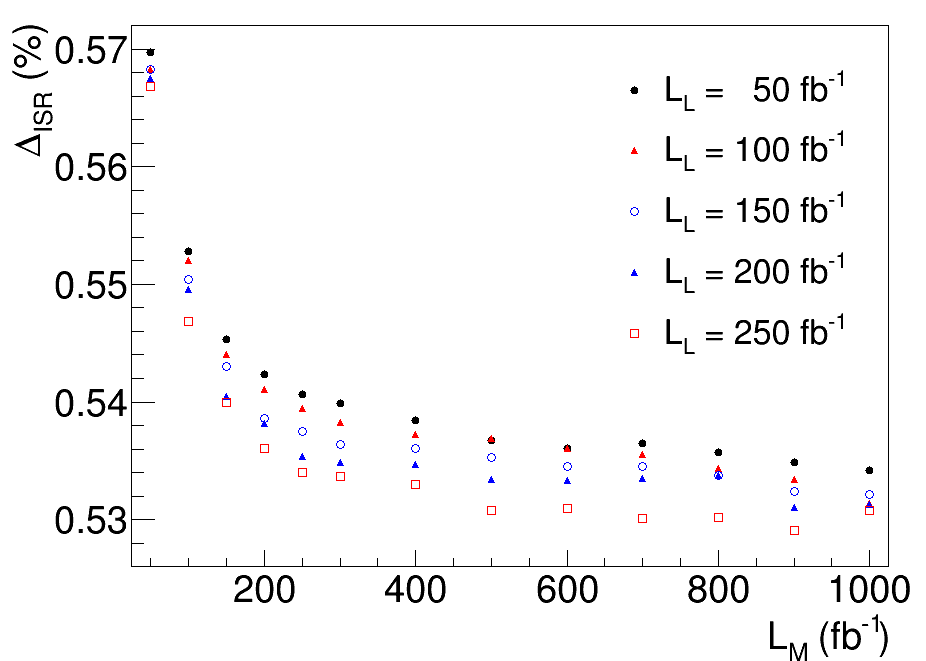
The energies of three MC samples are fixed to 216, 220, and 240 GeV, which provides the best performance on average. With the luminosity for the MC sample at 240 GeV fixed to 5.6 ab-1, we change the luminosities of the other two MC samples for the purpose of investigating the effect of statistics. A significant improvement is that the relative uncertainty are all below 0.6% with the energies fixed at 216, 220, and 240 GeV as shown in Fig. 5. The luminosity of the MC sample at lowest energy is fixed at a certain value, at first the uncertainty decrease rapidly as the luminosity of the MC sample at the middle energy increases. But the slope gradually reduce until finally reaching a plateau region where has a little reduction with the increase of the luminosity of the MC sample at the middle energy point. A comparison between results with different colors indicates that with a higher statistic for the MC sample at lowest energy, the slope of is bigger and gives a better averaged precision in the plateau regions. However, in contrast with the significant improvement due to a higher statistic of the MC sample at middle energy point, the increase of the luminosity of the lowest energy MC sample does not make significant changes.
5 Summary and discussion
In summary, the procedure of the calculation of ISR correction factor at 240 GeV of the Higgs-strahlung process is investigated to match the statistical precision of the future CEPC. The effects of energies and statistics of data samples are studied systematically and the uncertainty of the ISR correction factor at 240 GeV is evaluated accordingly. Based on the SM assumption, a economical and effective data-taking scheme is proposed.
The study suggests an economical and effective proposal of collecting data samples. With the established 5.6 ab-1 data-taking plan at 240 GeV as well as data samples at two other energy points, the uncertainty for the ISR correction factor of at 240 GeV can be suppressed significantly. Selecting of energy points is the most critical factor for the precision, and it is found that three data samples at 216, 220, and 240 GeV give the best accuracy on average when fixing the total integrated luminosity. The allocation of integrated luminosity can be found in Fig. 5. The study shows that higher priority should be given to 220 GeV if the precision need to be improved further. The projected data sample (240 GeV, 5.6 ab-1) has dominant contribution to control the line shape of , because the lower energy regions count for a small fraction of the whole integral range in Eq. (1) and the Born cross sections are quite small comparing to higher energy regions. It should be noted that such scan data samples for the ISR correction are also useful to determine the Higgs boson spin and .
Acknowledgments
This work was supported by the National Key Program for S&T Research and Development (Grant No.: 2016YFA0400400), the Beijing Municipal Science & Technology Commission project (Grant No.: Z1811000042180043) and the National Natural Science Foundation of China (Grant No.: 11205117, 11575133).
References
- [1] ATLAS Collaboration (G. Aad et al.), Observation of a new particle in the search for the Standard Model Higgs boson with the ATLAS detector at the LHC, Phys. Lett. B 716, 1-29 (2012).
- [2] CMS Collaboration (S. Chatrchyan et al.), Observation of a new boson at a mass of 125 GeV with the CMS experiment at the LHC, Phys. Lett. B 716, 30-61 (2012).
- [3] The CEPC Study Group, CEPC Conceptual Design Report: Volume 1 - Accelerator, arXiv:1809.00285 [hep-ex].
- [4] The CEPC Study Group, CEPC Conceptual Design Report: Volume 2 - Physics & Detector, arXiv:1811.10545 [hep-ex].
- [5] E.A. Kuraev and V.S. Fadin, Sov. J. Nucl. Phys. 41, 466-472 (1985); Yad. Fiz., Sov. J. Nucl. Phys. 41, 733-742 (1985).
- [6] G. Altarelli and G. Martinelli, CERN 86-02, 47 (1986); O. Nicrosini and L. Trentadue, Phys. Lett. B 196, 551-556 (1987).
- [7] F.A. Berends, W.L. Van Neerven and G.J.H. Burgers, Nucl. Phys. B 297, 429-478 (1988).
- [8] J. Blümlein, A. De Freitas and W. van Neerven, Two-loop QED operator matrix elements with massive external fermion lines, Nucl. Phys. B 855, 508-569 (2012).
- [9] J. Blümlein, A. De Freitas, C. G. Raab and K. Schönwald, The initial state QED corrections to annihilation to a neutral vector boson revisited, Phys. Lett. B 791, 206-209 (2019).
- [10] M. Greco, G. Montagna, O. Nicrosini, F. Piccinini and G. Volpi, ISR corrections to associated production at future Higgs factories, Phys. Lett. B 777, 294-297 (2018).
- [11] Y.Q. Gong et al., Mixed QCD-electroweak corrections for Higgs boson production at colliders, Phys. Rev. D 95, 093003 (2017).
- [12] Q.F. Sun et al., Mixed electroweak-QCD corrections to at Higgs factories, Phys. Rev. D 96, 051301 (2017).
- [13] W. Chen et al., Mixed electroweak-QCD corrections to at CEPC with finite-width effect, Chin. Phys. C 43, 013108 (2019).
- [14] Z.X. Chen et al., Cross section and Higgs mass measurement with Higgsstrahlung at the CEPC, Chin. Phys. C 41, 023003 (2017).
- [15] X. Mo et al., Physics cross sections and event generation of annihilations at the CEPC, Chin. Phys. C 40, 033001 (2016).
- [16] F.A. Berends and R. Kleiss, Nucl. Phys. B 260, 32-60 (1985).
- [17] ATLAS Collaboration (G. Aad et al.), Evidence for the spin-0 nature of the Higgs boson using ATLAS data, Phys. Lett. B 726, 120-144 (2013).
- [18] CMS Collaboration (S. Chatrchyan et al.), Study of the Mass and Spin-Parity of the Higgs Boson Candidate via Its Decays to Z Boson Pairs, Phys. Rev. Lett. 110, 081803 (2013).
- [19] CMS Collaboration (V. Khachatryan et al.), Constraints on the spin-parity and anomalous couplings of the Higgs boson in proton collisions at 7 and 8 TeV, Phys. Rev. D 92, 012004 (2015).