Order-disorder transition in the prototypical antiferroelectric PbZrO3
Abstract
The prototypical antiferroelectric PbZrO3 has several unsettled questions, such as the nature of the antiferroelectric transition, possible intermediate phase and the microscopic origin of the Pbam ground state. Using first principles, we show that no phonon becomes truly soft at the cubic-to-Pbam transition temperature, and the order-disorder character of this transition is clearly demonstrated based on molecular dynamics simulations and potential energy surfaces. The out-of-phase octahedral tilting is an important degree of freedom, which can collaborate with other phonon distortions and form a complex energy landscape with multiple minima. Candidates of the possible intermediate phase are suggested based on the calculated kinetic barriers between energy minima, and the development of a first-principles-based effective Hamiltonian. The use of this latter scheme further reveals that specific bi-linear interactions between local dipoles and octahedral tiltings play a major role in the formation of the Pbam ground state, which contrasts with most of the previous explanations.
Antiferroelectrics (AFEs) form a special class of materials that possess anti-polar displacements, which was first conceptualized by Kittel Kittel (1951). AFEs have received much attention in recent years because they hold great potential to reach high energy density for high-power energy storage Hao (2013); Rabe (2013); Xu et al. (2017). Lead zirconate PbZrO3 (PZO) is the first discovered AFE material, and crystallizes in a Pbam ground state below 505 K Sawaguchi et al. (1951); Shirane et al. (1951); Shirane (1952). Besides the anti-polar distortions, this particular structure also exhibits strong long-ranged order tiltings of oxygen octahedra, which is often termed as antiferrodistortive (AFD) distortions.
Despite the efforts devoted to understanding the origin of the AFE ground state in PZO Tagantsev et al. (2013); Íñiguez et al. (2014); Hlinka et al. (2014), how distortions condense from the high-symmetry cubic structure remains an open issue. Unlike proper ferroelectrics where the ferroelectric (FE) distortion results from soft polar mode in the cubic phase, it is presently unclear if PZO is a proper AFE. As a matter of fact, on one hand, completely soft AFE and AFD modes have been predicted at the AFE transition temperature () by Fthenakis et al. based on an effective Hamiltonian method Fthenakis and Ponomareva (2017). On the other hand, no truly soft AFE or AFD modes was observed in Ref. Tagantsev et al. (2013). In this regards, Tagantsev et al. proposed that the AFE transition in PZO is driven by a non-critical softening of the transverse acoustic mode via flexoelectric coupling Tagantsev et al. (2013); however, this mechanism is rather exotic and has recently been ruled out Vales-Castro et al. (2018). Moreover, from an energetic point of view, Íñiguez et al.. believe that the AFD mode plays a crucial role and PZO may be an improper AFE Íñiguez et al. (2014).
In fact, the above considerations in Refs. Fthenakis and Ponomareva (2017); Íñiguez et al. (2014) rely on the existence of a displacive transition, for which the distortions in the antiferroelecrtic state are derived from sudden deviations from the ideal cubic structure at . However, such assumption may be invalid for PZO, as the AFE transition have been advocated to possess a strong order-disorder character, as evidenced by (i) the existence of central mode Ostapchuk et al. (2001); Ko et al. (2013) and (ii) the fact that disordered Pb displacement and oxygen tiltings were found to occur even in the cubic phase Paściak et al. (2015); Zhang et al. (2015). Interestingly, this picture of dynamic disorder in the cubic phase is similar to the recent studies of the AFD transitions in CaMnO3 and inorganic halide perovskites Klarbring and Simak (2018); Klarbring (2019), where low-energy paths between local minima are found to be critical for understanding the finite-temperature transitions.
Furthermore, there exists a FE R3c phase that is energetically very close to the AFE state, merely a few meV/f.u. higher than Pbam at 0 K, according to ab initio calculations Reyes-Lillo and Rabe (2013); Íñiguez et al. (2014). Hence, it is interesting to understand what microscopic effect is mostly responsible for the stabilization of Pbam rather than R3c as the ground state. In particular, is it the commonly believed trilinear energy coupling Hlinka et al. (2014); Íñiguez et al. (2014), or rather something else Patel et al. (2016)? Another unsettled issue in PZO concerns the possible existence of an intermediate phase in the vicinity of Sawaguchi et al. (1951); Tennery (1965, 1966); Goulpeau (1967); Fujishita (1992); Liu (2018): such intermediate state can only occur over a very narrow temperature range of 3–5 K between the AFE and the cubic phase, and its structure remains a mystery.
In this article, we use first-principles methods to demonstrate that the order-disorder picture may hold the key to understand the AFE transition and the debated intermediate phase Sawaguchi et al. (1951); Tennery (1965, 1966); Goulpeau (1967); Fujishita (1992) in PZO. We also reveal that a very specific bi-linear (and therefore not trilinear) energetic coupling plays a crucial role in the stabilization of Pbam and can also yield other more complex structures, such as with long-periods and incommensurable ones.
Phonons in the cubic phase at high temperatures are investigated by combining ab initio molecular dynamics (AIMD) simulations implemented in vasp Kresse and Joubert (1999) with the temperature dependent effective potential (TDEP) method Hellman et al. (2011); Hellman and Abrikosov (2013); Hellman et al. (2013). The potential energy surface (PES) is calculated by density functional theory (DFT) Kresse and Joubert (1999), and the kinetic barriers are computed with the climbing image nudged elastic band (CI-NEB) method Henkelman et al. (2000). We also develop an effective Hamiltonian for PZO to explain the microscopic origin of its complex ground state and to suggest other more complex candidates for the intermediate state. Further details of the methods are given in the Supplemental Material (SM) sm .
A purely displacive picture requires truly soft phonon mode. Let us first check how phonon softens in the cubic phase as temperature decreases. The dispersion for different temperatures above 450 K are shown in Fig. 1a, as calculated by the TDEP method based on AIMD simulations with a 444 supercell (320 atoms). In contrast to the 0K phonon computed by density functional perturbation theory (DFPT) that exhibits soft branches Ghosez et al. (1999); Cockayne and Rabe (2000); Leung et al. (2002); Leung (2003) (also shown in Fig. 1a via dashed lines), all the phonon frequencies are positive for 450 K, implying that the cubic structure is dynamically stable at high temperature. We also numerically find via AIMD simulations that, below 450 K, the structure is not cubic not (a). Interestingly, this latter temperature is rather close to the experimental AFE transition temperature of 505 K.
Moreover, the 0K phonon exhibits the largest instabilities at the , , and points of the Brillouin zone, that correspond to , , and , respectively (with being the 5-atom lattice constant) and that are associated with the FE distortion, out-of-phase (oop) tilting, and in-phase (ip) tilting, respectively. Furthermore, according to the calculated dispersion curves, when cooling from high temperature, these phonon modes show noticeable softening, as depicted in Fig. 1b. Note that the calculated zone-center softening agrees reasonably well with the measured data for the -point mode Ostapchuk et al. (2001).
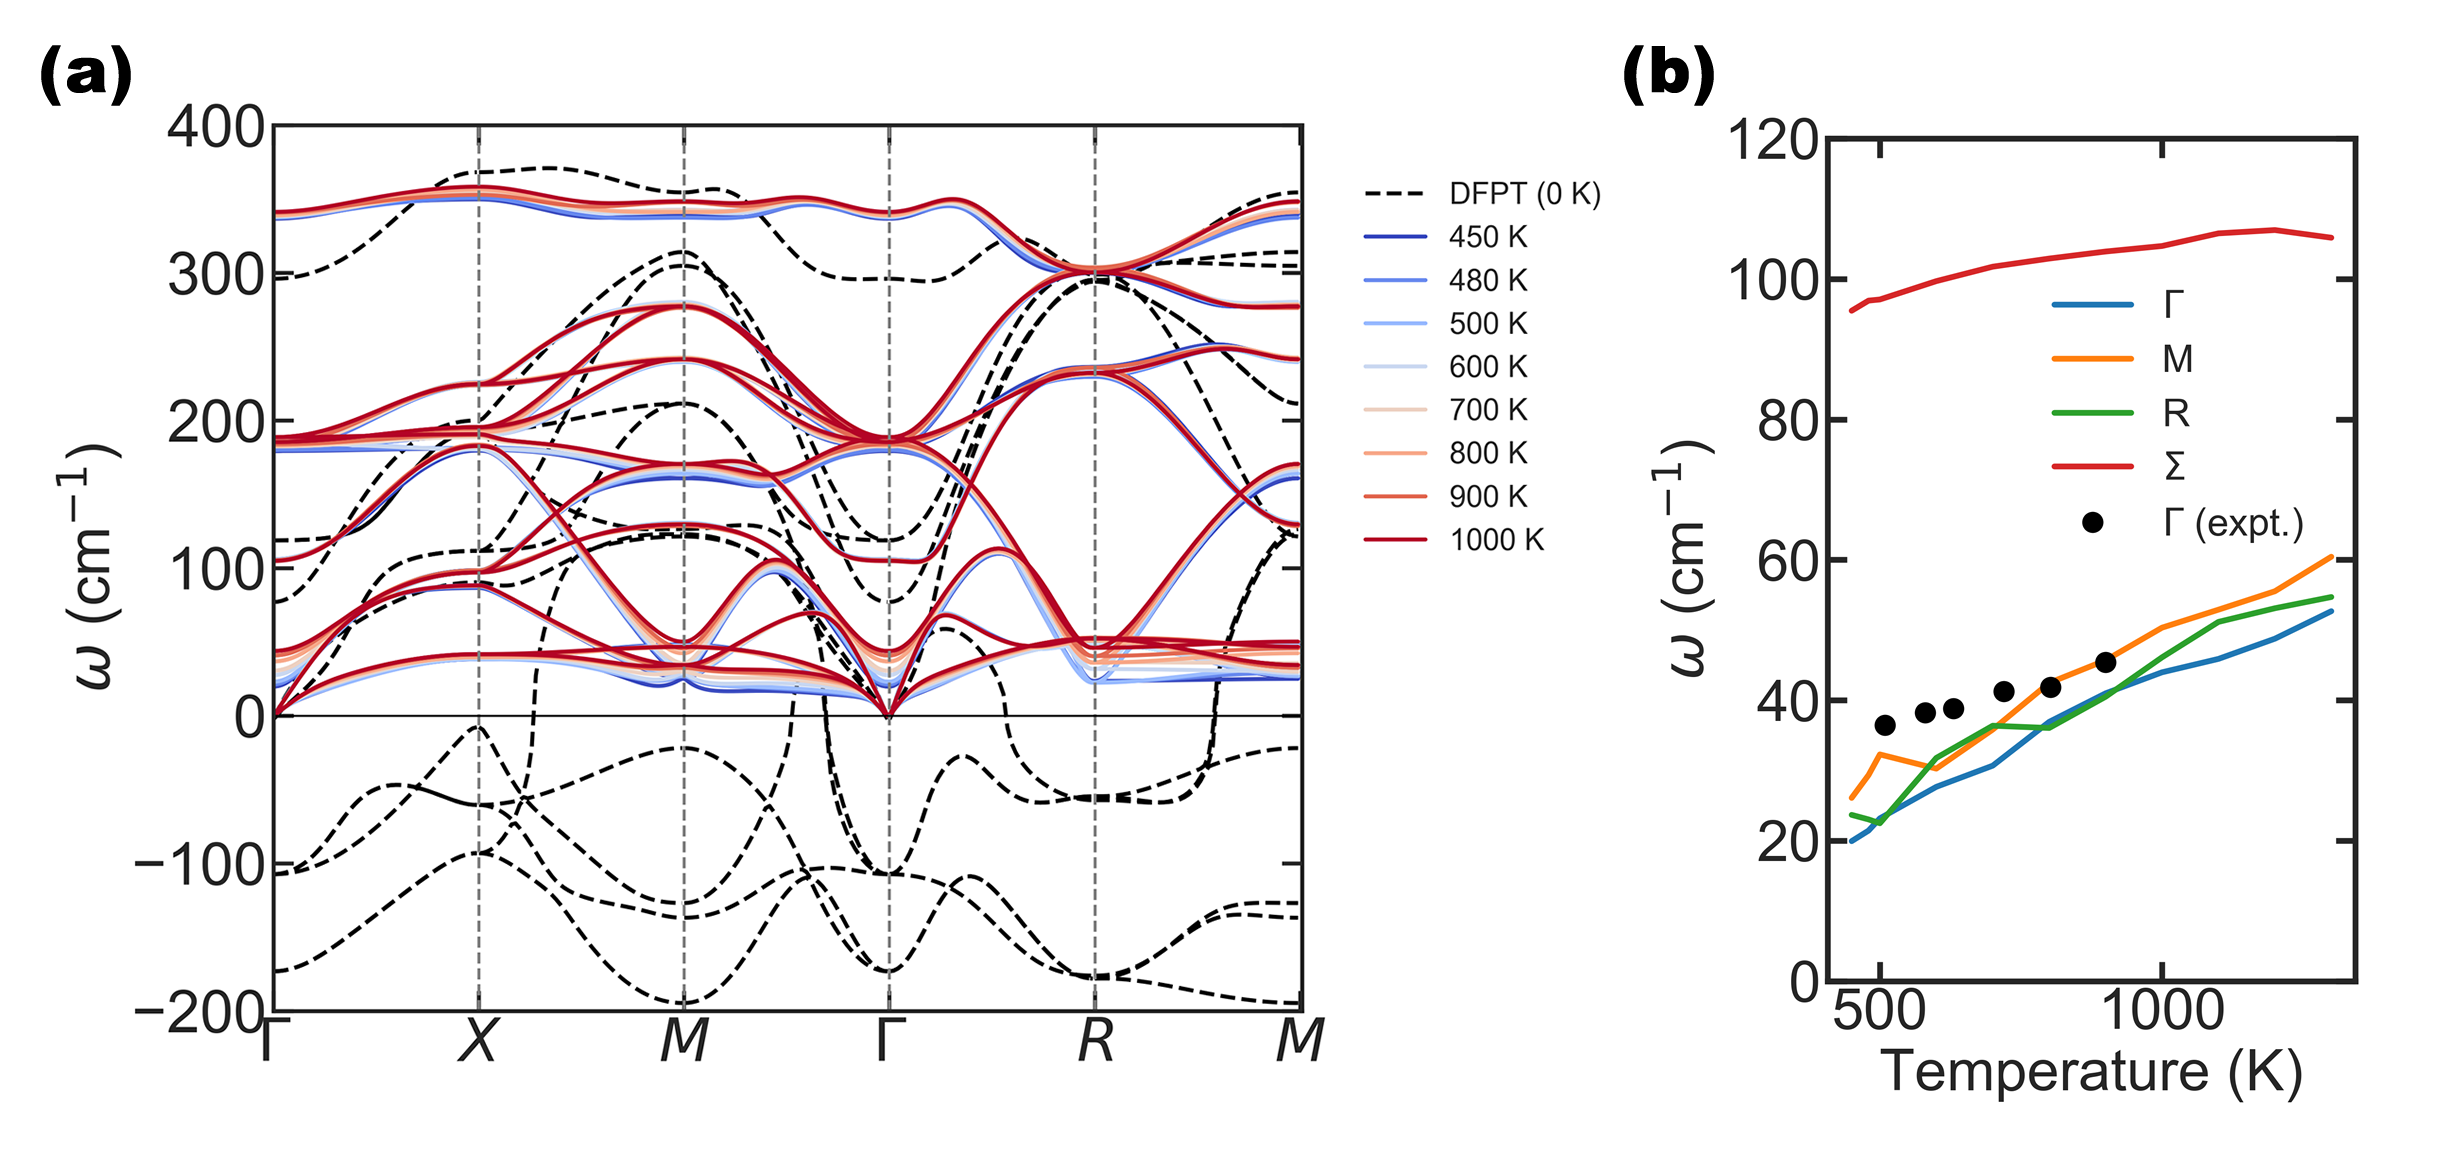
Interestingly, no phonon becomes truly soft (that is none of them drops to zero frequency) when the temperature approaches 450K from above, as consistent with experimental data in the cubic phase Tagantsev et al. (2013); Ostapchuk et al. (2001). In particular, Ref. Tagantsev et al. (2013) pointed out that the - and -point modes are not soft at , where , which is consistent with our prediction in Fig. 1b, but contrasts with the theoretical work of Ref. Fthenakis and Ponomareva (2017) that predicted completely softened and modes.
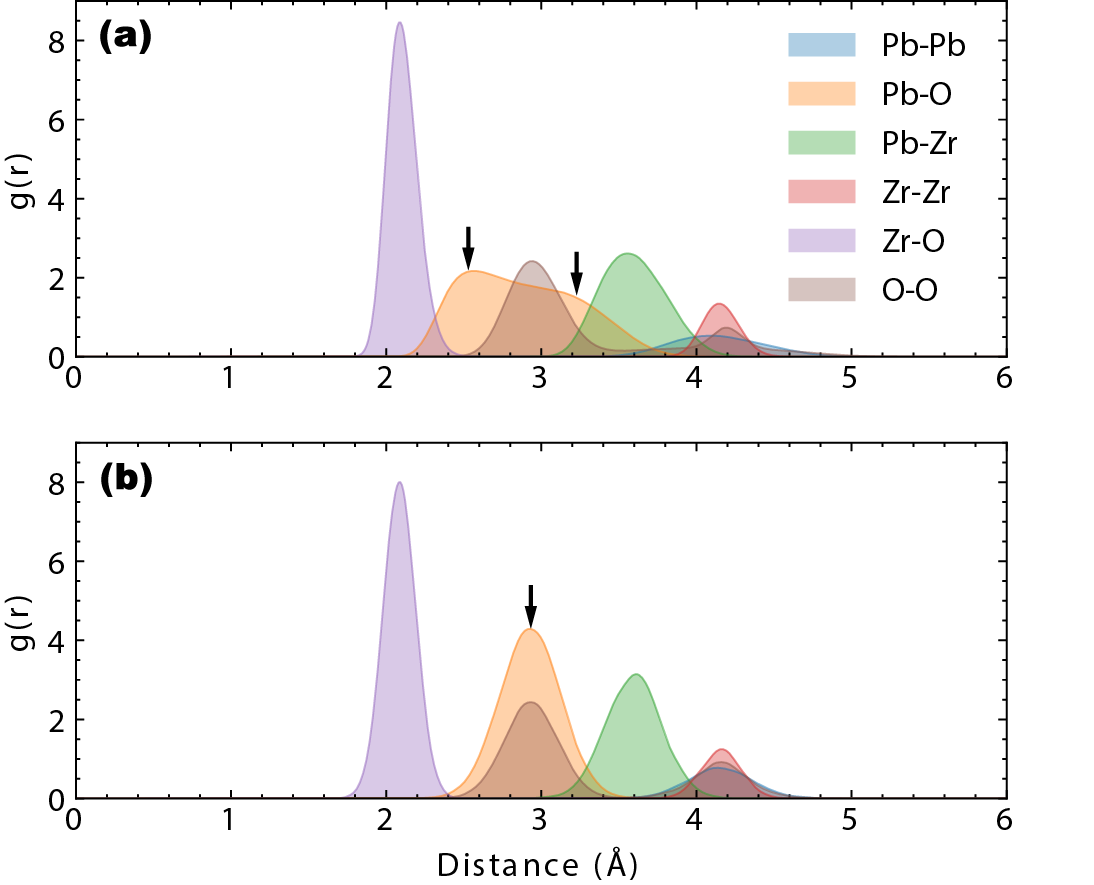
The lack of soft phonon suggests that the paraelectric-to-AFE transition (without counting the intermediate phase) is of first order, as also consistent with experiments Samara (1970); Whatmore and Glazer (1979); Fujishita et al. (2003). Moreover, in order to check if this transition has characters of an order-disorder type, as suggested by Ref. Ostapchuk et al. (2001) based on the measured central mode, we analyze the MD simulation at 600 K, for which the cubic phase is stable. Figure 2a reports the pair correlation function , which is related to the probability of finding an ion at a given distance from another ion. For comparison, we also plot from cubic stochastic sampling in Fig. 2b, in which the atomic displacements are centered harmonically around the cubic positions, as indicated by the Gaussian distribution of each pair. The only obvious difference between the two sampling schemes lies in the Pb-O pair, which has a single peak with cubic stochastic sampling but splits into two distances with MD sampling. This splitting is due to the finite tilting angle as long-life-time positions in the cubic phase, as evidenced from the MD simulation (see Figs. S2 and S3 in the SM sm for more information). As the AIMD simulation is considered to be much more realistic than cubic stochastic sampling not (b), it indicates that the cubic phase should be regarded as a dynamical average structure, in which thermal excitations cause the system to hop among local minima with finite tilting angles, with low-energy paths that bypass the ideal cubic positions (see Fig. S4 in the SM sm ). Such splitting also exists at even higher temperature, e.g., up to 1000 K, except that gradually becomes closer to the cubic stochastic case when increasing .
Further understanding of the structures and nature of the transition can be obtained from the PES. With the cubic structure as reference, we plot the double well potential with respect to a single mode distortion (of normalized magnitude denoted as ), as shown in Fig. 3a. The energy can be lowered with finite FE distortion (), ip tilting ( or ), or oop tilting ( or ), which are the most significant instabilities in cubic PZO (see DFPT phonon in Fig. 1a). The largest energy gain of 222 meV/f.u. is provided by the mode, whereas the and modes cause less energy change, i.e., 167 and 57 meV/f.u., respectively. Such result implies that the oop tilting is likely to be the most important degree of freedom in PZO. This is in line with the work of Íñiguez et al., which suggests that this mode plays a crucial role in stabilizing the AFE ground state Íñiguez et al. (2014). It is also worth to mention that all the low-energy structures reported in Ref. Íñiguez et al. (2014) (e.g., Pbam, R3c, Pnma, etc.) have the tilting as a component, further reflecting its role leading to low-energy states. Nevertheless, the large barrier heights of reversing and imply that the transition is not likely to be displacive, as thermal energy at is not sufficient to bypass the ideal cubic positions, even for condensing a single tilting mode. Such fact is related to the finite tilting angles in the cubic phase from MD simulations.
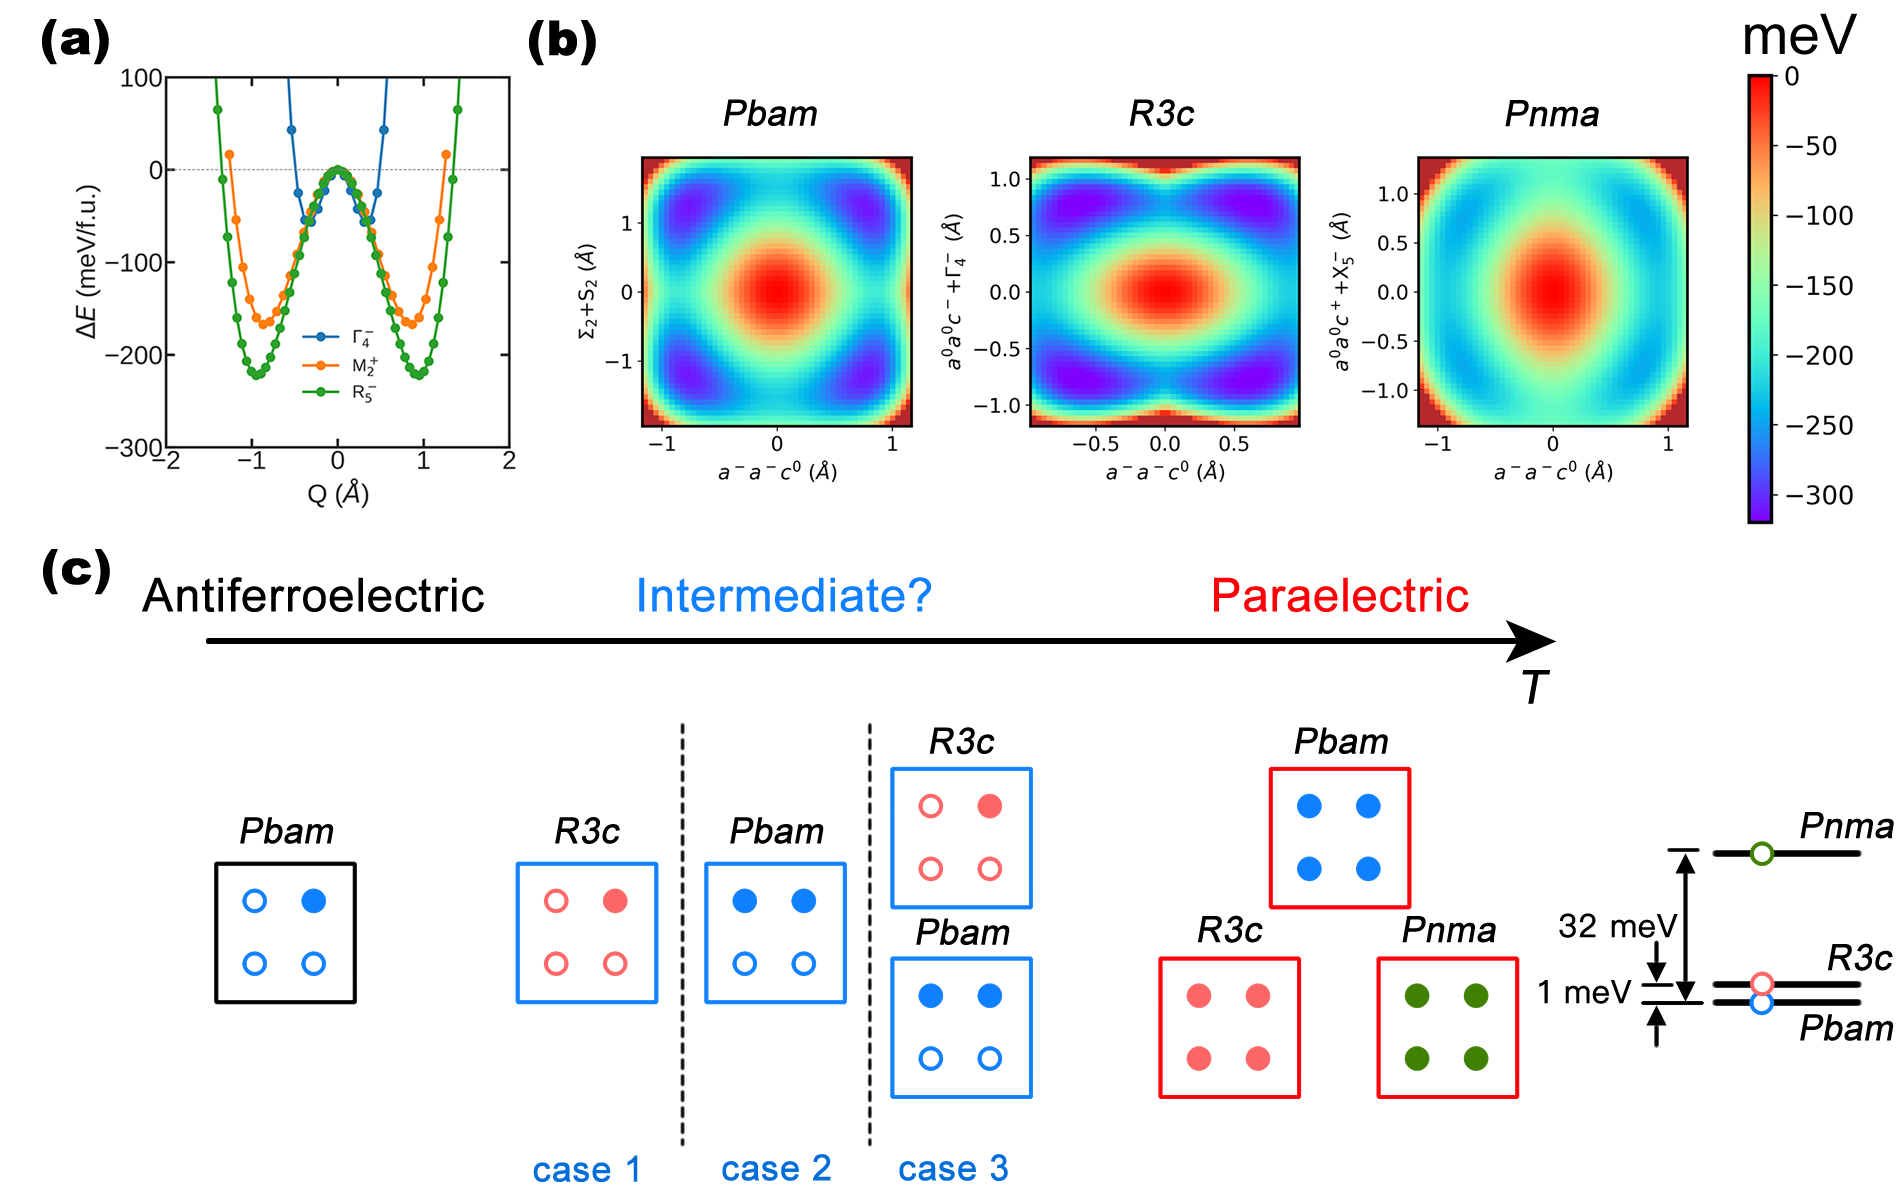
Next, we combine tilting with other distortions to yield three competing polymorphs having low energies, viz., the Pbam (ground state), R3c, and Pnma phases. Using the crystallographic tool amplimode Orobengoa et al. (2009); Perez-Mato et al. (2010), the Pbam structure is mainly composed of three distortions: , and S2. The component captures 58.8% of the total distortion, which is the largest, while it is 37.1% and only 3.8% for and S2, respectively. To simplify the picture, we combine the and S2 modes and compute the 2-dimensional PES by changing and +S2. The resulting contour plot is shown in the left panel of Fig. 3b, and exhibits four minima that correspond to the Pbam structure not (c) – which is a manifestation of collaborative couplings between the , and S2 modes. The energy of these minima relative to the cubic structure (center) is 311 meV/f.u., being significantly larger than the barrier heights between these minima, which are found to be 89 or 113 meV/f.u. by reversing or +S2, respectively. Improved estimation of the barrier heights are obtained by the CI-NEB method, yielding 51 or 58 meV/f.u., respectively. Considering the energy scale of thermal energy (e.g., 86 meV at 1000 K), it appears unlikely that the ideal cubic structure is visited even at very high temperature, therefore further implying an order-disorder nature of the paraelectric-to-AFE transition (intermediate phase not counted).
The middle (respectively, right) panel of Fig. 3b depicts the PES associated with the changes of and + (respectively, of and +X), and therefore involves the R3c (respectively, Pnma) phase. The coupling between and + (or +X) is also collaborative, and there exist low-barrier energetic paths without passing through the cubic structure too, which confirms that the high-temperature cubic phase should be taken as a dynamical average structure, with the system hopping between different states with finite AFD tiltings. This finding is in full accordance with the pair correlation function obtained from MD simulations (Fig. 2a).
Combining tilting with other phonon modes can therefore lead to these three low-energy structures, the ground state being Pbam (set as 0), the R3c phase with an energy that is only 1 meV/f.u. higher, and 32 meV/f.u. for the Pnma phase. We will discuss the couplings that gives rise to the AFE ground state later in the text, but here one should note that the lower energy of Pbam than R3c depends on the precise structure and chemistry. Slight change of structure or chemical composition (e.g., Ti doping) can affect the energy hierarchy, giving rise to a FE R3c ground state Ayyub et al. (1998); Boldyreva et al. (2007); Mani et al. (2015a); Woodward et al. (2005).
Although the R3c and Pnma phases do not occur in bulk PZO at any temperature, their minima are likely to be visited near or above. To see this, we calculate the 0K barrier from Pbam to R3c by the CI-NEB method, which is 57 meV/f.u., and the barrier is 53 mev/f.u. from Pbam to Pnma. Interestingly, the barriers between equivalent Pbam structures is of similar magnitudes, i.e., 51 (or 58) meV/f.u. for reversing (or +S2).
This explains the occurrence of the intermediate phase in a very narrow temperature range, and the sensitive dependence on impurities, domain orientation, etc. Tennery (1965, 1966); Goulpeau (1967); Liu (2018), as it only occurs when the system samples a fraction of the energy minima. It also brings to different possible scenario regarding the possible intermediate structure near the AFE transition temperature (Fig. 3c). For instance, the R3c state is energetically very close to Pbam at 0K, and may even have a free energy near that is slightly lower than Pbam, which would suggest that the R3c state can be the intermediate structure – which is in line with the ferroelectric intermediate phase with rhombohedral symmetry that was observed in some experimental studies Tennery (1965, 1966); Goulpeau (1967); Scott and Burns (1972); Whatmore and Glazer (1979). Moreover, the hopping between the minima of Pbam of opposite oop tiltings has rather lower barrier (51 meV/f.u., see left panel of Fig. 3b), which can imply that the intermediate state is an average state of Pbam symmetry too but that does not possess any time-averaged finite tilting. However, as no orthorhombic intermediate phase has been reported in experiment, this latter Pbam phase probably does not exist. Another possibility for the intermediate state is a more complex case consisting of an average between R3c and some (or all) Pbam equivalent minima, reflecting the possible hoppings between all these states. Note that the difficulty of determining the symmetry of the intermediate phase in experiments may reflect such picture, i.e., PZO dynamically samples multiple local minima near . On the other hand, we do not expect the Pnma state to be (significantely) involved in the intermediate state because its 0K energy is 32 meV/f.u. higher than Pbam.
So far we have demonstrated that deep local minima and the existence of low-barrier energetic paths bypassing the cubic positions are crucial to understand the finite-temperature structures in PZO. Now, we want to add some insight about why the Pbam phase is the ground state of PZO, instead of R3c or Pnma, and suggest other possible intermediate states that are too complex to be treated by direct first-principles techniques. To this end, we developed an effective Hamiltonian for PZO, which includes energy terms involving local modes (proportional to the local electric dipole), local oxygen octahedral tiltings, strain, and the coupling among them (see SM for more details sm ); In particular, the three energy terms related to the couplings between the local dipoles and AFD distortions are given by:
| (1) | ||||
where the sum runs over all the sites (perovskite cell), with and being first nearest neighbors of each other. The three terms are, respectively, the bi-quadratic (only here sm ), tri-linear, and bi-linear coupling between the local mode vector and the pseudo vector characterizing tilting .
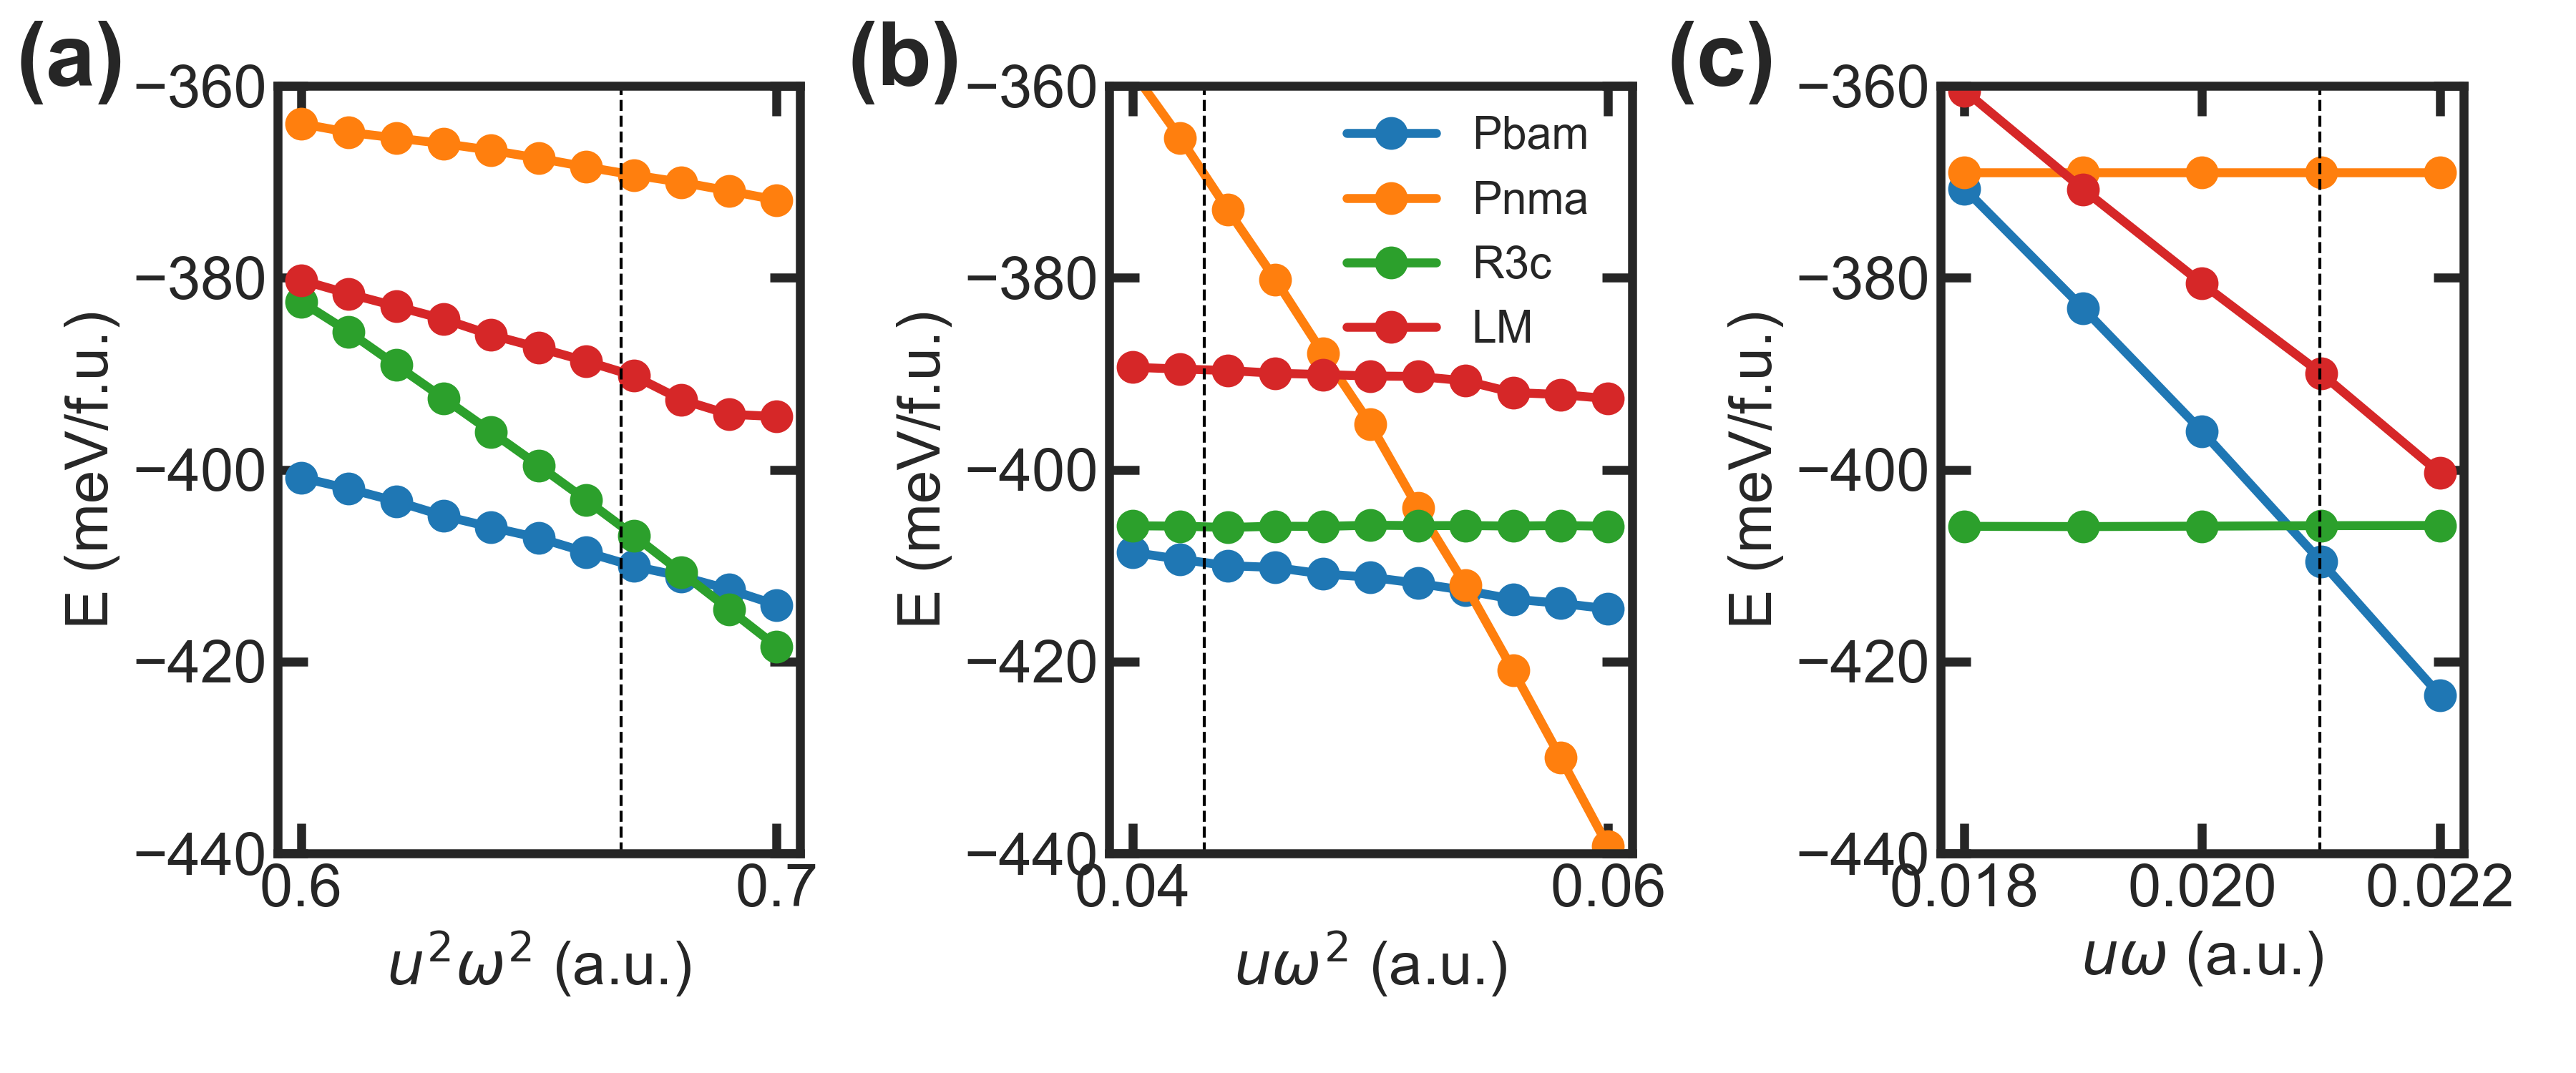
We then carried out Monte Carlo simulations based on the effective Hamiltonian, up to 40,000 MC sweeps at 1 K. We typically adopted a 442 supercell in terms of 5-atom perovskite cells, which can thus accommodate the Pbam, R3c and Pnma structures. With the DFT determined coefficients, as shown by the vertical lines in Fig. 4, the Pbam phase is indeed found to be the ground state, while the R3c and Pnma phases are 4 and 27 meV/f.u. higher in energy, respectively. This is in excellent agreement with direct DFT calculations. We also constructed, relaxed and stabilized a complex structure with a 16162 supercell, which has a long modulation corresponding to not (d). This complex structure is merely 11 meV/f.u. above the Pbam phase, indicating that modulated structures may occur as intermediate phase, which is reminiscent of the incommensurate structure having a similar k-point and experimentally found in PZO under pressure Burkovsky et al. (2017). To see the effect of each type of coupling on structural stability, we individually vary the coefficients (related to -type of coupling), (corresponding to the type of couplings), and (associated with the type of couplings), and calculate the total energies (Fig. 4). It is important to note that each type of coupling has significant influence on one specific phase. For instance, larger magnitude of (or ) favors the R3c (or Pnma) phase, as it is known before in other perovskites Kornev and Bellaiche (2009); Bellaiche and Íñiguez (2013). PZO is especially interesting that the strength of the bi-linear coupling is found to play an important role to render the Pbam phase ground state, as recently proposed by Patel et al. Patel et al. (2016), in particular for perovskites with A-site cations that tend to move off-center, e.g., Pb2+ or Bi3+ with lone-pair electrons. These findings also reveal that the tri-linear coupling that was proposed in Refs. Hlinka et al. (2014); Íñiguez et al. (2014); Prosandeev et al. (2014) to stabilize the Pbam structure may, in fact, not be the main contribution for PZO, as it lowers the energy of Pbam only slightly (Fig. 4b) not (e).
Our calculations therefore, e.g., (i) emphasize the order-disorder character (due to dynamical hopping); (ii) point out the importance of bi-linear couplings between the local dipoles and octahedral tiltings; and (iii) suggest possible complex candidates or phenomena for the intermediate phase of PbZrO3. We thus hope that our findings provide a better understanding of antiferroelectric perovskites, and suggest possible design of new antiferroelectrics having Pbam or related structures, by searching for novel systems with large bi-linear coupling.
Acknowledgements.
We thank J. Íñiguez, B. Dkhil, P.-E. Janolin, R. Burkovsky and J. Hlinka for insightful discussions. B.X. thanks the support of the Air Force Office of Scientific Research under Grant No. FA9550-16-1-0065. L.B. acknowledges the ONR Grant No. N00014-17-1-2818. We also thank the computational support from Arkansas High Performance Computer Center at the University of Arkansas, and Penguin Computing’s On-Demand HPC supported by the Cloud Pilot project.References
- Kittel (1951) C. Kittel, Phys. Rev. 82, 729 (1951).
- Hao (2013) X. Hao, J. Adv. Dielect. 3, 1330001 (2013).
- Rabe (2013) K. M. Rabe, Functional Metal Oxides, edited by S. B. Ogale, T. V. Venkatesan, and M. Blamire, pp. 221-244 (Wiley, New York, 2013).
- Xu et al. (2017) B. Xu, J. Íñiguez, and L. Bellaiche, Nat. Commun. 8, 15682 (2017).
- Sawaguchi et al. (1951) E. Sawaguchi, G. Shirane, and Y. Takagi, J. Phys. Soc. Jpn. 6, 333 (1951).
- Shirane et al. (1951) G. Shirane, E. Sawaguchi, and Y. Takagi, Phys. Rev. 84, 476 (1951).
- Shirane (1952) G. Shirane, Phys. Rev. 86, 219 (1952).
- Tagantsev et al. (2013) A. Tagantsev, K. Vaideeswaran, S. Vakhrushev, A. Filimonov, R. Burkovsky, A. Shaganov, D. Andronikova, A. Rudskoy, A. Baron, H. Uchiyama, et al., Nat. Commun. 4, ncomms3229 (2013).
- Íñiguez et al. (2014) J. Íñiguez, M. Stengel, S. Prosandeev, and L. Bellaiche, Phys. Rev. B 90, 220103 (2014).
- Hlinka et al. (2014) J. Hlinka, T. Ostapchuk, E. Buixaderas, C. Kadlec, P. Kuzel, I. Gregora, J. Kroupa, M. Savinov, A. Klic, J. Drahokoupil, I. Etxebarria, and J. Dec, Phys. Rev. Lett. 112, 197601 (2014).
- Fthenakis and Ponomareva (2017) Z. G. Fthenakis and I. Ponomareva, Phys. Rev. B 96, 184110 (2017).
- Vales-Castro et al. (2018) P. Vales-Castro, K. Roleder, L. Zhao, J.-F. Li, D. Kajewski, and G. Catalan, Appl. Phys. Lett. 113, 132903 (2018).
- Ostapchuk et al. (2001) T. Ostapchuk, J. Petzelt, V. Zelezny, S. Kamba, V. Bovtun, V. Porokhonskyy, A. Pashkin, P. Kuzel, M. Glinchuk, I. Bykov, et al., J. Phys. Condens. Matter 13, 2677 (2001).
- Ko et al. (2013) J.-H. Ko, M. Górny, A. Majchrowski, K. Roleder, and A. Bussmann-Holder, Phys. Rev. B 87, 184110 (2013).
- Paściak et al. (2015) M. Paściak, T. Welberry, A. Heerdegen, V. Laguta, T. Ostapchuk, S. Leoni, and J. Hlinka, Phase Transitions 88, 273 (2015).
- Zhang et al. (2015) N. Zhang, M. Paściak, A. M. Glazer, J. Hlinka, M. Gutmann, H. A. Sparkes, T. R. Welberry, A. Majchrowski, K. Roleder, Y. Xie, and Z.-G. Ye, J. Appl. Crystallogr. 48, 1637 (2015).
- Klarbring and Simak (2018) J. Klarbring and S. I. Simak, Phys. Rev. B 97, 024108 (2018).
- Klarbring (2019) J. Klarbring, Phys. Rev. B 99, 104105 (2019).
- Reyes-Lillo and Rabe (2013) S. E. Reyes-Lillo and K. M. Rabe, Phys. Rev. B 88, 180102 (2013).
- Patel et al. (2016) K. Patel, S. Prosandeev, Y. Yang, B. Xu, J. Íñiguez, and L. Bellaiche, Phys. Rev. B 94, 054107 (2016).
- Tennery (1965) V. J. Tennery, J. Electrochem. Soc. 112, 1117 (1965).
- Tennery (1966) V. J. Tennery, J. Am. Ceram. Soc. 49, 483 (1966).
- Goulpeau (1967) L. Goulpeau, Sov. Phys.-Solid State 8, 1970 (1967).
- Fujishita (1992) H. Fujishita, J. Phys. Soc. Jpn. 61, 3606 (1992).
- Liu (2018) H. Liu, J. Am. Ceram. Soc. 101, 5281 (2018).
- Kresse and Joubert (1999) G. Kresse and D. Joubert, Phys. Rev. B 59, 1758 (1999).
- Hellman et al. (2011) O. Hellman, I. A. Abrikosov, and S. I. Simak, Phys. Rev. B 84, 180301 (2011).
- Hellman and Abrikosov (2013) O. Hellman and I. A. Abrikosov, Phys. Rev. B 88, 144301 (2013).
- Hellman et al. (2013) O. Hellman, P. Steneteg, I. A. Abrikosov, and S. I. Simak, Phys. Rev. B 87, 104111 (2013).
- Henkelman et al. (2000) G. Henkelman, B. P. Uberuaga, and H. Jónsson, J. Chem. Phys. 113, 9901 (2000).
- (31) See Supplemental Material for (1) details of the computational methods; (2) comparison of the effect of MD and stochastic sampling on the phonon dispersion; (3) Additional analysis from MD simulations, which includes Refs. Kresse and Joubert (1999); Perdew et al. (2008); Faye (2014); Hellman et al. (2011); Hellman and Abrikosov (2013); Hellman et al. (2013); Togo and Tanaka (2015); Zhong et al. (1994, 1995); Kornev et al. (2006); Mani et al. (2015b, a); Fthenakis and Ponomareva (2017).
- Ghosez et al. (1999) P. Ghosez, E. Cockayne, U. V. Waghmare, and K. M. Rabe, Phys. Rev. B 60, 836 (1999).
- Cockayne and Rabe (2000) E. Cockayne and K. Rabe, J. Phys. Chem. Solids 61, 305 (2000).
- Leung et al. (2002) K. Leung, E. Cockayne, and A. F. Wright, Phys. Rev. B 65, 214111 (2002).
- Leung (2003) K. Leung, Phys. Rev. B 67, 104108 (2003).
- not (a) Below 450 K, if the initial atomic positions are Pbam, the structure remains Pbam; whereas if we start with cubic positions, the average atomic positions deviate to a R3c symmetry.
- Samara (1970) G. A. Samara, Phys. Rev. B 1, 3777 (1970).
- Whatmore and Glazer (1979) R. Whatmore and A. Glazer, J. Phys. C: Solid State Phys. 12, 1505 (1979).
- Fujishita et al. (2003) H. Fujishita, Y. Ishikawa, S. Tanaka, A. Ogawaguchi, and S. Katano, J. Phys. Soc. Jpn. 72, 1426 (2003).
- not (b) phonon dispersion calculated based on the stochastic sampling at high temperature has soft phonons, which resembles the DFPT phonon at 0 K (see Supplemental Materials).
- Orobengoa et al. (2009) D. Orobengoa, C. Capillas, M. I. Aroyo, and J. M. Perez-Mato, J. Appl. Crystallogr. 42, 820 (2009).
- Perez-Mato et al. (2010) J. Perez-Mato, D. Orobengoa, and M. Aroyo, Acta Cryst. A 66, 558 (2010).
- not (c) For all the PES calculations, the same cubic cell is adopted, while the atomic distortions of the , , and structures are incorporated. The effect caused by the difference in lattice parameters should be secondary. In addition, minor distortions in Pbam, i.e., , , and modes, are not considered here because of their much smaller amplitude. These factors give rise to an energy being 12.7 meV/f.u. higher in the minima of PES than that of the fully relaxed Pbam phase.
- Ayyub et al. (1998) P. Ayyub, S. Chattopadhyay, R. Pinto, and M. S. Multani, Phys. Rev. B 57, R5559 (1998).
- Boldyreva et al. (2007) K. Boldyreva, L. Pintilie, A. Lotnyk, I. B. Misirlioglu, M. Alexe, and D. Hesse, Appl. Phys. Lett. 91, 122915 (2007).
- Mani et al. (2015a) B. K. Mani, C.-M. Chang, S. Lisenkov, and I. Ponomareva, Phys. Rev. Lett. 115, 097601 (2015a).
- Woodward et al. (2005) D. I. Woodward, J. Knudsen, and I. M. Reaney, Phys. Rev. B 72, 104110 (2005).
- Scott and Burns (1972) B. Scott and G. Burns, J. Am. Ceram. Soc. 55, 331 (1972).
- not (d) To use this effective Hamiltonian in order to simulate finite-temperature properties, a potential issue needs to be solved first, that is unphysical AFD patterns corresponding to the -point or due to the bi-linear coupling should be avoided.
- Burkovsky et al. (2017) R. Burkovsky, I. Bronwald, D. Andronikova, B. Wehinger, M. Krisch, J. Jacobs, D. Gambetti, K. Roleder, A. Majchrowski, A. Filimonov, et al., Sci. Rep. 7, 41512 (2017).
- Kornev and Bellaiche (2009) I. A. Kornev and L. Bellaiche, Phys. Rev. B 79, 100105 (2009).
- Bellaiche and Íñiguez (2013) L. Bellaiche and J. Íñiguez, Phys. Rev. B 88, 014104 (2013).
- Prosandeev et al. (2014) S. Prosandeev, C. Xu, R. Faye, W. Duan, H. Liu, B. Dkhil, P.-E. Janolin, J. Íñiguez, and L. Bellaiche, Phys. Rev. B 89, 214111 (2014).
- not (e) Note that such result is consistent with the aforementioned small amplitude of the S2 mode found by DFT calculations in the ground state of PZO, emphasizing that the tri-linear coupling involving the , , and S2 modes is relatively small.
- Perdew et al. (2008) J. P. Perdew, A. Ruzsinszky, G. I. Csonka, O. A. Vydrov, G. E. Scuseria, L. A. Constantin, X. Zhou, and K. Burke, Phys. Rev. Lett. 100, 136406 (2008).
- Faye (2014) R. Faye, Structures et propriétés d’un antiferroélectrique modèle, Ph.D. thesis, Ecole centrale de Paris (2014).
- Togo and Tanaka (2015) A. Togo and I. Tanaka, Scr. Mater. 108, 1 (2015).
- Zhong et al. (1994) W. Zhong, D. Vanderbilt, and K. M. Rabe, Phys. Rev. Lett. 73, 1861 (1994).
- Zhong et al. (1995) W. Zhong, D. Vanderbilt, and K. M. Rabe, Phys. Rev. B 52, 6301 (1995).
- Kornev et al. (2006) I. A. Kornev, L. Bellaiche, P.-E. Janolin, B. Dkhil, and E. Suard, Phys. Rev. Lett. 97, 157601 (2006).
- Mani et al. (2015b) B. K. Mani, S. Lisenkov, and I. Ponomareva, Phys. Rev. B 91, 134112 (2015b).