Pressure-temperature phase diagram of EuRbFe4As4 superconductor
Abstract
The pressure dependencies of the magnetic and superconducting transitions, as well as that of the superconducting upper critical field are reported for single crystalline EuRbFe4As4. Resistance measurements were performed under hydrostatic pressures up to 6.21 GPa and in magnetic fields up to 9 T. Zero-field-cool magnetization measurements were performed under hydrostatic pressures up to 1.24 GPa under 20 mT applied field. Superconducting transition temperature, , up to 6.21 GPa and magnetic transition temperature, , up to 1.24 GPa were obtained and a pressure-temperature phase diagram was constructed. Our results show that is monotonically suppressed upon increasing pressure. is linearly increased up to 1.24 GPa. For the studied pressure range, no signs of the crossing of and lines are observed. The normalized slope of the superconducting upper critical field is gradually suppressed with increasing pressure, which may be due to the continuous change of Fermi-velocity with pressure.
I Introduction
New members of the Fe-based superconductors (FeSC) family, Fe4As4 (=Ca, Sr; =K, Rb, Cs), the so-called 1144-compounds were discovered by Iyo in 2016Iyo et al. (2016). Different from a homogeneous, random substitution, as in ()Fe2As2 where share the same crystallographic site and retains the parent-compound symmetry , these new members crystallize into structural type where and have their own unique crystallographic sites and form alternating layers along the axisIyo et al. (2016); Kawashima et al. (2016). Since discovery, the 1144-compounds have received significant attention because these stoichiometric compounds offer new, clean platforms for the study of, among other things, the relation between superconductivity and possible long-range magnetic order in the FeSC. Moreover, a new type of magnetic order, spin-vortex-crystal-order, has been realized in Co- and Ni-substituted CaKFe4As4, which was argued to be strongly related to its structureMeier et al. (2018).
Among the new 1144 compounds, the Eu(Rb,Cs)Fe4As4 compounds have been studied intensively due to the possible coexistence of superconductivity and ferromagnetism Kawashima et al. (2016); Liu et al. (2016); Bao et al. (2018); Smylie et al. (2018); Stolyarov et al. (2018); Albedah et al. (2018); Stolyarov et al. (2018). Polycrystalline Eu(Rb,Cs)Fe4As4 compounds were first discovered in 2016 and were shown to be superconductors with 35 K and a magnetic transition temperature 15 KKawashima et al. (2016). Different from the undoped EuFe2As2 where Eu2+ orders antiferromagneticallyRen et al. (2008); Jeevan et al. (2008); Jiang et al. (2009a), the magnetic transition in RbEuFe4As4 is suggested to be ferromagnetic which is associated with the ordering of the Eu2+ moments perpendicular to the crystallographic axisLiu et al. (2016); Albedah et al. (2018). Though the exact magnetic structure of EuRbFe4As4 has not been established so far, the possible coexistence of superconductivity and ferromagnetism makes EuRbFe4As4 one of the systems where the relation between these states may be studiedFertig et al. (1977); Ishikawa and Fischer (1977); Canfield et al. (1996); Saxena et al. (2000); Aoki et al. (2001); Pfleiderer et al. (2001); Huy et al. (2007); Jiang et al. (2009b); Nowik et al. (2011); Jiao et al. (2011, 2013); Jin et al. (2013, 2015).
Two substitution studies on polycrystalline EuRbFe4As4 were published. On one hand, Ni-substitution on the Fe-site suppresses whereas is almost unchangedLiu et al. (2017). On the other hand, substitution of non-magnetic Ca on the Eu-site suppresses while is almost unchangedKawashima et al. (2018). Both of these results suggest that superconductivity and ferromagnetism are almost indenpendent of each other in this system. An optical investigation on single crystalline EuRbFe4As4 suggests weak interaction between superconductivity and ferromagnetism and that superconductivity is affected by the in-plane ferromagnetism mainly at domain boundariesStolyarov et al. (2018).
Pressure, as another commonly used tuning parameter, is considered less perturbing than substitution because it does not introduce chemical disorder into the system. A high pressure study up to 30 GPa on polycrystalline Eu(Rb,Cs)Fe4As4 shows that for both compositions, upon increasing pressure, is suppressed while is enhanced and they cross near 7 GPaJackson et al. (2018). In addition, half-collapsed-tetragonal (hcT) phase transition, similar to the one observed in the CaKFe4As4 seriesKaluarachchi et al. (2017); Xiang et al. (2018), is suggested to take place at 10 GPa for EuRbFe4As4 and 12 GPa for EuCsFe4As4, respectivelyJackson et al. (2018), which is roughly consistent with theoretical calculationsBorisov et al. (2018). In this high-pressure study, signatures of transitions are broad and zero resistance was never achieved below due, most likely, to the use of polycrystalline samples.
In this work, we present a pressure study on single crystalline EuRbFe4As4 up to 6.21 GPa. From resistance measurements up to 6.21 GPa and magnetization measurements up to 1.24 GPa, and are tracked and presented in a pressure-temperature () phase diagram. Our results show that is monotonically suppressed and is linearly increased. Further superconducting upper critical field analysis indicates no qualitative change of Fermi surface within the studied pressure range.
II Experimental details
High-quality single crystals of EuRbFe4As4 with sharp superconducting transitions at ambient pressure (see Figs. 1 (c) (d) and Fig. 5 (b) below) were grown as described in Ref. Bao et al., 2018. The -in-plane ac resistance measurements under pressure were performed in a Quantum Design Physical Property Measurement System (PPMS) using a 1 mA excitation with frequency of 17 Hz, on cooling rate of 0.25 K/min. A standard, linear four-contact configuration was used. Contacts were made by soldering 25 m Pt wires to the samples using a Sn:Pb-60:40 alloy. The magnetic field was applied along the axis. A modified Bridgman Anvil Cell (mBAC)Colombier and Braithwaite (2007) was used to apply pressure up to 6.21 GPa. Pressure values at low temperature were inferred from the of leadBireckoven and Wittig (1988). Hydrostatic conditions were achieved by using a 1:1 mixture of iso-pentane:n-pentane as the pressure medium for the mBAC, which solidifies at 6.5 GPa at room temperatureTorikachvili et al. (2015). Low-field (20 mT) dc magnetization measurements under pressure were performed in a Quantum Design Magnetic Property Measurement System (MPMS-3) SQUID magnetometer. A commercially-available HDM Be-Cu piston-cylinder pressure cellHDM was used to apply pressures up to 1.24 GPa. Daphne oil 7373 was used as a pressure medium, which solidifies at ∼2.2 GPa at room temperatureYokogawa et al. (2007), ensuring hydrostatic conditions. Superconducting Sn was used as a low-temperature pressure gaugeEiling and Schilling (1981). Two samples, 1 and 2, were used for separate resistivity runs in the mBAC whereas the sample used for the magnetization data was sample 3.
III Results and discussions
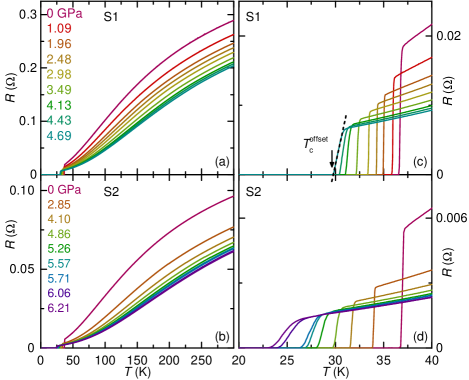
Figures 1 (a) and (b) present the pressure dependence of the temperature-dependent resistance for EuRbFe4As4. Two samples, sample #1 and sample #2, were measured in the mBAC for pressures up to 4.69 GPa or 6.21 GPa. For both samples, resistance decreases upon increasing pressure. At ambient pressure for 35 K, a superconducting transition was observed and zero resistance was achieved for both samples. Below , no features associated with the magnetic transition are observed in the curves down to 1.8 K. Figs. 1 (c) and (d) show blowups of the low-temperature resistance. For both samples, the superconducting transition at ambient pressure is very sharp, demonstrating good homogeneity of the single crystals. As shown in the figures, upon increasing pressure, monotonically decreases in the studied pressure range. A gradually broadening of the superconducting transition was also observed in both samples. Similar behavior has been observed in many other superconductors that are measured in the mBAC cell and is likely due to the pressure inhomogeneity when high loads are applied.
To better visualize the pressure evolution of resistance, we present in Fig. 2 the pressure dependent resistance at fixed temperatures. As shown in the figure, different from the CaKFe4As4 seriesKaluarachchi et al. (2017); Xiang et al. (2018), resistance of EuRbFe4As4 at various temperatures shows a smooth decrease as a function of pressure without any obvious anomalies. This implies the absence of structural transition up to 6.21 GPa, which is consistent with the results in Ref. Jackson et al., 2018 and predictions in Ref. Borisov et al., 2018 where the hcT phase transtion is suggested to take place at 10 GPa. The total suppression of resistance at 40 K under pressure, up to 4 GPa and up to 6.21 GPa, is rather large compared with the CaKFe4As4 series, where the suppression at 40 K is - up to 4 GPa, i.e., before hcT happensKaluarachchi et al. (2017); Xiang et al. (2018). Another indication that a potential hcT phase transition has not been reached is the fact that the superconducting transitions shown in Figs. 1 and 3 remain robust over our pressure range. Both CaKFe4As4 seriesKaluarachchi et al. (2017); Xiang et al. (2018) as well as Co-substituted CaFe2As2Ran et al. (2012); Gati et al. (2012) show loss of bulk superconductivity at the collapsed-tetragonal or lowest hcT transitions.
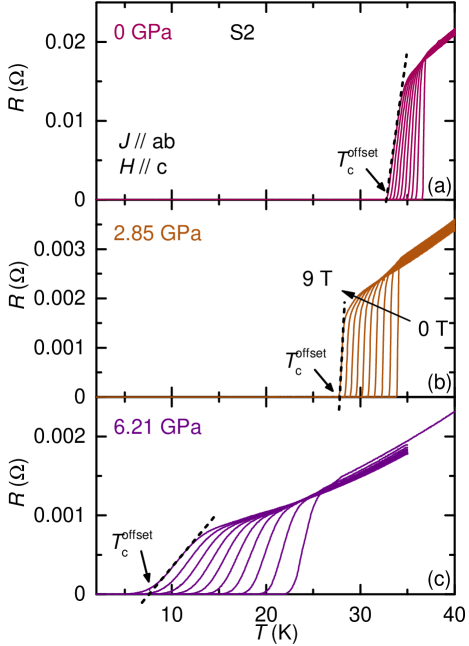
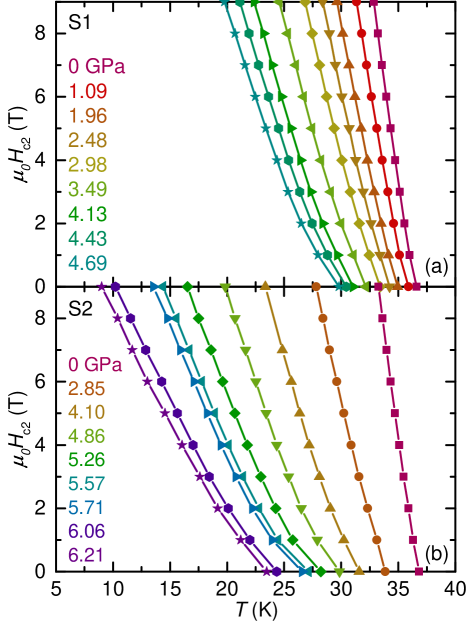
Temperature dependent resistance under magnetic fields up to 9 T applied along the -axis was studied and the results are presented in Fig. 3 for selected pressures for sample #2. As shown in the figure, below , no features associated with the magnetic transition are observed and zero resistance persists down to 1.8 K with fields up to 9 T under all pressures. For temperatures above the superconducting transition, a decrease of resistance under applied magnetic field is observed. The upper superconducting critical field, , can be obtained from Fig. 3 using the offset criteria defined in Figs. 1-3. The temperature dependence of at various pressures for sample #1 and sample #2 is presented in Fig. 4. For both samples, is systematically suppressed by increasing pressure. is linear in temperature except for magnetic fields below 2 T, the bending of curves are more obvious at higher pressures. The curvature at low fields has been observed in other FeSCColombier et al. (2009, 2010); Kaluarachchi et al. (2016); Xiang et al. (2017, 2018) and can be explained by the multi-bands nature of superconductivityKogan and Prozorov (2012), which is likely the case of EuRbFe4As4Stolyarov et al. (2018).
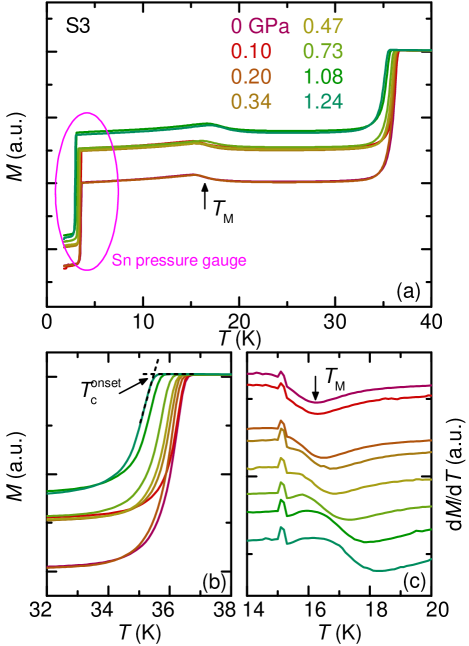
To study the evolution of the magnetic transition with pressure, we present, in Fig. 5, the dependence of the zero-field-cool magnetization data. During the measurements, pressure was increased up to 1.24 GPa under 20 mT applied magnetic field. As shown in Fig. 5 (a), the superconducting transition of EuRbFe4As4 is recognized as onset of diamagnetism at 35 K. Another kink-like anomaly is observed at 16 K. We associated this anomaly with the magnetic transition . Pressure values at low temperature were inferred from the superconducting transition of Sn which also shown up in the data set at 3.7 K, i.e., way below and of EuRbFe4As4 (as indicated inside the pink circle in the figure). Fig. 5 (b) shows the blowup of the superconducting transition region of EuRbFe4As4, demonstrating that is suppressed as pressure is increased. To determine the magnetic transition temperature , temperature derivative of the magnetization, , was calculated and presented in Fig. 5 (c). The temperature corresponding to the minimum in was taken as , as indicated in the figure. It is clearly seen that is increased upon increasing pressure.
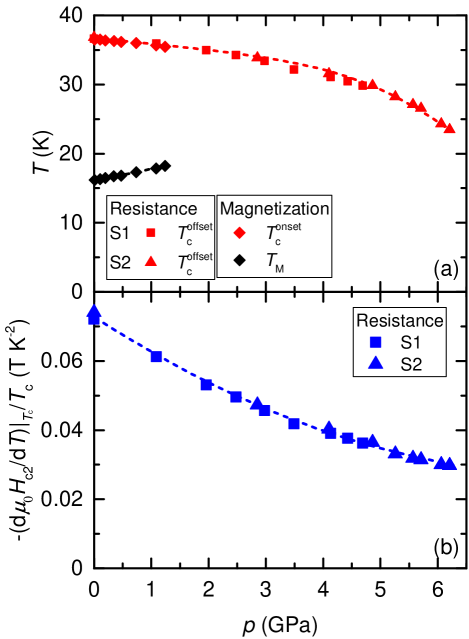
We summarize the and values inferred from both resistance and magnetization measurements in the pressure-temperature () phase diagram shown in Fig. 6 (a). To be consistent, determined from resistance measurements (Fig. 1 (c)) and determined from magnetization measurements (Fig. 5 (b)) were used and they match with each very well. As shown in Fig. 6 (a), of EuRbFe4As4 is monotonically suppressed upon increasing pressure up to 6.21 GPa. Starting with 36.6 K at ambient pressure, is suppressed to 23.5 K at 6.21 GPa. In terms of magnetic transition , it is linearly increased from 16.2 K at ambient pressure to 18.2 K at 1.24 GPa, with the rate of = 1.64 K/GPa. To better understand the superconducting properties of EuRbFe4As4, we further analyze the superconducting upper critical fieldTaufour et al. (2014); Kaluarachchi et al. (2016); Xiang et al. (2017, 2018). Generally speaking, the slope of the upper critical field normalized by , is related to the Fermi velocity and superconducting gap of the systemKogan and Prozorov (2012). In the clean limit, for a single-band,
| (1) |
where is the Fermi velocity. Even though the superconductivity in EuRbFe4As4 compounds is likely to be multiband, Eq. 1 can give qualitative insight into changes induced by pressure. As shown in Fig. 6 (b), the normalized slope of the upper critical field (the slope is obtained by linearly fitting the data above 2 T in Fig. 4) is gradually suppressed by a factor of 2.5 upon increasing pressure up to 6.21 GPa. No features in the normalized slope that could be associated with band structure change or Lifshitz transition, like the cases in many other Fe-based superconductorsTaufour et al. (2014); Kaluarachchi et al. (2016); Xiang et al. (2017, 2018), are observed over the studied pressure range. Furthermore, the curve at 40 K (Fig. 2 (b)), a temperature that is close to but still above and , implies that resistivity is suppressed by a factor of 2.7 as well. In a simple argumentKasap (2006),
| (2) |
where is density of states at the Fermi level and is the scattering time of these Fermi electrons. Eq. 1 and 2, combined together, suggest that the decrease of both resistivity and with pressure can be explained by pressure induced increase of the Fermi velocity.
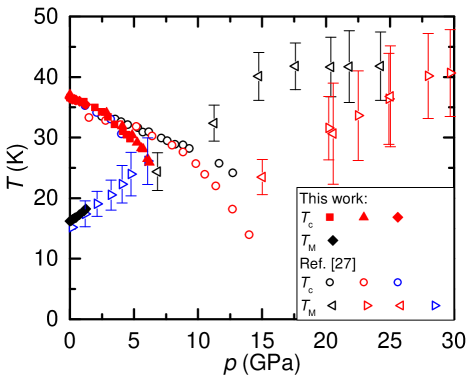
Data from this study, on single crystalline samples, and from the study on polycrystalline samples in Ref. Jackson et al., 2018 are plotted together and presented in the combined phase diagram in Fig. 7. As shown in the figure, from this study (determined by the offset of the transition via resistance measurement or onset of diamagnetism) matches very well with the determined by the onset of diamagnetism in Ref. Jackson et al., 2018. data also match with each other over the studied pressure range.
The extrapolation of our line in Fig. 6(a) as well as the data in Fig. 7 suggest that and should cross near 6 GPa. On one hand, the suppression of with pressure gets stronger when pressure is increased, which might be related to the fact that and are getting closer at higher pressures. On the other hand, neither our pressure dependent nor data show any clear signature potentially associated with and crossing. Either they cross at a pressure higher than 6.21 GPa or their crossing does not have qualitative effect on or .
IV Conclusion
In conclusion, the resistance and magnetization of single crystalline EuRbFe4As4 has been studied under pressure. In-plane resistance measurements under pressure up to 6.21 GPa reveal that superconducting transition is monotonically suppressed. Magnetization measurements under pressure up to 1.24 GPa reveal that magnetic transition is linearly increased. No indications of half-collapsed-tetragonal phase transition is observed up to 6.21 GPa. Further upper critical field analysis shows that the normalized slope, , is continuously suppressed upon increasing pressure up to 6.21 GPa, which is likely due to the continuous change of the Fermi velocity with pressure. Our results suggest that the magnetism of Eu sub-lattice does not have significant influence on the superconducting behavior of FeAs layer in EuRbFe4As4.
Acknowledgements.
We would like to thank U. Welp and V. G. Kogan for some preliminary results and useful discussions. This work is supported by the US DOE, Basic Energy Sciences, Materials Science and Engineering Division under contract No. DE-AC02-07CH11358. L. X. was supported, in part, by the W. M. Keck Foundation. The synthesis and crystal growth were performed at Argonne National Laboratory which is supported by the U.S. Department of Energy, Office of Science, Basic Energy Sciences under Contract No. DE-AC02-06CH11357.References
- Iyo et al. (2016) A. Iyo, K. Kawashima, T. Kinjo, T. Nishio, S. Ishida, H. Fujihisa, Y. Gotoh, K. Kihou, H. Eisaki, and Y. Yoshida, Journal of the American Chemical Society 138, 3410 (2016).
- Kawashima et al. (2016) K. Kawashima, T. Kinjo, T. Nishio, S. Ishida, H. Fujihisa, Y. Gotoh, K. Kihou, H. Eisaki, Y. Yoshida, and A. Iyo, J. Phys. Soc. Jpn. 85, 064710 (2016).
- Meier et al. (2018) W. R. Meier, Q.-P. Ding, A. Kreyssig, S. L. Bud‘ko, A. Sapkota, K. Kothapalli, V. Borisov, R. Valentí, C. D. Batista, P. P. Orth, R. M. Fernandes, A. I. Goldman, Y. Furukawa, A. E. Böhmer, and P. C. Canfield, npj Quantum Materials 3, 5 (2018).
- Liu et al. (2016) Y. Liu, Y.-B. Liu, Z.-T. Tang, H. Jiang, Z.-C. Wang, A. Ablimit, W.-H. Jiao, Q. Tao, C.-M. Feng, Z.-A. Xu, and G.-H. Cao, Phys. Rev. B 93, 214503 (2016).
- Bao et al. (2018) J.-K. Bao, K. Willa, M. P. Smylie, H. Chen, U. Welp, D. Y. Chung, and M. G. Kanatzidis, Crystal Growth & Design 18, 3517 (2018).
- Smylie et al. (2018) M. P. Smylie, K. Willa, J.-K. Bao, K. Ryan, Z. Islam, H. Claus, Y. Simsek, Z. Diao, A. Rydh, A. E. Koshelev, W.-K. Kwok, D. Y. Chung, M. G. Kanatzidis, and U. Welp, Phys. Rev. B 98, 104503 (2018).
- Stolyarov et al. (2018) V. S. Stolyarov, A. Casano, M. A. Belyanchikov, A. S. Astrakhantseva, S. Y. Grebenchuk, D. S. Baranov, I. A. Golovchanskiy, I. Voloshenko, E. S. Zhukova, B. P. Gorshunov, A. V. Muratov, V. V. Dremov, L. Y. Vinnikov, D. Roditchev, Y. Liu, G.-H. Cao, M. Dressel, and E. Uykur, Phys. Rev. B 98, 140506 (2018).
- Albedah et al. (2018) M. A. Albedah, F. Nejadsattari, Z. M. Stadnik, Y. Liu, and G.-H. Cao, Phys. Rev. B 97, 144426 (2018).
- Ren et al. (2008) Z. A. Ren, G. C. Che, X. L. Dong, J. Yang, W. Lu, W. Yi, X. L. Shen, Z. C. Li, L. L. Sun, F. Zhou, and Z. X. Zhao, EPL (Europhysics Letters) 83, 17002 (2008).
- Jeevan et al. (2008) H. S. Jeevan, Z. Hossain, D. Kasinathan, H. Rosner, C. Geibel, and P. Gegenwart, Phys. Rev. B 78, 052502 (2008).
- Jiang et al. (2009a) S. Jiang, Y. Luo, Z. Ren, Z. Zhu, C. Wang, X. Xu, Q. Tao, G. Cao, and Z. Xu, New Journal of Physics 11, 025007 (2009a).
- Fertig et al. (1977) W. A. Fertig, D. C. Johnston, L. E. DeLong, R. W. McCallum, M. B. Maple, and B. T. Matthias, Phys. Rev. Lett. 38, 987 (1977).
- Ishikawa and Fischer (1977) M. Ishikawa and . Fischer, Solid State Communications 23, 37 (1977).
- Canfield et al. (1996) P. C. Canfield, S. L. Bud’ko, and B. K. Cho, Physica C: Superconductivity 262, 249 (1996).
- Saxena et al. (2000) S. S. Saxena, P. Agarwal, K. Ahilan, F. M. Grosche, R. K. W. Haselwimmer, M. J. Steiner, E. Pugh, I. R. Walker, S. R. Julian, P. Monthoux, G. G. Lonzarich, A. Huxley, I. Sheikin, D. Braithwaite, and J. Flouquet, Nature 406, 587 (2000).
- Aoki et al. (2001) D. Aoki, A. Huxley, E. Ressouche, D. Braithwaite, J. Flouquet, J.-P. Brison, E. Lhotel, and C. Paulsen, Nature 413, 613 (2001).
- Pfleiderer et al. (2001) C. Pfleiderer, M. Uhlarz, S. M. Hayden, R. Vollmer, H. v. Löhneysen, N. R. Bernhoeft, and G. G. Lonzarich, Nature 412, 58 (2001).
- Huy et al. (2007) N. T. Huy, A. Gasparini, D. E. de Nijs, Y. Huang, J. C. P. Klaasse, T. Gortenmulder, A. de Visser, A. Hamann, T. Görlach, and H. v. Löhneysen, Phys. Rev. Lett. 99, 067006 (2007).
- Jiang et al. (2009b) S. Jiang, H. Xing, G. Xuan, Z. Ren, C. Wang, Z.-a. Xu, and G. Cao, Phys. Rev. B 80, 184514 (2009b).
- Nowik et al. (2011) I. Nowik, I. Felner, Z. Ren, G. H. Cao, and Z. A. Xu, Journal of Physics: Condensed Matter 23, 065701 (2011).
- Jiao et al. (2011) W.-H. Jiao, Q. Tao, J.-K. Bao, Y.-L. Sun, C.-M. Feng, Z.-A. Xu, I. Nowik, I. Felner, and G.-H. Cao, EPL (Europhysics Letters) 95, 67007 (2011).
- Jiao et al. (2013) W.-H. Jiao, H.-F. Zhai, J.-K. Bao, Y.-K. Luo, Q. Tao, C.-M. Feng, Z.-A. Xu, and G.-H. Cao, New Journal of Physics 15, 113002 (2013).
- Jin et al. (2013) W. T. Jin, S. Nandi, Y. Xiao, Y. Su, O. Zaharko, Z. Guguchia, Z. Bukowski, S. Price, W. H. Jiao, G. H. Cao, and T. Brückel, Phys. Rev. B 88, 214516 (2013).
- Jin et al. (2015) W. T. Jin, W. Li, Y. Su, S. Nandi, Y. Xiao, W. H. Jiao, M. Meven, A. P. Sazonov, E. Feng, Y. Chen, C. S. Ting, G. H. Cao, and T. Brückel, Phys. Rev. B 91, 064506 (2015).
- Liu et al. (2017) Y. Liu, Y.-B. Liu, Y.-L. Yu, Q. Tao, C.-M. Feng, and G.-H. Cao, Phys. Rev. B 96, 224510 (2017).
- Kawashima et al. (2018) K. Kawashima, S. Ishida, K. Oka, H. Kito, N. Takeshita, H. Fujihisa, Y. Gotoh, K. Kihou, H. Eisaki, Y. Yoshida, and A. Iyo, Journal of Physics: Conference Series 969, 012027 (2018).
- Jackson et al. (2018) D. E. Jackson, D. VanGennep, W. Bi, D. Zhang, P. Materne, Y. Liu, G.-H. Cao, S. T. Weir, Y. K. Vohra, and J. J. Hamlin, Phys. Rev. B 98, 014518 (2018).
- Kaluarachchi et al. (2017) U. S. Kaluarachchi, V. Taufour, A. Sapkota, V. Borisov, T. Kong, W. R. Meier, K. Kothapalli, B. G. Ueland, A. Kreyssig, R. Valentí, R. J. McQueeney, A. I. Goldman, S. L. Bud’ko, and P. C. Canfield, Phys. Rev. B 96, 140501 (2017).
- Xiang et al. (2018) L. Xiang, W. R. Meier, M. Xu, U. S. Kaluarachchi, S. L. Bud’ko, and P. C. Canfield, Phys. Rev. B 97, 174517 (2018).
- Borisov et al. (2018) V. Borisov, P. C. Canfield, and R. Valentí, Phys. Rev. B 98, 064104 (2018).
- Colombier and Braithwaite (2007) E. Colombier and D. Braithwaite, Review of Scientific Instruments 78, 093903 (2007).
- Bireckoven and Wittig (1988) B. Bireckoven and J. Wittig, Journal of Physics E: Scientific Instruments 21, 841 (1988).
- Torikachvili et al. (2015) M. S. Torikachvili, S. K. Kim, E. Colombier, S. L. Bud’ko, and P. C. Canfield, Rev. Sci. Instrum. 86, 123904 (2015).
- (34) https://www.qdusa.com/sitedocs/productBrochures/High_Pressure_Cell_for_Magnetometry_Brochure.pdf.
- Yokogawa et al. (2007) K. Yokogawa, K. Murata, H. Yoshino, and S. Aoyama, Japanese Journal of Applied Physics 46, 3636 (2007).
- Eiling and Schilling (1981) A. Eiling and J. S. Schilling, Journal of Physics F: Metal Physics 11, 623 (1981).
- Ran et al. (2012) S. Ran, S. L. Bud’ko, W. E. Straszheim, J. Soh, M. G. Kim, A. Kreyssig, A. I. Goldman, and P. C. Canfield, Phys. Rev. B 85, 224528 (2012).
- Gati et al. (2012) E. Gati, S. Köhler, D. Guterding, B. Wolf, S. Knöner, S. Ran, S. L. Bud’ko, P. C. Canfield, and M. Lang, Phys. Rev. B 86, 220511 (2012).
- Colombier et al. (2009) E. Colombier, S. L. Bud’ko, N. Ni, and P. C. Canfield, Phys. Rev. B 79, 224518 (2009).
- Colombier et al. (2010) E. Colombier, M. S. Torikachvili, N. Ni, A. Thaler, S. L. Bud’ko, and P. C. Canfield, Superconductor Science and Technology 23, 054003 (2010).
- Kaluarachchi et al. (2016) U. S. Kaluarachchi, V. Taufour, A. E. Böhmer, M. A. Tanatar, S. L. Bud’ko, V. G. Kogan, R. Prozorov, and P. C. Canfield, Phys. Rev. B 93, 064503 (2016).
- Xiang et al. (2017) L. Xiang, U. S. Kaluarachchi, A. E. Böhmer, V. Taufour, M. A. Tanatar, R. Prozorov, S. L. Bud’ko, and P. C. Canfield, Phys. Rev. B 96, 024511 (2017).
- Kogan and Prozorov (2012) V. G. Kogan and R. Prozorov, Rep. Prog. Phys. 75, 114502 (2012).
- Taufour et al. (2014) V. Taufour, N. Foroozani, M. A. Tanatar, J. Lim, U. Kaluarachchi, S. K. Kim, Y. Liu, T. A. Lograsso, V. G. Kogan, R. Prozorov, S. L. Bud’ko, J. S. Schilling, and P. C. Canfield, Phys. Rev. B 89, 220509 (2014).
- Kasap (2006) S. Kasap, Principles of Electronic Materials and Devices, 3rd ed. (McGraw-Hill, Inc., New York, NY, USA, 2006).