A broad HCO+ absorption line associated with the circumnuclear torus of NGC 1052
Abstract
We present the first subparsec-scale maps of HCO+ 1–0 absorption in the circumnuclear region of the nearby radio galaxy NGC 1052. Our 3mm VLBI observations with the Korean VLBI Network have spatially resolved the broad HCO+ absorption at a velocity range of 1350–1850 km s-1 against a double-sided nuclear jet, and have revealed that the HCO+ absorption is concentrated on the receding jet and the nuclear components. The distribution of the HCO+ absorbing gas strongly supports the circumnuclear torus surrounding the supermassive black hole. From the estimations of the column density and the volume density of molecular hydrogen, the size of the molecular gas region in the torus is at least 1 pc. The broad spectral profile of HCO+ is likely to be a blend of multiple gas clumps with various velocities. The HCO+ absorption of NGC 1052 could trace complex kinematics in the vicinity of the active galactic nucleus, such as inflow, outflow, turbulence, and so on.
1 Introduction
NGC 1052 is a nearby radio galaxy with a systemic velocity () of 1507 km s-1 (Jensen et al., 2003). It exhibits a nearly symmetric double-sided radio jet from subparsec scales up to kiloparsecs (e.g., Jones et al., 1984; Wrobel, 1984; Kellermann et al., 1998), showing outward motions with an apparent velocity of 0.26 (Vermeulen et al., 2003). Past very-long-baseline-interferometry (VLBI) studies have shown that the nuclear structure consists of the eastern approaching and the western receding jets at an inclination angle of from the line of sight (e.g., Kellermann et al., 1999; Kameno et al., 2001; Kadler et al., 2004b). Atomic and molecular lines are found toward the center of NGC 1052 in emission (H2O megamaser for Braatz et al. 1994) and in absorption (H i for van Gorkom et al. 1986; OH for Omar et al. 2002; HCO+; HCN and CO for Liszt & Lucas 2004) at the radio band.
NGC 1052 hosts a well-studied circumnuclear torus surrounding its central engine. The presence of a parsec-scale dense plasma torus has been proposed based on the measurements of free-free absorption in the innermost region of the radio jet obtained by the multi-frequency VLBI observations (Kameno et al., 2001, 2003; Vermeulen et al., 2003; Kadler et al., 2004b). The torus is geometrically thick, obscuring 0.1 pc and 0.7 pc of the eastern and western jets, respectively. The electron column density toward the free-free absorber is estimated to be cm-2, which is consistent with atomic hydrogen column density of – cm-2 derived from various past X-ray observations (Guainazzi & Antonelli, 1999; Weaver et al., 1999; Kadler et al., 2004a). Kameno et al. (2005) have proposed a torus model with several phase layers: a hot plasma layer at the inner surface, and a warm molecular gas layer where the H2O maser arises, and a cooler molecular layer. Several spectral VLBI observations have revealed that gases of H2O megamaser emission, OH absorption, and HCN absorption are located where the free-free absorption is large due to the torus, which supports the torus model with several layers (Sawada-Satoh et al., 2008; Impellizzeri et al., 2008; Sawada-Satoh et al., 2016). The spectra of the H2O megamaser, OH absorption, and HCN absorption are all redshifted with respect to , which has been explained as being due to ongoing material infalling onto the supermassive black hole (Sawada-Satoh et al., 2008; Impellizzeri et al., 2008; Sawada-Satoh et al., 2016). These circumnuclear structures make NGC 1052 an ideal laboratory to study subparsec-scale molecular chemistry and its relation to the AGN-related physical and chemical process.
HCO+ and HCN are known as good dense molecular gas tracers in galaxies, because of its large dipole moment and abundance. The IRAM Plateau de Bure Interferometer (PdBI) observations have discovered the HCO+(1–0) absorption against NGC 1052 (Liszt & Lucas, 2004). The derived spectral profile of the HCO+ absorption was broad, extending from 1400 to 1900 km s-1 in velocity, and was not resolved into narrow absorption features. The peak velocity of the HCO+ absorption was 1650 km s-1, which was 150 km s-1 redshifted from . It was close to the peak velocities of HCN absorption (Liszt & Lucas, 2004) and H2O maser emission (Braatz et al., 1994). To confirm what the broad HCO+ absorption traces in the circumnuclear region of NGC 1052, one milliarcsecond (mas) angular resolution achieved by VLBI is essential. The VLBI map of molecular absorption line against the parsec-scale synchrotron radio source offers a unique scientific opportunity in direct detection of thermal molecular gas on parsec- and subparsec scales (e.g. Sawada-Satoh et al., 2016).
We have observed the high dense gas tracer HCO+ transition toward the center of NGC 1052 with the Korean VLBI Network (KVN). Here we show the first detection and the maps of the subparsec-scale HCO+(1–0) absorption in the circumnuclear region of NGC 1052. One mas corresponds to 0.095 pc in the galaxy.
2 Observations and data reduction
KVN observations of NGC 1052 were carried out from 2017 June 17 UT 21:00 to June 18 UT 06:00, for a total on-source time of 7.5 hours. To improve the sensitivity for the 3mm HCO+(1–0) absorption line observation, simultaneous dual-frequency observation was conducted at 1.3cm and 3mm bands using the KVN multi-frequency receiving system (Han et al., 2008; Oh et al., 2011; Han et al., 2013). To cover the broad HCO+(1–0) absorption feature (400 km s-1), the data were recorded at each station with the Mark6 system at a sampling rate of 8 Gbps (512 MHz 4 IFs 2 bit quantization) in dual circular polarization.
Two of four IFs were assigned to left-hand circular polarization (LHCP) and right-hand circular polarization (RHCP) at 3mm for the target frequency band. The other two IFs were fixed to LHCP and RHCP at 1.3cm for the phase referencing. The velocity coverage of one IF at 3mm was 1600 km s-1. For phase and bandpass calibration, 3C 84 and NRAO 150 were also observed every hour.
The data were correlated with the DiFX software correlator (Deller et al., 2007) at the Korea-Japan Correlation Center (Yeom et al., 2009; Lee et al., 2015b). The visibility amplitude decrement due to the digital quantization loss was corrected by applying a correction factor of 1.1 (Lee et al., 2015a). Post-correlation processing was done using NRAO AIPS software (Greisen, 2003). A priori amplitude calibration was applied using measurements of the opacity-corrected system temperature with the chopper-wheel method (e.g. Ulich & Haas, 1976) and gain curve depending on the elevation. Complex bandpass characteristics at each station were solved using data of 3C 84 and NRAO 150.
To calibrate rapid atmospheric phase fluctuations at 3mm, we analyzed these data using the frequency phase transfer (FPT) method, in which the phase solutions of the low-frequency band (1.3cm) are transferred to the high-frequency band (3mm) by scaling by their frequency ratio (Middelberg et al., 2005; Rioja & Dodson, 2011). Applying FPT, the rms phase fluctuation was reduced by for all of three baselines. Doppler velocity corrections were made by running the AIPS tasks SETJY and CVEL. The continuum was subtracted with the AIPS task UVLSF by performing a polynomial fit to line-free channels in the visibility domain. We identified channels with a velocity lower than 1400 km s-1 and higher than 1900 km s-1 as the line-free channels. The parallel-hand data were averaged into the total intensity data. We corrected the visibility phase using self-calibration with the averaged line-free channels, and applied the solutions of the self-calibration in the absorption line channels. The continuum map was formed from the averaged line-free channels using the hybrid imaging with CLEAN and self-calibration. The image cube was generated with a channel width of 8 MHz. The optical depth image cube was yielded from the continuum map and the image cube, and averaged every 32 MHz. We blanked image pixels with intensities below 18 mJy beam-1 () in the continuum map, because the signal-to-noise ratio in optical depth is poor where the continuum emission is weak. Maps were produced with natural weighting, and the resulting FWHM of the synthesized beam is mas ( pc in NGC 1052).
3 Results
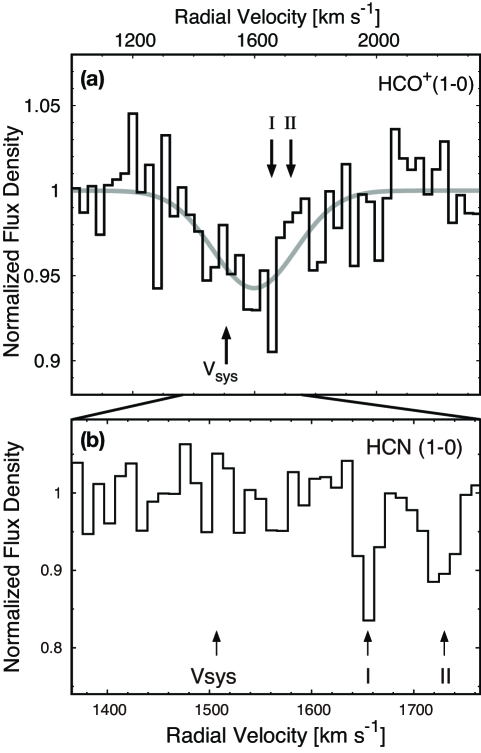
Figure 1a shows the vector-averaged cross power spectrum of HCO+(1–0) absorption of NGC 1052 integrated over the whole on-source time with the KVN. The frequency resolution is 8 MHz, which corresponds to 26.9 km s-1 in velocity resolution (). All the spectral channels are normalized to the continuum level. Broad HCO+(1–0) absorption is detected in the velocity range from 1350 to 1850 km s-1. The absorption profile could be slightly asymmetrical with the blueshifted part having more extended wing than the redshifted part, and the peak absorption channel is at velocity of 1658 km s-1. The peak channel is close in velocity to the narrow HCN absorption features I at 1656 km s-1, reported in Sawada-Satoh et al. (2016) (figure 1b). The HCO+ spectral profile, including a redshifted peak and a blueshifted wing, and their velocities are similar to those of the absorption profile from the PdBI data (Liszt & Lucas, 2004). However, the peak absorption channel at 1658 km s-1 has a depth of of the continuum level, which is deeper than that of the PdBI (). The peak absorption depth results in the peak optical depth () of .
To give a rough estimation of the width and the maximum depth, we attempted a single Gaussian fitting to the spectral profile, while it is rather asymmetrical. We obtained the best-fit model profile with the full widths at half depth in velocity of km s-1 and the maximum depth of at the centroid velocity of km s-1. The reduced chi square is 1.04, and it is not further improved even if we give multiple-gaussian fitting.
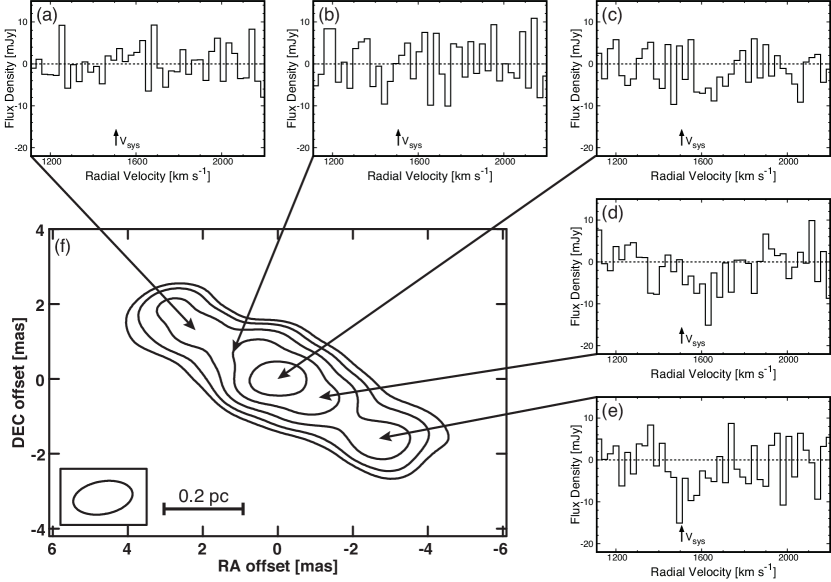
The broad HCO+ absorption is spatially resolved by the VLBI imaging. In figure 2, we present a continuum image of the nuclear region in NGC 1052 at 3mm and HCO+(1–0) absorption spectra in various regions against the background continuum emission of NGC 1052. The HCO+(1–0) absorption spectra were extracted from the image cube using the AIPS task ISPEC integrating over the region of mas at different spatial positions. The typical 1 level is 5 mJy in 8 MHz (26.9 km s-1) channel. Figures 2a and 2b indicate that no significant absorption feature is seen against the eastern approaching jet, while a weak absorption feature is tentatively detected on the central nuclear component at velocity of 1650 km s-1 as shown in figure 2c. Figures 2d and 2e show that the absorption depth reaches 3 level on the western receding jet.
The 3mm continuum image reveals a symmetric double-sided jet structure that consists of a bright central component and two elongated eastern and western jets (figure 2f). The jet structure is extended up to 0.7 pc. The flux densities of the central component within 1.6 mas (the major axis of the synthesized beam), the eastern jet, and the western jet are determined to be 414, 92, and 93 mJy, by summing the CLEAN components. The continuum image is consistent with the previous KVN map at 89 GHz taken in 2015 (Sawada-Satoh et al., 2016).
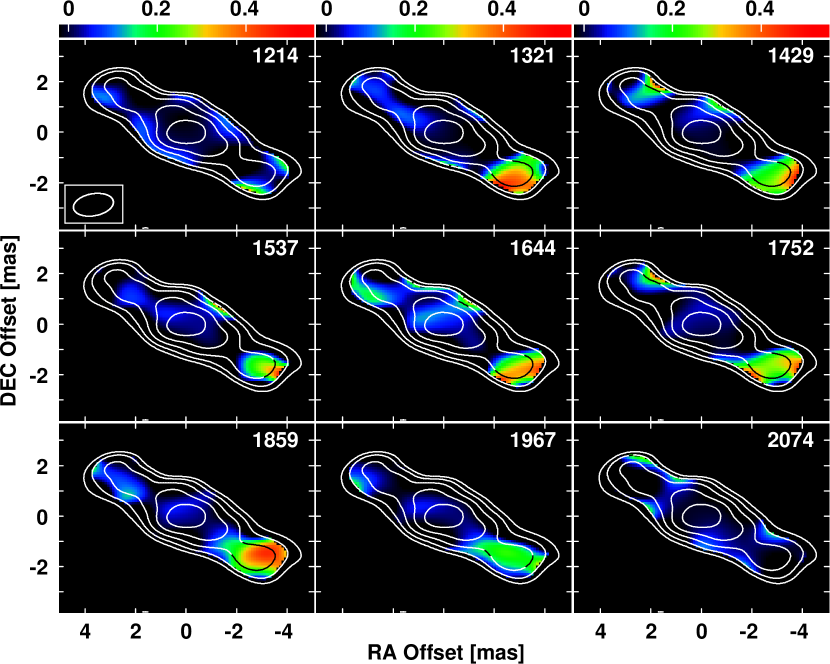
HCO+ optical depth channel maps superimposed on the 3mm continuum image are shown in figure 3. Distribution of HCO+ optical depth on the double-sided jet structure shows that high opacities are localized on the western receding jet side, where the parsec-scale torus obscures. Such a localization of the high opacity on the receding jet side is also seen in the opacity distributions of OH (Impellizzeri et al., 2008) and HCN (Sawada-Satoh et al., 2016) of this galaxy.
4 Discussions
From our KVN observations, the HCO+ opacity of 0.4 is derived in the nuclear region of NGC 1052 with the subparsec angular resolution. It is one order higher than that obtained from the PdBI observations (Liszt & Lucas, 2004). This fact suggests that the HCO+ covering factor is much larger on subparsec scales. Here we examine it by estimating the mean opacity over the whole 0.7 pc nuclear structure for each frequency channel , using
| (1) |
where is the HCO+ opacity distribution for each channel map (color map in figure 3) and is the 3mm continuum image (figure 2f). We also calculated normalized flux density for each channel from , and listed it in table 1. The derived normalized flux density is in the range from 0.96 to 1, and it is in good agreement with the HCO+ absorption profile on hundred-parsec scales observed with the PdBI (Liszt & Lucas, 2004). Thus, the HCO+ covering factor varies on scales in the center of NGC 1052, and the difference in HCO+ optical depth between KVN and PdBI could account for the partial covering of HCO+ absorbing gas on subparsec scales.
| Central Velocity | Normalized Flux Density | |
|---|---|---|
| (km s-1) | ||
| 1214 | 0.0014 | 0.999 |
| 1321 | 0.0191 | 0.981 |
| 1429 | 0.0165 | 0.984 |
| 1537 | 0.0038 | 0.996 |
| 1644 | 0.0384 | 0.962 |
| 1752 | 0.0198 | 0.980 |
| 1859 | 0.0400 | 0.961 |
| 1967 | 0.0137 | 0.986 |
| 2074 | 0.0040 | 0.996 |
Note. — (1) Central velocity for each channel; (2) mean opacity over the whole parsec-scale nuclear source; (3) normalized flux density calculated from the values in (2).
Concentration of high HCO+ opacity on the western receding jet component strongly suggests that HCO+ absorption is associated with the parsec-scale circumnuclear torus. Because the jet axis of NGC 1052 is oriented within from the sky plane (e.g., Kellermann et al., 1999; Kameno et al., 2001; Kadler et al., 2004b), the near side of the thick torus should lie in front of the nuclear component and the receding jet component. The line of sight to the receding jet passes through the near side of the torus, where the HCO+ absorption occurs. The HCO+ gas presents a relatively common distribution with plasma, H2O, OH, and HCN. If the torus has several physical layers as shown in figure 3 of Sawada-Satoh et al. (2016), the HCO+ gas could be located in the cooler (400 K) molecular layer inside the torus, where the HCN gas also could lie.
We can estimate the total column density of HCO+ assuming the local thermodynamic equilibrium, using the approximate expression for the 1–0 transition
| (2) |
where is the Boltzmann constant, is the Planck constant, is the permanent dipole moment of the molecule, is the rotational constant, is the excitation temperature, and is the velocity-integrated optical depth of the absorption feature. For HCO+, is 4.07 Debye (Haese & Woods, 1979) and MHz (Lattanzi et al., 2007). As is uncertain, here we assume 100 and 230 K, in the same manner as Sawada-Satoh et al. (2016). Assuming for the peak absorption channel at 1658 km s-1, the total column density of HCO+ of the peak is calculated to be () cm-2 and () cm-2 at 100 and 230 K, respectively. The column density ratio between HCN and HCO+ around 1658 km s-1 can be determined to be 6.5, as the total HCN column density at 1656 km s-1 is cm-2 and cm-2 at 100 and 230 K, respectively (Sawada-Satoh et al., 2016). The derived value of the column density ratio is even higher compared to the high HCN/HCO+ intensity ratios ( 2) measured in NGC 1097 (Izumi et al., 2013) and NGC 1068 (García-Burillo et al., 2014; Viti et al., 2014) on parsec scales with the ALMA. However, we have to note that the column densities of HCN and HCO-1 are not measured simultaneously. During a time gap of 27 months between the two observations of HCN and HCO+, the background receding jet component could move 0.18 pc outward, almost one beam size. Adopting an abundance ratio HCO+ relative to H2 of (2–3) in Galactic diffuse molecular gas (Liszt & Lucas, 2000, 2004; Liszt et al., 2010), the column density of molecular hydrogen (H2) is derived to be – cm-2, which is consistent with estimated from the HCN absorption spectrum (Sawada-Satoh et al., 2016).
Despite the detection of HCO+ (1–0) absorption, the emission of HCO+ has not been found in the center of NGC 1052 with the past PdBI observation (Liszt & Lucas, 2004). This indicates that the H2 volume density () in the center is less than the H2 critical density () for HCO+ (1–0) emission. Adopting the Einstein coefficient for spontaneous emission s-1 for HCO+ (Izumi et al., 2013), and the collisional rate of cm-3 s-1 at a temperature of 100 K (Flower, 1999), gives a critical density of approximately cm-3. Thus, it derives cm-3. The relation , where is the volume-filling factor and is the size of the molecular gas region in the torus, gives a lower limit pc, using cm-2 and cm-3 at 100 K. If we assume that the molecular region is inhomogeneous (i.e. ), would be even larger than 1 pc.
It is remarkable that a broad HCO+ absorption with a redshifted peak and a blueshifted wing is detected against the parsec-scale receding jet of NGC 1052. The broad spectral profile is much wider than expected from the thermal broadening (0.2 km s-1), and it suggests a significant contribution of other kinematics, or a complex of some rapid motion with multiple clumpy gas clouds at various different velocities, such as turbulence, interaction, and so on. The spectral profile was not resolved into several narrow absorption features. However, the optical depth differential among different velocity channel maps implies that several gas clumps or inhomogeneous structure at various velocities lie along the line of sight and apparently overlap. It is likely that the redshifted HCO+ absorption around the peak velocity trace the same infall motion as HCN absorption and H2O maser inside the torus. It can be interpreted as infall toward the supermassive black hole of NGC 1052. In addition to the infall motion, the blueshifted HCO+ absorbing gas could indicate small-scale turbulence of clumps inside the torus.
5 Summary
Our 1 mas angular resolution observations toward the center of NGC 1052 with the KVN have led us to first subparsec-scale imaging of the HCO+ absorbing gas in the vicinity of AGN. The spectral profile of HCO+ absorption is detected in a broad velocity range of 1350–1850 km s-1, in agreement with the past PdBI observations. However, the peak absorption depth is deeper than that of the PdBI. Our HCO+ optical channel map clearly shows a high opacity on the receding jet component and a faint opacity on the nuclear component. It suggests that HCO+ absorption arises from the near side of the torus, which covers the receding jet and the nucleus. We estimate of – cm-2, assuming an abundance ratio [HCO+]/[H2] of 2–3 and a of 100–230 K. Since HCO+ line appears only in absorption even with the PdBI, we find cm-3. It implies that the radius of the torus is 1 pc. The HCO+ absorbing is probably a several gas clumps with several different velocities, rather than a single uniform medium with a single velocity. The broad HCO+ absorption could consist of several kinematics at various velocities inside the torus.
References
- Braatz et al. (1994) Braatz, J. A., Wilson, A. S., & Henkel, C. 1994, ApJ, 437, L99
- Deller et al. (2007) Deller, A. T., Tingay, S. J., Bailes, M., & West, C. 2007, PASP, 119, 318
- Flower (1999) Flower, D. R. 1999, MNRAS, 305, 651
- García-Burillo et al. (2014) García-Burillo, S., Combes, F., Usero, A., et al. 2014, A&A, 567, A125
- Greisen (2003) Greisen, E. W. 2003, in Information Handling in Astronomy – Historical Vistas Vol. 285, ed. A. Heck (Dordrecht: Kluwer), 109
- Guainazzi & Antonelli (1999) Guainazzi, M., & Antonelli, L. A. 1999, MNRAS, 304, L15
- Han et al. (2008) Han, S.-T., Lee, J.-W., Kang, J., et al. 2008, International Journal of Infrared and Millimeter Waves, 29, 69
- Han et al. (2013) Han, S.-T., Lee, J.-W., Kang, J., et al. 2013, PASP, 125, 539
- Haese & Woods (1979) Haese, N. N., & Woods, R. C. 1979, Chemical Physics Letters, 61, 396
- Impellizzeri et al. (2008) Impellizzeri, V., Roy, A. L., & Henkel, C. 2008, Proceedings of the 9th European VLBI Network Symposium on The role of VLBI in the Golden Age for Radio Astronomy, ed. Mantovani et al., POS(IX EVN Symposium), 33
- Izumi et al. (2013) Izumi, T., Kohno, K., Martín, S., et al. 2013, PASJ, 65, 100
- Jensen et al. (2003) Jensen, J. B., Tonry, J. L., Barris, B. J., et al. 2003, ApJ, 583, 712
- Jones et al. (1984) Jones, D. L., Wrobel, J. M., & Shaffer, D. B. 1984, ApJ, 276, 480
- Kadler et al. (2004a) Kadler, M., Kerp, J., Ros, E., et al. 2004, A&A, 420, 467
- Kadler et al. (2004b) Kadler, M., Ros, E., Lobanov, A. P., Falcke, H., & Zensus, J. A. 2004, A&A, 426, 481
- Kameno et al. (2001) Kameno, S., Sawada-Satoh, S., Inoue, M., Shen, Z.-Q., & Wajima, K. 2001, PASJ, 53, 169
- Kameno et al. (2003) Kameno, S., Inoue, M., Wajima, K., Sawada-Satoh, S., & Shen, Z.-Q. 2003, Proc. Astron. Soc. Australia, 20, 134
- Kameno et al. (2005) Kameno, S., Nakai, N., Sawada-Satoh, S., Sato, N., & Haba, A. 2005, ApJ, 620, 145
- Kellermann et al. (1998) Kellermann, K. I., Vermeulen, R. C., Zensus, J. A., & Cohen, M. H. 1998, AJ, 115, 1295
- Kellermann et al. (1999) Kellermann, K. I., Vermeulen, R. C., Cohen, M. H., & Zensus, J. A. 1999, Bulletin of the American Astronomical Society, 31, 20.02
- Lattanzi et al. (2007) Lattanzi, V., Walters, A., Drouin, B. J., & Pearson, J. C. 2007, ApJ, 662, 771
- Lee et al. (2015a) Lee, S.-S., Oh, C. S., Roh, D.-G., et al. 2015a, Journal of Korean Astronomical Society, 48, 125
- Lee et al. (2015b) Lee, S.-S., Byun, D.-Y., Oh, C. S., et al. 2015b, Journal of Korean Astronomical Society, 48, 229
- Liszt & Lucas (2000) Liszt, H., & Lucas, R. 2000, A&A, 355, 333
- Liszt & Lucas (2004) Liszt, H., & Lucas, R. 2004, A&A, 428, 445
- Liszt et al. (2010) Liszt, H. S., Pety, J., & Lucas, R. 2010, A&A, 518, A45
- Middelberg et al. (2005) Middelberg, E., Roy, A. L., Walker, R. C., & Falcke, H. 2005, A&A, 433, 897
- Oh et al. (2011) Oh, S.-J., Roh, D.-G., Wajima, K., et al. 2011, PASJ, 63, 1229
- Omar et al. (2002) Omar, A., Anantharamaiah, K. R., Rupen, M., & Rigby, J. 2002, A&A, 381, L29
- Rioja & Dodson (2011) Rioja, M., & Dodson, R. 2011, AJ, 141, 114
- Sawada-Satoh et al. (2008) Sawada-Satoh, S., Kameno, S., Nakamura, K., et al. 2008, ApJ, 680, 191-199
- Sawada-Satoh et al. (2016) Sawada-Satoh, S., Roh, D.-G., Oh, S.-J., et al. 2016, ApJ, 830, L3
- Ulich & Haas (1976) Ulich, B. L., & Haas, R. W. 1976, ApJS, 30, 247
- van Gorkom et al. (1986) van Gorkom, J. H., Knapp, G. R., Raimond, E., Faber, S. M., & Gallagher, J. S. 1986, AJ, 91, 791
- Vermeulen et al. (2003) Vermeulen, R. C., Ros, E., Kellermann, K. I., et al. 2003, A&A, 401, 113
- Viti et al. (2014) Viti, S., García-Burillo, S., Fuente, A., et al. 2014, A&A, 570, A28
- Weaver et al. (1999) Weaver, K. A., Wilson, A. S., Henkel, C., & Braatz, J. A. 1999, ApJ, 520, 130
- Wrobel (1984) Wrobel, J. M. 1984, ApJ, 284, 531
- Yeom et al. (2009) Yeom, J. H., Oh, S. J., Roh, D. G., et al. 2009, Journal of Astronomy and Space Sciences, 26, 567