Optical properties of Fe-Mn-Ga alloys
Abstract
The first-principles calculations of the electronic structures and the interband optical conductivity (OC) spectra have been performed for the stoichiometric Fe2MnGa alloy with L21 and L12 types of atomic ordering. The calculated optical properties of Fe2MnGa alloy for the L21 and L12 phases are complemented by the experimental OC spectra for bulk and thin film Fe-Mn-Ga alloy samples near the stoichiometry 2:1:1 with L21 and L12 (for bulks) as well as the body-centered-cubic and face-centered-cubic (for films) structures, respectively. A reasonable agreement between experimental and calculated interband OC spectra was obtained for both phases of the alloy. The experimental data show no significant difference in the OC spectra with respect to the degrees of atomic and magnetic orders of the samples.
pacs:
68.35.bd, 75.70.Ak, 76.50.+g1 Introduction
Heusler alloys (HA) attract much attention due to emergent new physical properties and applications (martensitic transformations, half-metallicity, metamagnetic transformations etc.) resulting from their specific electronic structures [1].
Among various experimental tools for studying the electronic structures of metals the optical spectroscopy (namely, spectroscopic ellipsometry) has a great advantage in comparison with other methods which provide information on the band structure [2]. Specifically, optical spectroscopy is regarded as a method that manifests a high energy resolution of 0.01 eV within a 5 - 6 eV energy range near the Fermi level (). On the other hand, among various optical parameters of metals, interband optical conductivity (IBOC) is the most sensitive one which shows the intensity and frequency dependence of the light-induced electron excitations from the occupied to unoccupied bands [3].
However, the interpretation of the experimental results is usually difficult since optical data depend over all possible transitions in the Brillouin zone (BZ) where an initial and final states for electron excitations are not known. On the other hand, a comparison of experimental IBOC spectra with the calculated from the first-principles opens some perspectives for a correct interpretation of experimental results if certain transitions are sufficiently strong.
Optical properties of Ni, Co, and Fe based HA have been widely investigated theoretically and experimentally [2, 4, 5, 6, 7, 8]. The most comprehensive experimental study of various bulk HAs has been carried out by Shreder et al. [9, 10, 11, 12, 13, 14]. However, only a few publications have been focused on the study of the effect of structural transformations in HA on their optical properties and hence the electronic structure. Han et al. have shown significant influence of the alloy symmetry on the electronic structure and magnetic characteristics of the Sc-based HA with XA and L21 types of structure [15]. Furthermore, Wan et al. have indicated that the calculated IBOC spectra in a Ni2MnGa alloy show a noticeable structural dependence [7]. On the contrary, Svyazhin et al. have experimentally shown that atomic disorder in bulk Co2CrAl HA has no impact on its optical properties [14].
Fe2MnGa is an interesting example of HA with much richer structural and magnetic properties than Ni2MnGa and a large ferromagnetic-shape-memory performance for slightly off-stoichiometric compositions [16]. Due to structural instability, Fe-Mn-Ga bulk HA near the 2:1:1 stoichiometric composition may crystallize in distinct crystalline phases: L12 or/and face-centered cubic (FCC), L21 or/and body-centered cubic (BCC), mixed BCC+FCC or tetragonal structures with different types of magnetic order [16, 17, 18, 19].
The transformations in Fe-Mn-Ga are accompanied by significant changes in their magnetic and transport properties [16, 17, 19]. Such effects give reason to believe that an electronic band structure also experiences substantial modifications and hence has an impact on the optical properties of the alloys.
On the other hand, thin films of the corresponding Fe-Mn-Ga alloys are usually less ordered than the bulk samples and have a much smaller grain size. Therefore, a comparison of the optical properties of bulk and film Fe-Mn-Ga alloy samples with distinct structural ordering and distinct microstructure may, to a certain extent, assist the verification of the relevance of the first-principle calculations of the optical properties for the systems showing structural instability.
Here we show the results of first-principles calculations of the electronic structures and some physical properties of stoichiometric Fe2MnGa alloy with L21 and L12 types of atomic order. The calculated optical properties were compared with experimental results obtained for bulk and film samples with different types of atomic and magnetic orders.
2 Calculation and experimental details
The electronic structures and the IBOC spectra of the Fe2MnGa HA for ordered L21 (225 space group) and L12 (123 space group) types of structure, as well as different types of the magnetic order, were calculated by using the same approach as in our previous article [20]. The muffin-tin radii were determined in a way to minimize inter-sphere volume for the L21 and L12 types of structure with a smallest their unit-cell volumes. For both types of the structure were equal to = 2.39 Å, = 2.39 Åand = 2.33 Å. For wave-function approximation of 3-electrons for all the atoms APW + were used. For the wave-functions of other valent electrons, LAPW basis was employed. To calculate the partial waves inside MT-spheres maximal orbital quantum numbers equal to =10 and =4 were used. The density plane-wave cutoff was = 7.0. Self-consistency in calculations of the Fe2MnGa alloy IBOC spectra was obtained using 4531 k-points in the irreducible BZ.
Two bulk polycrystalline Fe2MnGa alloys of different composition near the stoichiometry 2:1:1 were prepared and characterized similarly to [19, 20]. In addition to bulk samples a set of Fe-Mn-Ga alloy fine-crystalline films near the stoichiometric composition of about 50 - 100 nm in thickness was prepared by using DC magnetron sputtering onto glass and NaCl substrates kept at room temperature (RT). Table 1 presents information on the composition and the structure of fabricated bulk and thin film Fe-Mn-Ga alloy samples.
| Sample | Heat | Sample | Lattice | |
|---|---|---|---|---|
| Sample No. | composition | treatment | structure | parameter |
| (nm) | ||||
| Bulk 1 | Fe49Mn25Ga26 | 723K/150 min | L12 | 0.3717 |
| Bulk 2 | Fe52Mn18Ga30 | 723K/150 min | L21 | 0.5855 |
| Film 1a | Fe56Mn20Ga24 | as-depos. | BCC | 0.294 |
| Film 1b | Fe56Mn20Ga24 | 673 K/60 min | FCC | 0.377 |
| Film 2a | Fe46Mn35Ga19 | as-depos. | BCC | 0.306 |
| Film 2b | Fe46Mn35Ga19 | 673 K/60 min | FCC | 0.380 |
Bulk samples for the optical measurements of about 10 20 2 mm3 in size were cut from ingots employing spark erosion technique followed by mechanical polishing with diamond pasts. To avoid surface contaminations induced by mechanical polishing bulk samples before optical measurements were annealed in a high-vacuum condition at =723 K for 150 min. Frequency dependence of the optical conductivity (OC) was measured by using a spectroscopic rotating-analyzer ellipsometer in a spectral range of 330 - 2500 nm (3.75 - 0.5 eV) at a fixed incidence angle of 73∘. The optical properties of bulk Fe-Mn-Ga HA samples were measured at different temperatures, which provide different types of magnetic ordering. Magnetic properties of bulk and film samples were investigated by measuring at RT magnetization hysteresis loops employing a vibrating sample magnetometer and DC magnetic susceptibility in a temperature range 80 - 750 K.
3 Results and discussion
It was found that L21 and L12 types of the structure with ferrimagnetic (FI) and ferromagnetic (FM) types of magnetic order, respectively, are most favorable because of the lowest total electron energy among other types of structure and magnetic orders [19]. As it is shown in Fig. 1, the calculated the density of electronic states (DOS) for these states are noticeably different. Unlike the case of the L12 type of order, for the Fe2MnGa alloy with the L21 type of atomic order exhibit pseudo gaps near the Fermi level both for the majority and minority spins. Because of a significant difference in for L21 and L12 structures of the Fe2MnGa alloy, one should expect the corresponding effect on their (calculated) optical properties.

Resulting IBOC spectra in metals are formed by additive contributions from electron excitations in the majority and minority electron subbands. IBOC for selected spin bands can be given as:
| (1) |
where is the incident photon energy, is the momentum operator, , is the eigenfunction with eigenvalue , is the Fermi distribution function.

The calculated resulting and spin-resolved IBOC spectra for stoichiometric perfectly ordered Fe2MnGa HA with L21 and L12 types of structure are shown in Figs. 2, 3 and 5. The resulting IBOC spectrum for the L21 structure is characterized by the dominant absorption peak at 2 eV with less intense peculiarities (absorption peaks) on its low- and high-energy slopes. For 4 eV energy range for the L21 phase insignificantly increases with photon energy (see Fig. 2). The calculated IBOC spectrum for the L12 structure of Fe2MnGa HA exhibits a set of less pronounced absorption peaks located at 1.0, 2.15 and 2.85 eV, forming together at 0 3 energy range wide absorption band. However, its intensity is somewhat smaller than that for the L21 phase (see Fig. 2). It should be noted here that the intraband contribution to the calculated OC spectra of Fe2MnGa alloy was not taken into account.
Figure 3 shows spin-resolved IBOC spectra of the L21 phase and partial contributions formed by electron excitations from various occupied bands. It is seen that the most intense absorption peak at 2 eV results from electron excitations from the minority 23rd, 24th, 25th and 26th bands. Electron excitations from other occupied minority bands produce a double peak at 3.5 eV located on the energy independent plateau of the spectrum for the energy range of 3.0 eV. At the same time, electron excitations originated from the 28th, 27th, 26th and 25th majority bands produce a set of narrow and intense IBOC peaks in the near infra-red energy range whose intensities decrease with the photon energy.
Figure 4 presents spin-resolved energy band structures and element resolved DOS for stoichiometric Fe2MnGa alloy with the L21 type of atomic order. The bands involved in the aforementioned excitations as initial are marked by thick color lines. Vertical arrows with corresponding color show possible most intensive electron excitations which form partial IBOC peaks.
It is seen that the most partial interband contributions to the resulting IBOC spectrum from the definite bands are smeared over a wide energy range (several eV). Among them, the peak at 0.5 eV originating from the 28th majority band probably is the only one with localized energy of electron excitation (see Fig. 3a). Therefore, for this case the bands and parts of the Brillouin zone involved in this peak formation can be found with more certainity. These are the initial states the near L high symmetry point, the sates along - K and - X directions in the BZ located at 0.3 - 0.4 eV below the Fermi level (see Fig. 4a). Figure 4c clearly shows that these states are related to Fe and Mn atoms. Their detailed analysis allows us to conclude that they are mainly states of Mn and , and states of Fe.


For the L12 phase of Fe2MnGa both spin subbands contribute nearly equally to the resulting IBOC spectrum formation (see Fig. 5). It is seen that the electron excitations initiated from 31st, 30th, 29th and 28th majority bands produce two intense peaks at 1 eV and 2 eV. Electron excitations from other majority bands produce for the 3 6 eV energy region an energy independent plateau with a narrow and intense peak located at 4.25 eV. Electron excitations originated from 22nd, 23rd and 24th minority bands form an intense IBOC peaks at 1.0, 2.2 and 2.8 eV. Electron excitations from other occupied minority bands produce a set of low-intense peaks for the 3 6 eV energy region. Figure 6 presents spin-resolved energy band structures and element resolved DOS for stoichiometric Fe2MnGa alloy with the L12 type of atomic order. The bands involved in the aforementioned electron excitations as initial have been marked in this figure by thick color lines. Vertical arrows with the corresponding color also show possible the most intense electron excitations which form partial IBOC peaks.


Thus, one can conclude that both calculated IBOC spectra for the stoichiometric Fe2MnGa alloy with L21 and L12 types of the structure have noticeably different and rather complicated nature but unfortunately demonstrate some visual similarity in the spectral shape.
Figure 7 shows experimental XRD patterns for bulk Fe-Mn-Ga alloys together with the simulated stroke-diagrams for the stoichiometric Fe2MnGa alloy with the L21 and L12 structures, respectively. Superstructure reflections [(100) and (110) for Fe49Mn25Ga26 alloy and (200) and (311) for Fe52Mn18Ga30 alloy] in the experimental diffraction patterns definitely show on the presence of L12 and L21 types of atomic order in aforementioned bulk samples, respectively. At the same time, some presence of the second phase in these bulk alloy samples should be mentioned. But the amount of the second phase estimated roughly by the intensity ratio of the most intense reflections does not exceed several percents. The coherence length (or the mean grain size) for the bulk Fe52Mn18Ga30 and Fe49Mn25Ga26 alloys were evaluated by using full width at half maximum of the XRD peaks and found to be = 37 and 60 nm, respectively.

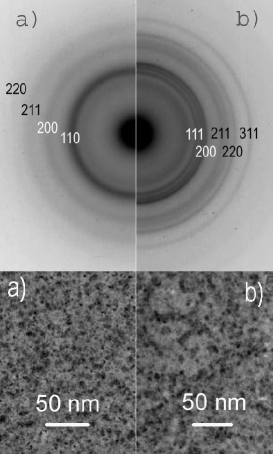
According to XRD (not shown) and TEM results all RT as-deposited Fe-Mn-Ga alloy films have fine crystalline (or even amorphous-like) structure of BCC type (i. e. disordered L21) with a mean grain size of about 3 nm. Annealing of the Fe-Mn-Ga HA films at = 673 K during 1 hour induces noticeable changes of the TEM patterns which indicate the formation of a fine crystalline structure with a short-range-order of FCC type (i. e. disordered L12) and somewhat larger mean grain size ( 6 nm). As an example, typical for all the investigated as-deposited and annealed Fe-Mn-Ga alloy films microdiffraction and microstructure patterns for Fe39Mn25Ga36 alloy films are shown in Fig. 8.


The crystalline structure of bulk and film Fe-Mn-Ga alloy samples determines their magnetic properties. Thus, Fe52Mn18Ga30 alloy with the L21 type of structure behaves as FM [actually FI] with the Curie temperature 250 K, while Fe49Mn25Ga26 HA with the L12 type of structure has 750 K. However, below 450 K a rapid drop in dependence is observed for Fe49Mn25Ga26 HA (see Fig. 9). Such behavior is usually attributed to metamagnetic transformation from an FM to an antiferromagnetic (AFM) state [26]. At the same time induced by annealing the transition from a BCC to an FCC type of structure in Fe-Mn-Ga alloy films causes their transition from a paramagnetic to an FM state (see Fig. 10).
For a correct comparison of the calculated IBOC spectra with experimental spectra, the intraband contributions should be subtracted from the experimental OC spectra. Accurately it can be done by using the measurement results obtained in far infra-red region ( 10 m) where intraband (Drude) contribution dominates over the interband term. The optical properties in the intraband absorption region can be explained by Drude formula:
| (2) |
| (3) |
,
where is light frequency, , and are real part of the dielectric function, plasma and effective relaxation frequencies of free charge carriers, respectively. and can be determined by plotting so-called Argand diagrams:
| (4) |
The linear part of the 1/(1-) dependence plotted in the scale evidences on the dominance of the Drude absorption in the optical properties of the sample. Having and values determined in such a way, the intraband conductivity can be calculated. Despite the fact that our optical measurements were restricted by 2.5 m edge, the Argand diagrams for all the investigated samples in the 1.0 2.5 m spectral range were almost linear.
Furthermore, to simulate temperature, structurally and chemically induced imperfections of the real samples the calculated IBOC spectra were smoothed (see Fig. 2).
The experimental spectra for the bulk magnetically ordered (FI) Fe52Mn18Ga30 HA with the L21 type of structure ( = 78 K) and the FM ordered Fe49Mn25Ga26 HA with the L12 structure ( = 493 K) are shown in Figs. 11 and 12.


It should be mentioned here that the experimental interband spectrum corresponds in spectral shape to the smoothed calculated IBOC spectrum (see Figs. 2 and 11) and is characterized by the presence of a broad interband absorption peak located at 1.5 eV. Above 2.25 eV some growth of indicates an increased interband absorption in the alloy (see Fig. 11). Thus, a reasonable qualitative correspondence between the shapes of the calculated and experimental OC spectra for the magnetically ordered L21 phase of Fe-Mn-Ga alloy proves the sufficient quality of the IBOC calculations and allows us to single out the peak at 1.5 eV as the electron excitations between aforementioned states (see Figs. 2 and 11). At the same time, the lack of fine structures in the experimental spectrum which are visible on the calculated spectrum can be explained by a polycrystalline microstructure of the bulk sample.
The correspondence between the shapes of the calculated and experimental interband spectra for the FM ordered Fe2MnGa HA with the L12 structure is also rather good: the experimental interband spectrum exhibits a less pronounced and somewhat red-shifted absorption peak in comparison with that for the L21 phase. Good correspondence between calculated and experimentally determined IBOC spectra for L21 and L12 phases should be mentioned (see Figs. 2, 11 and 12).
The optical properties of bulk electrolytically polished Fe-Mn-Ga alloys were investigated earlier by Krl [27]. It should be noted that all the investigated by him alloys of different compositions (and probably of different crystalline structures) demonstrate rather similar in spectral shape and absolute value OC spectra [27].
Thin film Fe-Mn-Ga samples are usually of much worse structural quality than the corresponding bulk samples (a smaller mean grain size, lower degree of atomic order, etc.). However, the OC spectra for the Fe-Mn-Ga films with BCC (i. e. the disordered L21 phase) and FCC (i. e. the disordered L12 phase) structures look rather similar to the corresponding spectra of bulk samples (see Figs.11 - 14). Therefore, the L2 BCC and the L1 FCC types of the atomic disorder do not change significantly the electronic states responsible for main interband peaks formation.


The type of magnetic ordering has no impact on the experimental optical properties and hence on electronic structures of bulk Fe52Mn18Ga30 and Fe49Mn25Ga26 alloys (see Figs. 11 and 12). This may be due to the so-called specific time scale of forming the electronic structure and spin fluctuations. It is known that the time needed to establish the electron energy spectrum is determined by the lifetime of the excited states defined as 10-15 s (where is the -bandwidth). At the same time, collective electrons need much more time to create spin correlations: 10-13 s [28]. Because of a large number of the electrons involved in spin fluctuations, , and one-particle states have enough time to build-up in the relatively slowly changing potentials of spin fluctuations. Thus, the local electronic structure is formed in slowly fluctuating (nearly constant for electron jumps) local field. The only difference of this local electronic structure from that of obtained at = 0 is the random orientation of quantization axis [28].
4 Summary
Electronic structure [DOS, E(k), magnetic moment] and IBOC for stoichiometric Fe2MnGa alloy with the L21 and L12 structures have been calculated.
It was shown that the calculated IBOC spectra for these phases of Fe2MnGa alloy have rather complicated nature - a large number of the majority and minority bands are involved in electron excitations, which form the resulting IBOC spectra.
The optical properties of bulk Fe-Mn-Ga alloys near the stoichiometry 2:1:1 with the L21 and L12 types of structure have been experimentally measured. Correspondence in spectral shape between the experimental and calculated IBOC spectra for the L21 phase of Fe-Mn-Ga alloy allows us to correlate the peaks observed in the experiment with an electron excitations between corresponding electronic bands.
Structural L21 L12 or BCC FCC transformations in bulk and film Fe-Mn-Ga alloy samples causes drastic changes in their magnetic properties. At the same time, magnetic transformations in bulk Fe52Mn18Ga30 and Fe49Mn25Ga26 alloys do not affect their IBOC spectra and hence the electronic states responsible for these spectra formation. We associate such the independence of the optical properties on the magnetic ordering of Fe-Mn-Ga alloys with the specific time scale of forming the electronic structure and spin fluctuations in alloys.
Little impact of structural ordering of Fe-Mn-Ga alloys on their optical properties suggests that the main features of the electronic structure of the alloys are mainly determined by their short-range order.
References
References
- [1] Graf T, Felser C and Parkin S 2011 Progress in solid state chemistry 39 1
- [2] Uba S, Bonda A, Uba L, Bekenov L V, Antonov V N and Ernst A 2016 Phys. Rev. B 94 054427
- [3] Noskov M M 1983 Optical and magneto-optical properties of metals, (Sverdlovsk, UNC AN SSSR) p 220
- [4] Kubo Y, Takakura N and Ishida S 1983 J. Phys. F: Met. Phys. 13 161
- [5] Kumar M, Nautiyal T and Auluck S 2009 J. Phys. : Condens. Matter 21 196003
- [6] Picozzi S, Continenza A and Freeman A J 2006 J. Phys. D: Appl. Phys. 39 851
- [7] Wan J F and Wang J N 2005 Physica B, 355 172
- [8] von Oehsen S, Scholtyssek S M, Pels C, Neuber G, Rauer R, Rübhausen M and Meier G 2005 Jour. Magn. Magn. Mater. 290-291 1371
- [9] Shreder E I, Svyazhin A D and Fomina K A 2012 Physics of Metals and Metallography 113 146
- [10] Shreder E I, Kirillova M M and Dyakina B P 1996 Physics of Metals and Metallography 81 406
- [11] Shreder E I, Streltsov S V, Svyazhin A, Makhnev A, Marchenkov V V, Lukoyanov A and Weber H W 2008 J. Phys.: Cond. Matter 20 045212
- [12] Shreder E I, Kirillova M M and Dyakina B P 2000 Physics of Metals and Metallography 90 362
- [13] Fomina K A, Marchenkov V V, Shreder E I and Weber H W 2011 Solid State Phenomena 168-169 545
- [14] Svyazhin A D, Shreder E I, Voronin V I, Berger I F and Danilov S E 2013 Jour. Exp. Theor. Phys. 143 518 (in Russian)
- [15] Han Y, Chen Z, Kuang M, Liu Z, Wang X, Wang X 2019, Results in Physics, 12, 435
- [16] Zhu W, Liu E K, Feng L, Tang X D, Chen J L, Wu G H, Liu H Y, Meng F B and Luo H Z 2009 Appl. Phys. Lett. 95 222512
- [17] Shih C W, Zhao X G, Chang H W, Chang W C and Zhang Z D 2013 Jour. All. Comp. 570 14
- [18] Okumura H, Hashiba E and Nagata K 2014 Intermetallics 49, 65
- [19] Kudryavtsev Y V, Perekos A E, Uvarov N V, Kolchiba M R, Synoradzki K and Dubowik J 2016 Jour. Appl. Phys. 119 205103
- [20] Kudryavtsev Y V, Uvarov V N, Iermolenko V N, Glavatskyy I N, Dubowik J, 2012 Acta Materialia 60 4780
- [21] Blaha P, Schwarz K, Madsen G K, Kvasnicka H D and Luitz L 2001 WIEN2k, An Augmented Plane Wave + Local Orbitals Program for Calculating Crystal Properties (Karl-heinz Schwarz, Techn. Universit Aat Wien, Wien, Austria)
- [22] Wimmer E, Krakauer H, Weinert M and Freeman A J 1981 Phys. Rev. B 24 864
- [23] Perdew J P, Burke K and Ernzerhof M 1996 Phys. Rev. Lett. 77 3865
- [24] Uvarov N V, Kudryavtsev Y V, Kravets A F, Vovk A Ya, Borges R P, Godinho M and Korenivski V 2012 Jour. Appl. Phys. 112 063909
- [25] Miura Y, Nagao K and Shirai M 2004 Phys. Rev. B, 69 144413
- [26] Tang X D, Wang W H, Zhu W, Liu E K, Wu G H, Meng F B, Liu H Y and Luo H Z 2010 Appl. Phys. Lett. 97 242513
- [27] Krl D 2017 Optical and magneto-optical properties of Heusler compounds (Master thesis, Institute of Physics of Charles University, Prague)
- [28] Vonsovskij S V 1986 in Dynamic and kinetic properties of magnetics, (edited by Vonsovskij S V and Turov E A, Science publisher, Moscow 248 p, in Russian).