Online Anomaly Detection in HPC Systems
Abstract
Reliability is a cumbersome problem in High Performance Computing Systems and Data Centers evolution. During operation, several types of fault conditions or anomalies can arise, ranging from malfunctioning hardware to improper configurations or imperfect software. Currently, system administrator and final users have to discover it manually. Clearly this approach does not scale to large scale supercomputers and facilities: automated methods to detect faults and unhealthy conditions is needed. Our method uses a type of neural network called autoncoder trained to learn the normal behavior of a real, in-production HPC system and it is deployed on the edge of each computing node. We obtain a very good accuracy (values ranging between 90% and 95%) and we also demonstrate that the approach can be deployed on the supercomputer nodes without negatively affecting the computing units performance.
1 Introduction
Nowadays, supercomputers and large data centers are increasing in scale and number of components, with systems composed of thousands / millions of computing units[FLYeA16, DMS94a] and represent an increasingly complex industrial plan. Therefore, there is a huge number of sources of possible faults, heterogeneous in their nature, ranging from hardware malfunctions or misconfigurations, to software unwanted behaviours or bugs. For system administrators who strive to guarantee systems operating in optimal conditions, identifying faulty situations and anomalous behaviours is a daunting task.
An automated online anomaly detection system capable to satisfy real time requirements would be a boon for facility managers. Currently, most of the state-of-the-art anomaly detection systems are based on the analysis of system logs or log messages generated by dedicated software tools, often at OS level[OS07, Bar08, XHJ10]. In this way there is not a general and uniform detection system and, moreover, deploying a set of different tools with different requirements still requires a lot of effort by the system administrators. This fact curbs the number and types of identifiable fault conditions with log-based tools.
However, today’s supercomputers and data centers have hardware components with sensors to monitor physical and architectural parameters [BBCB17, BBL+18, ABBeA14, BCCeA14]. The integrated monitoring infrastructure periodically reads a set of metrics and collects them into a single gathering point. The authors of [BBCB17] show that these sensors can easily reach 1.5KSa/s per compute node, and propose Examon, a scalable infrastructure based on local monitoring agents pushing data through the MQTT protocol. Clearly, local software-based monitoring agents compete for the same computational resources of users’ applications. The authors of [LBB18, BBL+18] propose out-of-band monitoring through edge computing devices, thus without impacting users-dedicated computing resources. In this approach, an external embedded device is inserted in the node, and it monitors the architectural and physical sensors through a dedicated interface [Ros15].
It seems a sensible idea to use the collected data to look for possible unhealthy situations. For example, a possible approach relies in supervised Machine Learning (ML) techniques, where a classifier is trained to distinguish between healthy and abnormal behaviours. In recent years, some approaches went in this direction, showing promising results but with a somewhat limited scope. For instance, supervised methods need a carefully prepared initial phase where the supercomputer is injected with all the kinds of faults to be detected later. This is clearly a strong drawbacks because it does not encompass the occurrence of new, unseen anomalies.
In this paper we propose a novel automated method for anomaly detection in HPC systems and data centers, based on a technique derived from the Machine Learning (ML) area, namely a type of neural network called autoencoder. The method we propose has a very good accuracy (around 90%-95% of detection accuracy) and can be directly executed in the edge, exploiting monitoring devices embedded inside each computing node, guaranteeing real time performance and no overhead. We demonstrate this approach on a real tier-1 supercomputer in production.
2 Related Works
Tuncer et al. [TAZ+17] tackles the issue of diagnosing performance variations in HPC systems. They collect several measurements through a monitoring infrastructure; a group of statistical features modeling the state of the supercomputer is obtained from these features. The authors then train different ML algorithms to classify the behaviour of the supercomputer using the statistical features. The results are promising, outperforming previous state-of-the art[BGF+10, LZL10]. Baseman et al. [BBD+16] propose a similar technique for anomaly detection in HPC systems. They apply a general statistical technique called classifier-adjusted density estimation (CADE) in order to help the training of a supervised Random Forest classifier. The classifier decides the class (normal, anomaly, etc) of each data point (set of physical measurements).
These methods both belong to the supervised area: the training set must contain examples of all classes to be detected, e.g. examples of normal and abnormal states, and must be unbiased (equal number of examples for each class). This fact has a consequence: a first phase is required in order to create a labeled data set and the supercomputer must be injected with faults. Furthermore, supervised classifiers only learn to identify the classes already seen at training time; unseen anomalies encountered at run time cannot be properly detected by this methods. Our approach, thanks to the semi-supervised learning, resolves both these issues.
Dani et al. [DDA17] describe instead an unsupervised technique for anomaly detection in HPC. Their work is very different from our approach since they consider only the console logs generated by computing nodes (no monitoring infrastructure). Their purpose is to distinguish logs relative to faulty conditions from logs created by healthy nodes; the proposed approach uses the K-means clustering algorithm. Their work targets faults that can be recognized by a node itself and stored in log messages; this bounds the number and the types of detectable anomalies. Conversely, in our approach we detect anomalies using the data gathered via a collection framework, without need for anomaly detection systems already deployed on computing nodes.
3 A Methodology for Automated Anomaly Detection
In this paper we propose a system-oriented methodology to automatically detect anomaly based on a ML model and relying on the data collected by a monitoring infrastructure. The proposed scheme is depicted in Figure 1. The supercomputer/data center nodes are endowed with embedded boards that measure a set of fine-grained metrics describing the system behaviour. Thanks to these measurements it is possible to distinguish between anomalous and normal conditions.
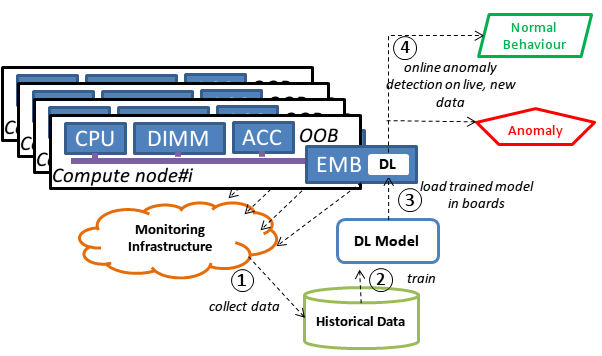
Data collected with the monitoring framework is fed to a ML model in order to train it to detect anomalies. During the training phase the model is going to encounter only examples describing a system under normal conditions. After the training phase, the ML models are loaded on the embedded monitoring boards (EMB in the figure); when new measurements arrive, the trained ML model takes them as input and can identify anomalies, triggering an alarm for system admins. Since the embedded boards do not possess great computing capability, the ML model must be lightweight and generate low overhead.
The benefits of edge computing (placing the anomaly detection module in the embedded boards) is twofold: 1) the board can directly read the out-of-band sensors measurements, reducing the access time (furthermore, in-band monitoring is not allowed on many systems since it could affect stability); 2) online inference could not be easily performed on the computing nodes of a HPC system since it would subtract resources from users and complicate the scheduling process.
3.1 Target Supercomputer & Monitoring Framework
As a test bed for our approach we used a supercomputer [ABB+17]. which was ranked in the late hundreds of the TOP500[DMS94b] and among the twenty first positions of the GREEN500[FC07] in the November 2017 list. It is a supercomputer based on OpenPOWER platform and this allowed us the out-of-band monitoring employed by our approach. The system comprises 45 nodes connected with Infiniband EDR network, with a total peak performance of and an estimated power consumption of less than per node. Each node is a 2 Open Unit (OU) Open Compute Project (OCP) form factor and hosts two IBM POWER8 Processors with NVIDIA NVLink and four Tesla P100 data center GPUs, with the intra-node communication layout optimized for best performance.
On the target supercomputer we developed and deployed a lightweight and scalable monitoring infrastructure, namely DiG (Dwarf in a Giant) [LBB18, BBL+18]. Data coming from heterogeneous sources is gathered with a high sampling rate and placed in common storage area; this allow to easily retrieve historical data to be used for training purposes. The collected data is stored in a distributed time series database (KairosDB [kai]), built on top of a NoSQL database Apache Cassandra [Cas15] The framework comprises a set of agents running on the edge of computing nodes, using embedded measuring boards. These agents monitor the power consumption of each node at the plug as well as performance and utilization metrics, using both software commands and hardware sensors. The measured values are sent to a data management backbone (namely ExaMon [BBCB17]), through a communication layer based on the open-source MQTT (MQ Telemetry Transport) protocol [Sta14], which is designed for low bandwidth, high latency networks and minimal resource demands.
To measure the power consumption with high resolution, the monitoring agents exploit a power sensing module and an embedded monitoring board (Beaglebone Black - BBB [Col13]), one for each node. The BBBs are based on an Arm Cortex-A8, and include a 12-bit ADC which allows sampling rates up to 50k samples per second and synchronization of the measurements within one microsecond, thanks to the hardware support of the Precision Time Protocol (PTP) [LBMB16, LBCB04]. For an out-of-band monitoring of the nodes performance we use the IBM Amester commands, which exploit the IPMI interface[Sla03] to the OpenPOWER POWER8 on-chip controller[Ros15] (OCC), to get OCC sensor readings. The IPMI Amester commands are sent to the OCC, through the Board Management Controller (BMC), using a python script. The python script executes on the embedded monitoring board. The granularity of the data is 5s and 10s, respectively for IPMI metrics and OCC metrics.
4 Experimental Evaluation
As ML model to detect anomalies, we propose an approach based on a particular type of neural network called autoencoder[GBCB16]. We exploit the series of measurements (features) describing the state of the HPC system or data center and collected with the ad-hoc monitoring infrastructure. Under “healthy” operating conditions these features are connected by specific relationships (i.e. the power consumption directly depends on the workload, temperature is related to the clock frequency, etc.). These correlations are no longer valid when the system enters an anomalous state. The main idea of our method relies on the autoencoder capability to learn the typical (normal) correlation between the measures and then consequently identify changes in this correlation that indicate an abnormal situation. This research avenue has been partially explored in recent years, although not in the HPC field[LWBL16, LCK17, CAG15, IKE+16, GSBB12]. We teach the autoencoder the normal behaviour of the computing nodes; after the training phase the autoencoder will be able to detect anomalous situations.
How can an autoencoder detect abnormal conditions? An autoencoder is a neural network trained to copy its input to its output . It has one or more internal layers that try to the represent the data taken as input. An autoencoder is split in two subparts: an encoding function and a decoding function that reconstructs the input . Typically, autoencoders do not just learn the identity function but are designed not to create perfect copies, e.g. the dimension of the hidden layer can be smaller than the dimension of the input. Thus, the output of an autoencoder is generally different from its input and the difference between input and output is called reconstruction error.
We take advantage of the reconstruction error in order to detect anomalies. We train the autoencoder with data corresponding to the normal state and minimize the reconstruction error; this error is called training error. In this way it learns the normal correlations between the features from the monitoring infrastructure. After this first training phase, we feed the autoencoder with new data unseen before – this is generally called inference in ML terminology – and we then observe the reconstruction error. If the new data is similar to the data used as input (if it respects the normal correlations) then the error will be small and comparable to the training error. If the new data correspond to an anomalous situation, the autoencoder will struggle to perform the reconstruction, since the learned correlations do not hold. Hence we identify anomalies by observing large reconstruction errors (w.r.t. to the training error) during the inference phase.
4.1 Autoencoders Training
We create an autoencoder for each node in the supercomputer since, as we will describe in Sec. 4.3, dedicated models for each node outperform a single, generic model to be applied to all nodes. Each network is trained using node related data collected by the monitoring infrastructure. In the training phase, we use only data corresponding to the normal state. The data set is a collection of a couple of hundreds of metrics, ranging from core load, frequency and temperature, to node power consumption, room temperature, GPUs usage, cooling fans speed, etc. The metrics (also referred to as features) form the input set for the neural networks.
For each node we have a training set corresponding to 2 months of normal behaviour (obtained in collaboration with system admins). Due to storage reason, the fine-grained monitoring data is not preserved for more than a week, hence for the training we use coarse-grained data, where the measurements are aggregated in five minute intervals. After collecting the raw data, we pre-process it (for example we removed data corresponding to periods where the monitoring system was not working properly) and normalize it. This preparation takes about 30s. The final number of features is 166.
We adopted the same network topology for each node. After an empirical evaluation we chose a sparse autoencoder model[BC+08], that proved to be the better option in terms of accuracy and computational demands, especially for training/inference times. The network is composed of three fully connected layers, an input layer, an output layer and one hidden layer. As activation function for the neurons we use Rectified Linear Units[NH10] (ReLU); as regularization term (needed in sparse networks) we employ the L1-norm loss function[AB14, GBCB16]. The input and the output layers have as many neurons as the number of the features (166) while the hidden-layer has ten times the number of features (thus 1660 in total).
Each autoencoder is trained with data from its corresponding node; for the training we use the Tesla P100 GPUs available in the supercomputer nodes (each node trains its own autoencoder). For the training phase we use use Adam algorithm[KB14], with mean absolute error as target loss. After some preliminary experiments we opted for a batch size equal to 32 and 100 epochs. The training takes around 20 seconds for each autoencoder. The training times and overhead are not a critical concern since the training phase takes place only once or with a very low rate (once every few months), and can be scheduled during maintenance periods. The framework used for the design and the training of the autoencoders is Keras [C+15] with TensorFlow for GPU[AABea15] as a back-end.
4.2 Online Inference
After training the autoencoders, we leverage the out-of-band monitoring system and the embedded monitoring boards (BBB) to execute the inference online and detect anomalies thanks to edge computing. We installed TensorFlow on the BBB and took advantage of the NEON accelerator (SIMD architecture). On each BBB we load the trained autoencoder of the corresponding node, then we feed it with new data coming from the monitoring framework. The results of the detection are presented in the following section. Here we want to point out that we process a batch of input data (the set of 166 features) in just 11ms, which is a negligible overhead considering the sampling rate of several seconds.
4.3 Results
We injected two different anomalies in the supercomputer used as test case: we changed the frequency governor configuration of the computing nodes (see[BG13] for details). Changing the frequency governor disrupts the relationships between core load and core frequency (and other related features, such as power consumption, etc.). This is a misconfiguration anomaly and should be detectable with our approach. The normal configuration is default; we changed it to powersave and performance, in different periods of time111default: the frequency of a core directly depends on its load; powersave/performance: frequencies are forced to the lowest/highest possible value. To evaluate the trained autoencoders we consider the reconstruction error. As described in Sec. 3 we expect to observe greater reconstruction errors during anomalous periods w.r.t. normal ones.
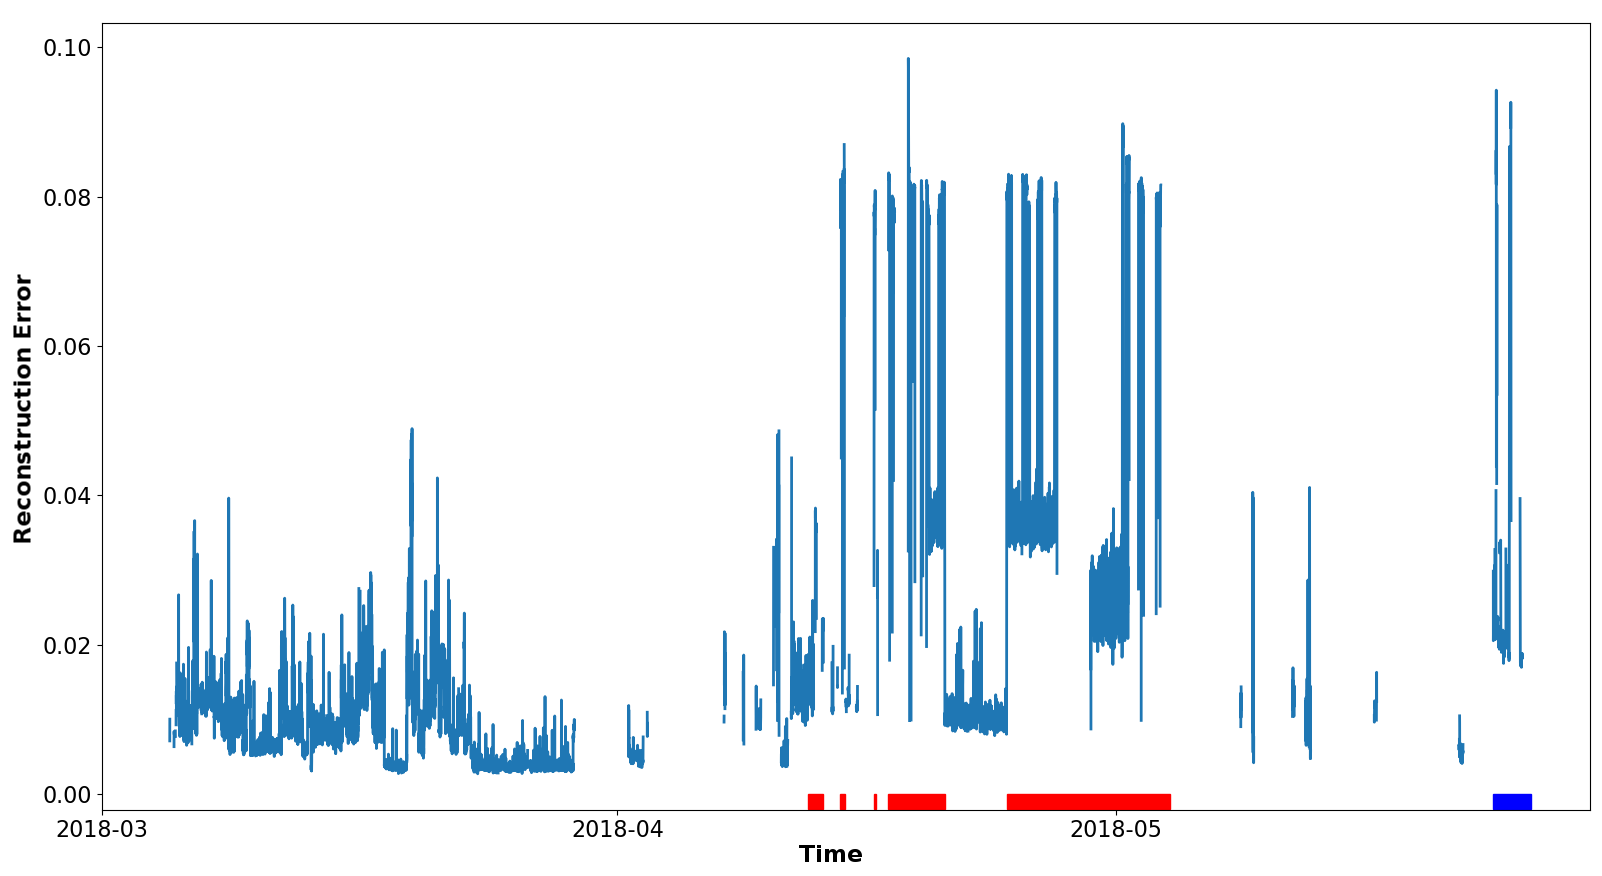
Our hypothesis is confirmed by quantitative and visual analysis of the reconstruction error. Figure 2 plots the reconstruction error (-axis) obtained in a roughly two months period (-axis), for a specific node. The reconstruction error trend is plotted with a light blue line; the gaps in the line represent periods when the node was idle and that have been removed from the data set (thus we exclude them from the reconstruction error). We have 6 anomalous periods, identified by colored highlights along the -axis: during the first 5 (red lines) the frequency governor was set to powersave, while during the last one (blue) the governor was set to performance. It is possible to see that, on average, the reconstruction error is definitely larger during anomalous periods compared to the normal ones. This observation is confirmed by a quantitative analysis performed on all nodes: the average normalized reconstruction error computed during normal periods (excluding the training set) is equal to 1.08, while the average error obtained during anomalies (grouping both types) is equal to 14.54. If we use a generic autoencoder for all nodes (instead of a series of dedicated ones), the error for the anomalous periods decreases to 6.29 while the error for normal periods remains similar (1.01). To detect anomalies we prefer reconstruction errors as large as possible with anomalous data, hence the set of dedicated models is better than the generic one.
Accuracy Evaluation. We use a threshold-based method to distinguish anomalies from normal states. Suppose we have a data point that contains features collected by the monitoring infrastructure. To classify it we feed it to the trained autoencoder: if the reconstruction error is greater than a threshold , then the point is “abnormal”; otherwise the data point is considered normal. As threshold we choose the -th percentile of the errors distribution of the normal data set, where is a value that depends on the specific autoencoder/node. To find the best for each autoencoder we employed a simple generate-and-test search strategy, that is we performed experiments with a finite number of values (after a preliminary empirical evaluation) and then chose those guaranteeing the best results in term of classification accuracy. The fact that the best results are obtained by using a different for each node validates the choice of having multiple dedicated autoencoders rather than a generic one.
The classification accuracy is measured by the F-score[VR79] for each class, normal (N) and anomaly (A). F-score ranges between 0 and 1, with higher values indicating higher accuracy. In Table 1 we see the results. In the first column there is the node name (we show the values for a subgroup of nodes). The remaining columns report the F-score values for 3 different -th percentiles; there are two F-score values for each -th percentile, one for the normal class (N) and one for the anomaly class (A). We can see that the F-score values are very good, highlighting the good accuracy of our approach, with an accuracy between 0.87 and 0.98.
| Node | 95-th perc. | 97-th perc. | 99-th perc. | |||
|---|---|---|---|---|---|---|
| N | A | N | A | N | A | |
| node17 | 0.97 | 0.89 | 0.98 | 0.93 | 0.99 | 0.97 |
| node19 | 0.97 | 0.90 | 0.98 | 0.94 | 0.99 | 0.97 |
| node45 | 0.97 | 0.92 | 0.98 | 0.95 | 0.99 | 0.98 |
| node29 | 0.97 | 0.75 | 0.98 | 0.82 | 0.99 | 0.85 |
| Average | 0.96 | 0.87 | 0.98 | 0.91 | 0.97 | 0.89 |
5 Conclusion
In this manuscript we have presented an approach for automated anomaly detection for large scale HPC environments and data centers. Our approach leverages Machine Learning and edge computing for real-time anomaly detection. We use autoencoders trained to learn the normal behavior of each computing node based on its historical telemetry data of ”good” behaviors. The autoencoders are trained and tested on a in-production supercomputer and deployed as an extension of the built-in embedded monitoring devices.
Acknowledgment
We want to thank CINECA and E4 for granting us the access to their systems. This work has been partially supported by the EU H2020 FET project OPRECOMP (g.a. 732631)
References
- [AABea15] Martín Abadi, Ashish Agarwal, Paul Barham, and et al. TensorFlow: Large-scale machine learning on heterogeneous systems, 2015. Software available from tensorflow.org.
- [AB14] Guillaume Alain and Yoshua Bengio. What regularized auto-encoders learn from the data-generating distribution. The Journal of Machine Learning Research, 15(1):3563–3593, 2014.
- [ABB+17] W. Abu Ahmad, A. Bartolini, F. Beneventi, L. Benini, A. Borghesi, M. Cicala, P. Forestieri, C. Gianfreda, D. Gregori, A. Libri, F. Spiga, and S. Tinti. Design of an energy aware petaflops class high performance cluster based on power architecture. In 2017 IEEE International Parallel and Distributed Processing Symposium Workshops (IPDPSW), pages 964–973, May 2017.
- [ABBeA14] A. Auweter, A. Bode, M. Brehm, and et Al. A case study of energy aware scheduling on supermuc. In JulianMartin Kunkel, Thomas Ludwig, and HansWerner Meuer, editors, Supercomputing, volume 8488 of Lecture Notes in Computer Science. Springer International Publishing, 2014.
- [Bar08] Wolfgang Barth. Nagios: System and network monitoring. No Starch Press, 2008.
- [BBCB17] Francesco Beneventi, Andrea Bartolini, Carlo Cavazzoni, and Luca Benini. Continuous learning of hpc infrastructure models using big data analytics and in-memory processing tools. In Proceedings of the Conference on Design, Automation & Test in Europe, pages 1038–1043. European Design and Automation Association, 2017.
- [BBD+16] Elisabeth Baseman, Sean Blanchard, Nathan DeBardeleben, Amanda Bonnie, and Adam Morrow. Interpretable anomaly detection for monitoring of high performance computing systems. In Outlier Definition, Detection, and Description on Demand Workshop at ACM SIGKDD. San Francisco (Aug 2016), 2016.
- [BBL+18] Andrea Bartolini, Andrea Borghesi, Antonio Libri, Francesco Beneventi, Daniele Gregori, Simone Tinti, Cosimo Gianfreda, and Piero Altoe. The D.A.V.I.D.E. big-data-powered fine-grain power and performance monitoring support. In Proceedings of the 15th ACM International Conference on Computing Frontiers, CF 2018, Ischia, Italy, May 08-10, 2018, pages 303–308, 2018.
- [BC+08] Y-lan Boureau, Yann L Cun, et al. Sparse feature learning for deep belief networks. In Advances in neural information processing systems, pages 1185–1192, 2008.
- [BCCeA14] A. Bartolini, M. Cacciari, C. Cavazzoni, and et Al. Unveiling eurora - thermal and power characterization of the most energy-efficient supercomputer in the world. In Design, Automation Test in Europe Conference Exhibition (DATE), 2014, March 2014.
- [BG13] Dominik Brodowski and Nico Golde. Cpu frequency and voltage scaling code in the linux (tm) kernel. Linux kernel documentation, 2013.
- [BGF+10] Peter Bodik, Moises Goldszmidt, Armando Fox, Dawn B Woodard, and Hans Andersen. Fingerprinting the datacenter: automated classification of performance crises. In Proceedings of the 5th European conference on Computer systems, pages 111–124. ACM, 2010.
- [C+15] François Chollet et al. Keras. \urlhttps://keras.io, 2015.
- [CAG15] Bruno Sielly Jales Costa, Plamen Parvanov Angelov, and Luiz Affonso Guedes. Fully unsupervised fault detection and identification based on recursive density estimation and self-evolving cloud-based classifier. Neurocomputing, 150:289–303, 2015.
- [Cas15] Apache Cassandra. Apache cassandra. Google Scholar, 2015.
- [Col13] Gerald Coley. Beaglebone black system reference manual. Texas Instruments, Dallas, 2013.
- [DDA17] Mohamed Cherif Dani, Henri Doreau, and Samantha Alt. K-means application for anomaly detection and log classification in hpc. In International Conference on Industrial, Engineering and Other Applications of Applied Intelligent Systems, pages 201–210. Springer, 2017.
- [DMS94a] J. J. Dongarra, H. W. Meuer, and E. Strohmaier. 29th top500 Supercomputer Sites. Technical report, Top500.org, November 1994.
- [DMS94b] J. J. Dongarra, H. W. Meuer, and E. Strohmaier. 29th top500 Supercomputer Sites. Technical report, Top500.org, November 1994.
- [FC07] Wu-chun Feng and Kirk Cameron. The green500 list: Encouraging sustainable supercomputing. IEEE Computer, 40(12), December 2007.
- [FLYeA16] Haohuan Fu, Junfeng Liao, Jinzhe Yang, and et Al. The sunway taihulight supercomputer: system and applications. Science China Information Sciences, 59(7), 2016.
- [GBCB16] Ian Goodfellow, Yoshua Bengio, Aaron Courville, and Yoshua Bengio. Deep learning, volume 1. MIT press Cambridge, 2016.
- [GSBB12] Moshe Gabel, Assaf Schuster, Ran-Gilad Bachrach, and Nikolaj Bjørner. Latent fault detection in large scale services. In Dependable Systems and Networks (DSN), 2012 42nd Annual IEEE/IFIP International Conference on, pages 1–12. IEEE, 2012.
- [IKE+16] Turker Ince, Serkan Kiranyaz, Levent Eren, Murat Askar, and Moncef Gabbouj. Real-time motor fault detection by 1-d convolutional neural networks. IEEE Transactions on Industrial Electronics, 63(11):7067–7075, 2016.
- [kai] Kairosdb a fast scalable time series database. \urlhttps://github.com/kairosdb/kairosdb. Accessed: 2018-07-02.
- [KB14] Diederik P Kingma and Jimmy Ba. Adam: A method for stochastic optimization. arXiv preprint arXiv:1412.6980, 2014.
- [LBB18] Antonio Libri, Andrea Bartolini, and Luca Benini. Dig: Enabling out-of-band scalable high-resolution monitoring for data-center analytics, automation and control. DAAC 2018, 2018. The 2nd International Industry/University Workshop on Data-center Automation, Analytics, and Control (DAAC 2018); Conference Location: Dallas, TX, USA; Conference Date: November 12, 2018.
- [LBCB04] Antonio Libri, Andrea Bartolini, Daniele Cesarini, and Luca Benini. Evaluation of ntp/ptp fine-grain synchronization performance in hpc clusters. 2018-11-04. 2nd Workshop on AutotuniNg and aDaptivity AppRoaches for Energy efficient HPC Systems (ANDARE 2018); Conference Location: Limassol, Cyprus; Conference Date: November 4, 2018.
- [LBMB16] A. Libri, A. Bartolini, M. Magno, and L. Benini. Evaluation of synchronization protocols for fine-grain hpc sensor data time-stamping and collection. In 2016 International Conference on High Performance Computing Simulation (HPCS), pages 818–825, July 2016.
- [LCK17] Ki Bum Lee, Sejune Cheon, and Chang Ouk Kim. A convolutional neural network for fault classification and diagnosis in semiconductor manufacturing processes. IEEE Transactions on Semiconductor Manufacturing, 30(2):135–142, 2017.
- [LWBL16] Feiya Lv, Chenglin Wen, Zejing Bao, and Meiqin Liu. Fault diagnosis based on deep learning. In American Control Conference (ACC), 2016, pages 6851–6856. IEEE, 2016.
- [LZL10] Zhiling Lan, Ziming Zheng, and Yawei Li. Toward automated anomaly identification in large-scale systems. IEEE Transactions on Parallel and Distributed Systems, 21(2):174–187, 2010.
- [NH10] Vinod Nair and Geoffrey E Hinton. Rectified linear units improve restricted boltzmann machines. In Proceedings of the 27th international conference on machine learning (ICML-10), pages 807–814, 2010.
- [OS07] Adam Oliner and Jon Stearley. What supercomputers say: A study of five system logs. In Dependable Systems and Networks, 2007. DSN’07. 37th Annual IEEE/IFIP International Conference on, pages 575–584. IEEE, 2007.
- [Ros15] Todd Rosedahl. On chip controller (occ) overview. Technical report, Tech. rep, 2015.
- [Sla03] Tom Slaight. Using ipmi platform management in modular computer systems. In Intel Corporation, Intel Developer Forum, 2003.
- [Sta14] OASIS Standard. Mqtt version 3.1. 1. URL http://docs. oasis-open. org/mqtt/mqtt/v3, 1, 2014.
- [TAZ+17] Ozan Tuncer, Emre Ates, Yijia Zhang, Ata Turk, Jim Brandt, Vitus J Leung, Manuel Egele, and Ayse K Coskun. Diagnosing performance variations in hpc applications using machine learning. In International Supercomputing Conference, pages 355–373. Springer, 2017.
- [VR79] CJ Van Rijsbergen. Information retrieval. dept. of computer science, university of glasgow. URL: citeseer. ist. psu. edu/vanrijsbergen79information. html, 14, 1979.
- [XHJ10] Wei Xu, Ling Huang, and Michael I Jordan. Experience mining google’s production console logs. In SLAML, 2010.