The 2018 X-ray and Radio Outburst of Magnetar XTE J1810197
Abstract
We present the earliest X-ray observations of the 2018 outburst of XTE J1810197, the first outburst since its 2003 discovery as the prototypical transient and radio-emitting anomalous X-ray pulsar (AXP). The Monitor of All-sky X-ray Image (MAXI) detected XTE J1810197 immediately after a November 20–26 visibility gap, contemporaneous with its reactivation as a radio pulsar, first observed on December 8. On December 13 the Nuclear Spectroscopic Telescope Array (NuSTAR) detected X-ray emission up to at least 30 keV, with a spectrum well-characterized by a blackbody plus power-law model with temperature keV and photon index or by a two-blackbody model with keV and keV, both including an additional power-law component to account for emission above 10 keV, with and , respectively. The latter index is consistent with hard X-ray flux reported for the non-transient magnetars. In the 210 keV bandpass, the absorbed flux is erg s-1 cm-2, a factor of 2 greater than the maximum flux extrapolated for the 2003 outburst. The peak of the sinusoidal X-ray pulse lags the radio pulse by cycles, consistent with their phase relationship during the 2003 outburst. This suggests a stable geometry in which radio emission originates on magnetic field lines containing currents that heat a spot on the neutron star surface. However, a measured energy-dependent phase shift of the pulsed X-rays suggests that all X-ray emitting regions are not precisely co-aligned.
Subject headings:
pulsars: general — pulsars: individual (XTE J1810197) — stars: neutron — X-rays: stars1. INTRODUCTION
Magnetars are neutron star (NS) pulsars whose X-ray luminosity can greatly exceed their spin-down power. Unlike for the canonical rotation-powered radio pulsars, the luminosity of magnetars is thought to be supplied by the decay of their large magnetic fields, typically G. The dipole field components result in rapid spin-down and long rotation periods in the 0.3–12 s range. The discovery of XTE J1810197 (Ibrahim et al., 2004; Gotthelf et al., 2004) marked a turning point in the study of magnetars. Until then, the known magnetars comprised four transient soft gamma-ray repeaters (SGRs), and five persistent anomalous X-ray pulsars (AXPs) detected by UHURU, Einstein, or ROSAT. The two classes shared similar magnetic field strengths and spin periods but had different long-term histories. The SGRs had rare, violent outbursts, while the AXPs were fairly steady emitters. See recent reviews by Kaspi & Beloborodov (2017); Esposito, Rea & Israel (2018); Coti Zelati et al. (2018).
XTE J1810197 was the first recognized transient AXP, detected in outburst in 2003 with a period of 5.54 s at a flux level 140 times higher than its quiescent state as a previously anonymous ROSAT source. It decayed roughly as a day exponential. A VLA survey in 2004 serendipitously detected a point source at the position of XTE J1810197 (Halpern et al., 2005); subsequently pulsed radio emission was searched for and detected for the first time in a magnetar (Camilo et al., 2006). Until then it had been theorized that high magnetic fields inherently suppressed radio pulsations. On the contrary, XTE J1810197 was a bright transient radio pulsar, but with a flatter spectrum than ordinary pulsars, such that it was the brightest neutron star known at frequencies above 20 GHz. Three more transient magnetars have been detected as radio pulsars with similar properties (Camilo et al., 2007a; Levin et al., 2010; Shannon & Johnston, 2013; Eatough et al, 2013).
Meanwhile, short SGR-like bursts had also been discovered from AXPs (Gavriil et al, 2002; Kaspi et al., 2003), reinforcing the connection between the two magnetar classes. Similar bursts were detected during the decay of XTE J1810197 (Woods et al., 2005). Beginning with the launch of Swift/BAT, transient magnetars have been discovered on a regular basis, each outburst signaled by one or more short SGR-like bursts. There are now a total of 23 confirmed magnetars111http://www.physics.mcgill.ca/pulsar/magnetar/main.html. Interestingly, no new persistent ones have been discovered since 2007, suggesting that most magnetars are transient.
XTE J1810197 provides a crucial probe of NS surface physics because of its relatively close distance (34 kpc Minter et al., 2008; Durant & van Kerkwijk, 2006) and continuing quiescent emission, not detected in most other transient magnetars. This allows the evolving spectrum and pulse profiles of XTE J1810197 to be modeled (Perna & Gotthelf, 2008; Albano et al., 2010; Bernardini et al., 2011), mapping the magnetar’s cooling and shrinking surface thermal hot spots, presumably powered by currents along the untwisting magnetic field-line bundles (“j-bundles”, Beloborodov, 2009, 2013).
In the following sections we present the first X-ray observations of XTE J1810197 during its 2018 outburst. MAXI all-sky monitoring data constrains the epoch of the outburst, and a timely NuSTAR observation within weeks of the onset characterizes its early spectrum in the 330 keV band. A comparison of the X-ray pulse phase with a contemporaneous radio pulse observation is also made. We discuss our results in the context of the previous outburst and future expectations.
2. X-ray Observations
The reports of intense radio emission (Lyne et al., 2018; Desvignes et al., 2018; Lower et al., 2018) and enhanced X-ray flux (Mihara et al., 2018) from XTE J1810197 signaled a new outburst from this magnetar that had occurred sometime between 2018 October 26 and December 8 (radio) and between 2018 November 20–26 (X-ray; this work). Based on the Lyne et al. (2018) discovery, we initiated a NuSTAR Director’s Discretionary Time observation of the magnetar. Preliminary NuSTAR results were reported in Gotthelf et al. (2018) using a subset (50%) of the data. In the current work, we analyze the complete NuSTAR observation of XTE J1810197, along with the MAXI all-sky monitoring light curve, to determine its early outburst spectral and temporal properties.
In the following study, all spectra for XTE J1810197 are fitted using XSPEC v12.10.0c software (Arnaud 1996) with the column density characterized by the default TBabs absorption model. Spectral uncertainties are computed for the 90% confidence level for two interesting parameters unless otherwise noted. For the timing analysis, photons arrival times were converted to the solar system barycenter using the radio coordinates and the JPL DE200 planetary ephemeris.
2.1. MAXI Results
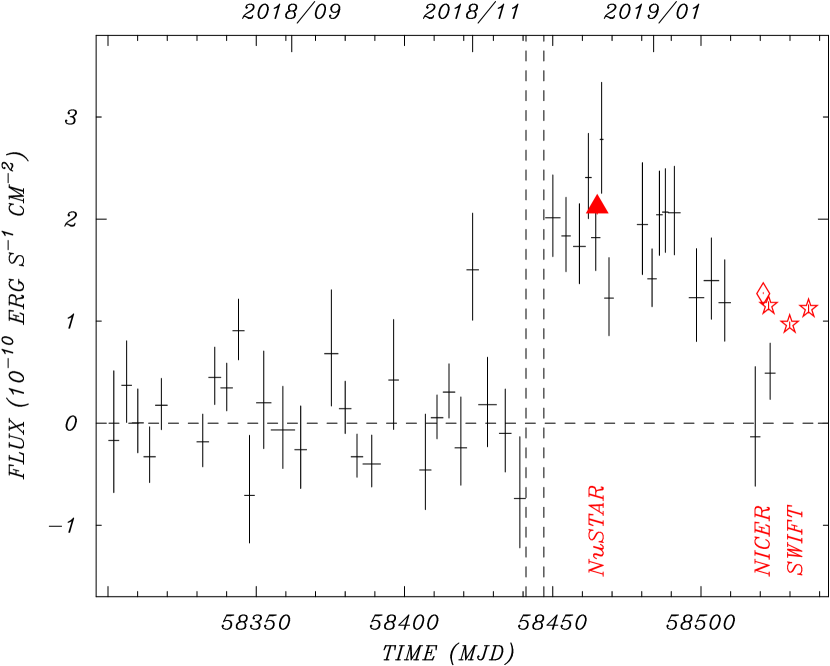
The MAXI observatory (Matsuoka et al., 2009) is attached to the International Space Station (ISS) and scans the sky 16 times a day during its 92 min orbit, using the Gas Slit Camera (GSC, Mihara et al., 2011) to build up images in the 230 keV band. Although XTE J1810197 is not a MAXI cataloged object (Hori et al., 2018), the region containing the magnetar was observed with the GSC as part of the MAXI Nova-Alert System program (Negoro et al., 2016). The region was observed before and after the reported radio event for 40140 s per scan, with data gaps due to Earth-block, ISS structure obscuration, SAA passages, and periods of high particle background. A light curve at the position of XTE J1810197 was extracted from stacked 1 day image scans using a radius aperture, excluding two slightly overlapping sources. Starting on November 26 (MJD 58448), we detect a significant increase in the 1 day count rates, following a 6 day gap that lacked reliable image data. During the interval MJD 58450 - 58498, the average 210 keV rate increased to s-1 cm-2, compared to the pre-outburst rate of s-1 cm-2. Figure 1 displays the 210 keV light curve in energy flux units, rebinned to obtain at least a detection over a maximum time span of 4 days. MAXI count rates were converted to flux units using the PIMMS222Portable, Interactive Multi-Mission Simulator; https://heasarc.gsfc.nasa.gov/docs/software/tools/pimms.html software, for a blackbody temperature of 0.7 keV, estimated from the average 410 keV/24 keV hardness ratio during the MJD 58450 - 58498 interval. We conclude that XTE J1810197 became active in X-rays sometime between November 20–26.
2.2. NuSTAR Observation
We obtained a 22 hour observation of XTE J1810197 starting on UT 2018 December 13 at 03:10:21 UT. At this time, NuSTAR was the only X-ray mission capable of imaging the source so close () to the Sun. A single source is detected in the field of view, with a count rate of 4.8 s-1 and flux up to at least 30 keV in the 379 keV band. Recovery of the expected 5.54 s NS spin period identifies the source as XTE J1810197 (see Section 2.3.3).
NuSTAR consists of two co-aligned X-ray telescopes, with corresponding focal plane detector modules FPMA and FPMB, each of which is composed of a -node CdZnTe sensor array (Harrison et al., 2013). These are sensitive to X-rays in the 379 keV band, with a characteristic spectral resolution of 400 eV FWHM at 10 keV. The multi-nested foil mirrors provide FWHM ( HPD) imaging resolution over a field-of-view (Harrison et al., 2013). The nominal timing accuracy of NuSTAR is 2 ms rms, after correcting for drift of the on-board clock, with the absolute timescale shown to be better than ms (Mori et al., 2014; Madsen et al., 2015). This is more than sufficient to resolve the X-ray signal from XTE J1810197 and to compare it to the radio pulse.
| Model | Parameter |
|---|---|
| Two-blackbody Model with Hard Power-law | |
| ( cm-2) | (fixed) |
| (keV) | |
| (keV) | |
| BB1 Flux (210 keV)aaAbsorbed flux in units of erg cm-2 s-1, averaged FPMA & FPMB values. | |
| BB2 Flux (210 keV)aaAbsorbed flux in units of erg cm-2 s-1, averaged FPMA & FPMB values. | |
| PL Flux (210 keV)aaAbsorbed flux in units of erg cm-2 s-1, averaged FPMA & FPMB values. | |
| PL Flux (230 keV)aaAbsorbed flux in units of erg cm-2 s-1, averaged FPMA & FPMB values. | |
| Total Flux (210 keV)aaAbsorbed flux in units of erg cm-2 s-1, averaged FPMA & FPMB values. | |
| (bol) (erg s-1)bbLuminosity is computed for a distance of kpc. | |
| (bol) (erg s-1)bbLuminosity is computed for a distance of kpc. | |
| BB1 Area (cm2) | |
| BB2 Area (cm2) | |
| (dof) | 1.04(250) |
| Power-law + Blackbody Model with Hard Power-law | |
| ( cm-2) | (fixed) |
| (keV) | |
| BB Flux (210 keV)aaAbsorbed flux in units of erg cm-2 s-1, averaged FPMA & FPMB values. | |
| PLs Flux (210 keV)aaAbsorbed flux in units of erg cm-2 s-1, averaged FPMA & FPMB values. | |
| PLh Flux (210 keV)aaAbsorbed flux in units of erg cm-2 s-1, averaged FPMA & FPMB values. | |
| PLh Flux (230 keV)aaAbsorbed flux in units of erg cm-2 s-1, averaged FPMA & FPMB values. | |
| Total Flux (210 keV)aaAbsorbed flux in units of erg cm-2 s-1, averaged FPMA & FPMB values. | |
| (bol) (erg s-1)bbLuminosity is computed for a distance of kpc. | |
| BB Area (cm2) | |
| (dof) | 1.10 (250) |
Note. — Joint fits to FPMA & FPMB spectra with independent model normalizations. Uncertainties are 90% confidence for three interesting parameters.
The reconstructed NuSTAR coordinates are nominally accurate to (90% confidence level), however, a full aspect reconstruction is not possible for this observation due to the proximity of the Sun to the target. For this pointing, star tracker #4, which is co-aligned with the X-ray optics, was not available to recover the absolute aspect or to remove the image blur due to telescope mast motion. During the orbit, a cyclic combination of the other three star trackers was used to determine the attitude. As outlined below, we analyze data from each star tracker combination separately to help compensate for the mast motion.
This work uses the data made available via the NuSTAR ToO web page, which was processed and analyzed using FTOOLS 22Oct2018_V6.25 (NUSTARDAS 06Jul17_V1.8.0) with NuSTAR Calibration Database (CALDB) files of 2016 July 6. Event files were generated for each star tracker configuration using the split_sc option in nupipeline. The processed data was uncontaminated by solar wind events and provides a total of 36 ks of good exposure time.
2.3. The NuSTAR Analysis
To generate a NuSTAR spectrum for XTE J1810197, we analyzed data separately from the five available star tracker configurations for this observation, to allow for a noticeable shift in the source location on the focal plane, periodic on an orbit timescale. However, these star tracker configurations break each orbit into five pieces, adjacent in time, and the drift is not noticeable over these relatively short intervals. Thus, we computed the source centroid on a per orbit, per star tracker configuration basis, to center the extraction region based on the drift. This allows us to use a smaller extraction aperture of radius as compared to the radius of our previous analysis (Gotthelf et al., 2018), greatly reducing the relative background contribution in the source aperture at higher energies.
Although the NuSTAR image of XTE J1810197 contained no other sources, there are regions on the focal plane contaminated by stray light. In particular, stray light from nearby GX 91 partially overlaps the source region in the FPMA image. For each detector we determined a suitable background region and accounted for the contaminating fraction of stray light in the source region, where appropriate. In all, for each FPM, we generated 67 sets of source and background spectral files along with their response functions. The final summed/averaged FMPA and FPMB spectra and their response files were grouped to include at least 100 counts per channel and fitted to several spectral models of interest, as described below. For these fits, the absorption column is not well-constrained in the NuSTAR energy band and is held fixed to a nominal cm-2.
2.3.1 The keV NuSTAR Spectrum
To compare to the early results for the 2003 outburst of XTE J1810197, obtained on 2003 September 8 using XMM-Newton (Halpern & Gotthelf, 2005), we fit the NuSTAR spectrum in the restricted 310 keV band. A blackbody plus power-law model yields a best-fit temperature keV and photon index , with for 234 degrees-of-freedom (DoF), comparable, but hotter and harder than that found for the 2003 outburst ( keV, ), consistent with the present detection being at an earlier phase. The absorbed flux of erg s-1 cm-2, however, is a factor of 2 greater than the projected maximum flux of erg s-1cm-2 for the 2003 outburst (Gotthelf & Halpern, 2007). For the estimated distance of 3.5 kpc to XTE J1810197, the higher bolometric luminosity of erg s-1 implies a blackbody area of cm2, substantially larger than that measured 8 months into the previous outburst.
In contrast, a perhaps more realistic two-blackbody model, also fitted in the 310 keV band, yields much higher temperatures of keV and keV ( for 234 Dof) as compared to the prior outburst ( keV and keV). The absorbed flux is for this model. The bolometric luminosity are erg s-1 and erg s-1, with implied areas of cm2 and cm2. Another physically motivated model is the Comptonized blackbody, with best-fit parameters keV and ( for 238 Dof). Specifically, we use the model described in Halpern et al. (2008), where is the log ratio of the scattering optical depth over the mean amplification of photon energy per scattering, valid for (Rybicki & Lightman, 1986).
2.3.2 The 330 keV NuSTAR Spectrum
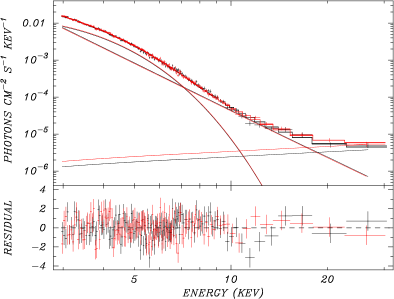
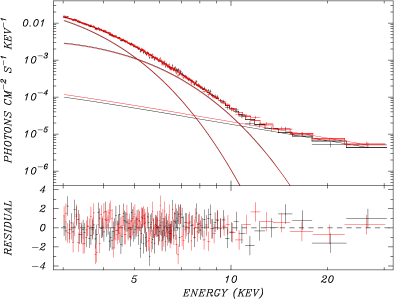
The low background contamination of the NuSTAR data set allows us to model the spectrum up to 30 keV before running out of source photons. None of the two-component models alone can account for significant emission evident above 10 keV. To characterize this non-thermal emission we fit an additional power-law component to both the blackbody plus power-law model and the two-blackbody model described above. As shown in Figure 2, this yields an excellent fit for both models. The resulting best-fit parameters, presented in Table 1, are comparable to those obtained with the 310 fits, unchanged within their mutual 90% confidence levels. We note that the two-blackbody model yield a photon index of for the added power-law component, a value typical of the non-transient magnetars. For the blackbody plus power-law model, however, the index in not well constrained, and yields an index of , much flatter then might be expected (cf. Enoto et al, 2017).
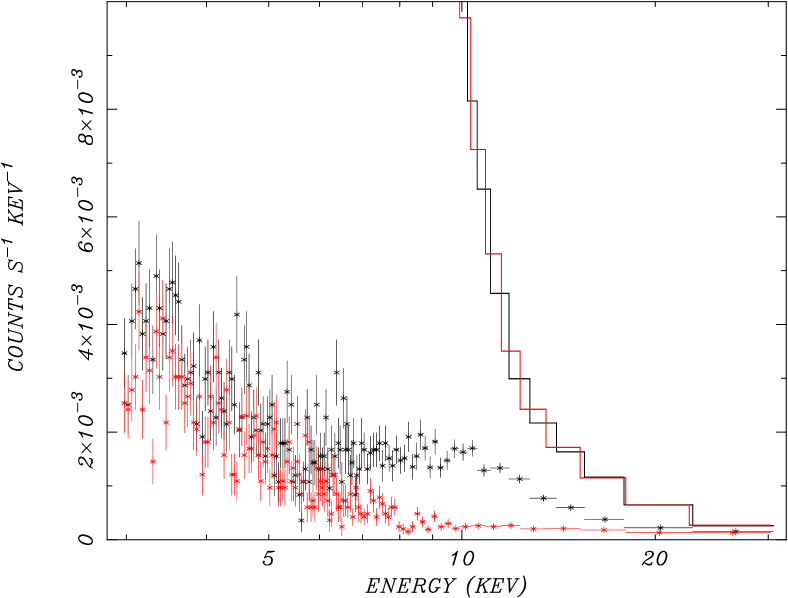
We are confident in the need for an additional spectral component to characterize the 10 keV emission, as both FPM detectors yield consistent results when fitted independently, despite the greater contamination in the FPMA spectrum due to stray light from GX9+1, as evident in Figure 3.
2.3.3 Pulsar Timing
To search for the expected pulsar signal from XTE J1810197, we extracted and merged barycentered photons from both FPMs using a radius aperture centered on the source, again compensating for the telescope mast motion as described above. Using the statistic, we recover a highly significant signal with s at MJD 58465.14 in the 310 keV energy range, leaving no doubt as to the identity of the NuSTAR source, despite its poor aspect. The resulting pulse profile is nearly sinusoidal in shape, similar to that recorded by XMM-Newton during the previous outburst. However, the pulse modulation, determined by fitting a sinusoidal model to the background subtracted pulse profile, is lower by half (e.g. 21% vs. 46% at 3 keV). The modulation is defined here as the ratio of the sine amplitude to the average counts per fold bin.
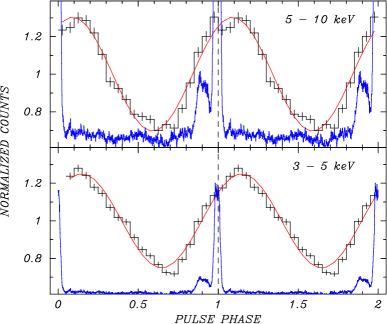
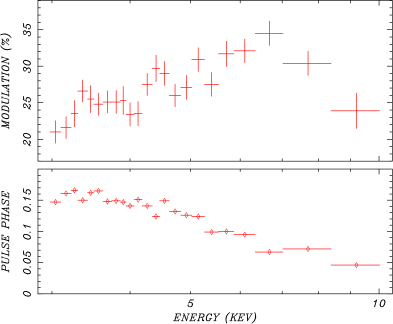
The pulse profile in the 35 keV and 510 keV bands is shown in Figure 4 (left) to highlight the clear shift in phase () between the two bands, accounting for at least some of the asymmetry in the broad-band pulse profile. This is most evident in Figure 4 (right), which displays the phase as a function of energy, suggesting that the emission components are not strictly co-axial. This figure also shows that the pulse modulation increases linearly with energy, turning over above 7 keV, notably near the spectral component cross-over energy in Figure 2. Within the short NuSTAR exposure, we find no evidence for bursts on second timescales, as were detected by RXTE during the earlier outburst (Woods et al., 2005).
Radio pulse observations bracketing the epoch of the NuSTAR observation were obtained by Dai et al. (2019) using the Parkes Telescope with the Ultra-Wideband Low receiver system (UWL, Hobbs et al. 2019), covering a frequency range of 704–4032 MHz, and by Lower et al. (2019) using the upgraded Molonglo Observatory Synthesis Telescope (UTMOST, Bailes et al., 2017). These were were used to develop an ephemeris that will be reported in Lower et al. (2019). In Figure 4 (left), the X-ray photons were folded on the radio ephemeris. A radio pulse profile from Dai et al. (2019) that was obtained 2 days after the X-rays is shown in its absolute phase relation to the X-rays. The peak of the X-rays lags the radio pulse by cycles.
Beginning in 2009, after pulsed radio emission turned off, the spin-down rate of XTE J1810197 was very stable through 2018 (Camilo et al., 2016; Pintore et al., 2019). This enables us to extrapolate the Pintore et al. (2019) ephemeris to the epoch of the current observations. The predicted period at the NuSTAR epoch is 5.54146404(74), significantly larger than the NuSTAR measured value. This suggests that a large glitch occurred in conjunction with the (unobserved) onset of the outburst in late November. The radio ephemeris give a more precise period than NuSTAR, and it suggests a glitch magnitude of , which is typical of large glitches observed in AXPs (Dib & Kaspi, 2014). This is probably a lower limit on the instantaneous glitch magnitude as it does not take into account any recovery due to an increase in period derivative between the epoch of the glitch and that of the first radio observation.
3. Discussion
During the long decay from its 2003 outburst, XTE J1810197 was monitored closely, revealing an evolving X-ray spectrum (Gotthelf & Halpern, 2007), its turn-off as a radio pulsar in 2008 (Camilo et al., 2016), its transition to X-ray quiescence in 2009 (Alford & Halpern, 2016; Pintore et al., 2016), and finally, steady spin-down until 2018 (Pintore et al., 2019). The first detailed X-ray results for the 2018 outburst, reported herein, show similarities to this original event in terms of X-ray flux, spectrum, and pulse properties. However, the NuSTAR observation was obtained at an earlier phase in the outburst, within 2-3 weeks of the onset, compared to the 2003 event, when the first comparably useful XMM-Newton observations came 8–10 months after onset.
From spectral fits to XTE J1810197 using the blackbody plus power-law model, the higher bolometric luminosity measured within weeks of the current outburst results in a larger blackbody area compared to those of the 2003 outburst. Both increases are consistent with catching the outburst at an earlier epoch. The blackbody temperature is also consistent with that reported for the 2003 outburst, when it remained constant for a year before fading linearly (Gotthelf & Halpern, 2007). However, for the two-blackbody model, one of temperatures differ significantly from those reported for the 2003 outburst. Either the two temperatures are twice as hot as previously recorded or an additional smaller, hotter emitting region is dominating the spectrum. The availability of NuSTAR broadband X-ray image spectroscopy for the current outburst reveals a hard spectral component above 10 keV not measurable during the prior outburst, either due to its disappearance a year into the event or for lack of sensitivity in the RXTE scan data at the time.
The measured spectral index favors the two-blackbody model yielding a value that is similar to that found for a typical magnetar, although the index measured using the alternative blackbody plus power law model is not well constrained. However, two concentric thermal hot spots, as modeled for the 2003 outburst data (Perna & Gotthelf, 2008), is more consistent with the Beloborodov (2009) j-bundle picture in which the hot footpoint is surrounded by a warm X-ray emitting area. Future NuSTAR observations will help determine if the hard component is persistent.
The NuSTAR pulse properties differ from those observed during the previous outburst. Although the linear increase in modulation with energy is also evident at the earlier epoch, with roughly the same slope, the modulation for the newer data is half of that measured in 2003. This might be due to the larger area of the present emitting region, additional flux from the whole NS surface, or a different location of the emitting region during this early epoch of the 2018 outburst. The energy dependence of the modulation and phase shift of the pulse profile also suggests that the spectral components are currently not precisely co-aligned, as inferred during the previous outburst (Gotthelf & Halpern, 2005). This may be transitory, as no phase shift with energy is evident following the 2003 outburst.
Unlike for the 2003 outburst, for which no regular radio monitoring was done until years after the X-ray event (Halpern et al., 2005; Camilo et al., 2006), intense radio pulsations heralded the onset of the current X-ray outburst. Given the sensitivity of the sparse VLA observations at the location of XTE J1810197 compiled by Halpern et al. (2005), it is entirely possible that radio pulsations did commence in concert with the 2003 X-ray outburst. The current outburst behavior further supports such a scenario. Pulsar timing before and after the outburst also suggests that a glitch occurred in concert with the reactivation. This would not have been known of the 2003 outburst, as the pulsar was previously undiscovered. It is yet to be determined if the radio emission will fade smoothly, as for the 2003 outburst, or turn and off at intervals during the X-ray decay, as is found for other transient radio magnetars.
Unlike ordinary pulsars, it is not known if radio emission from magnetars occurs on relatively stable, open dipole field lines, or on twisted, closed magnetic field-line j-bundles that conduct large currents and heat the NS surface to X-ray temperatures. Also, since outbursts can be triggered by crustal fractures, it is not clear that each new outburst must originate at the same location on the star. The radio phase relationship to the X-ray pulse, and the polarization swing of the radio pulse, may constrain the geometry and location of the emission regions as was attempted in Camilo et al. (2007b) and Kramer et al. (2007). More than 3 years after the 2003 outburst, the phase alignment of the X-ray and radio pulse were compared in Camilo et al. (2007b), showing that their peaks almost coincide, with the X-ray lagging the radio by cycles. With much better X-ray statistics early in the current outburst, we have established that the X-ray pulse lags the radio peak by cycles, consistent with their behavior in the 2003 outburst. This suggests that the macroscopic geometry of the magnetic field associated with the emission did not change between outbursts.
One way to get a lag of the X-rays is for the radio emission to come from closed magnetic field lines on which there are currents heating the surface. In this case, the beaming of the radio emission along the curved magnetic field lines could account for the lag. Alternatively, if the radio emission comes from open field lines, at heights comparable to the radius of the light cylinder, then an X-ray lag would be expected from both light travel time effects and relativistic aberration. In the current outburst it is not yet possible to model the magnetic geometry and viewing angle using the rotating vector model of radio polarization. The early radio emission is highly erratic in degree and direction of polarization (Dai et al., 2019). If the radio flux persists, its polarization may settle down to allow the locations of the radio and X-ray emitting regions to be examined and compared to the results of the 2003 outburst. The role of open field lines versus closed field lines as the location of radio emission in magnetars, can be investigated well using XTE J1810197, and is an important subject of exploration during the current outburst.
References
- Albano et al. (2010) Albano, A., Turolla, R., Israel, G. L., et al. 2010, ApJ, 722, 788
- Alford & Halpern (2016) Alford, J. A. J., & Halpern, J. P. 2016, ApJ, 818, 122
- Arnaud (1996) Arnaud, K. A. 1996, in ASP Conf. Ser. 101, Astronomical Data Analysis Software and Systems V, ed. G. Jacoby & J. Barnes (San Francisco: ASP), 17
- Bailes et al. (2017) Bailes, M., Jameson, A., Flynn, C. et al. 2017, PASA, 34, 45
- Beloborodov (2009) Beloborodov A. M. 2009, ApJ, 703, 1044
- Beloborodov (2013) Beloborodov A. M. 2013, ApJ, 762, 13
- Bernardini et al. (2009) Bernardini, F., Israel, G. L., Dall’Osso, S., et al. 2009, AAP, 498, 195
- Bernardini et al. (2011) Bernardini, F., Perna, R., Gotthelf, E. V., et al. 2011, MNRAS, 418, 638
- Camilo et al. (2006) Camilo, F., Ransom, S. M., Halpern, J. P., et al. 2006, Natur, 442, 892
- Camilo et al. (2007a) Camilo, F., Ransom, S. M., Halpern, J. P., Reynolds, J. 2007a, ApJ, 666, L93
- Camilo et al. (2007b) Camilo, F., Cognard, I., Ransom, S. M., et al. 2007b, ApJ, 663, 497
- Camilo et al. (2016) Camilo, F., Ransom, S. M., Halpern, J. P., et al. 2016, ApJ, 820, 110
- Coti Zelati et al. (2018) Coti Zelati, F., Rea, N. Pons, J. A., Campana, S., Esposito, P. 2018, MNRAS, 474, 961
- Dai et al. (2019) Dai, S., Lower, M. E., Bailes, M., et al. 2019, ApJ, submitted, arXiv:1902.04689
- Desvignes et al. (2018) Desvignes, G., Eatough, R., Kramer, M., et al. 2018, ATel, 12285
- Dib & Kaspi (2014) Dib, R., & Kaspi, V. M. 2014, ApJ, 7484, 37
- Durant & van Kerkwijk (2006) Durant, M., & van Kerkwijk, M. H. 2006, ApJ, 650, 1070
- Eatough et al (2013) Eatough, R. P., Falcke, H., Karuppusamy, R. et al. 2013, Nature, 501, 391
- Enoto et al (2017) Enoto T., Shibata, S., Kitaguchi, T., et al. 2017, ApJS, 231, 8
- Esposito, Rea & Israel (2018) Esposito, P., Rea, N. & Israel, G. L. 2018, arXiv:180305716
- Gavriil et al (2002) Gavriil, F. P., Kaspi, V. M.; Woods, P. M. 2002, Nature, 419, 142
- Gotthelf et al. (2004) Gotthelf, E. V., Halpern, J. P., Buxton, M., Bailyn, C. 2004, ApJ, 605, 368
- Gotthelf & Halpern (2005) Gotthelf, E. V., & Halpern, J. P. 2005, ApJ, 632, 1075
- Gotthelf & Halpern (2007) Gotthelf, E. V., & Halpern, J. P. 2007, APSS, 308, 79
- Gotthelf et al. (2018) Gotthelf, E. V., Halpern, J. P., Grefenstette, B. W. et al. 2018, ATel, 12297
- Güver et al. (2019) Güver, T. Majid, W., Enoto, T., et al. 2019, ATel, 12297
- Halpern & Gotthelf (2005) Halpern, J. P. & Gotthelf, E. V. 2005, ApJ, 618, 874
- Halpern et al. (2005) Halpern, J. P., Gotthelf, E. V., Becker, R. H., Helfand, D. J., & White, R. L. 2005, ApJL, 632, L29
- Halpern et al. (2008) Halpern, J. P., Gotthelf, E. V., Reynolds, J., Ransom, S. M., Camilo, F. 2008, ApJ, 676, 1178
- Harrison et al. (2013) Harrison, F. A., Craig, W. W., Christensen, F. E. et al. 2013, ApJ, 770, 103
- Hobbs et al. (2019) Hobbs, G., et al. 2019, in preparation
- Hori et al. (2018) Hori, T., Shidatsu, M., Ueda, Y., et al. 2018, ApJS, 235, 7
- Ibrahim et al. (2004) Ibrahim, A. I., Markwardt, C. B., Swank, J. H., et al. 2004, ApJL, 609, L21
- Kaspi et al. (2003) Kaspi, V. M., Gavrill, F. P., Woods, P. M., et al. 2003, ApJ, 588, L93
- Kaspi & Beloborodov (2017) Kaspi, V. M. & Beloborodov, A. .M 2017, ARA&A, 55, 261
- Kramer et al. (2007) Kramer,M., Stappers, B. W., Jessner, A., Lyne, A. G., & Jordan, C. A. 2007, MNRAS, 377, 107
- Levin et al. (2010) Levin, L., Bailes, M., Bates, S., et al. 2010, ApJL, 721, L33
- Lower et al. (2018) Lower, M., Bailes, M., Jameson, A, et al. 2018, ATel, 12288
- Lower et al. (2019) Lower, M., et al. 2019, in preparation.
- Lyne et al. (2018) Lyne, A., Levin, L., Stappers, B., et al. 2018, ATel, 12284
- Madsen et al. (2015) Madsen, K. K., Harrison, F. A., Markwardt, C. B., et al. 2015, ApJS, 220, 8
- Matsuoka et al. (2009) Matsuoka, M., Kawasaki, K., Ueno, S., et al. 2009, PASJ, 61, 999
- Mihara et al. (2011) Mihara, T., Negoro, H., Kawai, N., et al. 2011, PASJ. 63S. 623
- Mihara et al. (2018) Mihara, T., et al. 2018, ATel, 12291
- Minter et al. (2008) Minter, A. H., Camilo, F., Ransom, S. M., Halpern, J. P., & Zimmerman, N. 2008, ApJ, 676, 1189
- Mori et al. (2014) Mori, K., Gotthelf, E. V., Dufour, F., et al. 2014, ApJ, 793, 88
- Negoro et al. (2016) Negoro, H., Kohama, M., Serino, M., Saito, H., Takahashi, T., Miyoshi, S, et al. 2016, PASJ, 68, S1
- Perna & Gotthelf (2008) Perna, R. & Gotthelf, E. V. 2008, ApJ, 681, 522
- Pintore et al. (2016) Pintore, F., Bernardini, F., Mereghetti, S., et al. 2016, MNRAS, 458, 2088
- Pintore et al. (2019) Pintore, F., Mereghetti, A., Esposito, P., et al. 2019, MNRAS, 483, 3832
- Rea & Esposito (2011) Rea, N., & Esposito, P. 2011, in “High-Energy Emission from Pulsars and their Systems”, Astrophysics and Space Science Proceedings, ISBN 978-3-642-17250-2. Springer-Verlag Berlin Heidelberg, 21, 247
- Rybicki & Lightman (1986) Rybicki, G. B. & Lightman, A. P. 1986, “Radiative Processes in Astrophysics, ”, Wiley-VCH ISBN 0-471-82759-2.
- Shannon & Johnston (2013) Shannon, R. M., & Johnston, S. 2013, MNRAS, 435, L29
- Woods et al. (2005) Woods, P. M., et al. 2005, ApJ, 629, 985