One-Dimensional Flow Spectra and Cumulative Energy from Two Pipe Facilities
Abstract
Experiments have been conducted to assess the sizes and energy fractions of structure in fully developed turbulent pipe flow regime in two pipe facilities, ColaPipe at BTU Cottbus-Senftenberg, and CICLoPE at University of Bologna, for shear Reynolds number in the range , utilizing a single hot-wire probe. Considerations are given to the spectra of the streamwise velocity fluctuations, and to large scale motions and their energy contents from the pipe near-wall to centerline. The analysis of the velocity fluctuations revealed a Reynolds-number dependent inner peak at a fixed wall normal location, however, an outer peak seems not to appear that might be attributed either to low Reynolds number effect or not high enough spatial resolution of hot-wire probe, motivating further study utilizing nanoscale probes. Sizes of the large scale, and very large scale structures were estimated to have wavelengths of 3, and 20 at high Reynolds number, srespectively. The fractional energy contents in wavelengths associated with the large scale motions at various wall normal locations showed maximum contribution to the turbulent kinetic energy near the outer limit of the logarithmic layer.
1 Introduction
Turbulent large scale structures in pipe facilities at high Reynolds numbers are of practical importance in terms of their fractional contributions to Reynolds stresses and energy budgets. For decades, understanding such turbulent flow structures have been of interest by, e.g., Townsend (1976), Kim, Adrian (1999), Marusic et al. (2010), Morrison et al. (2016), and Jiménez (2018). Nevertheless, conceret definition of origin, natures, evolutions, and sizes of such large scale structures are still under debat, in particular, at high Reynolds numbers. This short contribution aims, therefore, at characterizing experimentally the following few features of such large scale structure in two pipe facilities at high Reynolds numbers:
-
•
Scaling the streamwise Reynolds stress and examining its inner and outer peaks.
-
•
Scaling spectra of the streamwise velocity fluctuations ().
-
•
Estimating sizes of the large and very large scale motions, i.e. LSM VLSM.
-
•
Examining contribution of the large scale motions to turbulent kinetic energy.
2 Facilities and Measuring Techniques
Current measurements in CoLaPipe CICLoPE aimed at investigating the streamwise energy spectra over a wide range of the shear Reynolds number (), where is the wall friction velocity, is the pipe radius, and is the kinematic viscosity. The CoLaPipe is closed return facility, located at Brandenburg University of Technology, Germany, to carry out measurements for . The facility provides air with 78m/s maximum velocity, having turbulence level less than , see König (2014). It has two pipe sections, both made out of high-precision smooth acrylic glass, having inner pipe diameters of mm and mm, with , and length-to-diameter-ratio () for the suction, and the return sections, respectively. The CICLoPE is also closed return facility, located at University of Bologna, Italy, for a range of . The CICLoPE facility provides air with 60 m/s maximum velocity, see Fiorinin (2017). The CICLoPE has a pipe section of mm as inner diameter, and 111.5m total length, i.e. . It is to note that both facilities are equipped with water coolers.
Measurements in CICLoPE facility have been carried out using Dantec Streamline 90N10 CTA, and Dantec 55P11 commercial probes in addition to custom-made Platinum single-wire probes, see Fiorinin (2017). On the other hand, in CoLaPipe facility, all measurements have been conducted using Dantec Multichannel-CTA 54N81 with commercial Dantec boundary layer probe, Model 55P53. The sampling frequencies were set to 60 kHz 20 kHz with a low-pass filter at =30 kHz 10 kHz, for the CICLOPE and CoLaPIpe, respectively, and samples were acquired over 120 s at every measuring point. It is worth noting that the mean pressure gradient along both pipe test sections was used to estimate the wall friction velocity ().
3 Results and Discussions
Figure 1 illustrates the inner scaling of the streamwise mean, and fluctuating velocity profiles from experiments and simulations. The local scaling for velocity, and wall normal distance were carried out using the wall friction velocity (), and the viscous length scale (), respectively. The mean velocity profiles in Fig. 1(left) show good collapse, and a satisfactory agreement with the logarithmic line, , where and proposed by Zanoun et al. (2007). The figure also presents samples for the experimental streamwise velocity fluctuations at 11000. Plausible agreement between experiments for with DNS data from Ahn et al. (2015) is observable. For high enough Reynolds number, back to 1976, Townsend showed that the streamwise turbulence intensity behave logarithmically, , in the interior part of the inertial region. A clear logarithmic behavior for is being seen in Fig. 1(left) for with , and .
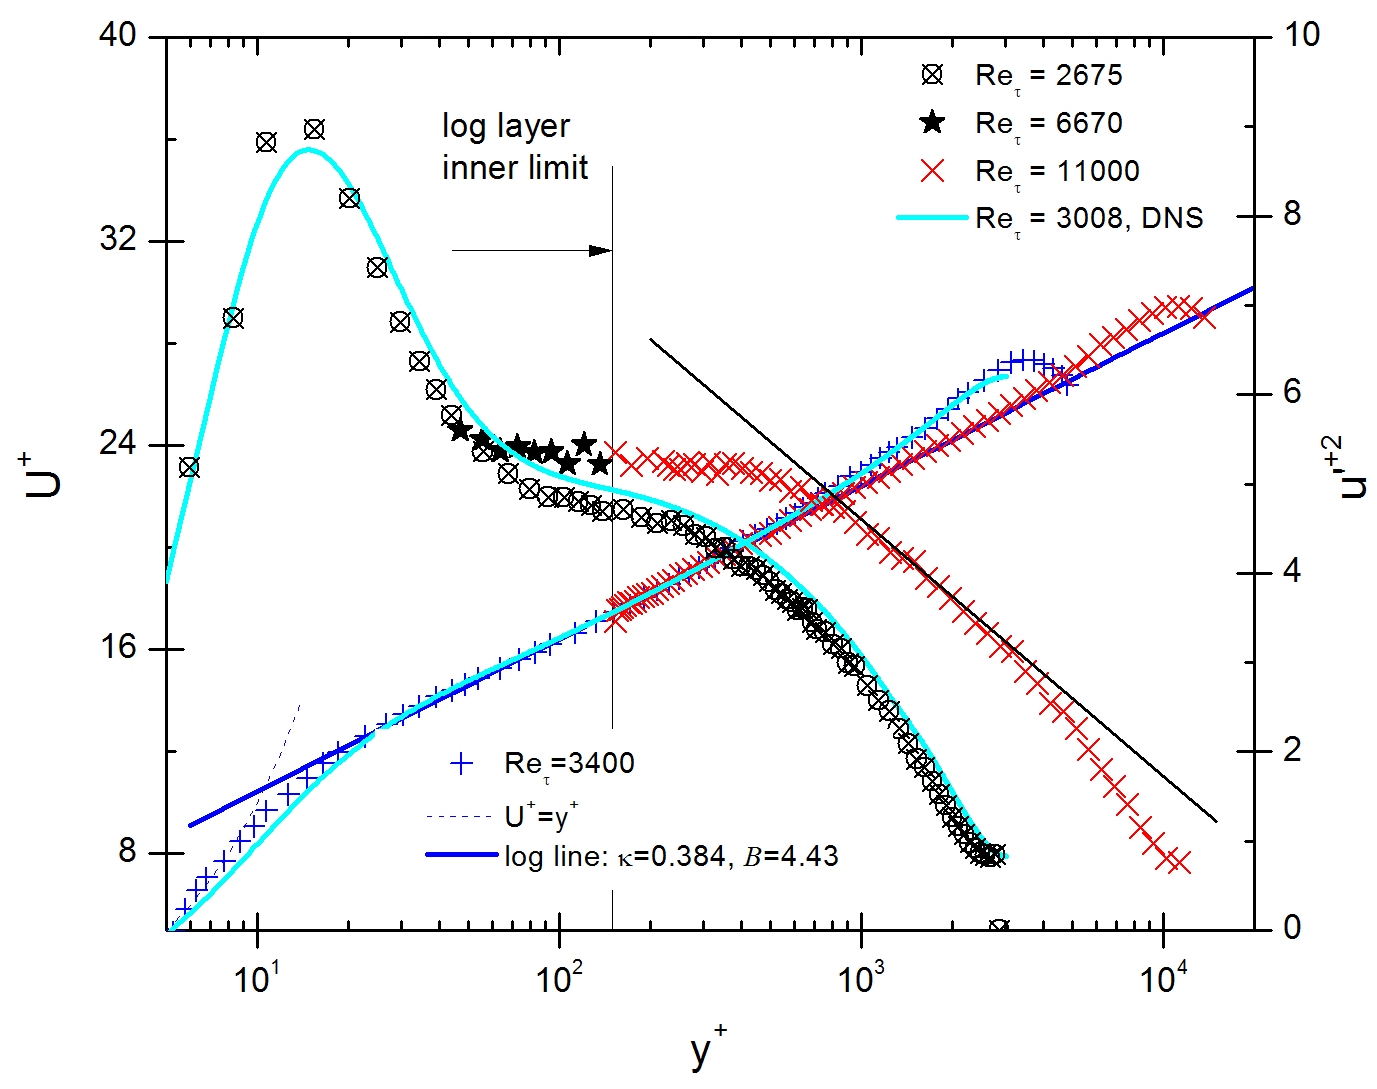
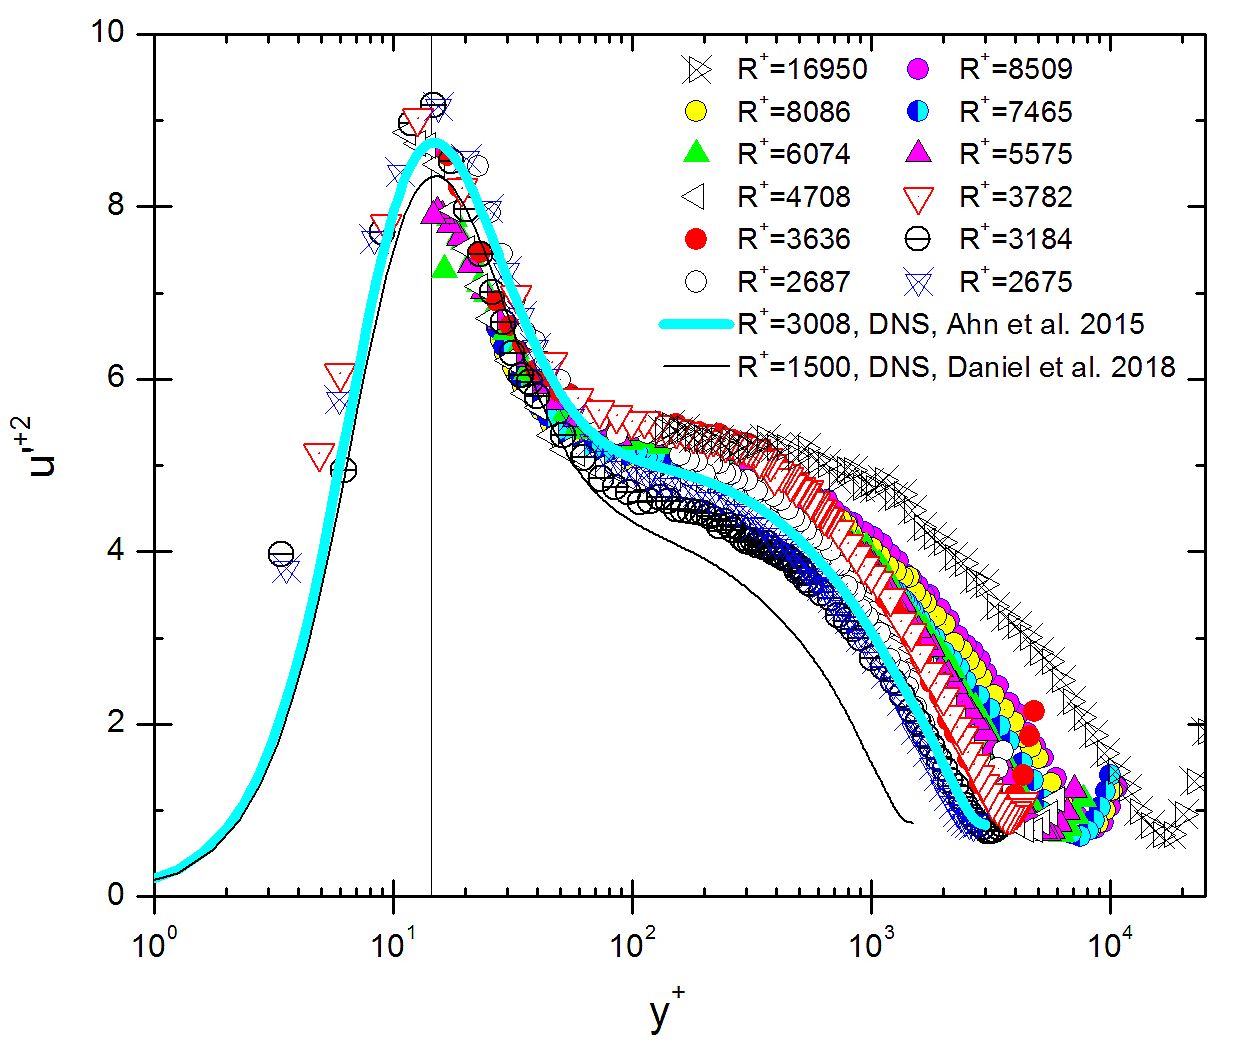
Figure 1(right) illustrates the inner scaling of all from experiments, and two available DNS data sets [Ahn et al. (2015), Daniel et al. (2018)] versus the wall normal location . Focusing on the region close to the wall, the data do collapse and follow the classical scaling with Re-dependent inner peak, located at in good agreement with predictions utilizing Hutchins et al. (2009) empirical formula. The location of the inner peak observed is also in correspondence with the location where the turbulent kinetic energy production reaches its maximum, Zanoun and Durst (2009). On the other hand, an outer peak is hardly observable in Fig. 1(right) which is attributed either to low Reynolds number effects or not high enough spatial resolution of hot wire probe, however, a plateau is being clear along the overlap region. Further research is, therefore, being motivated utilizing NSTAPs probes to see whether the second extremum a real peak or does it form a shoulder or plateau.
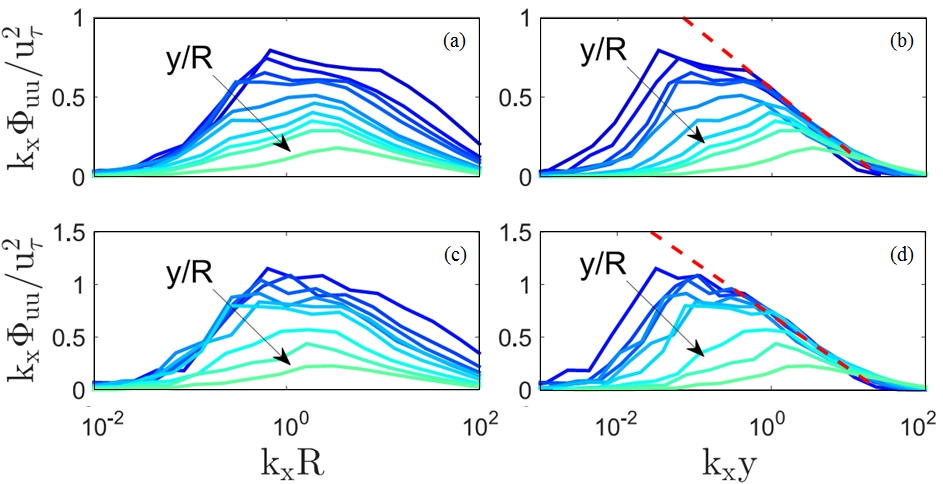
Selected samples from pre-multiplied spectra () of the streamwise velocity fluctuations presented in Fig. 2 for (a,b) (c,d) highlight questions raised earlier in section 1, utilizing CoLaPipe and CICLoPE, respectively. In outer scaling, Figs. 2(a) (c) show satisfactory similarity at low wavenumbers, while in wall-normal scaling, data in Figs. 2(b) (d) show similarity for moderately high wavenumbers. One might speculate that such spectra represents a footprint for the large and very large scale motions (LSM VLSM ) observed in both facilities with two discernible length sales, one at low, and the other at moderate wavenumbers associated with the VLSM, and the LSM, respectively. The dashed line presented in both Figs. 2(b) (d) represents a proposed logarithmic correction by del Álamo et al. (2004) to the spectrum given by , with and , indicating good agreement with experiments within the range .
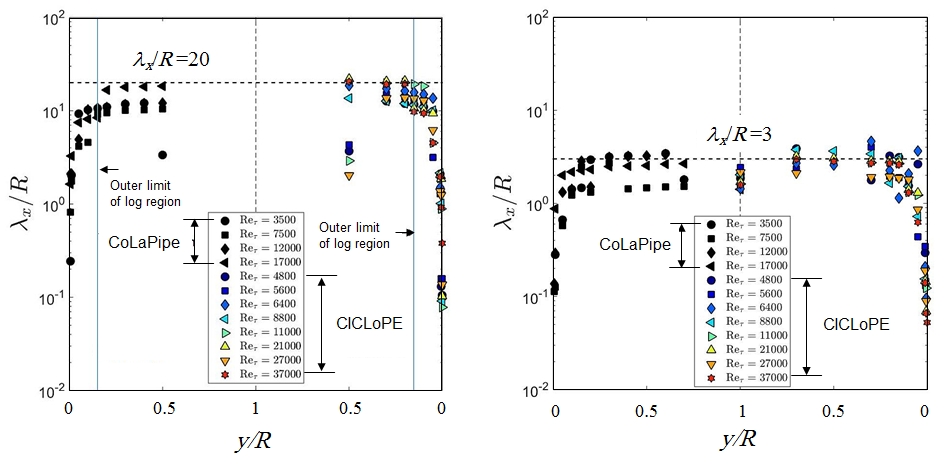
Based on spectral peaks observed in Fig. 2, sizes of the large-scale structures were estimated and presented in Fig. 3. Very large scale motions (VLSM) start within the buffer layer and grow through the inertial sublayer, reaching maximum wavelength of for , and for at half of the pipe radius, i.e. outside the logarithmic layer, see Fig. 3(a). A sudden drop in the normalized wavelength of the very large scale motion is observed at in Fig. 3(a) due to merging of the VLSM and the LSM forming one flow structure beyond . Such structure (LSM) presented in Fig. 3(b) spans the pipe cross-section from a location close to the pipe wall to the centerline of the pipe with a wavelength of in good agreement with Kim, and Adrian (1999). Figure 3 represents quantitative comparison and good summary for sizes of the large scale motions between the two pipe facilities over a wide range of Reynolds number.
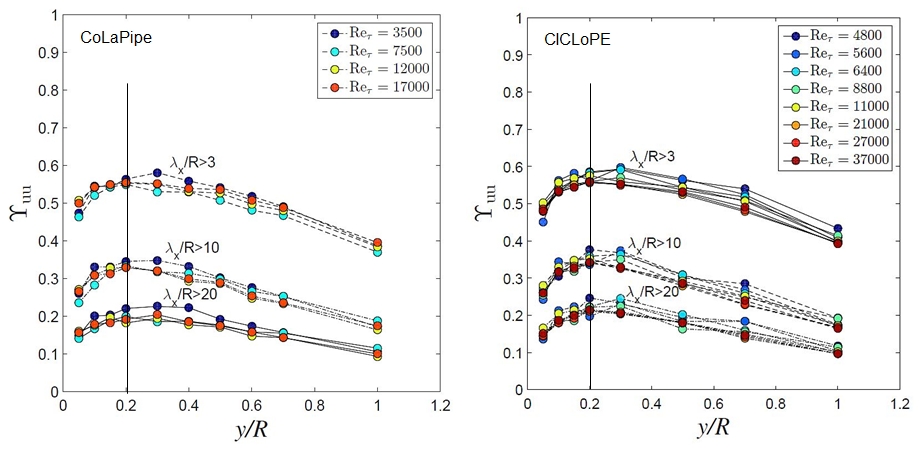
The cumulative energy for wall normal locations of at is presented in Fig. 4, addressing the contribution of both the LSM and the VLSM to the turbulent kinetic energy. The contribution of such structures within a range of wavelengths to energetic the flow is examined via the distribution of the streamwise cumulative energy [] as a function of the normalized streamwise wavelength . For instance, one would estimate from data presented in Fig. 4 that at a wall normal location , flow structures with wavelengths greater than 3, 10, and 20 pipe radii have fractional contributions around , , and , respectively, to the turbulent kinetic energy. This location is in correspondence with the top of the logarithmic layer.
4 Conclusions and Future Work
An experimental study of the large scale motions have been carried out in two new experimental pipe facilities where flow was assured to be fully developed for . Results using a single hot-wire probe showed very large and large scale motions with wavelengths 20, and , for at half of the pipe radius, and spans from the wall to the centerline of the pipe, respectively. Around , and of the kinetic energy are attributed to length scales greater than 3, 10, and 20 pipe radii, respectively, around the top of the inertial sublayer. Further research is, however, being motivated utilizing NSTAPs probes.
Acknowledgements This research is funded via the German Research Foundation (DFG) as part of the FOR1182 and SPP1881 project. Support received from the European High performance Infrastructures in Turbulence (EUHIT) is appreciated.
References
- (1) A. A. Townsend, The structure of turbulent Shear Flow. Cambridge University Press. (1976)
- (2) K.C. Kim, R.J. Adrian, Very large-scale motion in the outer layer. Phys. Fluids 11, pp. 417-422 (1999)
- (3) I. Marusic,, R. Mathis,, and N. Hutchins, High Reynolds number effects in wall turbulence, J. Heat Fluid Flow 1, pp. 418–428 (2010)
- (4) J. F. Morrison, M. Vallikivi, and A. J. Smits, The inertial subrange in turbulent pipe flow: centreline. J. Fluid Mech., vol. 788, pp. 602–613 (2016)
- (5) J. Jiménez, Coherent structures in wall-bounded turbulence, J. Fluid Mech., vol. 842, P1, doi:10.1017/jfm.2018.144 (2018)
- (6) F. König, E.-S. Zanoun, E. Öngüner, C. Egbers, The CoLaPipe - The new Cottbus large pipe test facility at Brandenburg University of Technology Cottbus-Senftenberg, Review of Scientific Instuments, 85, 075115 (2014)
- (7) T. Fiorinin, Turbulent pipe flow-high resolution measurements in CICLoPE, PhD Thesis, Uuiversitá DI Bologna (2017)
- (8) E.-S. Zanoun, F. Durst, O. Saleh, and A. Al-Salaymeh, Wall skin friction and mean velocity profiles of fully developed turbulent pipe flows, J. Exp. Therm. Fluid Sci. 32(1), pp. 249–261 (2007)
- (9) J. Ahn, J. H. Lee, J. Lee, J. Kang, and H. J. Sung, Direct numerical simulation of a 30R long turbulent pipe flow at = 3008, Phy. Fluids 2, 065110 (2015); doi: 10.1063/1.4922612 (2015)
- (10) N. Hutchins, T. B. Nickels, I. Marusic, and M. S. Chong, Hot-wire spatial resolution issues in wall-bounded turbulence, J. Fluid Mech., vol. 635, pp. 103–136 (2009)
- (11) D. Feldmann, C. Bauer, C. Wagner, Computational domain length and Reynolds number effects on large-scale coherent motions in turbulent pipe flow,” Journal of Turbulence, Vol. 19, No. 3, pp. 274-295 (2018)
- (12) E.-S. Zanoun, and F. Durst, Momentum transport and turbulent kinetic energy production in plane-channel flow, J. Mass and Heat Transfer, Vol. 52, Issues 15-16, July (2009)
- (13) J.C. Del Álamo, J. Jiménez, P. Zandonade, and R.D. Moser, Scaling of the energy spectra of turbulent channels, J. Fluid Mech. 500, pp. 135–144 (2004)