Structure and equation-of-state of a disordered system of shape anisotropic patchy particles
Abstract
We present a new two dimensional model for elliptic (i.e., shape anisotropic) patchy colloids, where the impenetrable core of the particles is decorated on its (co-)vertices by Kern-Frenkel type of patches. Using (i) well-documented criteria for the overlap of the undecorated ellipses and (ii) proposing new criteria that give evidence if the patchy regions of two particles interact we perform extensive Monte Carlo simulations in the NPT ensemble. Considering elliptic particles of aspect ratios 2, 4, and 6 with two patches located at the co-vertices and choosing representative values for the temperature we study on a semi-quantitative level the emerging disordered phases in terms of snapshots and radial distribution functions and present results for the equation-of-state.
1 Introduction
Patchy particles, i.e. colloids that are decorated on their otherwise spherical (or circular) surface by regions of repulsion or attraction have been subject of a steadily increasing number of experimental and theoretical investigations during the past one to two decades. This remarkable interest in these particles is to a considerable amount due to the fact that patchy particles can meanwhile be synthesized with essentially arbitrary patch decorations in terms of number, positions, and spatial extent of the patches. They have therefore become very versatile units in bottom-up self-assembly strategies of soft matter based functional materials. Reviews over and special issues dedicated to patchy particles covering both experiment and theory provide an excellent overview over this rapidly expanding field [1, 2, 3, 4].
In this contribution we put forward a novel model for shape anisotropic patchy particles. With such a concept we give due credit to recent successes in synthesizing particles with shapes of ever increasing complexity. For an overview see, for instance, [5] and references therein.
As it is difficult to grasp both shape anisotropy and patchiness at the same time using simulations or theoretical approaches we put forward in this contribution a rather simple model which nevertheless fully captures the two aforementioned features: we consider impenetrable (two dimensional) elliptic particles of aspect ratio which can be decorated on their (co-)vertices with patches; these interaction sites are realized by the widely used Kern-Frenkel model [6], namely patches located on a circle (or sphere), specified by an opening angle and a finite interaction range. Within the patch region the potential is assumed to be constant (i.e., a square-well type of interaction). Depending on the sign of the interaction parameter, the patches can be attractive or repulsive.
For using this model in Monte Carlo (MC) simulations we had to find criteria which provide evidence if two of the anisotropic patchy particles interact: (i) for the undecorated, impenetrable elliptic bodies we use the criterion put forward by Vieillard-Baron [7, 8], indicating if two ellipses (with given orientations of their directors, and , and separated by a given center-to-center vector ) overlap, touch each other, or do not overlap; (ii) in an effort to identify possible patch-patch interactions we map via the osculating circles of the (co-)vertices our model on the original Kern-Frenkel model for circular (or spherical) patchy particles [6].
MC simulations are carried out in the NPT ensemble, allowing for variations in the area and in the shape of the simulation box; ensembles of 1260 particles have been considered in all simulation runs which typically extend over cycles. Triggered by a random number, translational (45%) or rotational (45%) moves of the particles as well as modifications of the box area or shape (10%) are carried out alternately.
Similar as in previous studies on undecorated particles [9] we have considered three values of , namely , and 6. Fixing the temperature to different, representative values we have systematically varied the pressure within a range where the disordered phase is stable. Since this contribution should rather be considered as a “proof of concept” to introduce both patchiness and shape anisotropy in one model, we postpone the more demanding (and time-consuming) investigations of the emerging ordered structures and the related phase transitions to a forthcoming, more comprehensive publication [10]. Configurations have been analyzed on a semi-quantitative qualitative level via visual inspection and via a (spatial) pair distribution function [11], comparing the emerging phases with previous studies performed for undecorated, hard ellipses [9, 12]. Data for the equation-of-state (i.e., pressure vs. packing fraction ) have been extracted from the simulation data for the selected -values and for a representative temperatures, including the high temperature case which corresponds to undecorated, hard ellipses.
The manuscript is arranged as follows: in the subsequent Section we specify the model and we provide details about the MC simulations. In Section 3 we present and discuss the results. The manuscript is closed with concluding remarks and an outlook over future investigations based on this model.
2 Model, methods, and analysis
2.1 The model
Motivated by the Kern-Frenkel model [6], which was originally put forward for disk-shaped (or spherical) particles we have developed the following simple model for a shape anisotropic patchy particle.
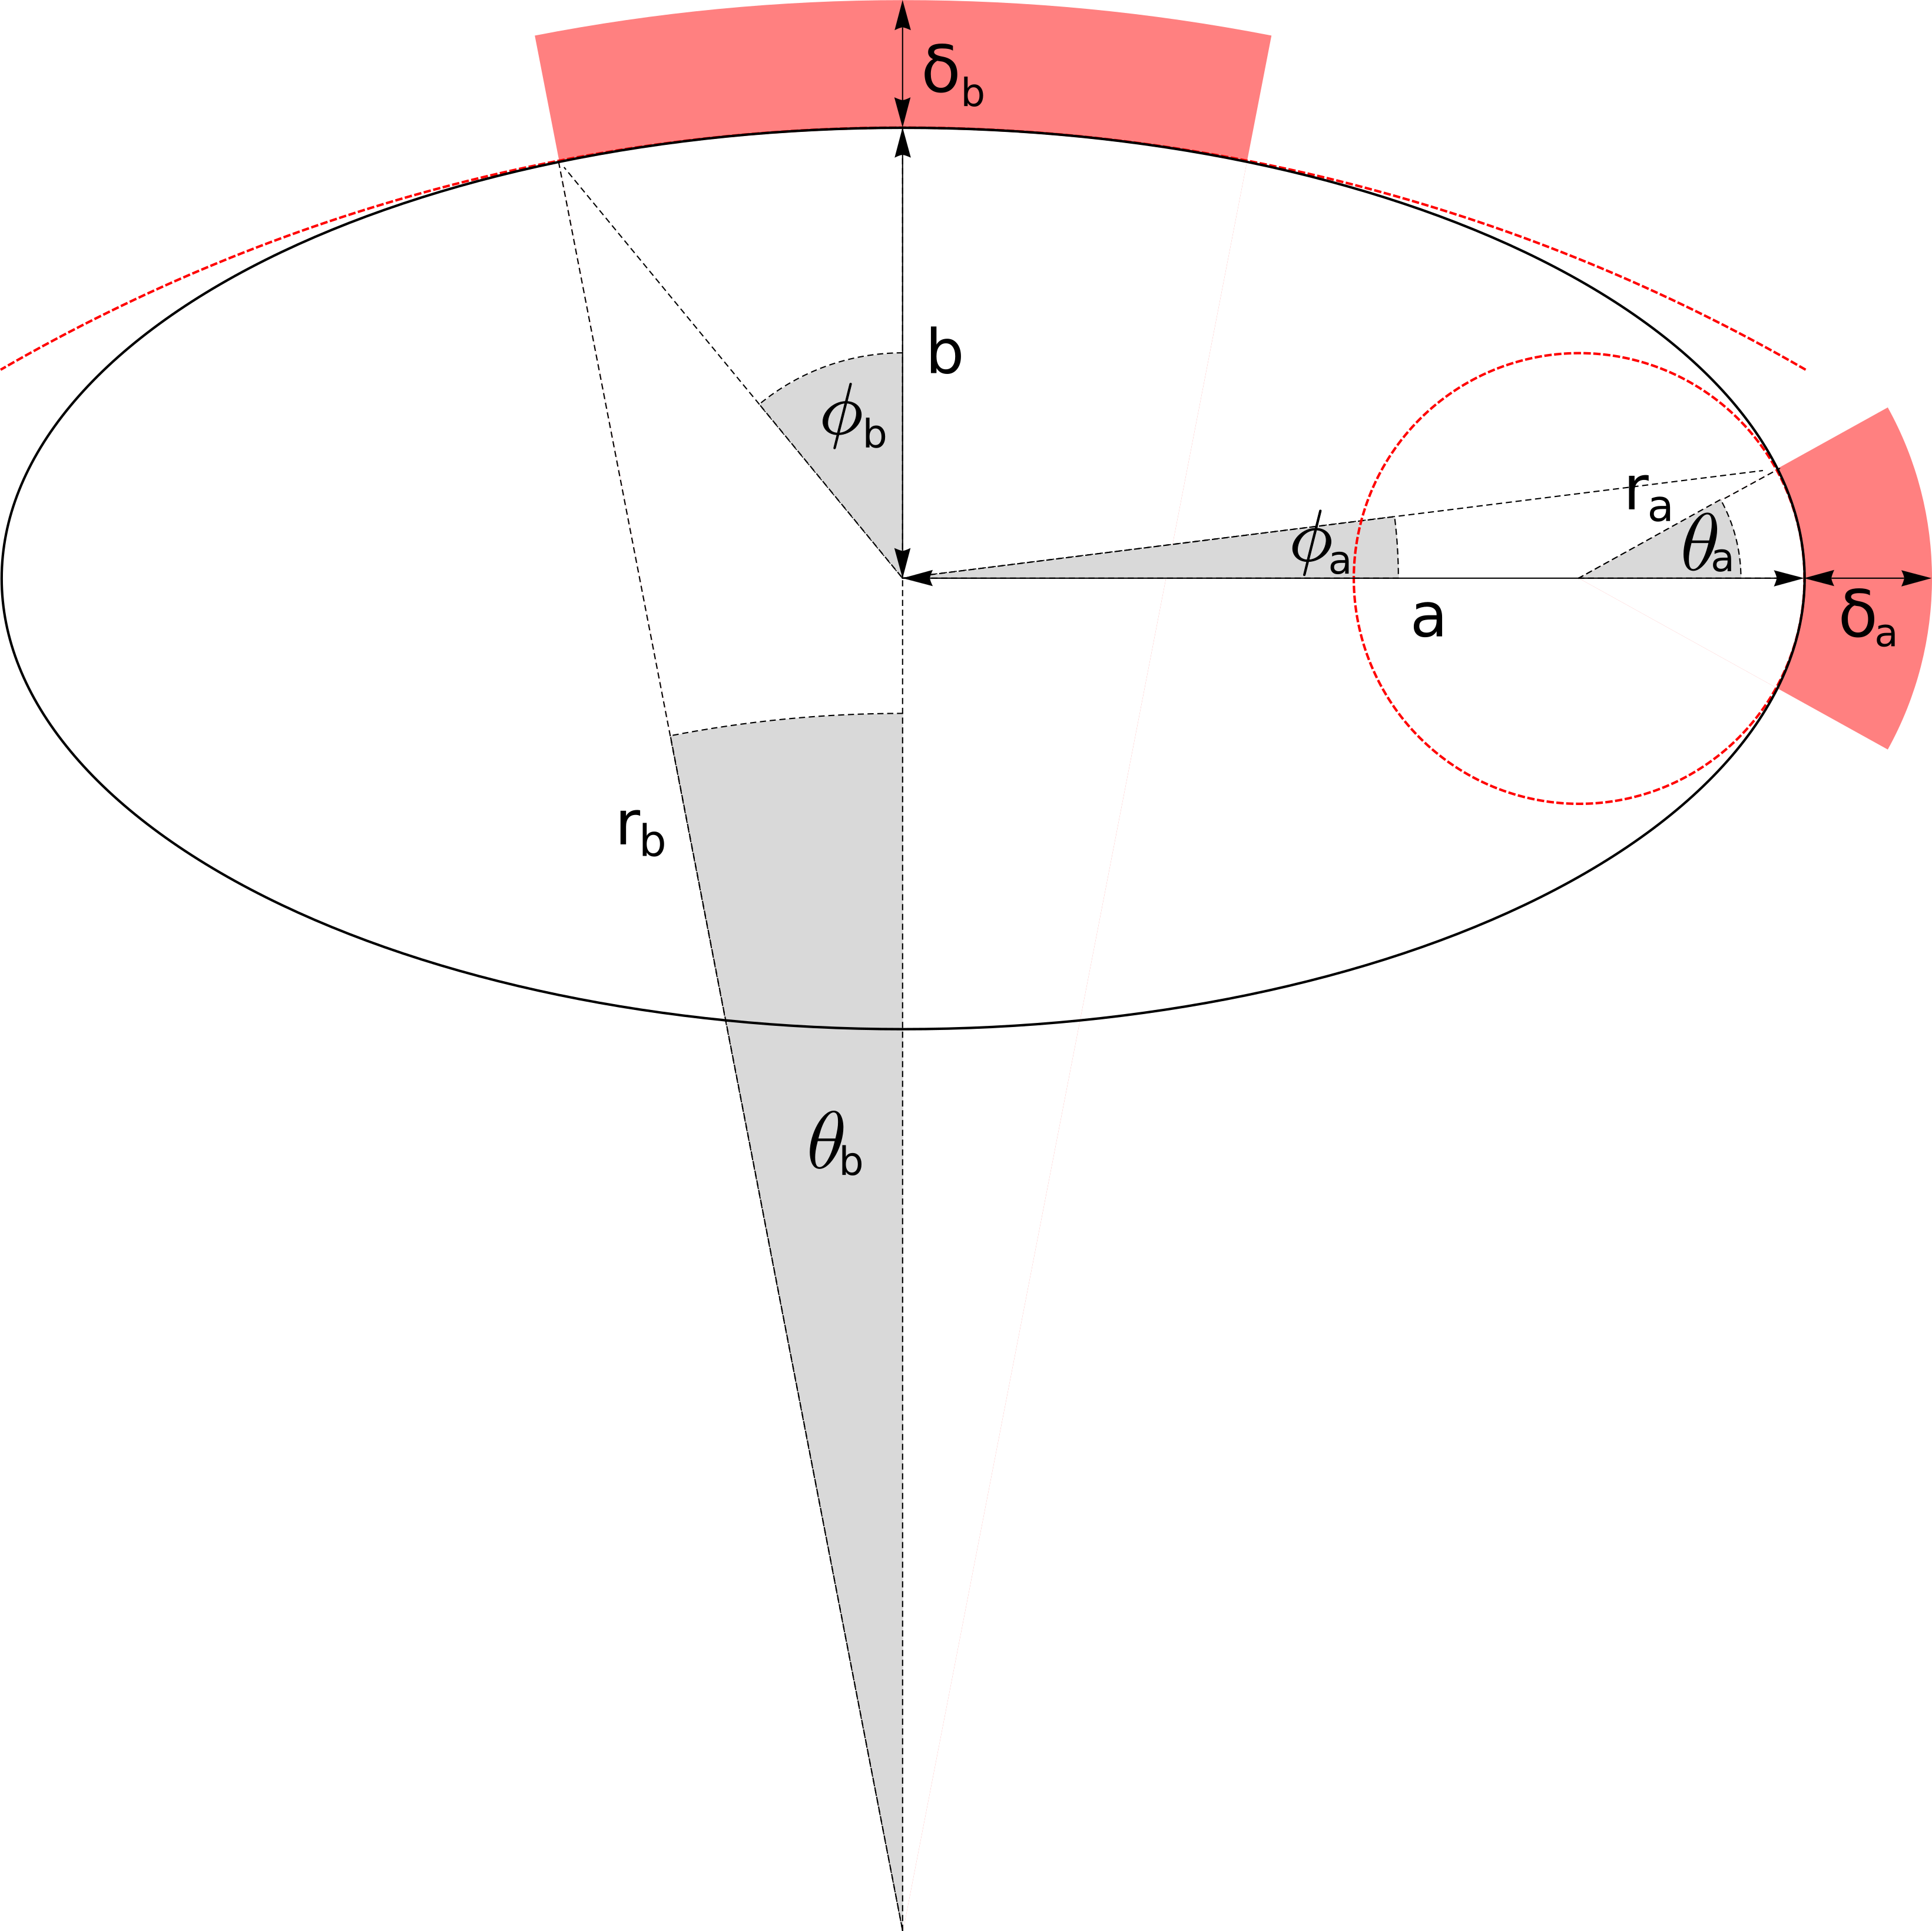
The body of our elliptic particles (with semi-axes and and an aspect ratio ) is impenetrable and can be decorated on the four (co-)vertices in the following manner by patches (see Figure 1; subscripts ’a’ and ’b’ specify in the following quantities that are related to the patches located at the vertices and co-vertices, respectively): the patches are delimited by a region of two concentric circles, the inner one being the respective osculating circle. Within a Cartesian coordinate system located in the center of the ellipse and with the main axis being oriented along the -axis, the centers of the osculating circles are given by and with radii and , respectively. The radius of the outer delimiting circle of a patch is given by or , setting thus the interaction ranges of the patches. We assume a square-well type patch interaction with well-depth , i.e., the interaction strength is set constant within the patch region as it has been proposed in the original Kern-Frenkel (KF) model [6].
Approximating the inner limit of the square-well potential by the osculating circles (instead by the ellipse itself) is, of course, valid only up to angles and (as seen from the centers of the osculating circles) or and (as seen from the center of the ellipse): imposing via a parameter (measured in the unit length scale of the model, i.e., ) a maximum discrepancy between the osculating circle and the elliptic line (measured along a beam originating in the center of the osculating circle) defines the limiting angles for the maximum patch size; of course these limiting angles are -dependent. Representative values for these quantities are given in Table 2.1, calculated for two different values of (i.e., 0.1 % and 0.5 %) and for the three different -values considered in this study (i.e., , and 6). Further, in this table information about the related maximum patch extents (for symmetric patches on both (co-)vertices), and , measured in units of the elliptic circumference, is given.
Values that specify the maximum extent of patches in our model, as specified by a criterion put forward in the text: and – maximum opening angles of the patches as seen from the centers of the respective osculating circles, and – maximum opening angles of the patches as seen from the center of the ellipse, and and – maximum patch extents as measured in units of the elliptic circumference. Representative values for these quantities are given for the three aspect ratios (as they are considered in this study) and for two different values of , used as a tolerance in the aforementioned criterion. = 0.1 % 0.11 0.36 = 0.5 % 0.21 0.63 = 0.1 % 0.04 0.40 = 0.5 % 0.06 0.59 = 0.1 % 0.02 0.43 = 0.5 % 0.03 0.62
As demonstrated in the following, the above specified model is easily amenable to the usual overlap/interaction acceptance criteria used in MC simulations:
- (i)
-
(ii)
as a consequence of approximating the patches by circular patches on the osculating circles, the overlap criterion used for circular Kern-Frenkel type of patches [6] can also be used in our model: hence two patches interact if the line connecting the centers of the related ocsculating circles intersects with the patchy regions.
2.2 Monte Carlo simulations
MC simulations were performed in the NPT ensemble, offering thus the possibility for changes both in the shape as well as in the area of the simulation box (henceforward termed as “area moves”). To be more specific, in an “area move” the lengths of the edges of the box are varied independently; the angle between the edges is not varied (i.e., kept at 90o) for simulations of the disordered phases, while for ordered phases also this parameter has to be varied [10]. The maximum change in the box parameters is limited in such a way that an overall acceptance rate of 20 - 50 % for the “area moves” is guaranteed. Throughout, periodic boundary conditions were used. Ensembles of 1260 particles were considered and the simulation length extends over 1.25 cycles, where each cycle consists of trial moves; triggered via a random variable each of these moves can either be a translational or a rotational move of a randomly chosen particle or an “area move”; the probabilities of selecting one of these moves are given by 45% for the translational and rotational moves and 10% for the area moves. Acceptance rules for the three types of moves are based on the overlap/interaction criteria put forward in Subsection 2.1 and the usual NPT-related selection rules [13]. The first 20% of the cycles were considered as an equilibration phase and were thus discarded. Each tenth cycle the configuration was saved resulting in a total of 104 configurations available for the analysis.
Simulations were started at low pressure from an initial configuration which was created as a random particle arrangement (both with respect to positions and orientations of the particles); the resulting density was chosen to be close to the one observed in the equation of state in previous studies on undecorated hard ellipses [9]. Subsequent state points were accessed by compressing the preceding configuration: after an equilibration phase the production run for this new state point was launched.
The density of the system is measured in terms of the packing fraction , defined as , being the area of the simulation cell. The spatial structure was quantified via the conventional pair distribution function, [11]. In order to obtain the equation-of-state the packing fractions have been recorded along the simulation run (at a given temperature and pressure) and have then been averaged. The pressure is given in reduced, dimensionless units via .
3 Results
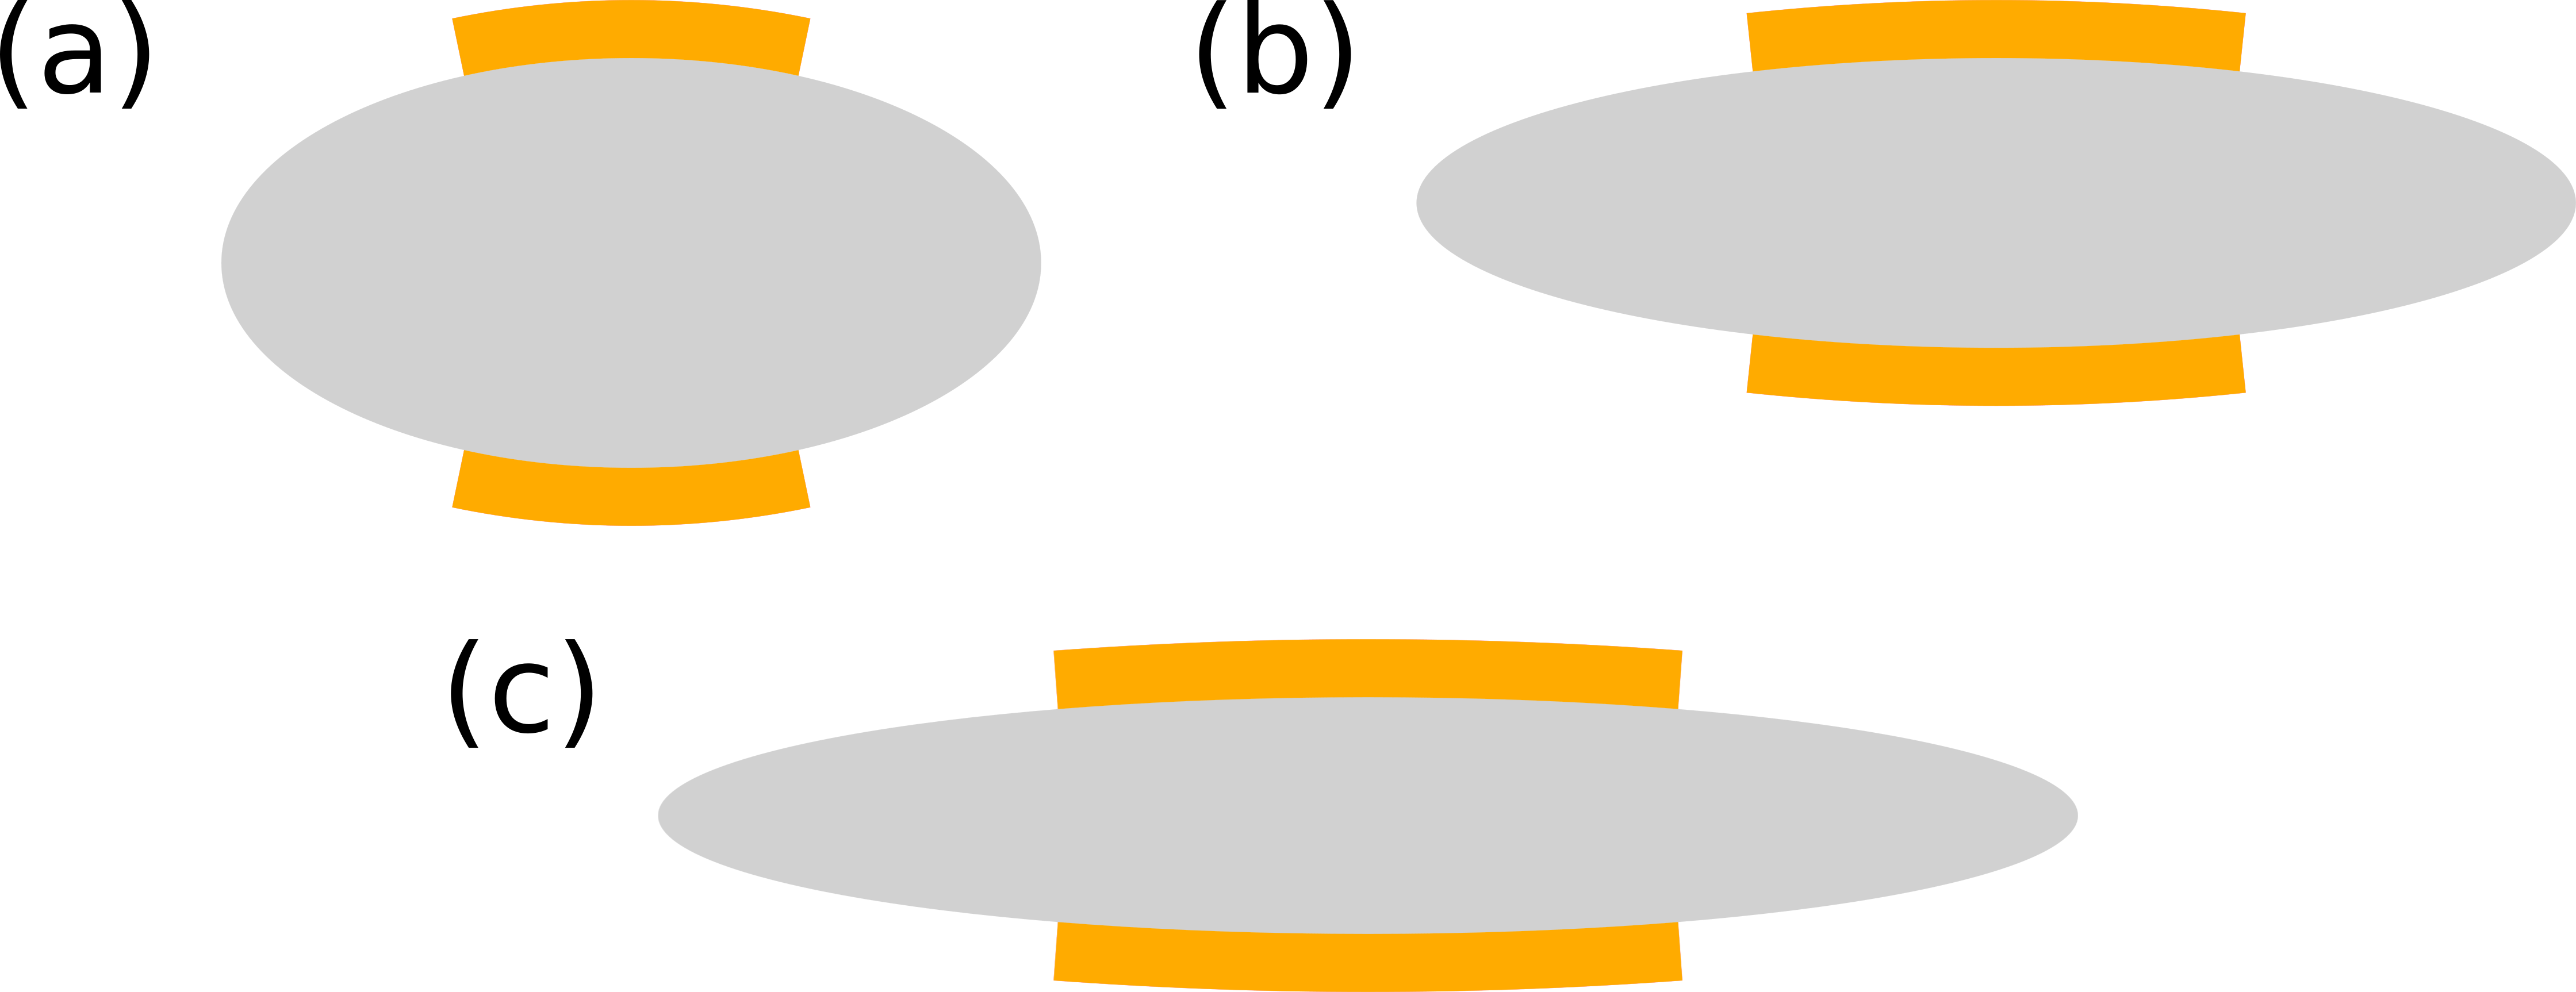
Simulations have been carried out for patchy elliptic particles with two patches located on the co-vertices, considering three different -values, namely , and 6 (see Fig. 2). For the range of the patch interaction we chose . The pressure was varied over a representative range where we expect (according to previous results for undecorated ellipses [9, 12]) the emergence of disordered phases, only. Also the temperature was varied over a representative range. The patch interaction was assumed to be attractive and is measured in units of , being the Boltzmann constant; the reduced, dimensionless temperature is defined as .
3.1 Snapshots and positional order
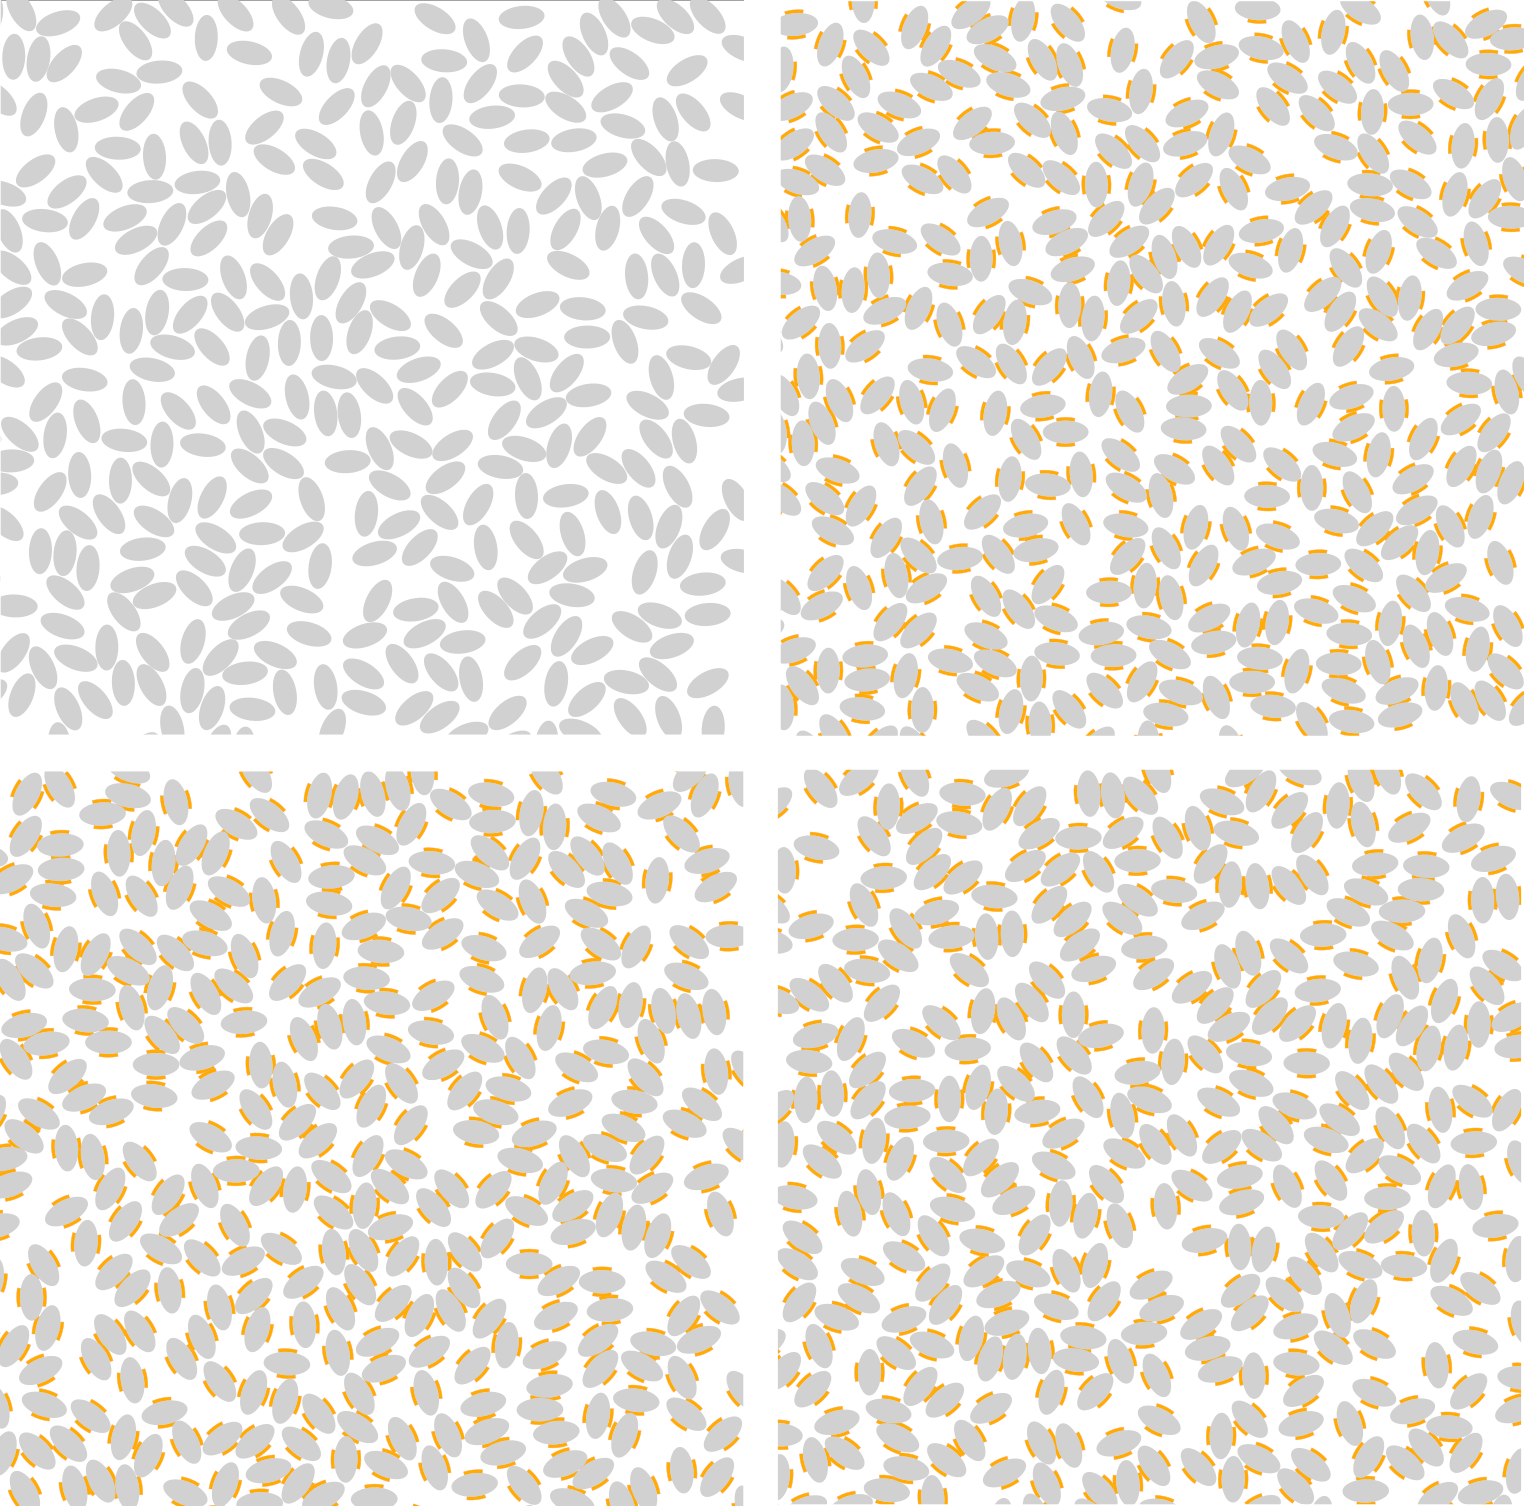
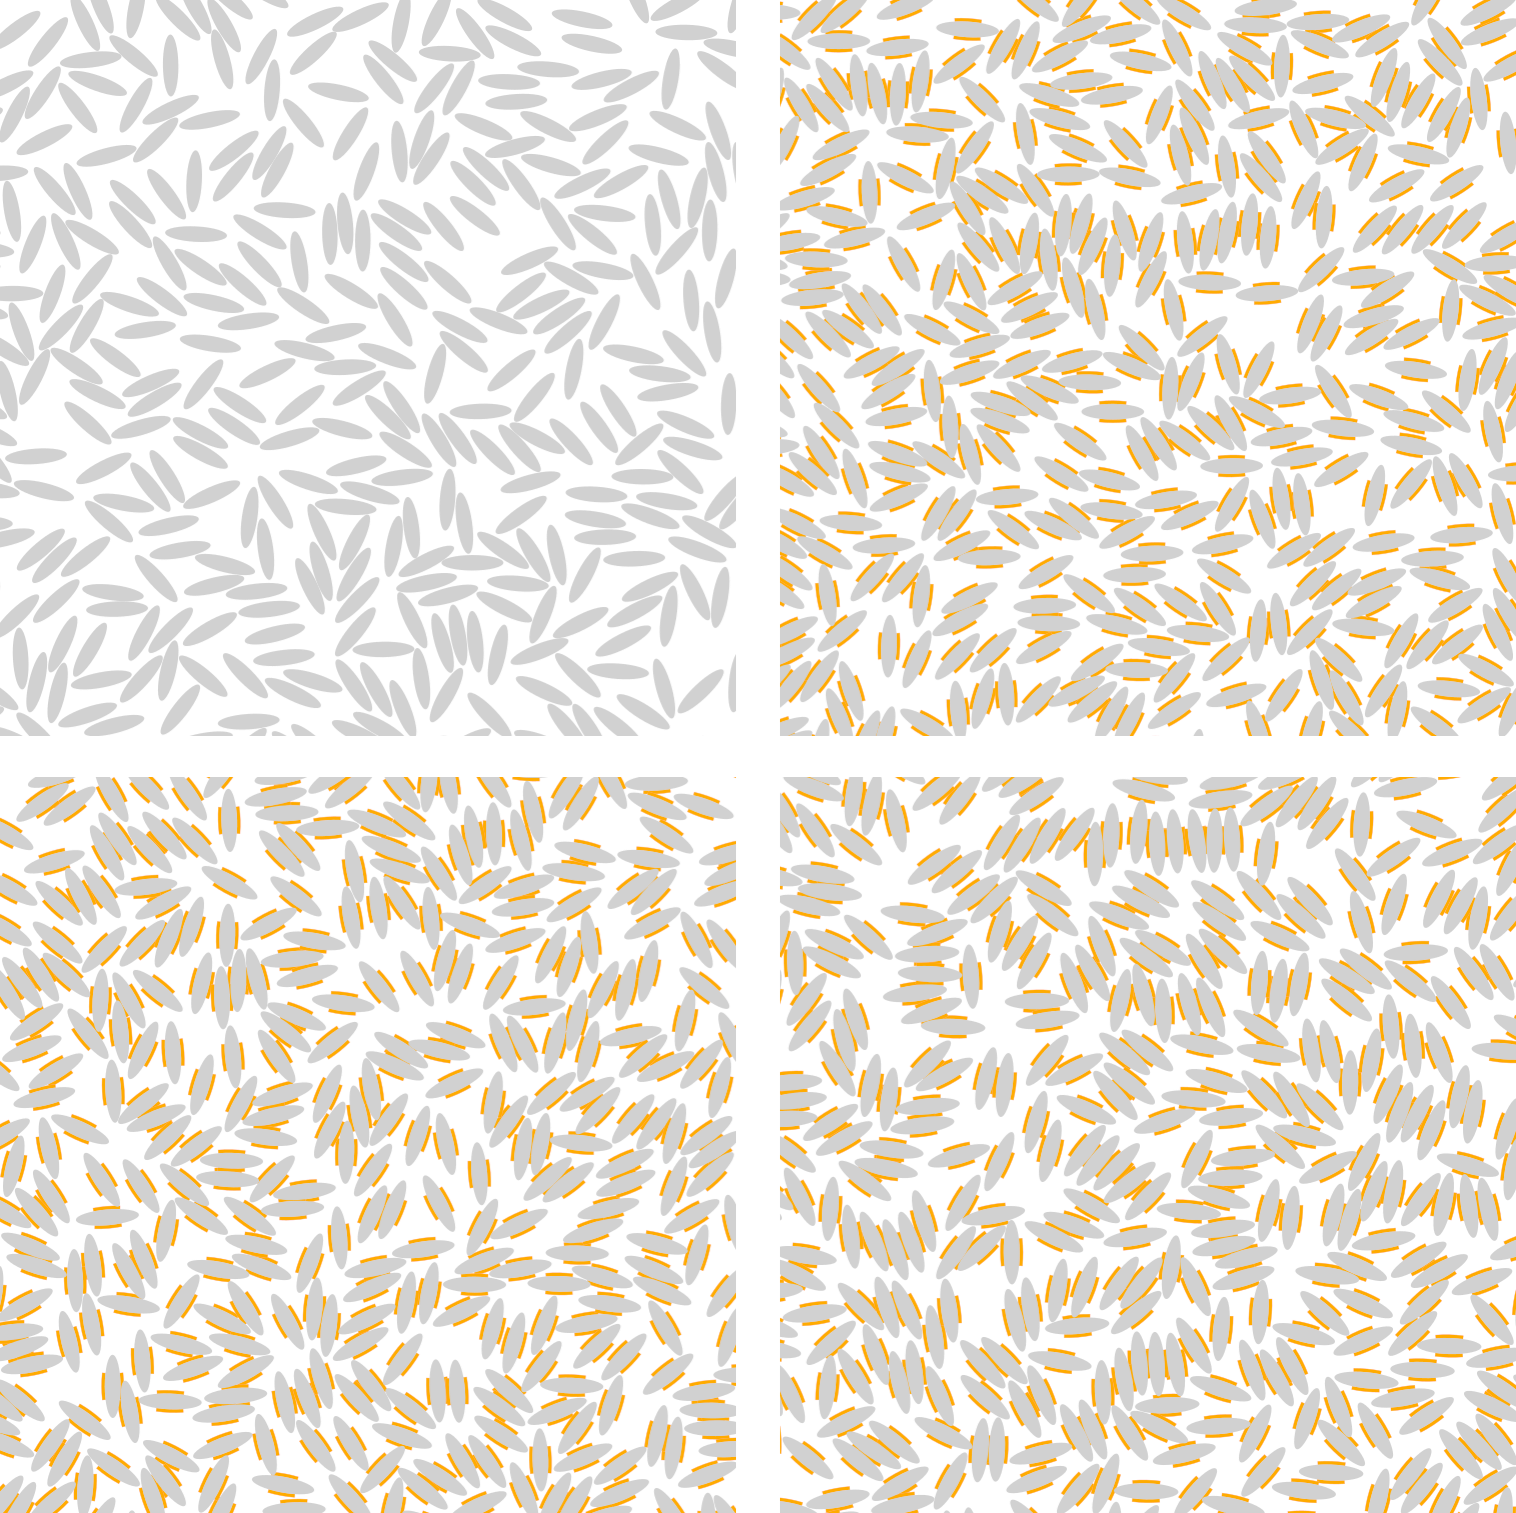
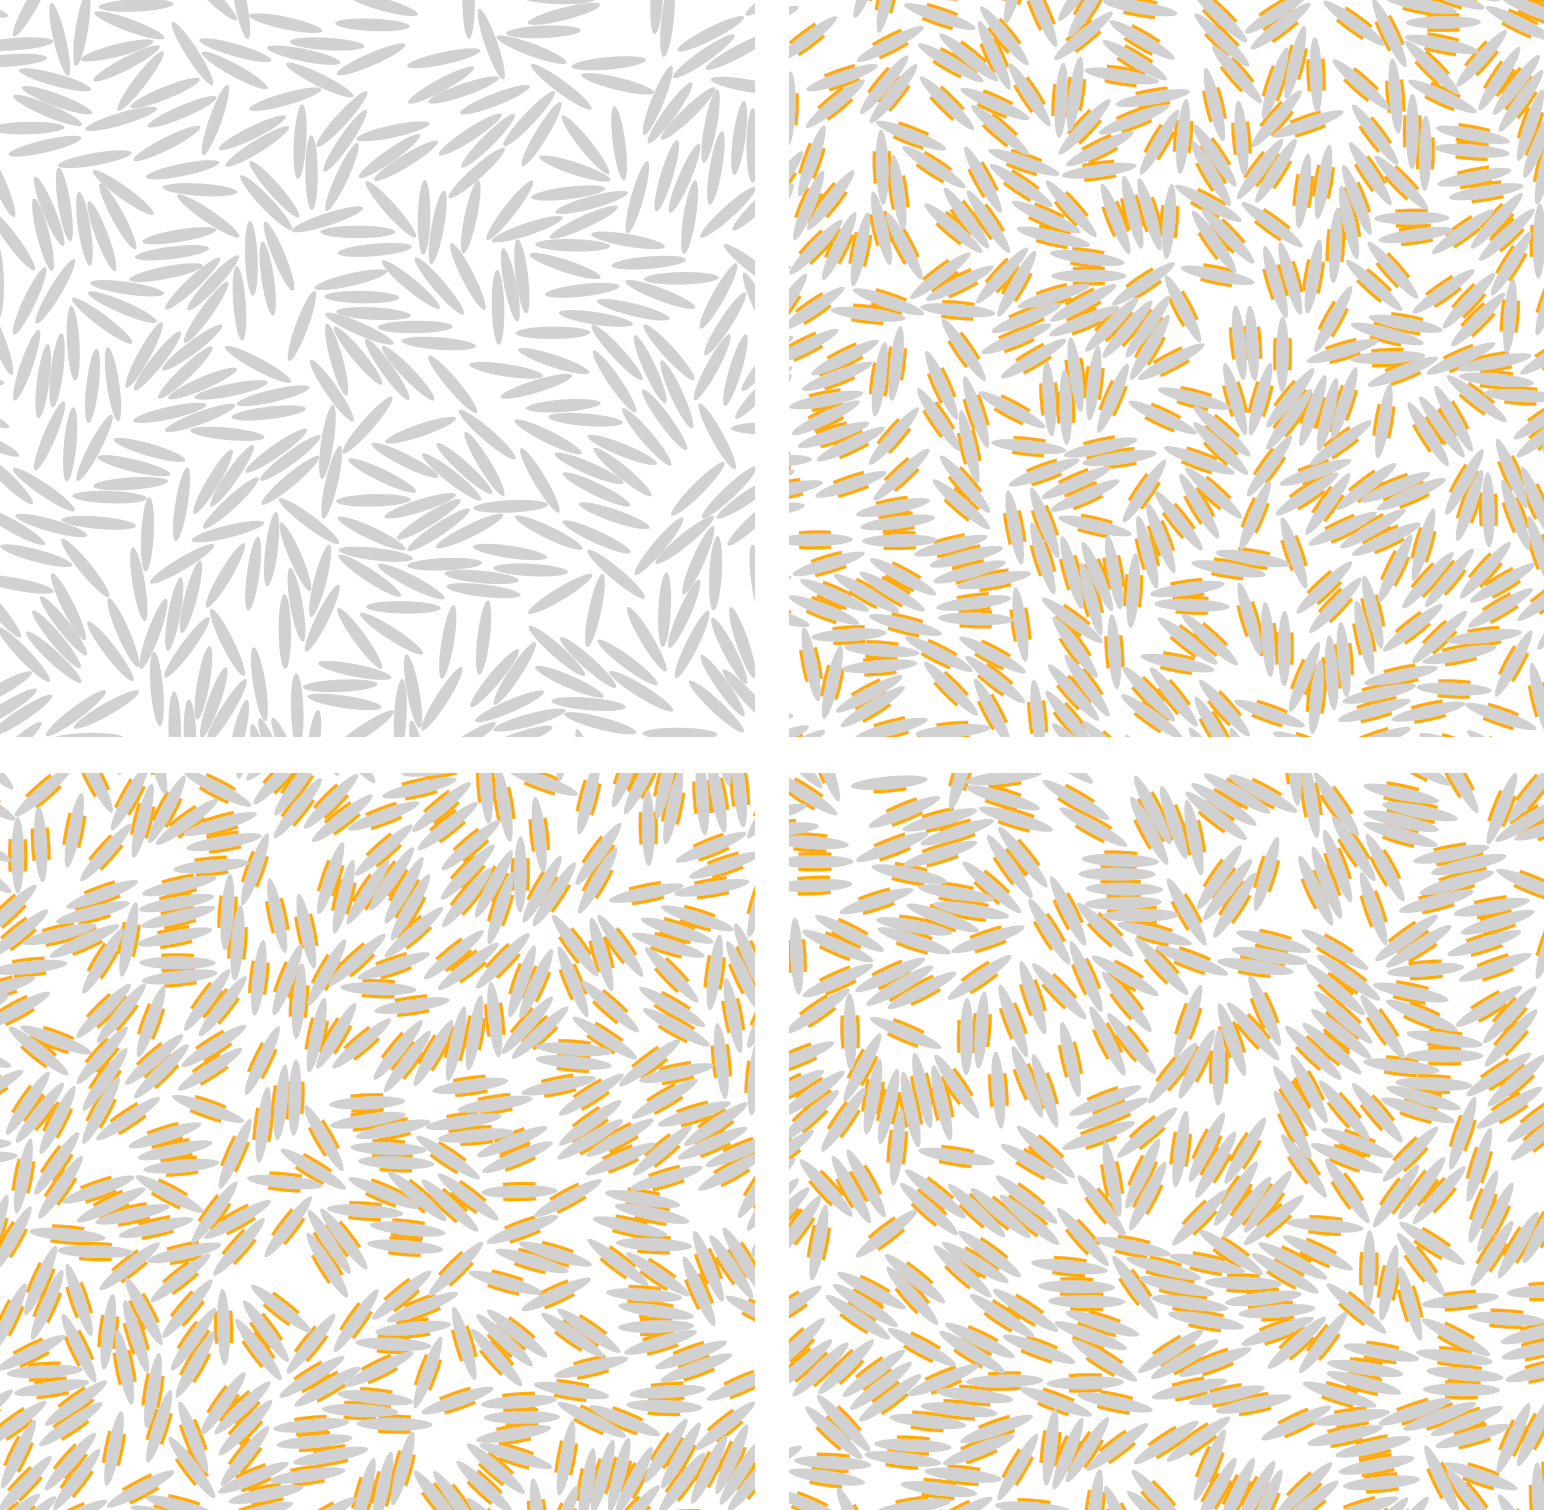
We start our discussion with a qualitative inspection of selected simulation snapshots, carried out for the three selected -values and keeping the pressure fixed. Four different temperatures were considered, including the case ; selected snapshots are shown in Figs. 3, 4, and 5. As expected, the attraction between the patches leads to the formation of small aggregates as the temperature is decreased: the location of the patches at the co-vertices of the ellipses induces a parallel alignment of bonded particles. For we observe even for the lowest temperature that only a few pairs of particles form, while already for and, in particular, for “bundles” of particles form.
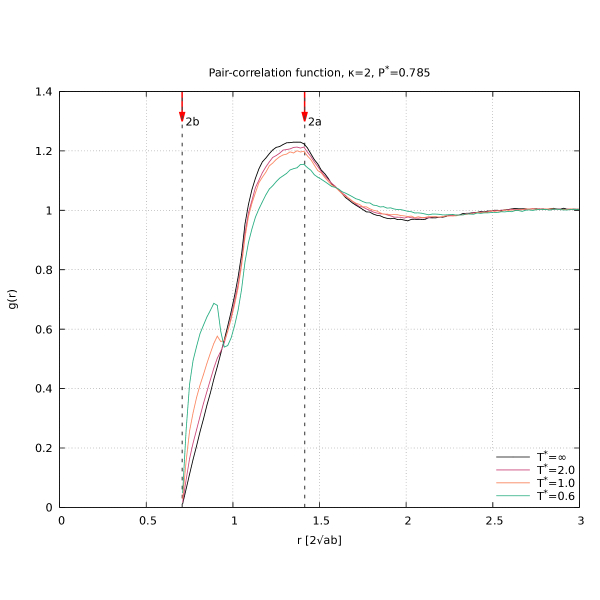
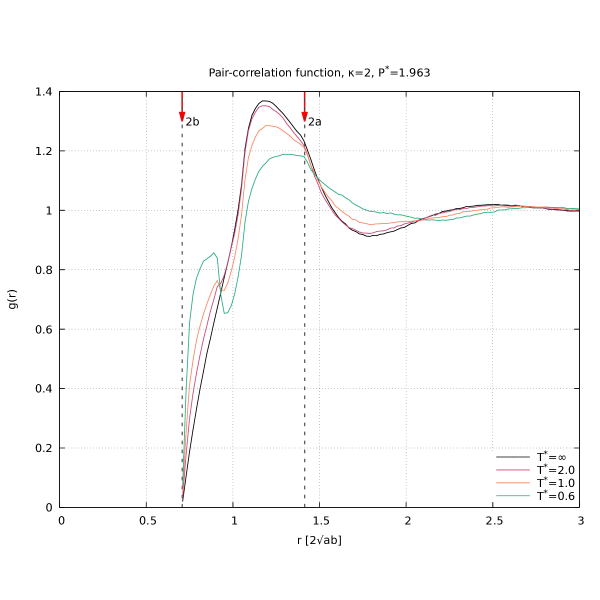
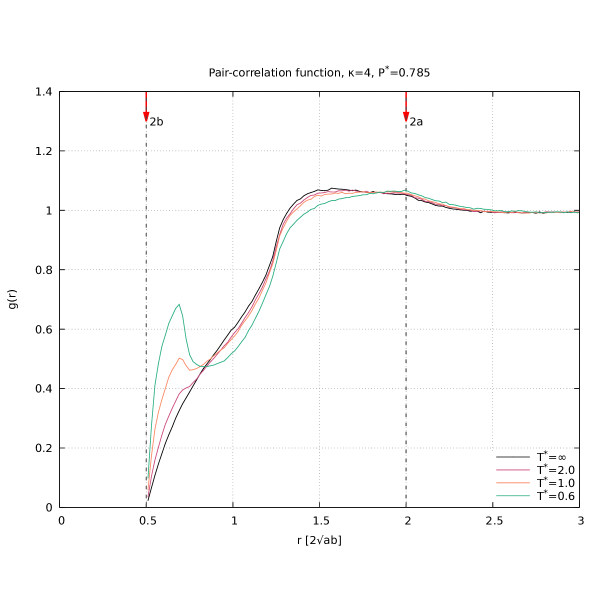
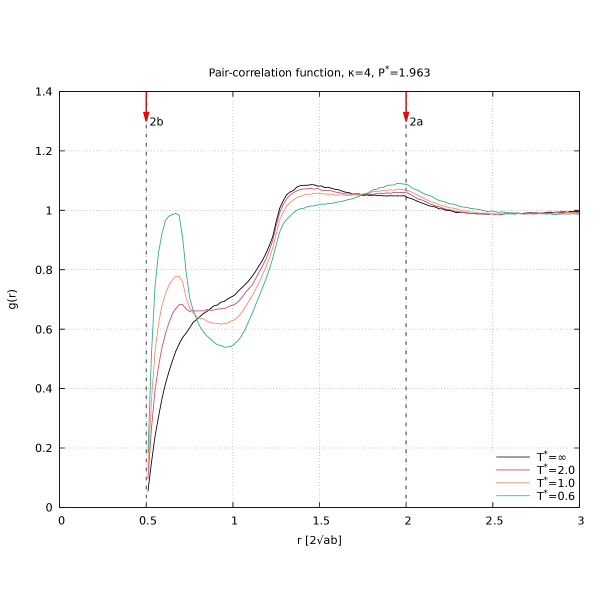
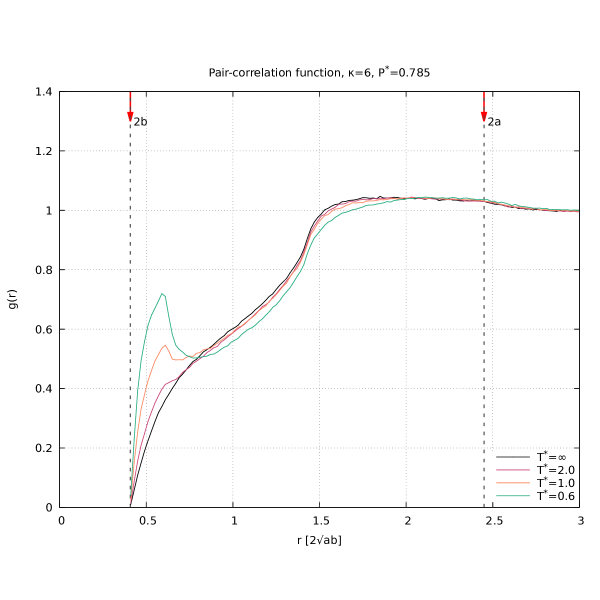
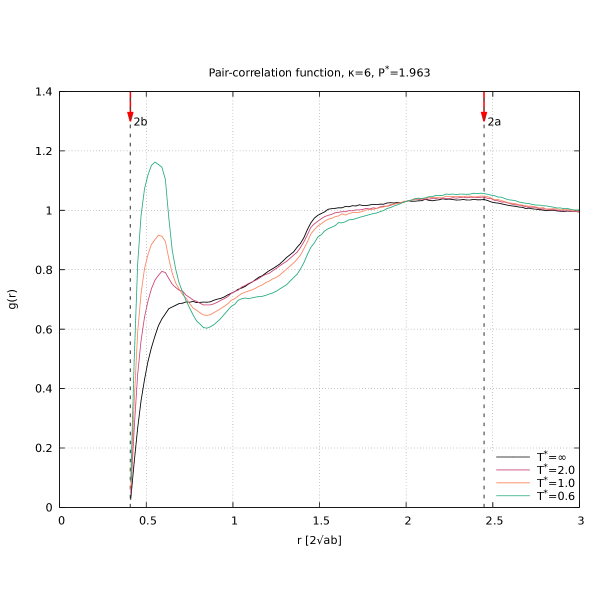
We have analysed the spatial structure of the emerging disordered phases on a semi-quantitative level in terms of the conventional pair correlation function, , [11]; this function is depicted for the three selected values of and for representative values for and in Fig. 6. The results provide evidence that the attractive patch- patch interaction of the particles enhances the correlation between the particles (in particular as the temperature decreases and/or as the pressure increases); this trend is reflected by the emergence of a peak for distances close to , which grows with decreasing temperature at the cost of the main peak which is located at higher distances. The emergence of the first peak reflects the above mentioned bundle formation of the particles under these external conditions. Further, the shift of the position of the former main peak towards indicates a stacking tendency of the bundles. A more quantitative analysis of the positional and of the orientational order of the particles requires the analysis of the data in terms of correlation functions , as they have been defined in [9]. However, such an analysis has to be based on considerably more extensive simulations on a finer pressure- and temperature-grid and will be postponed to future work [10].
3.2 Equation-of-state
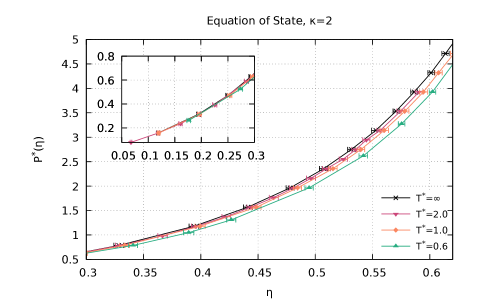
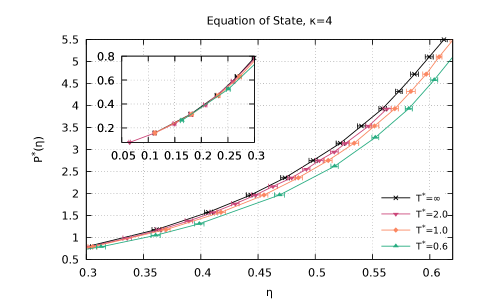
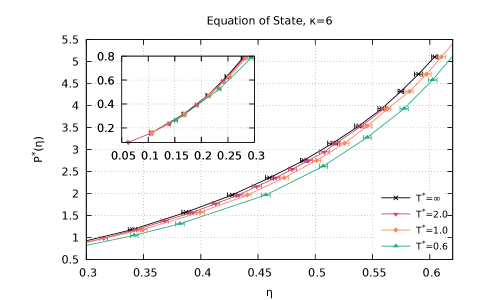
In Fig. 7 we show the data for the equation-of-state, i.e., as a function of the packing fraction , for the three different -values investigated in this study. As expected, the results for tend with to the data of the undecorated, hard ellipses. We observe a stronger decrease in the pressure with decreasing temperature for larger -values, reflecting the fact that for these system parameters the particles show a stronger tendency to form clusters (see discussion above). Data provide – in particular for – evidence of fingerprints of an emerging nematic phase in the equation-of-state. Investigations dedicated to the ordered phases of the system are envisaged; they require, however, more extensive simulations and more sophisticated simulation techniques as, for instance, NPT simulations with a variable box shape. Preliminary results indicate that such simulations are very time consuming, in particular for larger -values, (inducing strong deformations of the simulation box).
4 Conclusion
In this contribution we have introduced a simple model for an anisotropic patchy particle. Its elliptic, impenetrable body (with aspect ratio ) is decorated on its (co-)vertices by up to four Kern-Frenkel type of patches, which are shaped via two concentric circles, the inner ones being the osculating circles of the respective (co-)vertex; the radius of the outer circle sets the range of interaction which is assumed to be constant within the patch (i.e., a square-well type of interaction). Using (i) well-known criteria that provide evidence whether two ellipses overlap, touch each other, or do not overlap and (ii) the conventional criterion put forward within the original Kern-Frenkel model for the patch-patch interaction of circular particles our model is easily amenable to MC simulations.
We have studied elliptic patchy particles of aspect ratios , and 6, decorating the particles on their co-vertices with patches. Investigations have been carried out via standard Monte Carlo simulations in the NPT ensemble, considering typically 1000 particles.
Even though we have to postpone a more detailed and quantitative analysis of the structural data of the emerging phases to a future publication, we observe a clear tendency that the degree of shape anisotropy (in terms of the aspect ratio ) has a strong influence on the phase formation of the particles and on their equation-of-state: (i) comparable external parameters (i.e., temperature and pressure) lead to pronounced ordering effects (i.e., bundles of aligned, interacting particles) as increases, while for the formation of this type of order sets in only at considerably higher pressure-values; (ii) the patch-patch attraction leads to the expected shift in the equation-of-state (i.e., of the pressure) to higher densities. A more detailed analysis of the emerging phases and the location of the related phase boundaries requires more extensive simulations on a considerably finer pressure- and temperature-grid; we postpone these investigations to a future contribution.
Despite its simplicity, the model captures both shape anisotropy and patchiness in a faithful manner. It is also versatile in the sense as it is easily amenable to MC simulations and – using a continuous patch interaction instead of the square-well type of potential – is also ready to be used in standard molecular dynamics simulations. Via the different variants of surface decoration it is also possible to feature chirality by considering left- and right-handed particles in a binary mixture. The impact of the competition between attraction and repulsion or the competition of patches of different spatial extent on the emerging phases are other features that we plan to investigate in the future.
Acknowledgement(s)
Financial support by the TU Wien Doctorate College “BIOINTERFACE” is gratefully acknowledged. Computational resources by the Vienna Scientific Cluster (VSC) are gratefully acknowledged.
References
- [1] E. Bianchi, R. Blaak, and C.N. Likos, PCCP 13, 6397 (2011).
- [2] E. Bianchi, B. Capone, I. Coluzza, L. Rovigatti, P.D.J. van Oostrum, PCCP 19, 19847 (2017).
- [3] A. Patti, S. Sacanna, and K. Velikov (eds.), “Special Topic: Patchy colloidal particles”, Curr. Opin. Coll. Interface Sci. 30 (2017).
- [4] E. Bianchi, P.D.J. van Oostrum, C.N. Likos, and G. Kahl, Curr. Opin. Coll. Interface Sci. 30, 8 (2017).
- [5] M.A. Boles, M. Engel, and D.V. Talapin, Chem. Rev. 116, 11220 (2016).
- [6] N. Kern and D. Frenkel, J. Chem. Phys. 118, 9882 (2003).
- [7] J. Vieillard-Baron, J. Chem. Phys. 56, 4729 (1972).
- [8] J. Vieillard-Baron, Thèse de Doctorat d’Etat, Faculté des Sciences d’Orsay, Université de Paris (1970).
- [9] J. Cuesta and D. Frenkel, Phys. Rev. A 42, 2126 (1990).
- [10] S. Wagner and G. Kahl (to be published).
- [11] J.-P. Hansen and I.R. McDonald, Theory of Simple Liquids, Academic (Amsterdam, 2013), 4th edition.
- [12] G. Bautista-Carbajal and G. Odriozola, J. Chem. Phys. 140, 204502 (2014).
- [13] D. Frenkel and B. Smit, Understanding molecular simulations, Academic Press (Amsterdam, 2002) 2nd edition.