Variable stars in Palomar 13; an evaporating globular cluster.
Abstract
We present new CCD photometry of the distant globular cluster Pal 13. Fourier decomposition of the light curves of the three cluster member RRab stars lead to estimations of [Fe/H]=-1.65, and a distance of 23.670.57 kpc. Light and colour near minimum phases for RRab stars leads to an estimate of =0.104 0.001. A colour-magnitude diagram, built exclusively with likely star members, shows consistency with the above parameters and an age of 12 Gyrs. A search of variable stars in the field of view of our images revealed the variability of a red giant cluster member and of three probably non-member stars; two RRab stars and one W Virginis star or CW. The GAIA proper motions of member stars in Pal 13 show a significant scatter, consistent with the scenario of the cluster being tidally stripped.
keywords:
globular clusters: individual (Pal 13) – stars:variables:RR Lyrae1 Introduction
Palomar 13 is among a group of outer Galactic halo globular clusters (GC) that stand out for their low luminosity/radius ratio. Other members of the group are AM-4, Koposov 1,2, Whiting 1, Pal 1 and Seg 3 [Fadely et al., 2011].
Its low luminosity and rather large size, and tidal radius pc respectively [Mackey and van den Bergh, 2005], place it half way between Milky Way satellite ultra-faint galaxies and Galactic GC [Martin et al., 2008, Bradford et al., 2011] and the observed large radial velocity dispersion was interpreted as due to the tidal heating during perigalacticon passage or to the presence of dark matter [Côté et al., 2002]. An alternative explanation is the presence of a large fraction of unresolved binary stars that increase the single-epoch radial velocity dispersion [Blecha et al., 2004].
The fraction of binary stars is larger in clusters of low-luminosity and they can have a population in excess 40 percent in the cluster core [Milone et al., 2016]. According to Clark et al. [2004], Pal 13 exhibits a high binary fraction of about 30%4%.
However, when the velocity dispersion is corrected for the presence of unresolved binary stars, and the radial spread of metallicities is compared with that in ultra-faint galaxies, it is suggested that the cluster dynamics is consistent with the stellar mass and no dark matter or extreme tidal heating are required in this low-mass cluster [Bradford et al., 2011]. It has been suggested that Pal 13 is approaching its apogalacticon (farthest from Galactic center), and that tidal debris due to stripping throughout its orbit are compressed back to the cluster as it decelerates [Küpper et al., 2011]. The effects of orbital eccentricity and inclination on globular cluster tidal radii, escaping stars, and tidal compression at perigalacticon has also been discussed by Webb et al. [2014a, b].
Recently available GAIA proper motions [Gaia Collaboration et al., 2018] should shed some light on this scenario.
The colour-magnitude diagram (CMD) of Pal 13 displays a very scantily populated horizontal branch (HB) with no blue tail at all. The instability strip is occupied by only four RR Lyrae stars known at present. It seems likely that given the structure of the HB, no other RR Lyrae star is present in the cluster. The CMD shows however a significant population of blue stragglers, a number of bright stars in the upper instability strip above the HB, and some bright red giant stars, among which a thorough search might be rewarded with the detection of a few more variables. Since the discovery of the four RR Lyrae (V1-V4) by Rosino [1957], a very few time-series studies have been dedicated to the cluster; e.g. Ciatti et al. [1965], Ortolani et al. [1985], Siegel et al. [2001], the later already in the CCD era. However, these studies are based on a handful of plates or images taken in a short-time span. Surprisingly, the light curves of the four known RR Lyrae have not been studied in detail. We believe that a dedicated effort to study the morphology of the light curves and their use as physical parameters indicators, as well as a search for possible new variables, is in order. Despite the cluster being a distant and faint one, the common variable stars regions in the CMD, such as the Blue Stragglers, the RGB and upper instability strip, are within the reach of deep CCD photometry. In the present work we report the findings from the extended time-series photometry of this cluster and the exploration of the proper motions of stars in the field of Pal 13.
| Date | (s) | (s) | Avg seeing (”) | ||
|---|---|---|---|---|---|
| 20111004 | 16 | 600 | 18 | 200 | 2.0 |
| 20111005 | 20 | 600 | 20 | 200 | 2.4 |
| 20111006 | 7 | 600 | 8 | 200 | 2.5 |
| 20111007 | 1 | 600 | 2 | 200 | 1.7 |
| 20111102 | 16 | 400-600 | 16 | 125-200 | 1.5 |
| 20111103 | 14 | 380-450 | 14 | 125-200 | 1.4 |
| 20111104 | 9 | 425-500 | 10 | 120-200 | 1.6 |
| 20111105 | 0 | — | 3 | 60-120 | 1.6 |
| 20111215 | 12 | 500-600 | 15 | 125-200 | 2.8 |
| 20111216 | 3 | 600 | 4 | 200 | 1.9 |
| 20131024 | 19 | 300-400 | 19 | 120-150 | 1.7 |
| 20131025 | 8 | 480 | 10 | 240 | 2.0 |
| 20141015 | 2 | 700 | 4 | 250 | 1.8 |
| 20141016 | 4 | 500 | 6 | 250 | 1.8 |
| 20141017 | 2 | 500 | 2 | 250 | 3.4 |
| 20180712 | 29 | 60 | – | – | 1.7 |
| 20180713 | 24 | 60 | – | – | 1.5 |
| 20180714 | 32 | 60 | – | – | 1.4 |
| 20180715 | 4 | 60 | – | – | 1.6 |
| 20180724 | 20 | 60 | – | – | 1.7 |
| 20180725 | 23 | 60 | – | – | 1.4 |
| 20180811 | 56 | 60 | – | – | 1.9 |
| 20180812 | 72 | 60 | – | – | 1.5 |
| 20180813 | 47 | 60 | – | – | 1.8 |
| 20180814 | 72 | 60 | – | – | 1.5 |
| 20180815 | 64 | 60 | – | – | 1.6 |
| Total: | 576 | 151 |
*: Columns and give the number of images taken with the and filters respectively. Columns and contain the exposure time. The average seeing is listed in the last column.
2 Observations and Reductions
2.1 Observations
The observations were performed from two sites; 1) on 15 nights between October 4, 2011 and October 17, 2014 with the 2.0 m telescope at the Indian Astronomical Observatory (IAO), Hanle, India. A total of 133 and 151 images were obtained in the Johnson-Kron-Cousins and filters, respectively. The detector was a SITe ST-002 thinned backside illuminated CCD of 20482048 pixels with a scale of 0.296 arcsec/pix, translating to a field of view (FoV) of approximately 10.110.1 arcmin2. 2) on 11 nights between July 12, 2018 and August 15, 2018 with the 0.84 m telescope at the Observatorio Astronómico Nacional on the Sierra San Pedro Mártir (OAN-SPM), Baja California, México. A total of 443 images were obtained in the Johnson filter. The detector was a Spectral Instruments CCD of 10241024 pixels with a scale of 0.444 arcsec/pix, translating to a field of view (FoV) of approximately 7.577.57 arcmin2.
The log of observations is given in Table 1 where the dates, number of frames, exposure times and average nightly seeing are recorded.
2.2 Difference Image Analysis
We employed the technique of difference image analysis (DIA) (Alard 2000, Bramich et al. 2005) to carry out high-precision photometry for all of the point sources in the images of Pal 13 and we used the DanDIA111DanDIA is built from the DanIDL library of IDL routines available at http://www.danidl.co.uk pipeline for the data reduction process [Bramich, 2008, Bramich et al., 2013]. For the data sets of each observatory a reference image for the filter and another for the filter were constructed by stacking the best-quality images in each collection; then sequences of difference images in each filter were built by subtracting the respective convolved reference image from the rest of the collection. Differential fluxes for each star detected in the reference image were then measured on each difference image. Light curves for each star were constructed by calculating the total flux in ADU/s at each epoch from:
| (1) |
where is the reference flux (ADU/s), is the differential flux (ADU/s) and is the photometric scale factor (the integral of the kernel solution). Conversion to instrumental magnitudes was achieved using:
| (2) |
where is the instrumental magnitude of the star at time . The above procedure has been described in detail in Bramich et al. [2011].
| Variable | Filter | HJD | ||
|---|---|---|---|---|
| Star ID | (d) | (mag) | (mag) | |
| V1 | V | 2455839.17019 | 17.706 | 0.003 |
| V1 | V | 2455987.37903 | 17.664 | 0.003 |
| ⋮ | ⋮ | ⋮ | ⋮ | ⋮ |
| V1 | I | 2458345.99782 | 17.299 | 0.013 |
| V1 | I | 2455839.17700 | 17.091 | 0.006 |
| ⋮ | ⋮ | ⋮ | ⋮ | ⋮ |
| V2 | V | 2455839.17019 | 17.899 | 0.004 |
| V2 | V | 2455839.20103 | 17.949 | 0.004 |
| ⋮ | ⋮ | ⋮ | ⋮ | ⋮ |
| V2 | I | 2455839.16202 | 17.181 | 0.012 |
| V2 | I | 2455839.17700 | 17.171 | 0.007 |
| ⋮ | ⋮ | ⋮ | ⋮ | ⋮ |
2.3 Photometric Calibrations
2.3.1 Relative calibration
To correct from possible systematic errors and avoid mistaking them as bona fide variability in light curves, we apply the methodology developed in Bramich and Freudling [2012] to solve for the magnitude offsets that should be applied to each photometric measurement from the image . In terms of DIA, this translates into a correction (to first order) for the systematic error introduced into the photometry from an image due to an error in the fitted value of the photometric scale factor [Bramich et al., 2015]. We found that, in the present case, the systematic error corrections were negligible even for the brighter stars.
2.3.2 Absolute calibration
Standard stars in the field of Pal 13 are included in the online collection of Stetson [2000] 222http://www3.cadc-ccda.hia-iha.nrc-cnrc.gc.ca/community/STETSON/standards and we used them to transform instrumental magnitudes into the standard VI system.
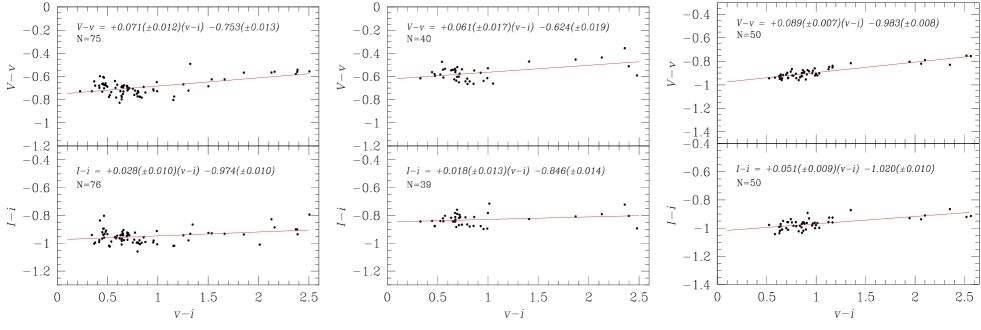
For the observations of Hanle, three different pointings were used. Since the collection of standard stars changes for each setting, we performed an independent transformation for each case. In all cases the standard minus the instrumental magnitudes show mild dependencies on the colour, as can be seen in Fig.1. The transformation equations between the instrumental and the standard magnitudes are given in each panel of the figure. Similar transformations were calculated for the observations of SPM and for briefness they are not explicitly included in this paper.
All of our VI photometry for the known variable stars in the FoV of Pal 13 is provided in Table 2. A small portion of this table is given in the printed version of this paper and the full table is available in electronic form.
| Variable | Variable | (days) | HJDmax | RA | Dec. | ||||
|---|---|---|---|---|---|---|---|---|---|
| Star ID | Typea | (mag) | (mag) | (mag) | (mag) | this work | (d +245 0000.) | (J2000.0) | (J2000.0) |
| V1 | RRab | 17.886 | 17.244 | 0.80 | 0.51 | 0.538192 | 5839.2010 | 23:06:41.53 | +12:46:58.94 |
| V2 | RRab | 17.819 | 17.164 | 0.79 | 0.51 | 0.597080 | 6591.2802 | 23:06:44.47 | +12:46:16.12 |
| V3 | RRab | 17.766 | 17.121 | 0.83 | 0.56 | 0.578190 | 5839.2998 | 23:06:43.14 | +12:46:47.80 |
| V4 | RRab | 17.886 | - | 0.52 | - | 0.575130 | 8342.8849 | 23:06:48.83 | +12:41:22.30 |
| V51 | SR | 17.029 | 15.930 | 0.4 | - | 7.26 | 5842.1160 | 23:06:37.28 | +12:49:27.49 |
| RRab | 21.123 | 19.720 | 1.6 | - | 0.508228 | 5870.0997 | 23:06:30.25 | +12:49:40.16 | |
| RRab | 17.993 | 16.731 | 1.1 | - | 0.515811 | - | 23:06:33.32 | +12:42:41.61 | |
| CW | 17.452 | 16.619 | 0.3 | - | 7.57 | 5841.2595 | 23:06:41.44 | +12:49:28.71 |
1: Newly found in this paper.
*: These stars are very likely not cluster members.
3 The RR Lyrae stars in Pal 13
Pal 13 being a very inconspicuous globular cluster, published light curves of the RR Lyrae V1-V4 are very rare. To the best of our knowledge, only blue light curves were published by Ciatti et al. [1965]. Unfortunately the data used in their work are not available for systematic comparison. Thus, we believe this is the first detailed analysis of the light curves of the 4 RR Lyrae known in the field of the cluster. A discussion of the cluster physical parameters from its RR Lyrae stars and the stellar membership in the cluster follows in the remainder of this work.
3.1 Periods
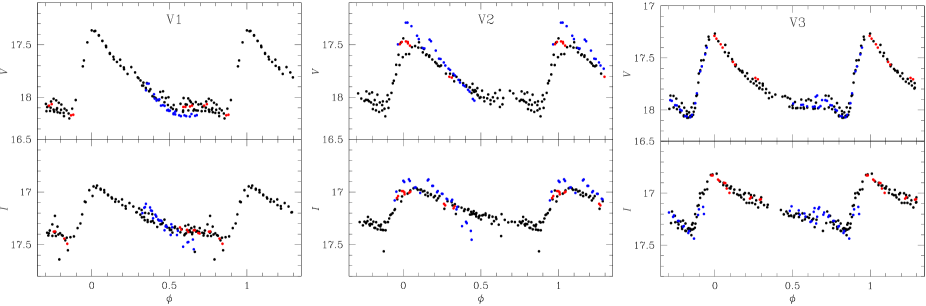
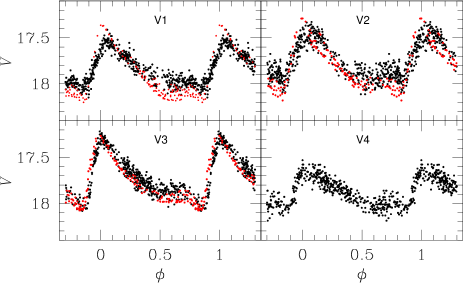
The periods of V1, V2 and V3, estimated using exclusively the data from the Hanle data-set properly phase the light curves as shown in Fig. 2. These periods however, if applied to the SPM data-set produce light curves phase-shifted by a few tenths of a phase suggesting that the periods need refinement. The combination of the two data sets provide the refined periods listed in Table 3, producing the phased light curves in Fig. 3. The panels show the good correspondence of the Hanle (red) and SPM (black) light curves. For V4 we have no Hanle data since it was not included in the FoV.
3.2 Reddening
Before proceeding to the physical parameter estimations, it is necessary to decide the reddening of the cluster. We have taken advantage of the result from Sturch [1966] that RRab stars have nearly the same intrinsic colour at minimum light, and of the calibration made by Guldenschuh et al. [2005] of = 0.580.02. Applying these results to the four RRab stars in Pal 13 we found an average value of 0.1040.001, in excellent agreement with the the values from the dust maps and the calibrations of Schlegel et al. [1998] and Schlafly and Finkbeiner [2011] of 0.1140.004 and 0.0980.003, respectively. We shall adopt 0.10, or [Schlegel et al., 1998], in the rest of this paper.
3.3 Light curve Fourier decomposition
With the aim of estimating key physical parameters, a Fourier decomposition of the light curves of the RR Lyrae stars was performed.
To this end, the standard procedure is to represent the light curves by the Fourier series of harmonics:
| (3) |
where is the magnitude at time , is the period and the epoch, generally a time of maximum light. A linear minimization routine is used to derive the amplitudes and phases of each harmonic, from which the Fourier parameters and are calculated. The resulting mean magnitudes , and the Fourier coefficients for the four RRab stars are listed in Table 4. While in principle we should not include stars with evident amplitude-phase modulations. Since the RR Lyrae sample is limited, we made an effort to include the Blazhko variables V1, V2 and V4 by fitting their data at largest amplitude. It is well known that if Blazhko and stable stars are mixed in the calculation of physical parameters the uncertainties will increase. Particularly the value of [Fe/H], which if determined from phases of low amplitudes will be overestimated [Cacciari et al., 2005]. According to Szeidl [1976], Blazhko variables at largest amplitudes are comparable to stable stars. Hence, we decomposed these Blazhko RR Lyrae light curves exclusively from data at maximum amplitude.
| Variable ID | |||||||||
|---|---|---|---|---|---|---|---|---|---|
| ( mag) | ( mag) | ( mag) | ( mag) | ( mag) | |||||
| V1 | 17.886(4) | 0.310(6) | 0.114(6) | 0.100(6) | 0.058(6) | 3.882( 62) | 8.104( 80) | 5.974(122) | 2.1 |
| V2 | 17.819(5) | 0.279(7) | 0.118(7) | 0.091(8) | 0.049(7) | 3.747( 81) | 8.191(108) | 6.175(178) | 2.9 |
| V3 | 17.766(4) | 0.267(6) | 0.131(5) | 0.101(5) | 0.062(6) | 3.765( 61) | 7.890( 86) | 5.875(123) | 2.7 |
| V4 | 17.886(3) | 0.173(4) | 0.051(4) | 0.049(5) | 0.027(4) | 3.990(103) | 8.169(120) | 6.608(193) | 1.6 |
These Fourier parameters and the semi-empirical calibrations of Jurcsik and Kovacs [1996], for RRab stars, were used to obtain [Fe/H]ZW on the Zinn and West [1984] metallicity scale that can be transformed to the UVES scale using the equation [Fe/H]UVES= +0.130 [Fe/H] [Fe/H] [Carretta et al., 2009]. The absolute magnitude can be derived from the calibrations of Kovács and Walker [2001] for RRab stars. was estimated using the calibration of Jurcsik [1998]. For brevity we do not explicitly present here the above mentioned calibrations; however, the corresponding equations, and most importantly their zero points, have been discussed in detail in previous papers [Arellano Ferro et al., 2011, 2013], where the corresponding equations towards the calculation of , log, and can be found. We refer the interested reader to those papers.
The [Fe/H] calibration for RRab stars of Jurcsik and Kovacs [1996] is applicable to stars with a deviation parameter , defined by Jurcsik and Kovacs [1996] and Kovács and Kanbur [1998], not exceeding an upper limit. These authors suggest . The is listed in column 10 of Table 4. The criterion is fulfilled by all four stars.
| Star | [Fe/H]ZW | [Fe/H]UVES | log | log | (kpc) | |||
| V1 | 0.638(9) | 3.812(15) | 1.645(3) | 24.27(10) | 0.67(12) | 5.31(2) | ||
| V2 | 0.582(10) | 3.804(21) | 1.667(4) | 24.15(12) | 0.67(17) | 5.65(3) | ||
| V3 | 0.629(8) | 3.801(15) | 1.648(3) | 23.06(9) | 0.69(13) | 5.59(2) | ||
| V4 | 0.701(6) | 3.800(23) | 1.620(2) | 23.58(7) | 0.65(18) | 5.45(2) | ||
| Weighted Mean | 0.654(4) | 3.805(9) | 1.639(2) | 23.67(4) | 0.67(7) | 5.48(1) | ||
| 0.15 | 0.20 | 0.052 | 0.005 | 0.019 | 0.57 | 0.02 | 0.15 |
The individual physical parameters for the four RRab stars and the inverse-variance weighted means are reported in Table 5.
The average [Fe/H]ZW= is in agreement with the average spectroscopic determination of [Fe/H]= found by Bradford et al. [2011] on 16 member stars.
The weighted mean values for the RRab stars are 0.6210.031 mag and will be used in section 5 to estimate the mean distance to the parent cluster.
4 The Oosterhoff type of Pal 13
The value of [Fe/H]=-1.88 for Pal 13 adopted by Harris [1996] in his data compilation of globular clusters immediately suggests an Oosterhoff type II for the cluster (OoII), as no OoI cluster is known with such a low metallicity. Nevertheless, the average period of its RRab stars V1-V4 is 0.572 days, i.e. the expected value for an OoI cluster.
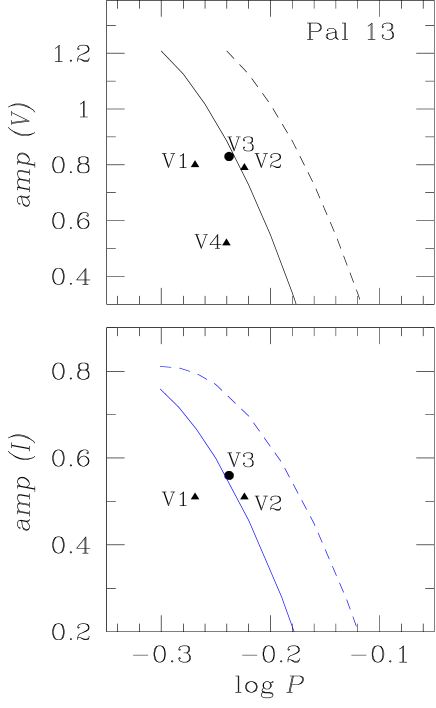
The Bailey, or period-amplitude diagram, of Pal 13 for the and filters is shown in Fig. 4. In this diagram the continuous lines represent the loci derived for the OoI clusters M3 by Cacciari et al. [2005] in -band, and NGC 2808 by Kunder et al. [2013] in -band. dashed curves correspond to the loci that should occupy RR Lyrae stars that are evolved past the ZAHB, typical of OoII systems. Despite the low number of RRab stars in Pal 13 and the fact that some are affected by Blazhko modulations, it is clear that their distributions corresponds to that of an OoI cluster.
Our estimation of [Fe/H]ZW=-1.650.15 places Pal 13 among the most metal week of the OoI clusters, competing with NGC 4147 [Arellano Ferro et al., 2018b].
5 Distance to Pal 13 from the RR Lyrae stars
We calculate the distance to Pal 13 using two independent approaches based on the RR Lyrae stars. The first approach involves the calculation of via the Fourier light curve decomposition of the RRab stars. We averaged the distances only for V1-V4, to find 23.67 0.57 kpc. The membership of V4 to the cluster has been doubted given its large distance from the cluster center. We note however, that the distance to V4 itself, 23.72 kpc, is not at all different from the other three RRab stars. It should be noted too that V4 at about 5’ from the cluster center, is well within the King tidal radius, which according to Bradford et al. [2011] is at 13.9’. We shall offer further arguments in favour of V4 cluster membership later in this paper.
The second approach is from the -band RR Lyrae P-L relation derived by Catelan et al. [2004]:
| (4) |
with and and [Salaris et al., 1993].
We do not have -band data for V4. The average result for V1-V3 is 24.34 0.50 kpc.
The above independent estimations of the cluster distance are, within their uncertainties, in good agreement.
6 The Colour-Magnitude Diagram of Pal 13
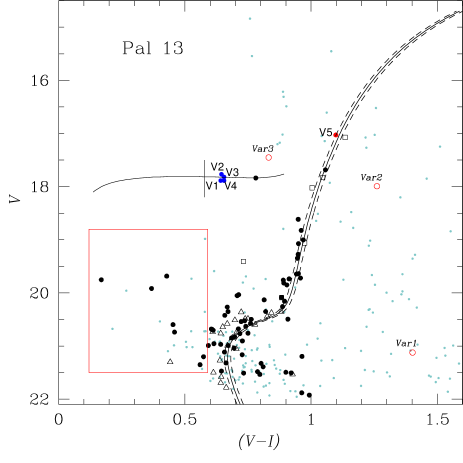
Pal 13 is a faint and sparse cluster, hence the field is populated by a large number of non-member stars. A proper motion photographic analysis by Siegel et al. [2001] identified a number of reliable cluster members. We built a Colour-Magnitude Diagram (CMD) in Fig. 5 where the black symbols are member stars while the light blue are not. We complemented the list of member stars by a few identified by Côté et al. [2002] from their radial velocities and from the list of members furnished from the proper motions available at the SIMBAD Pal 13 data base; open squares and open triangles in Fig. 5, respectively. A total of 102 members with photometry in our study have been identified.
It is obvious that the cluster lacks of a significant red giant branch (RGB), and the HB is only populated by five stars including the four RR Lyrae, a fact that was noticed early in the study of Ciatti et al. [1965]. The black vertical line in the HB of Fig. 5, represents the border between the first overtone and fundamental pulsating RR Lyrae, or the red edge of the first overtone (RFO) instability strip [Arellano Ferro et al., 2016]. We do not have -band data for V4 as it is not in the field of Hanle and no observations were done in SPM. We have estimated its colour from a few images taken at the SWOPE telescope in Las Campanas and kindly made available to us by Dr. Nidia Morrell. V4 is found next to V1-V3 in the CMD, as expected given that it has a very similar temperature (see Table 5). Thus, V1-V4 fall on the fundamental region and not on the ”either-or” region, to the blue of the RFO. Pal 13 is one more example of Oo I type clusters without RRab stars in the ”either-or” region, a property shared with all Oo II and with some but not all OoI clusters; the exceptions being for example with NGC 3201, NGC 5904 and NGC 6934, see Arellano Ferro et al. [2018c] for a discussion (their figure 8).
The age of Pal 13 has been approximately estimated as 12 Gyrs, [Borissova et al., 1997, Bradford et al., 2011], thus we overlaid an isochrone for this age and a zero age horizontal branch (ZAHB) from the model collection of VandenBerg et al. [2014] for [Fe/H]=, and [/Fe]=0.4. These models were shifted to a reddening of =0.08, 0.09 and 0.10 and distance of 23.67 kpc calculated in and . Given the scatter in the RGB this uncertainty in the reddening is not unreasonable.

6.1 Previous estimates of the distance of Pal 13
Literature distance estimates for Pal 13 are generally in good agreement within a small range. Borissova et al. [1997] reports distance modulus equivalent to distances between 24.5 and 26.0 kpc. On the other hand, Siegel et al. [2001] and Côté et al. [2002] find 24.8 and 24.31.3 kpc respectively. The value listed by Harris [1996] is 26 kpc. Our values reported in 5 via independent methods; 23.97 0.67 and 24.34 0.50, are in good terms with previous estimates.
6.2 Note on the age of Pal 13
One can find in the literature several estimates of the age of Pal 13. A differential approach with Pal 5 and an statistical analysis of the CMD led Borissova et al. [1997] to conclude an age of 122 Gyrs and a metallicity of [Fe/H]=. Côté et al. [2002] argue a good isochrone fitting with a [Fe/H]= model of 14 Gyrs on the CMD, and Siegel et al. [2001] also find that 12 Gyrs is an age consistent with their CMD. The calibration of the age indicator V (HB-TO) of Peterson [1987] (his eq. 3), and our V (HB-TO) = 3.25 estimation from Fig. 6 suggests and age of 12.3 Gyrs. As argued in 6 our CMD also favours an age of about 12 Gyrs.
7 The horizontal branch of Pal 13
In order to better understand the evolutionary status of the variable stars found on the horizontal branch of Pal 13, we computed our own evolution models, using our well calibrated version of the Eggleton code [see Eggleton, 1971, 1972, 1973, Schröder et al., 1997]. For the mass-loss on the upper RGB, we use the prescription and calibration, physically motivated by Schröder and Cuntz [2005].
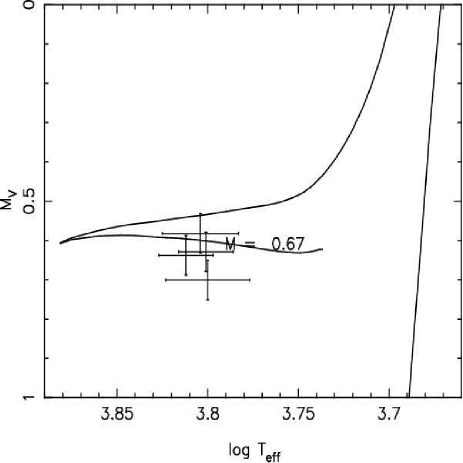
We find a good match for the stretch of the horizontal branch of Pal 13 in colour (or rather, effective temperature) by a ZAHB (zero age horizontal branch) model of 0.67 solar masses, of which 0.50 solar masses are concentrated in the He-core, see Fig. 8. This is entirely consistent with the average mass we find empirically for the variable stars V1 to V4 (see Table 5) and the masses of V1 and V2, in particular.
Our evolution models of the respective progenitor stars have an initial zero age main sequence (ZAMS) mass of 0.85 solar masses. By a modified Reimers wind (not dust-driven mass-loss, with additional terms for gravity and effective temperature according to Schröder and Cuntz [2005], this model loses 0.18 solar masses on the upper RGB, before it reaches its tip and in reality would undergo a Helium flash to lift the degeneracy of its core at an age of 11.95 Gyrs. This age is perfectly consistent with the matching isochrone of VandenBerg (2014) in Fig. 5 and not much different from the other ages found in the literature, as stated above. We consider the He-flash imminent, and therefore ignore the further numerical evolution as unphysical, at a luminosity provided by the onset of He-burning of 0.15 solar luminosities.
The not very blue horizontal branch of Pal 13 can, hence, be reproduced with mainly one evolution model only. The slowest evolution, providing the largest probability of finding horizontal branch stars here (and so to explain the nature of V1-V4), is the lower strech in the earlier phases of central helium burning. These stars evolve from just redwards of the instability strip, where they start Helium burning as ZAHB stars, to its blue side. Their evolution should be too slow to change their period measurably in human life-times.
After central Helium burning, on their return to the red side of the HRD and onto the AGB, HB evolution accelerates. Stars on that upper part of the track would distinguish themselves by being brighter by a quarter of a magnitude and a very slow Period increase, which might be observable over decades. However, their population number is much reduced by the higher evolutionary speed, and not many of these stars should be found. Few significant examples have been identified in the globular clusters M5 [Arellano Ferro et al., 2016] and NGC 6171 [Arellano Ferro et al., 2018c]. Considering the sparse population of Pal 13, indeed hardly any HB star should be expected to be found in that phase.
8 Search for new variables
Given the clear scarcity of known variables in Pal 13, we have taken advantage of our time-series photometry to perform a careful search of new variables by different approaches, notwithstanding the risk of not finding any.
The red box in CMD is an arbitrarily defined blue stragglers region in which 8 cluster members are identified. An exploration of the light curves of these stars revealed no variations.

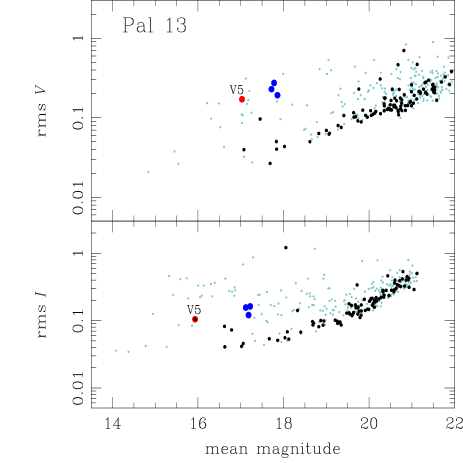
Fig. 6 shows the rms magnitude deviation diagrams for all stars measured in our images, in the field of Pal 13 in the and light curves. Stars with a large rms are prone to be variable. The one cluster member star that displays a large rms in both and turned our to be a RG variable whose light curve is shown in Fig. 7 and we have named it V5.
We have also applied the phase dispersion minimization approach to all the stars in the FoV of our images: This indeed recovered the four known RR Lyrae stars and identified three new variables among the non-members in the FoV the cluster. Their light curves are show in Fig. 9 . We refrain from assigning them a variable number but identify them as , and . Given their periods and light curve shapes, and seem to be RRab stars and Var3 is likely a W Virginis star or CW. Their ephemerides are given in Table 3.
Finally, we blinked all the differential images in our collection in search for observable flux variations. We identified all variables mentioned above but failed detecting a new one.
8.1 Comments on the new variables
V5. This variable sits on the lower RGB, rather the subgiant branch. Its period of about 7 days is however too short to classify the star as an SR which are normally much brighter, closer to the tip of the RGB, and have periods larger than 20 days. This kind of variable giants have been found in 47 Tuc [Albrow et al., 2001] and Cen [Weldrake et al., 2007]. In the Catalogue of Variable Stars in Globular Clusters these stars are identified as L? (C. Clement. private communication)
and . The periods and light curve shape of these two stars suggest they are RRab stars. Their peculiar position by at least 0.3 mag to the red of the RGB is puzzling since even being field stars they would need to be subject to a much heavier reddening than the rest of the cluster stars.
Var3. The period of 7.5 days and its position on the CMD suggest this non-member star to be a CW variable, also known as W Virginis stars, projected on the cluster field.
9 On the velocity and proper motion dispersion in Pal 13
Two properties make of Pal 13 a peculiar globular cluster; its shallow surface density profile and a high velocity dispersion of km s-1 that results in the M/L of about 40, the highest known among galactic globular clusters [Siegel et al., 2001, Côté et al., 2002]. It was shown by Bradford et al. [2011] that removing binary stars reduces, at least partially, the velocity dispersion, from where these authors conclude that Pal 13 must have a larger fraction of binaries than most Milky Way globular clusters. However, the large M/L ratio does not preclude the possibility that Pal 13 is in fact an ultra-faint dwarf galaxy or dSph satellite. From their N-body computations Küpper et al. [2011] concluded that the cluster is near its apogalacticon, and that the large velocity dispersion is due to unbound stars within the cluster and extra tidal stars (tidal debries) which get pushed back into the vicinity of the cluster when the cluster-tail system gets decelerated on its way to apogalacticon, and not to actual tidal shocking. Such an scenario should be reflected in the proper motion distribution.
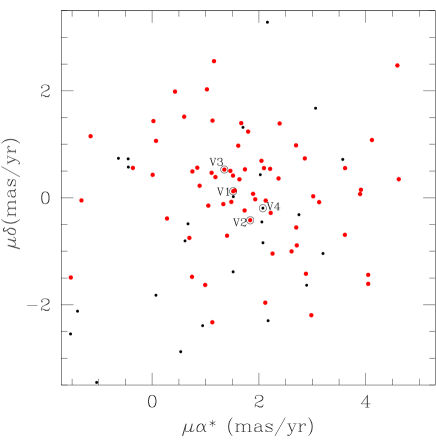
We have extracted from the Gaia Collaboration et al. [2018], the proper motions of stars in the field of Pal 13 within a radius of 8 arc minutes, containing 323 Gaia sources. Bustos Fierro & Calderón (private communication) found 69 probable members following a method developed by them and which shall be published elsewhere. Fig. 10 shows the vector point diagram (VPD) of Pal 13. The 69 likely cluster members are represented by the red points. V1-V4 are marked. The average proper motion components are = 1.92 0.19 and = 0.13 0.13. These values can be compared with those of Küpper et al. [2011] (2.30 0.26,0.27 0.25) or with more recent values from the Hubble Space Telescope proper motions calculated by Sohn et al. [2018] (1.70 0.09,0.080.06) and those from the -DR2 from Vasiliev [2019] (1.615 0.101,0.1420.089).
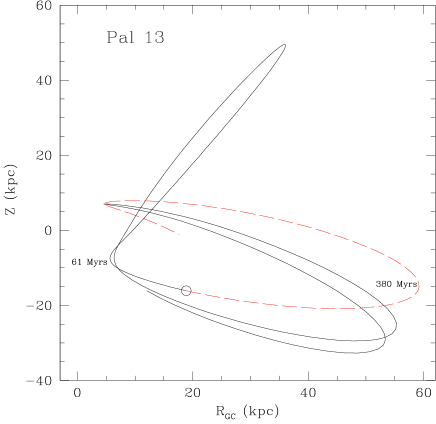
By making use of our values for the mean proper motions, a mean radial velocity of 24.5 km/s and a distance to the Sun of 23.67 kpc, in an axisymmetrical Galactic potential [Allen et al., 2006], we have calculated the Galactic orbit of Pal 13 from 2.5 Gyrs in the past to 0.8 Gyrs into the future, this is displayed in Fig. 11. For an easy comparison with the orbits in [Küpper et al., 2011] (their figure 2), we used the same galactic and solar motion parameters. The new smaller mean average proper motions from produce a more excentric orbit but otherwise they are quite similar. The cluster experienced its last perigalacticon passage about 61 Myrs and shall reach its next apogalacticon in another 380 Myrs. It is debatable which of these two contributes most to the proper motion perturbation of the cluster stars.
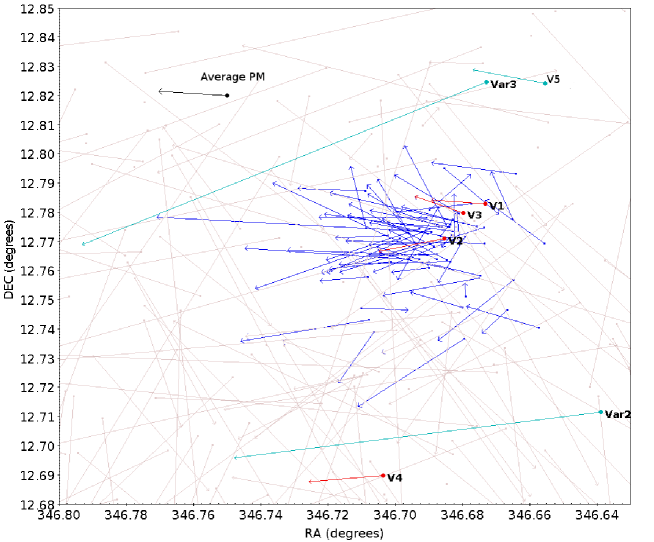
In Fig. 12, we have plotted the proper motion vectors on the plane of the sky. Member and non-member stars are shown with blue and light gray arrows respectively. The four known RR Lyrae stars are plotted with red arrows and the newly discovered variables V5, and are shown in green colour. The star has no proper motion in the -DR2 data base. The average proper motion of the member stars is shown with a black arrow.
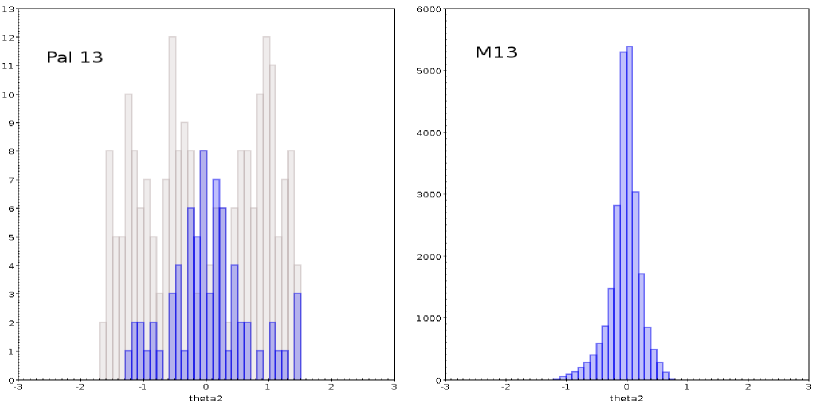
A noticeable high dispersion of proper motions even among members is evident. It is contrary to the dispersion observed in other clusters. To highlight this fact we have compared with M13, a massive compact cluster whose star members are moving in an ordered tandem.
We have calculated the deviation of each proper motion vector relative to the average of the member stars. Fig 13 shows the distribution of the proper motion dispersions in Pal 13 and in M13. It seems clear that the proper motions of cluster members are largely scattered, which is consistent with the scenario of the cluster being evaporating. While it is true that the cluster is approaching the apogalacticon as noticed by Küpper et al. [2011], the cluster is much closer to its last passage by the perigalacticon, event that has most likely contributed to the proper motions dispersion, as it has been discussed by Webb et al. [2014a, b] in terms of escaping stars by tidal compression at perigalacticon.
On the basis of the proper motion scatter displayed by Pal 13, and the variable star positions on the CMD, we can reassure that V1-V5 are cluster members whereas the new variables and are not.
10 Summary and discussion
The Fourier decomposition of the light curves of the RR Lyrae stars in Pal 13, and the calibrations and zero points available in recent literature, enable the determination of the mean metallicity and distance of this faint cluster. [Fe/H] and kpc were found. Individual values of radius and mass are also provided. The employment of the RR Lyrae P-L relation derived by Catelan et al. [2004] gives a distance of 24.34 kpc.
In connection with the membership of V4 to Pal 13 we should note that the star is within the King tidal radius [Bradford et al., 2011] and its distance matches that of the other RR Lyrae in the cluster. Furthermore, an analysis of the proper motions of Pal 13 and surrounding regions, in particular of those considered members of the cluster, shows that V4’s proper motion is within the members scatter, consistent with being part of cluster.
We note that in the HB instability strip of Pal 13, the RRab stars V1, V2, V3 and V4 lie on the fundamental region of the instability strip. They are in the central He-burning phase and very slowly evolving bluewards on the HB. Pal 13 is yet another Oo I cluster without fundamental pulsators in the ”either-or” region, property that it is shared with most, but not all, Oo I clusters, and certainly with all OoII clusters (see Arellano Ferro et al. [2018a] for a recent discussion on this issue).
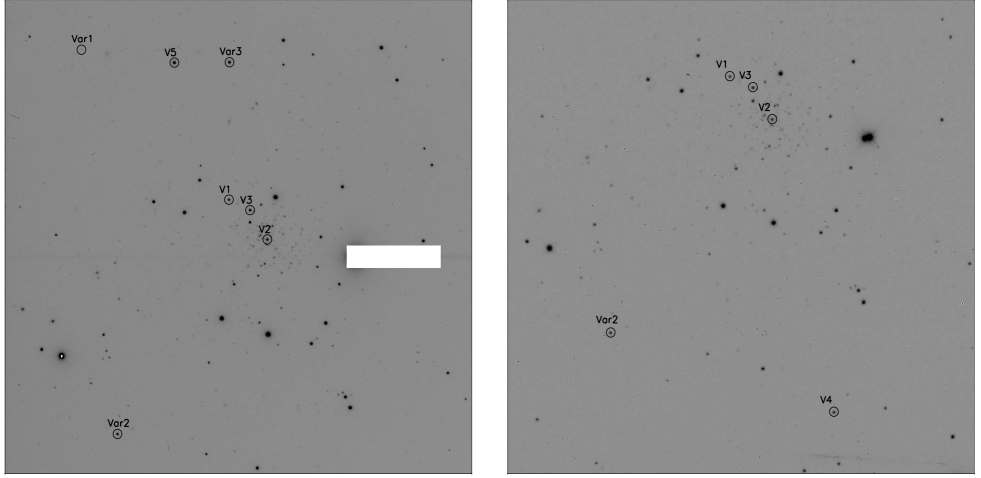
We report the discovery of a new variable, V5 sitting on the RGB with a period of about 7.2 d, classified as a bright giant variable or probably an SR. Three more variables were found among the non-member population of the cluster; we have refrained from assigning a formal variable number to them but identified as , and , in the finding chart of Fig. 14 and in Table 3, and classified the first two as RRab and as CW respectively.
Finally, the inspection of the GAIA proper motions of stars considered members, reveals a large scatter, confirming that the cluster members are dissociating, in accordance with the scenario that the internal dynamics is altered as the cluster is near its apogalacticon [Küpper et al., 2011].
Acknowledgments
We are thankful to Dan Deras for his help during some of the observations, to Ivan Bustos and Jesús Calderón for their useful comments on the stellar membership and to Alonso Luna for his help with the production of some graphical material. We acknowledge the financial support from DGAPA-UNAM (Mexico) via grant IN106615-17. M. A. Yepez is grateful to the Department of Astronomy of the University of Guanajuato for warm hospitality during the preparation of this work. We have made an extensive use of the SIMBAD and ADS services, for which we are thankful.
References
- Alard [2000] Alard, C., 2000. A&AS 144, 363–370.
- Albrow et al. [2001] Albrow, M.D., Gilliland, R.L., Brown, T.M., Edmonds, P.D., Guhathakurta, P., Sarajedini, A., 2001. ApJ 559, 1060–1081.
- Allen et al. [2006] Allen, C., Moreno, E., Pichardo, B., 2006. The Orbits of 48 Globular Clusters in a Milky Way-like Barred Galaxy. ApJ 652, 1150–1169.
- Arellano Ferro et al. [2018a] Arellano Ferro, A., Ahumada, J.A., Bustos Fierro, I.H., Calderón, J.H., Morrell, N.I., 2018a 339, 183–197.
- Arellano Ferro et al. [2016] Arellano Ferro, A., Ahumada, J.A., Kains, N., Luna, A., 2016. MNRAS 461, 1032–1044.
- Arellano Ferro et al. [2013] Arellano Ferro, A., Bramich, D.M., Figuera Jaimes, R., Giridhar, S., Kains, N., Kuppuswamy, K., Jørgensen, U.G., Alsubai, K.A., Andersen, J.M., Bozza, V., Browne, P., Calchi Novati, S., Damerdji, Y., Diehl, C., Dominik, M., Dreizler, S., Elyiv, A., Giannini, E., Harpsøe, K., Hessman, F.V., Hinse, T.C., Hundertmark, M., Juncher, D., Kerins, E., Korhonen, H., Liebig, C., Mancini, L., Mathiasen, M., Penny, M.T., Rabus, M., Rahvar, S., Ricci, D., Scarpetta, G., Skottfelt, J., Snodgrass, C., Southworth, J., Surdej, J., Tregloan-Reed, J., Vilela, C., Wertz, O., Mindstep Consortium, 2013. MNRAS 434, 1220–1238.
- Arellano Ferro et al. [2011] Arellano Ferro, A., Figuera Jaimes, R., Giridhar, S., Bramich, D.M., Hernández Santisteban, J.V., Kuppuswamy, K., 2011. MNRAS 416, 2265–2284.
- Arellano Ferro et al. [2018b] Arellano Ferro, A., Rojas Galindo, F.C., Muneer, S., Giridhar, S., 2018b. RMxAA 54, 325–339.
- Arellano Ferro et al. [2018c] Arellano Ferro, A., Rosenzweig, P., Luna, A., Deras, D., Muneer, S., Giridhar, S., Michel, R., 2018c. Astronomische Nachrichten 339, 158–167.
- Blecha et al. [2004] Blecha, A., Meylan, G., North, P., Royer, F., 2004. A & A 419, 533–541.
- Borissova et al. [1997] Borissova, J., Markov, H., Spassova, N., 1997. A&AS 121, 499–505.
- Bradford et al. [2011] Bradford, J.D., Geha, M., Muñoz, R.R., Santana, F.A., Simon, J.D., Côté, P., Stetson, P.B., Kirby, E., Djorgovski, S.G., 2011. ApJ 743, 167.
- Bramich [2008] Bramich, D.M., 2008. MNRAS 386, L77–L81.
- Bramich et al. [2015] Bramich, D.M., Bachelet, E., Alsubai, K.A., Mislis, D., Parley, N., 2015. A&A 577, A108.
- Bramich et al. [2011] Bramich, D.M., Figuera Jaimes, R., Giridhar, S., Arellano Ferro, A., 2011. MNRAS 413, 1275–1294.
- Bramich and Freudling [2012] Bramich, D.M., Freudling, W., 2012. MNRAS 424, 1584–1599.
- Bramich et al. [2013] Bramich, D.M., Horne, K., Albrow, M.D., Tsapras, Y., Snodgrass, C., Street, R.A., Hundertmark, M., Kains, N. , Arellano Ferro, A., Figuera, J.R., Giridhar, S., 2013. MNRAS 428, 2275–2289.
- Bramich et al. [2005] Bramich, D.M., Horne, K., Bond, I.A., Street, R.A., Collier Cameron, A., Hood, B., Cooke, J., James, D., Lister, T.A., Mitchell, D., Pearson, K., Penny, A., Quirrenbach, A., Safizadeh, N., Tsapras, Y., 2005. MNRAS 359, 1096–1116.
- Cacciari et al. [2005] Cacciari, C., Corwin, T.M., Carney, B.W., 2005. AJ 129, 267–302.
- Carretta et al. [2009] Carretta, E., Bragaglia, A., Gratton, R., D’Orazi, V., Lucatello, S., 2009. A&A 508, 695–706.
- Catelan et al. [2004] Catelan, M., Pritzl, B.J., Smith, H.A., 2004. ApJS 154, 633–649.
- Ciatti et al. [1965] Ciatti, F., Rosino, L., Sussi, M.G., 1965. Veroeffentlichungen der Remeis-Sternwarte zu Bamberg 27, 228.
- Clark et al. [2004] Clark, L.L., Sandquist, E.L., Bolte, M., 2004. AJ 128, 3019–3033.
- Côté et al. [2002] Côté, P., Djorgovski, S.G., Meylan, G., Castro, S., McCarthy, J.K., 2002. ApJ 574, 783–804.
- Eggleton [1971] Eggleton, P.P., 1971. MNRAS 151, 351.
- Eggleton [1972] Eggleton, P.P., 1972. MNRAS 156, 361.
- Eggleton [1973] Eggleton, P.P., 1973. MNRAS 163, 279.
- Fadely et al. [2011] Fadely, R., Willman, B., Geha, M., Walsh, S., Muñoz, R.R., Jerjen, H., Vargas, L.C., Da Costa, G.S., 2011. AJ 142, 88.
- Gaia Collaboration et al. [2018] Gaia Collaboration, Brown, A.G.A., Vallenari, A., Prusti, T., de Bruijne, J.H.J., Babusiaux, C., Bailer-Jones, C.A.L., Biermann, M., Evans, D.W., Eyer, L., et al., 2018. A &A 616, A1.
- Guldenschuh et al. [2005] Guldenschuh, K.A., Layden, A.C., Wan, Y., Whiting, A., van der Bliek, N., Baca, P., Carlin, J., Freismuth, T., Mora, M., Salyk, C., Vera, S., Verdugo, M., Young, A., 2005. PASP 117, 721–725.
- Harris [1996] Harris, W.E., 1996. AJ 112, 1487.
- Jurcsik [1998] Jurcsik, J., 1998. A&A 333, 571–582.
- Jurcsik and Kovacs [1996] Jurcsik, J., Kovacs, G., 1996. A&A 312, 111–120.
- Kovács and Kanbur [1998] Kovács, G., Kanbur, S.M., 1998. MNRAS 295, 834–846.
- Kovács and Walker [2001] Kovács, G., Walker, A.R., 2001. A&A 371, 579–591.
- Kunder et al. [2013] Kunder, A., Stetson, P.B., Cassisi, S., Layden, A., Bono, G., Catelan, M., Walker, A.R., Paredes Alvarez, L., Clem, J.L., Matsunaga, N., Salaris, M., Lee, J.W., Chaboyer, B., 2013. AJ 146, 119.
- Küpper et al. [2011] Küpper, A.H.W., Mieske, S., Kroupa, P., 2011. MNRAS 413, 863–877.
- Mackey and van den Bergh [2005] Mackey, A.D., van den Bergh, S., 2005. MNRAS 360, 631–645.
- Martin et al. [2008] Martin, N.F., de Jong, J.T.A., Rix, H.W., 2008. ApJ 684, 1075–1092.
- Milone et al. [2016] Milone, A.P., Marino, A.F., Bedin, L.R., Dotter, A., Jerjen, H., Kim, D., Nardiello, D., Piotto, G., Cong, J., 2016. MNRAS 455, 3009–3019.
- Ortolani et al. [1985] Ortolani, S., Rosino, L., Sandage, A., 1985. AJ 90, 473–478.
- Peterson [1987] Peterson, C.J., 1987 99, 1153–1160.
- Rosino [1957] Rosino, L., 1957. MmSAI 28, 293.
- Salaris et al. [1993] Salaris, M., Chieffi, A., Straniero, O., 1993. ApJ 414, 580–600.
- Schlafly and Finkbeiner [2011] Schlafly, E.F., Finkbeiner, D.P., 2011. ApJ 737, 103.
- Schlegel et al. [1998] Schlegel, D.J., Finkbeiner, D.P., Davis, M., 1998. ApJ 500, 525–553.
- Schröder and Cuntz [2005] Schröder, K.P., Cuntz, M., 2005. ApJL 630, L73–L76.
- Schröder et al. [1997] Schröder, K.P., Pols, O.R., Eggleton, P.P., 1997 285, 696–710.
- Siegel et al. [2001] Siegel, M.H., Majewski, S.R., Cudworth, K.M., Takamiya, M., 2001. AJ 121, 935–950.
- Sohn et al. [2018] Sohn, S.T., Watkins, L.L., Fardal, M.A., van der Marel, R.P., Deason, A.J., Besla, G., Bellini, A., 2018. ApJ 862, 52.
- Stetson [2000] Stetson, P.B., 2000. PASP 112, 925–931.
- Sturch [1966] Sturch, C., 1966. ApJ 143, 774.
- Szeidl [1976] Szeidl, B., 1976. Multiple Periodic RR Lyrae Stars: Observational Review, in: Fitch, W.S. (Ed.), IAU Colloq. 29: Multiple Periodic Variable Stars, p. 133.
- VandenBerg et al. [2014] VandenBerg, D.A., Bergbusch, P.A., Ferguson, J.W., Edvardsson, B., 2014. ApJ 794, 72.
- Vasiliev [2019] Vasiliev, E., 2019. MNRAS 484, 2832–2850.
- Webb et al. [2014a] Webb, J.J., Leigh, N., Sills, A., Harris, W.E., Hurley, J.R., 2014a. MNRAS 442, 1569–1577.
- Webb et al. [2014b] Webb, J.J., Sills, A., Harris, W.E., Hurley, J.R., 2014b. MNRAS 445, 1048–1055.
- Weldrake et al. [2007] Weldrake, D.T.F., Sackett, P.D., Bridges, T.J., 2007. AJ 133, 1447–1469.
- Zinn and West [1984] Zinn, R., West, M.J., 1984. ApJS 55, 45–66.