Spin-orbit coupling and spin relaxation in phosphorene: Intrinsic versus extrinsic effects
Abstract
First-principles calculations of the essential spin-orbit and spin relaxation properties of phosphorene are performed. Intrinsic spin-orbit coupling induces spin mixing with the probability of , exhibiting a large anisotropy, following the anisotropic crystalline structure of phosphorene. For realistic values of the momentum relaxation times, the intrinsic (Elliott–Yafet) spin relaxation times are hundreds of picoseconds to nanoseconds. Applying a transverse electric field (simulating gating and substrates) generates extrinsic symmetric spin-orbit fields in phosphorene, which activate the D’yakonov–Perel’ mechanism for spin relaxation. It is shown that this extrinsic spin relaxation also has a strong anisotropy, and can dominate over the Elliott-Yafet one for strong enough electric fields. Phosphorene on substrates can thus exhibit an interesting interplay of both spin relaxation mechanisms, whose individual roles could be deciphered using our results.
Phosphorene is a monolayer of black phosphorus Brown and Rundqvist (1965); Cartz et al. (1979); Keyes (1953); Maruyama et al. (1981); Narita et al. (1983), exhibiting a direct band gap of 2 eV Castellanos-Gomez et al. (2014); Liang et al. (2014) and large anisotropic mobility Castellanos-Gomez et al. (2014); Liu et al. (2014); Qiao et al. (2014). Unlike graphene, phosphorene is a semiconductor, and unlike two-dimensional transition-metal dichalcogenides, which are semiconductors too, phosphorene is distinctly anisotropic thanks to its puckered atomic structure. The semiconductor property makes phosphorene suitable for electronic Li et al. (2014) and spintronics applications Žutić et al. (2004); Fabian et al. (2007), in particular for bipolar spin diodes and transistors Žutić et al. (2006), while the anisotropy enables directional control of the essential spin properties, such as spin-orbit coupling and spin relaxation. In contrast to graphene, whose spin properties are by now well established Han et al. (2014), there is no unified picture of the spin-orbit coupling and spin relaxation in phosphorene.
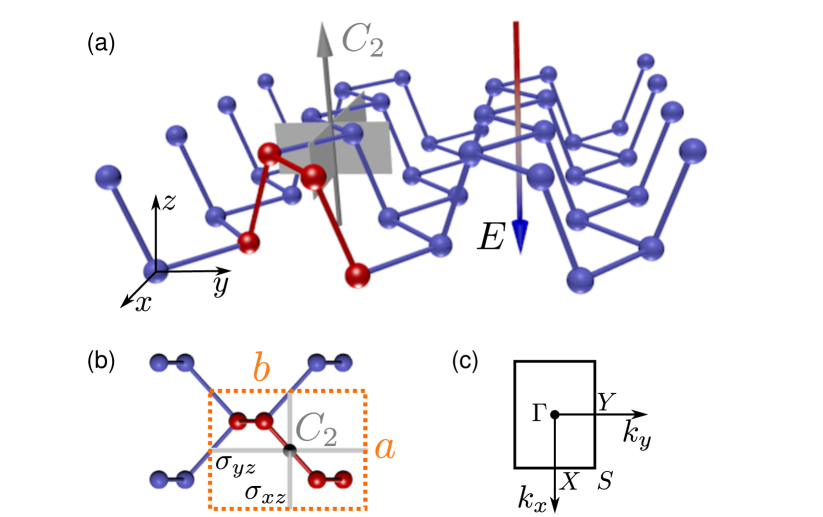
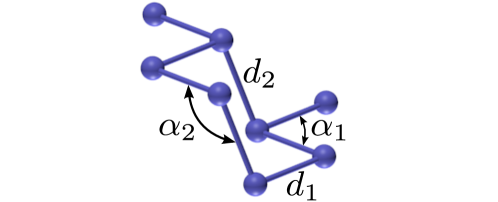
Phosphorene can be extracted from black phosphorus by mechanical (Xia et al., 2014; Liu et al., 2014; Li et al., 2014) or liquid (Brent et al., 2014; Kang et al., 2015) cleavage techniques. Inside phosphorene layers, each phosphorus atom is covalently bonded with three adjacent phosphorus atoms to form a puckered honeycomb structure due to hybridization, see Fig. 1. The puckered structure can be viewed as a two-layer system in which the bonding energy is dominated by the in-plane bonds ( and ) that are much stronger than the bonds connecting the two sublayers () (Li and Appelbaum, 2014). Similarly to graphene, the edges of phosphorene form zig-zag (along axis) and armchair (along axis) chains [see Fig. 1b)].
Black phosphorus is described by the nonsymmorphic point group being isomorphic with the space group. Phosphorene shares the same point group symmetry as its bulk counterpart. Both structures have inversion symmetry leading to spin degenerate eigenstates. Spin-orbit coupling leads to the spin-mixing of the Pauli spinors—the intrinsic effect. When inversion symmetry of phosphorene is broken by an applied transverse electric field or a substrate, the point group is reduced to nonsymmorphic , with the principal axis parallel to the direction of the electric field and two mirror planes and [Fig. 1 (a,b)]. In this case the spin degeneracy is lifted—the extrinsic (Rashba) effect.
From the spintronics perspective two questions are particularly important to address: (i) what is the intrinsic and extrinsic spin-orbit coupling (SOC) in phosphorene and (ii) what are the relevant spin relaxation time scales. The answer to the first question has been partially answered by Popović et al. Popović et al. (2015) who showed that the extrinsic Rashba effect, due to external electric fields, is anisotropic with respect to the two principal directions in the crystal. The second question has been addressed within theory Li and Appelbaum (2014) for the intrinsic effects only.
Here we employ first-principles calculations to address both questions, providing state-of-the-art most realistic results for the extrinsic and intrinsic effects. First, we find that intrinsic SOC lifts degeneracy of the valence and conduction bands at the S point, by splitting the bands of about 17.5 meV and 14 meV, respectively. The extrinsic Rashba SOC is much weaker, of the order of tens of eV close to the point (for electric fields of 1 V/nm), and is found to be significantly anisotropic for the valence band only. Second, we predict the spin lifetime in phosphorene to be hundreds of picoseconds up to nanoseconds, for the experimentally relevant mobilities. We find that for no and small electric fields up to ( V/nm) and carrier densities up to cm-2, the dominant spin relaxation mechanism is the Elliott–Yafet Elliott (1954); Yafet (1963). For the in-plane spin orientation the relaxation is almost twice the slower than for spins oriented out-of-plane. By increased transverse electric field the D’yakonov–Perel’ Dyakonov and Perel (1971) mechanism starts to be the most effective. For carrier density cm-2 it overtakes the Elliott–Yafet’s at V/nm for holes and V/nm for electrons. As a result, the substrates can be essential for spin dynamics in phosphorene due to an interplay between the D’yakonov–Perel’ and the Elliott–Yafet relaxation mechanisms.
Intrinsic phosphorene belongs to the family of centrosymmetric crystals for which the dominant spin relaxation mechanism is the Elliott–Yafet scattering Elliott (1954); Yafet (1963). The strength of the scattering can be quantified by the spin admixture coefficient Elliott (1954), which is a signature of intrinsic spin-orbit coupling. The time-reversal and space-inversion symmetries require two Bloch states and of the same band and momentum to be degenerate (Kramer’s doublets). Due to spin-orbit coupling these states are mixtures of spin up and spin down Pauli spinors: , . For a generic Bloch state the modulation functions and are selected to diagonalize the spin magnetic moment along the chosen direction, corresponding to the injected spin in experiment; for weak spin-orbit coupling, stands for the small spin component being admixed to the large spin component , i. e., . The Eliott–Yafet scattering parameter is defined as the Fermi surface average of the unit cell integrated admixture coefficient ,
| (1) | |||||
| (2) |
where , is the density of states per spin at the Fermi level, is the Fermi velocity, and is the area of the Brillouin zone. If the scattering potential is spin-independent (scalar impurities and phonons), the intrinsic SOC leads to spin-flip scattering. The Elliott–Yafet mechanism gives for the spin relaxation rate, Elliott (1954); Fabian and Das Sarma (1998)
| (3) |
where is the momentum relaxation rate.
Extrinsic effects appear once the space inversion symmetry gets broken, e.g., by a substrate or external fields. The spin degeneracy gets lifted and another spin relaxation mechanism appears: D’yakonov–Perel’ Dyakonov and Perel (1971). This mechanism can be viewed as a motional narrowing of the spin precession in a fluctuating (due to momentum scattering) emerging spin-orbit field , which is related to the spin splitting as
| (4) |
where is the vector of Pauli matrices. In the relevant limit of small correlation times (), i. e., when the precession angle between the scattering events is small, the spin relaxation rate becomes, Dyakonov and Perel (1971)
| (5) |
where is the Fermi contour average of the squared spin-orbit field projected to the plane perpendicular to the spin orientation.
In our first-principles calculations we used the initial crystal structure parameters from Ref. Brown and Rundqvist (1965)
for bulk black phosphorus. A sheet of phosphorene was placed in vacuum of 20 Å and fully relaxed using
quasi–Newton variable–cell scheme as implemented in the Quantum Espresso (Giannozzi et al., 2009) package.
Positions of atoms have been relaxed in all directions with the force convergence threshold
Ry/a.u. and total energy convergence condition Ry/a.u..
The norm-conserving pseudopotential, with kinetic energy cutoffs of 70 Ry and 280 Ry for the
wavefunction and charge density respectively, has been used along with the PBE exchange-correlation functional
Perdew et al. (1996).
Obtained structural parameters are summarized in Ref. see Suplementary information .
Further electronic structure calculations have been performed using the full-potential linearized augmented plane-wave
method as implemented in all-electron code package Wien2k Blaha et al. (2001). Self-consistency has been achieved
for Monkhorst-Pack -point grid with 151 –points in the irreducible wedge of the
Brillouin zone. SOC has been included fully relativistically for core electrons while five valence electrons
have been treated within second variational step method Singh and Nordstrom (2006).
For the calculations with the transverse electric field we considered vacuum size of 25 Å.
It is known that standard DFT methods underestimate the bandgap of semiconductors. Theoretical bandgaps of phosphorene spread between eV and eV depending on the method of calculationsRodin et al. (2014); Qiao et al. (2014); Liu et al. (2014); Hu et al. (2014); Rudenko and Katsnelson (2014); Tran et al. (2014).
On the other hand, recent experimental reports suggest the bandgap of phosphorene of about 2 eV Liang et al. (2014); Wang et al. (2015).
It has been reported for standard semiconductors Chantis et al. (2006) that the underestimation of the bandgap impairs significantly SOC effects.
Therefore, to consider a realistic bandgap we perform the calculations with
undressed LDA functional along with the modified Becke–Johnson potential
Tran and Blaha (2009) parametrized to give the bandgap of eV.
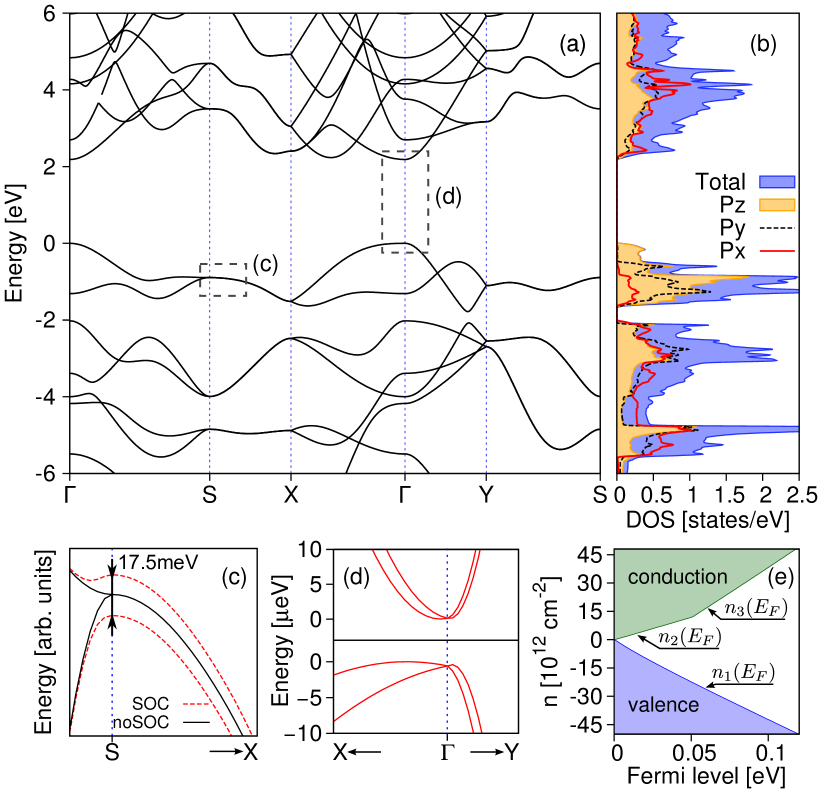
The calculated band structure of phosphorene is shown in Fig. 2. We get a direct gap at the zone center. Some DFT calculations Popović et al. (2015); Rodin et al. (2014); Ziletti et al. (2015) report a nearly indirect bandgap, with a somewhat displaced valence band maximum. The valence band in the vicinity of the point along is nearly dispersionless while it is very dispersive in the direction. Similar, but substantially smaller dispersion anisotropy is seen in the conduction band. Close to the point both, the valence and the conduction band have mainly orbital character, the latter having a small admixture of orbitals see Suplementary information . The next conduction band minimum appears at energy meV above the global conduction band minimum (in direction towards the X point) and consists mainly of and orbitals with an admixture of electrons. The small distance of this band to the conduction band minimum is reflected as an increase of the slope in the carrier density shown in Fig. 2(e) as a function of the Fermi level . For the valence band the carrier density is a smooth quadratic function of . Empirical fits for the dependence , which should be useful for interpreting experiments, are given in the caption to Fig. 2.
Intrinsic effects.
We first discuss the intrinsic SOC and the Elliott–Yafet spin relaxation.
The intrinsic SOC in phosphorene is relatively strong but does not modify substantially the bandstructure close to the bandgap. The orbital degeneracy of the fourfold degenerate bands, see inset to Fig. 2(c), is split into two pairs of spin degenerate bands. The splitting is maximal at the S point, meV and meV for valence and conduction band respectively, gradually decreasing towards the time reversal points X and Y. The states at the Brillouin zone edges sticking together due to nonsymmorphicity of the group Dresselhaus et al. (2008).
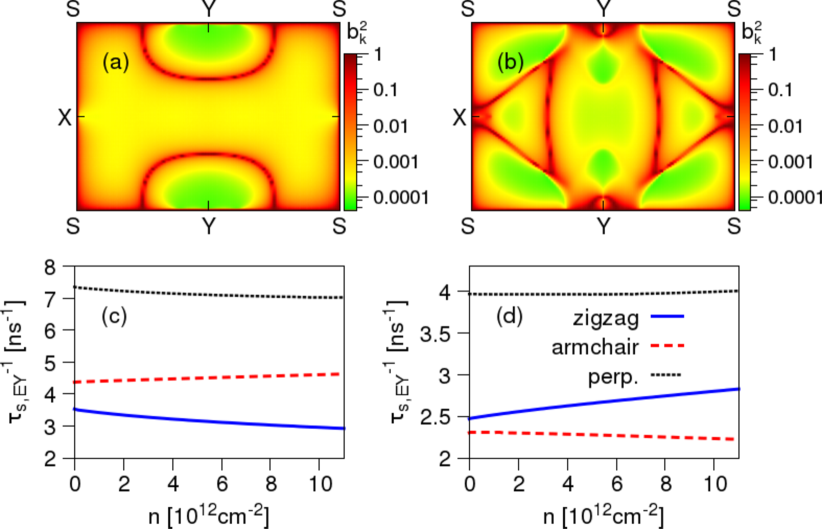
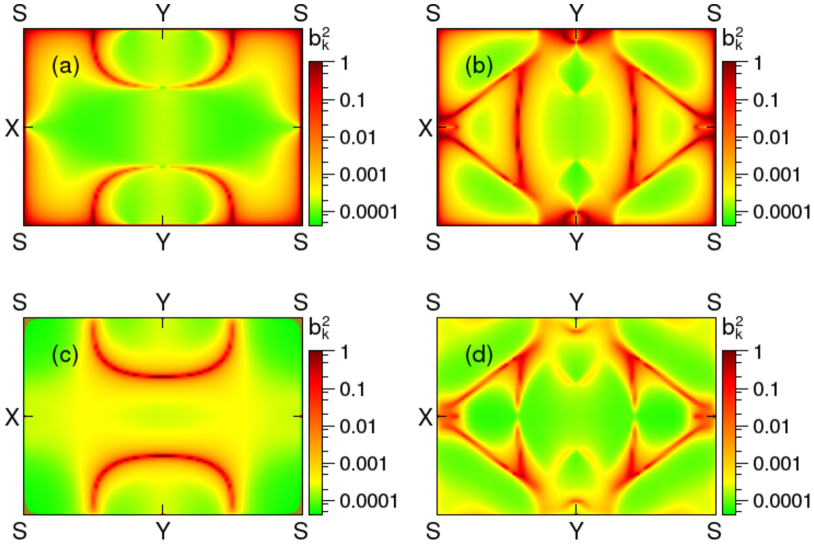
The important effect of the intrinsic SOC is the spin mixing, quantified by . In Fig. 3(a,b) we show the distribution of spin mixing parameter in the first Brillouin zone of phosphorene for the spin quantization axis oriented perpendicular to the 2D plane. The other spin orientations are discussed in Ref. see Suplementary information . For momenta corresponding to anticrossings and at the BZ edges (except the points X and Y for which is zero) the values of are close to . The Bloch eigenstates here are fully spin-mixed, forming spin hot spots Fabian and Das Sarma (1998); Fabian and Sarma (1999). At the zone center is about . Perturbation theory gives that is roughly the ratio of the intrinsic spin-orbit coupling (order 10 meV) and the band gap (order 1 eV), thus , matches well to the calculated first-principles value of . For comparison, the theory gives between to Li and Appelbaum (2014).
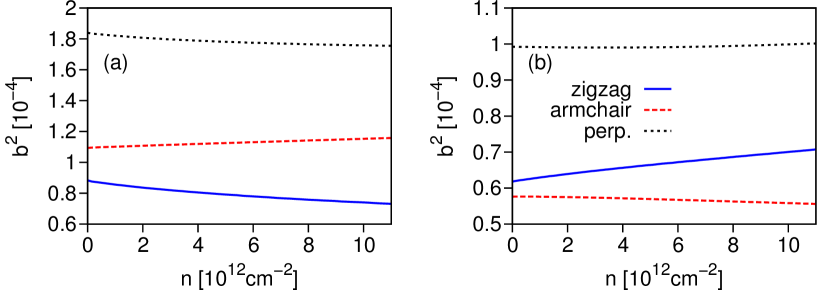
Knowing we now calculate the Elliott–Yafet spin relaxation rates using Eq. (3). For the momentum relaxation we take the typical experimental value of fs. The results can be easily rescaled for the actual experimental mobilities. Calculated as a function of carrier density , for valence and conduction bands and different spin quantization axes, are shown in Fig. 3(c,d). The relaxation rates are almost independent of , which follows since we use a constant momentum relaxation time. The monotonicity of is then unambiguously determined by . The spin relaxation rates of holes are greater than those of electrons. Most striking is the strong anisotropy. The largest spin relaxation is for out-of-plane spins, which relax roughly twice as fast as the in-plane spins. We predict the longest spin lifetimes for armchair-oriented spins in the conduction band, and zigzag-oriented spins in the valence band. In the recent theory Li and Appelbaum (2014), the estimated ratio between the spin relaxation rate for out-of-plane to in-plane spins was , which is an overestimation in view of our first-principles results, but is in a qualitative agreement. Similar anisotropies in Elliott–Yafet spin lifetimes were also predicted for anisotropic bulk materials and thin metallic films Zimmermann et al. (2012); Long et al. (2013).
Extrinsic effects.
In realistic situations phosphorene sits on a substrate or is studied in a gating
electric field which breaks space inversion symmetry ().
An extrinsic Rashba spin-orbit field emerges, lifting the spin degeneracy,
, according to Eq. (4),
except at time-reversal invariant points.
Emerged spin-orbit fields give rise to spin relaxation due to the D’yakonov–Perel’ mechanism,
which competes with the Elliott–Yafet spin-flip scattering. Here we model the symmetry breaking by
applying a transverse electric field, all within the first-principles calculations, of 1 V/nm.
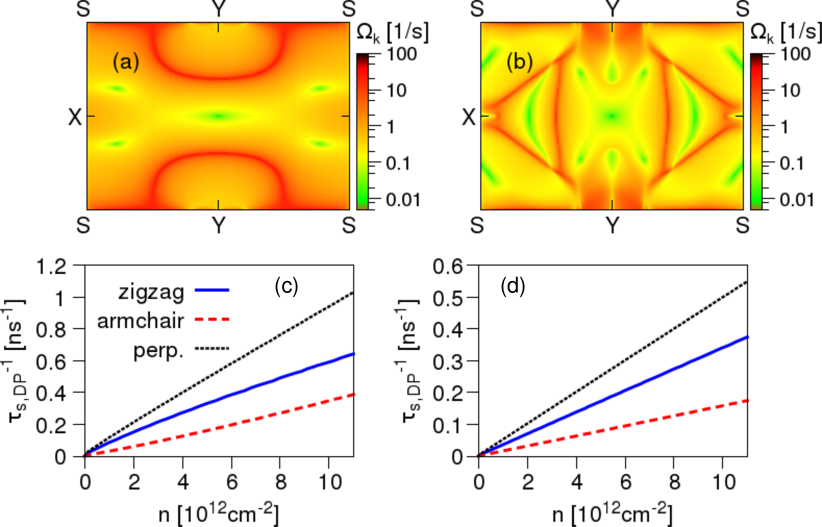
In Fig. 4(a,b) we plot the spin-orbit field magnitude over the first Brillouin zone.
Similarly to , the values of are peaked at the bands anticrossings
and at the BZ edges.
At the time-reversal points the is zero.
We note, that for a bare PBE exchange-correlation functional Perdew et al. (1996) (band gap eV), the Rashba spin-orbit coupling due to external electric fields exhibits a strong anisotropy in the valence as well as in the conduction band Popović et al. (2015).
Our calculations show that increasing the bandgap to the experimental value eV removes the anisotropy from the conduction band, while it is preserved for the valence band.
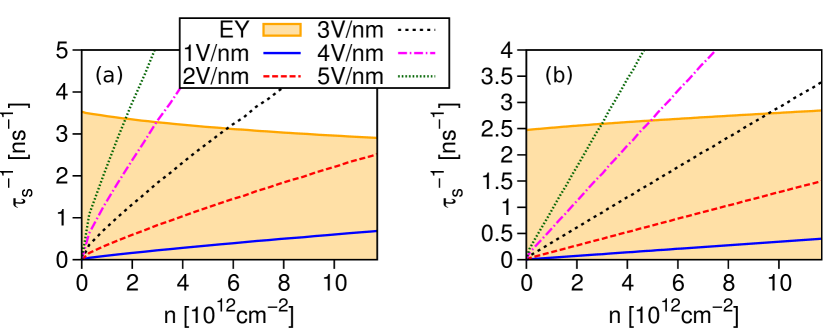
To obtain the spin relaxation rates for the D’yakonov–Perel’ mechanism, we resolve the coordinate components of the vector spin-orbit fields which lie in the phosphorene plane: along (zigzag) and along (armchair) directions. We extract these components by fitting an effective symmetric spin-orbit coupling Hamiltonian to the first-principles data see Suplementary information . In Fig. 4(c,d) we show the calculated spin relaxation rates using Eq. (5), assuming V/nm and fs. The spin lifetime is exceptionally long, of a few ns, and exceeds the lifetime from the Elliott–Yafet mechanism. The relaxation rates for conduction electrons are twice smaller than for the valence electrons. With a growing electric field, the D’yakonov–Perel’ mechanism becomes more significant. For the valence band, it surpasses the Elliot–Yafet’s for cm-2, cm-2 and cm-2 for electric fields V/nm, V/nm and V/nm respectively. For the conduction band the transitions happen for slightly higher carrier densities. For electric fields V/nm the D’yakonov–Perel’ spin relaxation rates are times bigger than for V/nm. Similarly to , the spin-orbit field reveals a strong anisotropy. As a result the in-plane spins relax about times slower than the out-of-plane ones.
In summary, we have studied intrinsic and extrinsic spin-orbit coupling and spin relaxation mechanisms in phosphorene. The Elliott–Yafet spin relaxation gives spin lifetimes less than nanoseconds for experimentally relevant samples. The D’yakonov–Perel’ mechanism matters at large electric fields. The lifetimes exhibit a large anisotropy for in-plane and out-of-plane spin orientations.
We acknowledge funding from DFG SPP 1538, SFB 689, NCN DEC-2013/11/B/ST3/00824 and the EU Seventh Framework Programme under Grant Agreement No. 604391 Graphene Flagship.
References
- Brown and Rundqvist (1965) A. Brown and S. Rundqvist, Acta Crystallographica 19, 684 (1965).
- Cartz et al. (1979) L. Cartz, S. R. Srinivasa, R. J. Riedner, J. D. Jorgensen, and T. G. Worlton, The Journal of Chemical Physics 71, 1718 (1979).
- Keyes (1953) R. W. Keyes, Phys. Rev. 92, 580 (1953).
- Maruyama et al. (1981) Y. Maruyama, S. Suzuki, K. Kobayashi, and S. Tanuma, Physica B+C 105, 99 (1981).
- Narita et al. (1983) S. Narita, Y. Akahama, Y. Tsukiyama, K. Muro, S. Mori, S. Endo, M. Taniguchi, M. Seki, S. Suga, A. Mikuni, and H. Kanzaki, Physica B+C 117–118, Part 1, 422 (1983).
- Castellanos-Gomez et al. (2014) A. Castellanos-Gomez, L. Vicarelli, E. Prada, J. O. Island, K. L. Narasimha-Acharya, S. I. Blanter, D. J. Groenendijk, M. Buscema, G. A. Steele, J. V. Alvarez, H. W. Zandbergen, J. J. Palacios, and H. S. J. v. d. Zant, 2D Mater. 1, 025001 (2014).
- Liang et al. (2014) L. Liang, J. Wang, W. Lin, B. G. Sumpter, V. Meunier, and M. Pan, Nano Letters 14, 6400 (2014).
- Liu et al. (2014) H. Liu, A. T. Neal, Z. Zhu, Z. Luo, X. Xu, D. Tománek, and P. D. Ye, ACS Nano 8, 4033 (2014).
- Qiao et al. (2014) J. Qiao, X. Kong, Z.-X. Hu, F. Yang, and W. Ji, Nature Communications 5 (2014), 10.1038/ncomms5475.
- Li et al. (2014) L. Li, Y. Yu, G. J. Ye, Q. Ge, X. Ou, H. Wu, D. Feng, X. H. Chen, and Y. Zhang, Nature Nanotechnology 9, 372 (2014).
- Žutić et al. (2004) I. Žutić, J. Fabian, and S. Das Sarma, Rev. Mod. Phys. 76, 323 (2004).
- Fabian et al. (2007) J. Fabian, A. Matos-Abiague, C. Ertler, P. Stano, and I. Žutić, Acta Phys. Slovaca 57, 565 (2007).
- Žutić et al. (2006) I. Žutić, J. Fabian, and S. Erwin, IBM J. Res. and Dev. 50, 121 (2006).
- Han et al. (2014) W. Han, R. K. Kawakami, M. Gmitra, and J. Fabian, Nature Nanotechnology 9, 794 (2014).
- Xia et al. (2014) F. Xia, H. Wang, and Y. Jia, Nature Communications 5 (2014), 10.1038/ncomms5458.
- Brent et al. (2014) J. R. Brent, N. Savjani, E. A. Lewis, S. J. Haigh, D. J. Lewis, and P. O’Brien, Chem. Commun. 50, 13338 (2014).
- Kang et al. (2015) J. Kang, J. D. Wood, S. A. Wells, J.-H. Lee, X. Liu, K.-S. Chen, and M. C. Hersam, ACS Nano 9, 3596 (2015).
- Li and Appelbaum (2014) P. Li and I. Appelbaum, Phys. Rev. B 90, 115439 (2014).
- Popović et al. (2015) Z. S. Popović, J. M. Kurdestany, and S. Satpathy, Phys. Rev. B 92, 035135 (2015).
- Elliott (1954) R. J. Elliott, Physical Review 96, 266 (1954).
- Yafet (1963) Y. Yafet, in Solid State Physics, Vol. 14, edited by F. Seitz and D. Turnbull (Academic, New York, 1963).
- Dyakonov and Perel (1971) M. I. Dyakonov and V. I. Perel, Sov. Phys. Solid State 13, 3023 (1971).
- Fabian and Das Sarma (1998) J. Fabian and S. Das Sarma, Phys. Rev. Lett. 81, 5624 (1998).
- Giannozzi et al. (2009) P. Giannozzi, S. Baroni, N. Bonini, M. Calandra, R. Car, C. Cavazzoni, D. Ceresoli, G. L. Chiarotti, M. Cococcioni, I. Dabo, A. Dal Corso, S. de Gironcoli, S. Fabris, G. Fratesi, R. Gebauer, U. Gerstmann, C. Gougoussis, A. Kokalj, M. Lazzeri, L. Martin-Samos, N. Marzari, F. Mauri, R. Mazzarello, S. Paolini, A. Pasquarello, L. Paulatto, C. Sbraccia, S. Scandolo, G. Sclauzero, A. P. Seitsonen, A. Smogunov, P. Umari, and R. M. Wentzcovitch, Journal of Physics: Condensed Matter 21, 395502 (19pp) (2009).
- Perdew et al. (1996) J. P. Perdew, K. Burke, and M. Ernzerhof, Phys. Rev. Lett. 77, 3865 (1996).
- (26) see Suplementary information, For structural parameters, calculation of effective SOC Hamiltonian parameters, spin-orbit fields, spin mixing parameter . The distribution of in the first Brillouiin zone and orbital decomposition of the band structure are also shown.
- Blaha et al. (2001) P. Blaha, K. Schwarz, G. K. H. Madsen, D. Kvasnicka, and J. Luitz, WIEN2K, An Augmented Plane Wave + Local Orbitals Program for Calculating Crystal Properties (Karlheinz Schwarz, Techn. Universität Wien, Austria, 2001).
- Singh and Nordstrom (2006) D. J. Singh and L. Nordstrom, Planewaves, Pseudopotentials, and the LAPW Method (Springer US, 2006).
- Rodin et al. (2014) A. Rodin, A. Carvalho, and A. Castro Neto, Phys. Rev. Lett. 112, 176801 (2014).
- Hu et al. (2014) T. Hu, Y. Han, and J. Dong, Nanotechnology 25, 455703 (2014).
- Rudenko and Katsnelson (2014) A. N. Rudenko and M. I. Katsnelson, Phys. Rev. B 89, 201408 (2014).
- Tran et al. (2014) V. Tran, R. Soklaski, Y. Liang, and L. Yang, Phys. Rev. B 89, 235319 (2014).
- Wang et al. (2015) X. Wang, A. M. Jones, K. L. Seyler, V. Tran, Y. Jia, H. Zhao, H. Wang, L. Yang, X. Xu, and F. Xia, Nature Nanotechnology 10, 517 (2015).
- Chantis et al. (2006) A. N. Chantis, M. van Schilfgaarde, and T. Kotani, Phys. Rev. Lett. 96, 086405 (2006).
- Tran and Blaha (2009) F. Tran and P. Blaha, Phys. Rev. Lett. 102, 226401 (2009).
- Ziletti et al. (2015) A. Ziletti, S. M. Huang, D. F. Coker, and H. Lin, Phys. Rev. B 92, 085423 (2015).
- Dresselhaus et al. (2008) M. S. Dresselhaus, G. Dresselhaus, and A. Jorio, Group Theory: Application to the Physics of Condensed Matter (Springer-Verlag Berlin Heidelberg, 2008).
- Fabian and Sarma (1999) J. Fabian and S. D. Sarma, Phys. Rev. Lett. 83, 1211 (1999).
- Zimmermann et al. (2012) B. Zimmermann, P. Mavropoulos, S. Heers, N. H. Long, S. Blügel, and Y. Mokrousov, Phys. Rev. Lett. 109, 236603 (2012).
- Long et al. (2013) N. H. Long, P. Mavropoulos, S. Heers, B. Zimmermann, Y. Mokrousov, and S. Blügel, Phys. Rev. B 88, 144408 (2013).
- Bychkov and Rashba (1984) Y. A. Bychkov and E. I. Rashba, JETP Lett. 39, 78 (1984).
Supplementary information
Structural parameters
Structure parameters for phosphorene obtained by structural relaxation Giannozzi et al. (2009) and experimental values for black phosphorus Brown and Rundqvist (1965) are given in Tab. 1. The lattice constants, interlayer bond distances and bond angles are sketched in Fig. 5.
| 2D relaxed | bulk exp. (Brown and Rundqvist, 1965) | |
|---|---|---|
| a | 3.2986 Å | 3.3136 |
| b | 4.6201 Å | 4.376 |
| 2.2223 Å | 2.224 | |
| 2.2601 Å | 2.244 | |
| 95.833 | 96.34 | |
| 104.085 | 102.09 |
Spin–mixing parameters
In Fig. 6 we plot the distribution of the spin-mixing parameter in the first Brillouin zone for phosphorene and spin quantization axis along the zigzag [Fig. 6(a,b)] and the armchair direction [Fig. 6(c,d)]. The differences between the two spin quantization axes are remarkable. For the zigzag spin quantization axis the spin hot spots are located both at the bands anticrossings and at the BZ edges, whereas for the armchair one the hot regions are only at the anticrossings. Close to the zone center, around the maximum of the valence band and the minimum of the conduction band, the differences in are not so evident. The corresponding values of , calculated versus carrier density, are similar for the zigzag and armchair spin quantization axes, as shown in Fig. 7. The parameter takes the largest values for the spins oriented out-of-plane, giving the shortest spin lifetimes. The spin quantization axis with the minimal values of (and the longest spin lifetime) is along the zigzag and the armchair edges of phosphorene for the valence and the conduction band respectively. The ratio between maximal and minimal is roughly 2.25 for holes and 1.8 for electrons.
Effective spin–orbit Hamiltonian and spin–orbit fields
The extrinsic SOC effects close to the point can be described by the effective spin-orbit Hamiltonian preserving symmetry, , where and are the SOC parameters, akin for Rashba and Dresselhaus SOC in semiconductor heterostructures Bychkov and Rashba (1984), and are the components of the wave vector, and and are the Pauli matrices. Diagonalizing we can express the energy spin splitting along principal axes in the form and . The calculated spin-orbit coupling parameters and are listed in Tab. 2 for several experimentally relevant values of transverse electric field.
| Valence band | Conduction band | |||
|---|---|---|---|---|
| E [V/nm] | [meVÅ] | [meVÅ] | [meVÅ] | [meVÅ] |
| 1.0 | 0.46 | -0.23 | 0.29 | -0.06 |
| 2.0 | 0.91 | -0.48 | 0.56 | -0.11 |
| 3.0 | 1.36 | -0.72 | 0.84 | -0.17 |
| 5.0 | 2.21 | -1.13 | 1.43 | -0.29 |
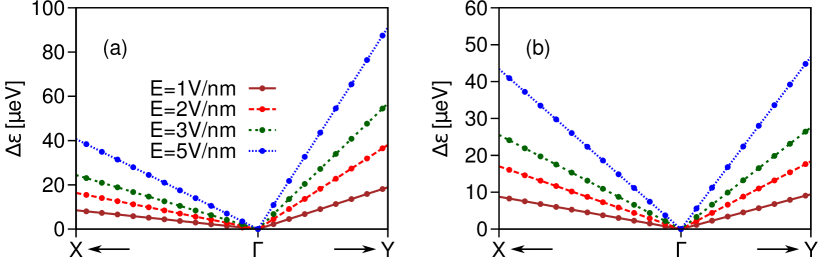
In Fig. 8 we plot the spin splitting in the vicinity of the point for the valence and conduction bands for several values of the transverse electric field. For the valence band the splittings along –X are twice smaller that for –Y path. The anisotropy is much less pronounced in the conduction band.
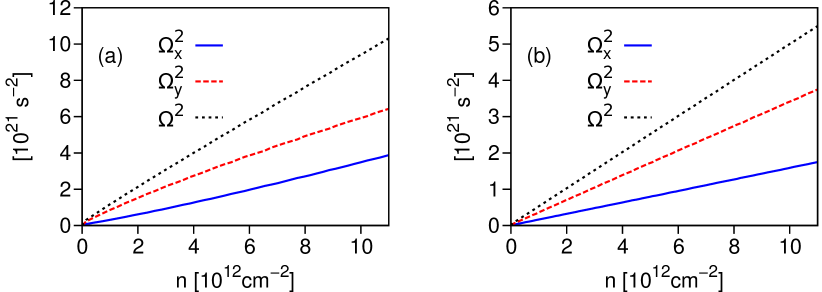
Having the parameters and of the effective Hamiltonian one can calculate averages of squared spin–orbit field components: , , and
| (6) | |||||
| (7) |
where () is the momentum of carriers moving along zigzag (armchair) direction of phosphorene; the average is taken over the Fermi contour. The spin-orbit fields are plotted in Fig. 9 as a function of the carrier doping. The calculated values of for the valence band are roughly twice as large as for the conduction band. A significant anisotropy with respect to main crystal axes is observed giving the ratio between the maximal () and the minimal () values about 2.5 for the valence and 3 for the conduction band.
Elliott–Yafet versus D’yakonov–Perel’
We compare the spin scattering rates from the Elliott–Yafet and the D’yakonov–Perel’ mechanisms for spins pointing along zigzag direction in Fig. 10. For electric fields V/nm the Elliott–Yafet dominates spin scattering of electrons and holes.
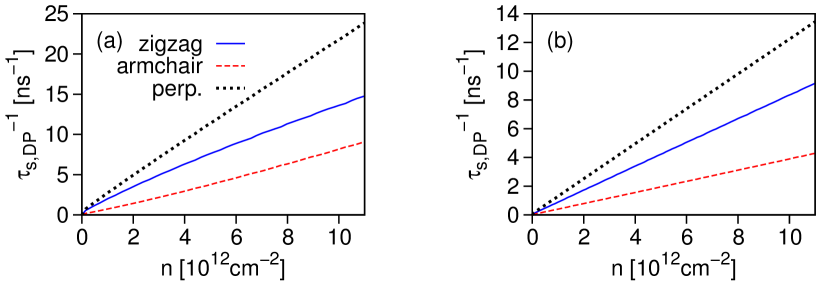
With increasing electric field the contribution of the D’yakonov–Perel’ mechanism to spin relaxation increases and depends on carrier type and density. For V/nm it overtakes the Elliott–Yafet’s for carrier densities cm-2 for holes and cm-2 for electrons. Increasing carrier concentration the relaxation rates grow up to 25 ns-1, see Fig. 11(a,b), and the spin lifetime becomes mainly limited by the D’yakonov–Perel’ mechanism for all spin directions and carrier types.
Orbital resolved bandstructure
In figure 12 we show calculated , and orbital resolved band structure plots along the high symmetry lines in the first Brillouin zone. The valence and conduction band edges near the zone center are formed by orbitals. The first valence band preserves its orbital character within bandwidth of about 2 eV and then further mix with other bands of and orbital character. In detail we see that the first valence band along all high symmetry lines is almost purely of character with a small contribution from the electrons, see Fig. 12(c,d). Exception is along the - line when the band rises in energy with increasing momentum . At the point the two bands merge and stick together at the zone edge towards the point. Along this way the stuck bands change their character from to . At the energies about eV below the Fermi level, a contribution from orbital character is found which is an admixture to the band, Fig. 12(a) and (f).
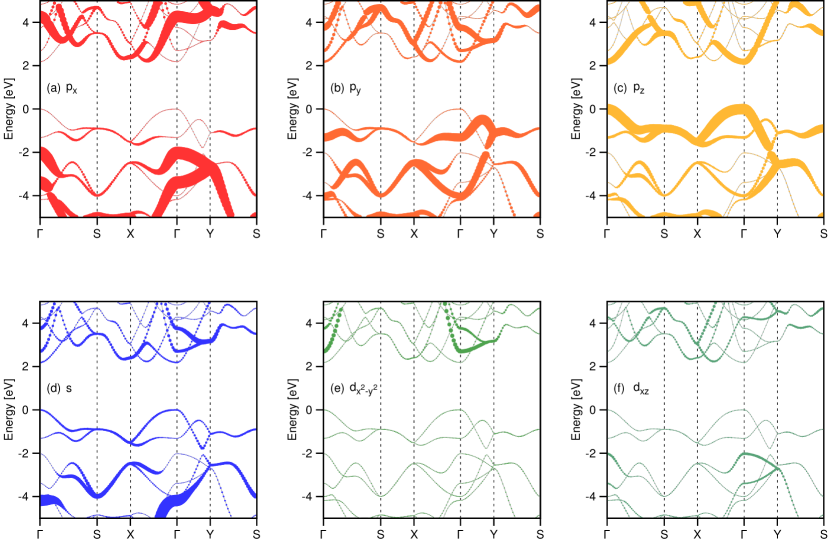
For the first conduction band the situation is similar to the first valence band. An important difference is noted along the - line where another parabolic-like band of mixed and character crosses the band. The energy offset of the band minimum is about 50 meV above the conduction band edge at the zone center. Presence of this band influences charge carrier concentration as shown in Fig. 2(e) in the main text. Contrary to the valence band a contribution from the electrons in the conduction band manifold is found at much lower energies. At about 0.5 eV from the conduction band edge there is a significant contribution from the electrons to the second conduction band, see Fig. 12.