A multi-wavelength analysis of a collection of short-duration GRBs observed between 2012-2015
Abstract
We investigate the prompt emission and the afterglow properties of short-duration gamma-ray burst (sGRB) 130603B and another eight sGRB events during 2012-2015, observed by several multi-wavelength facilities including the GTC 10.4 m telescope. Prompt emission high energy data of the events were obtained by -SPI-ACS, -BAT and Fermi-GBM satellites. The prompt emission data by in the energy range of 0.1–10 MeV for sGRB 130603B, sGRB 140606A, sGRB 140930B, sGRB 141212A and sGRB 151228A do not show any signature of the extended emission or precursor activity and their spectral and temporal properties are similar to those seen in case of other short bursts. For sGRB 130603B, our new afterglow photometric data constraints the pre jet-break temporal decay due to denser temporal coverage. For sGRB 130603B, the afterglow light curve, containing both our new as well as previously published photometric data is broadly consistent with the ISM afterglow model. Modeling of the host galaxies of sGRB 130603B and sGRB 141212A using the LePHARE software supports a scenario in which the environment of the burst is undergoing moderate star formation activity. From the inclusion of our late-time data for 8 other sGRBs we are able to: place tight constraints on the non-detection of the afterglow, host galaxy or any underlying “kilonova” emission. Our late-time afterglow observations of the sGRB 170817A/GW170817 are also discussed and compared with the sub-set of sGRBs.
keywords:
Gamma-ray burst: general, afterglow, kilonova, observations1 Introduction
Short-duration gamma-ray bursts (sGRBs) were originally classified using the catalog (Mazets et al., 1981) which preceded the wider realization that sGRBs likely are binary compact mergers (Narayan et al., 1992; Nakar, 2007) based on various observed properties like duration, fluence etc. as described in Kouveliotou et al. (1993); Bromberg et al. (2013). During the era of the Neil Gehrels Swift observatory, arcsec X-ray Telescope (XRT) localizations enabled the discovery of the first afterglow of sGRB 050509B (Gehrels et al., 2005; Castro-Tirado et al., 2005) and subsequently other observed features like extended emission (EE) at Swift Burst Alert Telescope (BAT) energies, temporally extended variable X-ray emission suggesting late time central engine activity either due to merger of two neutron stars (NS-NS) or a neutron star and a stellar mass black hole (NS-BH) as possible progenitors (Eichler et al., 1989; Narayan et al., 1992; Usov, 1992; Zhang & Meszaros, 2001; Troja et al., 2007; Rowlinson et al., 2013; D’Avanzo et al., 2014; Gibson et al., 2017; Desai et al.,, 2018). The physical nature of the EE, observed in some of the sGRBs, is not yet resolved. It could be connected with the beginning of the afterglow phase (Minaev et al., 2010), the activity of a magnetar, formed during merger process Metzger et al. (2008) or viewing angle effects (Barkov & Pozanenko, 2011). The prompt emission properties of sGRBs: such as relatively harder spectra (higher Epeak) and nearly zero spectral lag (Gehrels et al., 2006; Zhang et al., 2009); discriminate sGRBs from long GRBs (lGRBs). sGRBs have also been speculated as a potential key to understand gravitational wave sources and the nucleosynthesis of elements over the history of the Universe (Berger, 2014; Kumar & Zhang, 2015; Abbott et al., 2017a, b).
More than 90 afterglows of sGRBs have been detected at various wavelengths111http://www.astro.caltech.edu/grbox/grbox.php exhibiting diverse properties (Lee & Ramirez-Ruiz, 2007; Gehrels et al., 2009; Berger, 2014). Afterglows of sGRBs are in general less luminous, less energetic and favor typically lower circumburst densities than those seen in the case of lGRBs (Kann et al., 2011; Nicuesa Guelbenzu et al., 2012; Berger, 2014). Despite intensive efforts, this leads to a lower detection rate for sGRBs: 75 % in X-rays, 33 % in optica-NIR and only a handful in the radio (Berger, 2014). In comparison to long ones, sGRBs are observed to occur at over a lower and narrower redshift range (z 0.1 - 1.5) and both early and late-type galaxies have been identified as hosts (Fong et al., 2013). Afterglow observations of sGRBs also indicate that these bursts have a range of jet-opening angles (Burrows et al., 2006; Kann et al., 2011; Nicuesa Guelbenzu et al., 2012; Fong et al., 2013; Zhang et al., 2015; Troja et al., 2016; Lamb & Kobayashi, 2018; Margutti et al., 2018) and have systematically larger radial offsets from the host galaxies (Fong et al., 2013; Tunnicliffe et al., 2014) in turn supporting compact binary merger as possible progenitors (Bloom et al., 2002; Zhang et al., 2007; Troja et al., 2008; Zhang et al., 2009; Salvaterra et al., 2010). Optical afterglows of sGRBs are generally fainter in comparison to those observed in the case of lGRBs, implying the need for fast and deep afterglow observations using moderate to large size telescopes.
Study of sGRBs now extends beyond understanding just about their explosion mechanisms, progenitors and environments.
These explosions are now key to improve our understanding about multi-messenger astronomy and to search for new compact binary
mergers as gravitational wave (GW) sources. It has been proposed that during the compact binary merger process,
radioactive decay of heavy elements could give rise to a supernova-like
feature, termed “macronovae” or “kilonovae” (Li & Paczynski, 1998; Kulkarni, 2005; Hotokezaka et al., 2013; Kasen et al., 2015) having a component of thermal emission caused by radioactive decay of elements through
r-process nucleosynthesis.
So far, tentative “kilonova” like signatures have been identified in only a few cases including sGRB 050709
(Jin et al., 2016), sGRB 060614 (Yang et al., 2015),
sGRB 080503A (Perley et al., 2009), sGRB 130603B (Hotokezaka et al., 2013; Tanvir et al., 2013), sGRB 150101B (Fong et al., 2016; Troja et al., 2018),
sGRB 160821B (Kasliwal et al., 2017) and recently
sGRB 170817A/GW170817/AT 2017gfo (Abbott et al., 2017a, b). Discovery of the ground-breaking event called
sGRB 170817A/GW170817/AT 2017gfo has opened new windows in the understanding of
gravitational waves: their electromagnetic counterparts (Abbott et al., 2017a; Albert et al., 2017),
and their likely contribution to heavy element nucleosynthesis in the
nearby Universe (Lattimer & Schramm, 1974; Piran et al., 2013; Pian et al., 2017).
Multi-wavelength observations of a larger sample of nearby sGRBs
and “kilonovae” features like GW170817/sGRB 170817A/AT 2017gfo are crucial to establish whether
compact binary mergers are the progenitors (Kasen et al., 2015) for all such events (Abbott et al., 2017a, b)
and to put a constraint on the electromagnetic counterparts and number density of gravitational
wave sources in near future (Li & Paczynski, 1998; Shibata & Taniguchi, 2011; Loeb, 2016).
In this paper, we present results based on prompt emission data from INTEGRAL, Swift, Fermi and multi-wavelength follow-up afterglow observations of 9 sGRBs. The data-set were mostly not published yet and were observed by various different size optical and NIR ground-based telescopes including the 10.4 m Gran Canarias Telescope (GTC). Observations of these 9 bursts including sGRB 170817A were collected during 2012-2018 as a part of a large multi-wavelength collaboration. Our analysis of new data for the sub-set of sGRBs mainly focused towards constraining prompt emission, afterglow and host galaxy properties and adding value towards known physics behind these cosmic explosions. We also attempt to compare the observed properties of the sub-set of sGRBs with new class of less-studied but associated events called “Kilonovae”. The paper is organized as follows: in sections 2 and 3 we present our own temporal and spectral analysis of the afterglow and host galaxy data of GRB 130603B alongside the published ones, in section 4 and in Appendix “A” we discuss the results of prompt emission and multi-band afterglow observations of the other 8 sGRBs, and in section 5 we present late time GTC observations of sGRB 170817A/GW170817/AT 2017gfo and compare the observed properties with the sub-set of the bursts presently discussed. Finally, in section 6 we summarize the conclusions drawn from the analysis of all the sGRBs. In this paper, the notation is used, where is the flux temporal decay index and is the spectral index. Throughout the paper, we use the standard cosmological parameters, , , .
2 sGRB 130603B, multi-wavelength observations
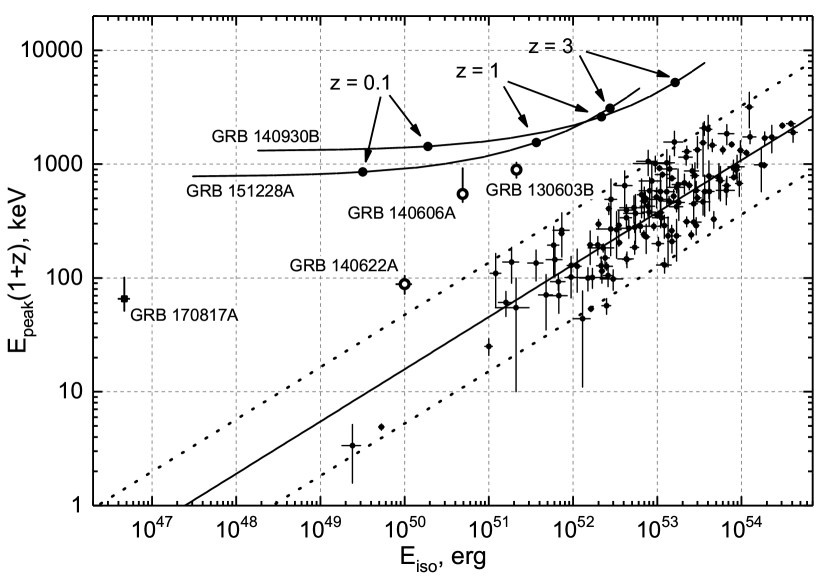
sGRB 130603B was discovered on 2013 June 3 at 15:49:14 UT by Swift-BAT (Barthelmy et al., 2013; Melandri et al., 2013), and by (Golenetskii et al., 2013). The -ray light-curve of GRB 130603B consists of a single group of pulses with a duration of = 0.180.02 s (15–350 keV; Barthelmy et al. 2013). The fluence of the burst is (6.60.7) (20 to keV), with a peak energy of 660100 keV (Golenetskii et al., 2013). The reported measured value of E erg, places the burst well above the Epeak-Eiso locus for long GRBs in the Amati diagram (Amati et al., 2008, also Fig. 6). Such behavior is often observed for short bursts (Minaev & Pozanenko, 2019).
sGRB 130603B shows negligible spectral lag (Norris et al., 2013), typical for short bursts. Many authors (e.g. Hakkila & Preece,, 2011; Minaev et al., 2014) have found a strong correlation between pulse duration and spectral lag: longer pulses have larger lags. The correlation is similar both for sGRBs and lGRBs. As sGRBs typically consist of shorter pulses than long ones, they have less significant spectral lags in general. GRB light curves often consist of several pulses including highly overlapping ones: spectral and temporal properties of individual pulses may be not adequately resolved (Chernenko, 2011). By performing spectral lag analysis via the superposition of several overlapping pulses, one can obtain an unpredictable result because each pulse has unique spectral and temporal properties (Minaev et al., 2014). As a result, one can find negligible or negative lag under certain conditions even if each pulse has a positive (but unique) lag (for details see Minaev et al., 2014). sGRB 130603B consists of several very short and overlapped pulses, so, its negligible spectral lag may be connected with short duration of pulses while performing spectral lag analysis for superposition of several pulses.
2.1 SPI-ACS INTEGRAL Observations
sGRB 130603B was also triggered by the INTEGRAL Burst Alert System (IBAS) system operating with spectrometer for INTEGRAL- anti-coincidence system (SPI-ACS) (Fig. 1). SPI-ACS INTEGRAL has very high effective area (up to 0.3 ) in energy range 100 keV and stable background at timescales of hundreds of seconds (Minaev et al., 2010), which makes SPI-ACS a suitable instrument to study light curves of short hard GRBs and especially to search for weak signals from their precursors and EE components. The off-axis angle of sGRB 130603B to the SPI-ACS axis is 103 degrees, which is almost optimal for detection, making sGRB 130603B one of the brightest short bursts ever registered by SPI-ACS. Nevertheless we do not find statistically significant EE in the SPI-ACS data (Inset in Fig. 1, in terms of peak flux at 50 ms time scale), which is in agreement with results obtained from Swift-BAT in the softer energy range of 15-150 keV (Norris et al., 2013). There is also no evidence for a precursor in SPI-ACS data during timescales from 0.01s up to 5s, in agreement with the previous results (Troja et al., 2010; Minaev & Pozanenko, 2017; Minaev et al., 2018).
In Vigano (2009), it was shown that one SPI-ACS count corresponds on average to erg cm-2 in the (75, 1000) keV range, for directions orthogonal to the satellite pointing axis. Using the conversion factor, we can roughly estimate the flux values in the (75, 1000) keV range for GRBs observed by SPI-ACS. The fluence estimation of sGRB 130603B in SPI-ACS is 31000 counts or S erg cm-2 in the (75, 1000) keV range, which is in agreement with Konus-Wind observations (Golenetskii et al., 2013). At a time scale of 50s, the upper limit on EE activity for sGRB 130603B is 7100 counts (S 7 erg cm-2) at the 3 significance level, the corresponding upper limit on precursor activity at a time scale of 1s, is 1000 counts (S 10-7 erg cm-2), both are in the (75, 1000) keV range.
2.2 Optical-IR photometric Observations
As a part of this collaboration, photometric observations of the optical-IR afterglow and the host galaxy were performed using several facilities worldwide, including 1.0 m telescope at the Tubitak National Observatory (Antalya, Turkey); the 1.5 m telescope at Observatorio de Sierra Nevada (Granada, Spain); the AS-32 0.7 m telescope at Abastumani Astrophysical Observatory Georgia; the Reionization And Transients Infra-Red RATIR camera at the 1.5 m telescope of the San Pedro Martir observatory; the 2.0 m Liverpool telescope at La Palma; AZT-22 1.5 m at the Maidanak observatory Uzbekistan; the Centro Astronómico Hispano-Alemán (CAHA) 3.5 m located in Almeria (Spain); the newly commissioned 3.6 m Devasthal Optical Telescope (DOT) at Aryabhatta Research Institute of Observational Sciences (ARIES) Nainital, India and with the 10.4 m Gran Telescopio Canarias (GTC), located at the observatory of Roque de los Muchachos in La Palma (Canary Islands, Spain), equipped with the Optical System for Imaging and low-Intermediate-Resolution Integrated Spectroscopy (OSIRIS) instrument. Our observations by the 1.0 m telescope at the Tubitak, starting 0.122d after the burst are the earliest reported ground-based observations so far for sGRB 130603B. All optical-NIR data were processed using DAOPHOT software of NOAO’s iraf package222http://iraf.noao.edu/, a general purpose software system for the reduction and analysis of astronomical data. The photometry was performed in comparison to nearby standard stars and image subtraction was applied whenever it was required to subtract the host galaxy contribution as exaplained in Alard & Lupton (1998). The unfiltered observations made with the AbAO AS-32 telescope have been considered equivalent to -band as the quantum efficiency of the detector is at a maximum around -band frequencies. The final AB magnitudes of the afterglow and the host galaxy in different pass-bands as a part of the present analysis are listed in Table 1.
| t-t0,mid(d) | exp(s) | Afterglow/ | pass-band | Telescopes |
| Host magnitudes | ||||
| 0.1222 | 15010 | 20.150.17 | Rc | Tubitak 1.0 m |
| 0.1959 | 30010 | 21.370.25 | AS-32 0.7 m | |
| 0.2024 | 3004 | 21.100.27 | Ic | OSN 1.5 m |
| 0.3360 | 50 | 21.290.02 | GTC 10.4 m | |
| 0.5196 | 3020.0 | 22.120.81 | Y | RATIR 1.5 m |
| 0.5196 | 3020.0 | 20.370.28 | H | RATIR 1.5 m |
| 0.5347 | 2818.0 | 21.640.34 | Z | RATIR 1.5 m |
| 0.5347 | 2818.0 | 20.940.38 | J | RATIR 1.5 m |
| 0.5405 | 6960.0 | 22.300.20 | RATIR 1.5 m | |
| 0.5405 | 6960.0 | 21.980.20 | RATIR 1.5 m | |
| 1.1141 | 1502+2008 | 21.340.50 | Rc | Tubitak 1.0 m |
| 1.1160 | 18014 | 22.64 | AS-32 0.7 m | |
| 2.0937 | 18010 | 22.92 | Rc | Maidanak 1.5 m |
| 2.1489 | 2005 | 21.14 | Rc | Tubitak 1.0 m |
| 2.2803 | 3005 | 20.690.15 (h) | Ic | OSN 1.5 m |
| 5.1143 | 18023 | 22.56 | AS-32 0.7 m | |
| 16.2691 | 30010 | 20.690.06 (h) | LT 2.0 m | |
| 19.2650 | 6015 | 19.690.13 (h) | Ks | CAHA 3.5 m |
| 19.2323 | 6015 | 20.060.09 (h) | J | CAHA 3.5 m |
| 19.2481 | 6015 | 19.680.13 (h) | H | CAHA 3.5 m |
| 19.2155 | 6015 | 20.110.07 (h) | Z | CAHA 3.5 m |
| 32.2411 | 504 | 22.010.03 (h) | GTC 10.4 m | |
| 32.2471 | 504 | 20.970.01 (h) | GTC 10.4 m | |
| 32.2511 | 504 | 20.650.02 (h) | GTC 10.4 m | |
| 35.5168 | 469.8 | 20.880.41 (h) | Y | RATIR 1.5 m |
| 35.5168 | 469.8 | 20.840.30 (h) | H | RATIR 1.5 m |
| 35.5168 | 335.6 | 20.390.19 (h) | Z | RATIR 1.5 m |
| 35.5168 | 335.6 | 20.490.43 (h) | J | RATIR 1.5 m |
| 35.5162 | 960.0 | 21.260.12 (h) | RATIR 1.5 m | |
| 35.5162 | 960.0 | 20.790.09 (h) | RATIR 1.5 m | |
| 1387.84 | 300.02 | 22.130.05 (h) | 3.6 m DOT | |
| 1387.86 | 300.02 | 20.720.02 (h) | Rc | 3.6 m DOT |
2.3 Spectroscopic Observations
A spectroscopic redshift at the location of the afterglow was obtained by several groups including Xu et al. (2013), Foley et al. (2013), de Ugarte Postigo et al. (2013) and Cucchiara et al. (2013). As a part of the present study, spectroscopic observations were performed to measure the redshift of sGRB 130603B independently and are reported in Sánchez-Ramírez et al. (2013).
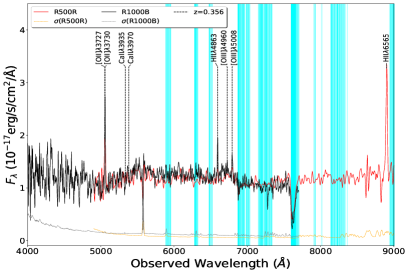
We obtained optical spectra with the GTC(+OSIRIS) starting at 23:58 h. Observations consisted of two 450 s exposures, one with each of the R1000B and R500R grisms, using a slit of width 1.2 arcsec. Data reduction was performed using standard routines from the Image Reduction and Analysis Facility (IRAF). The afterglow spectrum shows Ca II in absorption, and we detect a significant contribution from the underlying host galaxy (eg. [OII], [OIII], H-beta and H-alpha emission lines about 1” offset), together implying a redshift of z = 0.3560.002, consistent with the values provided by de Ugarte Postigo et al. (2013) and Foley et al. (2013). The reduced spectrum obtained at the location of the afterglow along with the lines identified are shown in Fig. 2. Using our redshift value and the fluence published by Golenetskii et al. (2013), the isotropic-equivalent gamma-ray energy is E erg (20 to keV, rest-frame).
| Start | end | center | frequency | Flux | Telescopes |
|---|---|---|---|---|---|
| time | time | t-t0(d) | (GHz) | center (mJy) | |
| sGRB 130603B | |||||
| 2013 June 03.844 | 03.926 | 03.901 | 86.743 | +0.0510.120 | PdBI |
| 2013 June 04.826 | 03.908 | 04.867 | 86.743 | -0.3070.095 | PdBI |
| 2013 June 12.721 | 12.828 | 12.775 | 86.743 | -0.0430.073 | PdBI |
| 2013 June 04.730 | 04.801 | 04.765 | 36.0 | 1.60.9 | RT-22 |
| 2013 June 05.703 | 05.732 | 05.717 | 36.0 | 1.91.2 | RT-22 |
| 2013 June 05.710 | 05.785 | 05.747 | 36.0 | 2.60.9 | RT-22 |
| sGRB 140606A | |||||
| 2014 June 14.039 | 14.099 | 14.069 | 86.743 | 0.3310.187 | PdBI |
| 2014 June 15.039 | 15.099 | 15.069 | 86.743 | -0.5920.214 | PdBI |
| sGRB 140622A | |||||
| 2014 June 26.050 | 26.108 | 0.079 | 86.243 | -0.3760.123 | PdBI |
| sGRB 140903A | |||||
| 2014 Sep 05.617 | 05.705 | 02.661 | 86.743 | 0.1200.130 | PdBI |
2.4 mm-wavelength Observations
The afterglow of sGRB 130603B was observed with the Plateau
de Bure Interferometer (Guilloteau et al., 1992), one of the largest
observatory in the Northern Hemisphere operating at
millimetre wavelengths (1, 2 and 3 mm). Observations were performed
in a four-antenna extended configuration for the first epoch whereas a five-antenna
configuration on the consecutive dates as listed in
Table 2. The data reduction was done with the standard CLIC and MAPPING
software distributed by the Grenoble GILDAS group. Flux calibration
includes a correction for atmospheric decorrelation which has been
determined with a UV plane point source fit to the phase calibration quasar
1156+295. The carbon star MWC349 was used as the
primary flux calibrator due to its well-known millimeter
spectral properties (see e.g. Schwarz et al. 1980). The burst location was also followed-up
using the RT-22 radio telescope of CrAO (Crimea) at 36 GHz and the data reduced using
the standard software routines (Villata et al., 2006) and used modulated radiometers in combination with the registration
regime “ON-ON” for collecting data from the telescope (Nesterov et al, 2000).
The upper limits based on these
observations are also given in Table 2.
As a part of the present analysis, upper limits (1-) based on IRAM Plateau de Bure Interferometer
observations of sGRB 140606A, sGRB 140622A and sGRB 140903A
using the carbon star MWC349 as the primary flux calibrator are also tabulated in Table 2.
Observations at mm-wavelengths are very important as they suffer negligible absorption or interstellar scintillation effects, so sGRBs at high redshifts or highly-extinguished bursts could be observed. It is expected that emission at mm-wavelengths is normally above the self-absorption frequency and lies around peak of the GRB synchrotron spectrum, allowing to probe for possible reverse shock emission at early epochs and to constrain afterglow models observed recently in case of many lGRBs (de Ugarte Postigo et al., 2012; Perley et al., 2014).
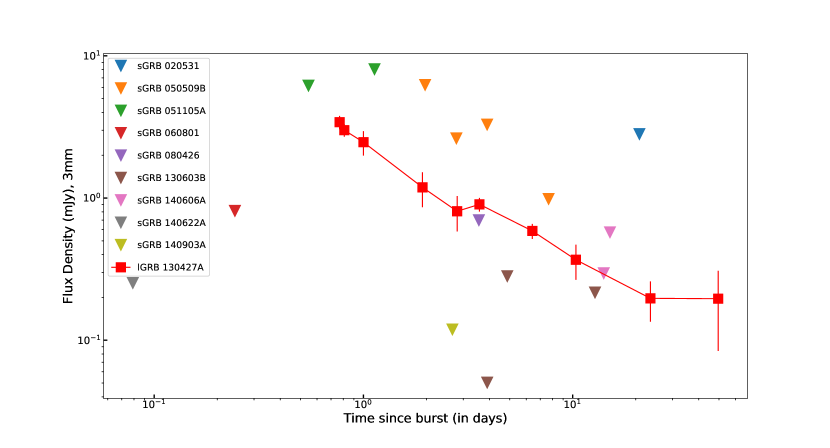
In Fig. 3, observed mm-wavelength upper-limits of four sGRBs presented in Table 2 were plotted along with previous observations of another 5 sGRBs (namely sGRB 020531, sGRB 050509B, sGRB 051105A, sGRB 060801 and sGRB 080426, data taken from Castro-Tirado et al. (2019)) and were compared with the afterglow lightcurve of a well-known nearby and bright lGRB 130427A observed at 3-mm (Perley et al., 2014). It is clear from Fig. 3 that using PdBI, we have been able to observe 9 sGRBs so far but none was detected at mm-wavelengths in contrast with lGRBs which have been detected in many cases constraining various physical models (de Ugarte Postigo et al., 2012; Perley et al., 2014). Out of these 9 sGRBs, only sGRB 130603B (Fong et al., 2014) and sGRB 140903A (Troja et al., 2016) were detected at VLA radio frequencies so far. However, as discussed further in this work, the observed 3-mm PdBI 1- upper-limits for these two bursts are consistent with those predicted by the forward shock afterglow models. The gamma-ray fluence and observed X-ray flux values for these 9 sGRBs are similar to those observed in case of other sGRBs. Non-detections of these nine sGRBs at 3-mm in the last decade using PdBI and other mm-wavelength facilities globally are helpful to constrain underlying physics behind these energetic sources and demand for more sensitive and deeper follow-up observations.
3 Properties of sGRB 130603B
3.1 Afterglow light-curves and comparison to models
Fig. 4 shows the and pass-band light curves of the sGRB 130603B afterglow including data from the present analysis and those published in the literature (de Ugarte Postigo et al., 2014; Tanvir et al., 2013; Cucchiara et al., 2013a; Berger et al., 2013). To plot the light-curves along with those published in the literature, the data were scaled to respective AB magnitudes in SDSS and bands (see Fig. 4). The band data taken at 0.122d comprise of the earliest reported ground-based detection and the remaining data fill the temporal gap in the light curve for this interesting short-duration burst. From the present analysis, the number of new data points both in and bands are four each spread up to 2.3d post-burst. Careful image-subtraction and calibration of the afterglow data 0.23d post-burst indicates possible deviations from smooth power-law behavior during the first few hours.
To determine the temporal flux decay slopes and the break time, we fitted an empirical function representing a broken power-law, (Beuermann et al., 1999) to the band combined light curve. The quantities and are asymptotic power-law flux decay slopes at early and late times with . The parameter controls the sharpness of the break and is the break time. The best fit of this broken power-law function to the band data including the very first data point taken at 0.122d gives : ; and with for a value of the smoothing parameter . The values of and are similar to those derived by Fong et al. (2014). Although the data from Swift XRT is consistent with a break occurring around 0.3 days, the later XMM-Newton observations suggest no turnover at X-ray frequencies and a continuing power law instead (this “X-ray excess” is also discussed by Fong et al. (2014)). The present analysis also helped to constrain the value of using a single band light curve and found to be shallower in comparison to that derived by Fong et al. (2014).
The present data set has also been used to constrain the spectral energy distribution (SED) of the afterglow. The RATIR data taken simultaneously at 0.52d post-burst (see Table 1), require an optical-NIR spectral index 0.7 once corrected for Galactic and considerable host extinction, similar to those measured by de Ugarte Postigo et al. (2014) at 0.35d and by Fong et al. (2014) at 0.6d post-burst. The optical-NIR spectral index, together with the published value of the XRT spectral index are consistent with = 0.5, as expected in the case of a slow-cooling synchrotron spectrum (Sari et al., 1998) where the optical and XRT frequencies lie in two different spectral regimes.
Additionally, the derived values of the temporal slope and the spectral slope above are consistent with the closure relation in the case of adiabatic deceleration in the interstellar medium ISM afterglow model for the spectral regime , where is the break frequency corresponding to the minimum electron energy and is the cooling break frequency. The temporal flux decay index , the break-time and estimated slopes of the SEDs using the optical-NIR and XRT data are broadly consistent with the scenario described by Rhoads (1999) where the edge of the relativistic outflow causes a steepening (jet-break) in the observed light curve by (Sari et al., 1999), where is the electron energy index. Also, for the observed XRT frequencies which lie above , the temporal and spectral indices are consistent with the predictions made by the ISM model in case of the adiabatic deceleration for the data up to one day post-burst (de Ugarte Postigo et al., 2014; Fong et al., 2014).
Present afterglow data has made it possible to construct a single band afterglow light-curve and do the temporal fitting to derive parameters like temporal indices and jet-break time. The optical afterglow data in and bands from the present analysis has allowed to construct a better-sampled light-curve of the sGRB 130603B and to constrain the value of the pre jet-break temporal decay index for the first time using data from a single band. This overall analysis supports the scenario that the observed steepening in the optical light-curves is a jet-break as predicted theoretically by Sari et al. (1999) and Rhoads (1999). However, the observed X-ray excess emission (Fong et al., 2014) for epochs 1d are not supported by the afterglow model.
3.2 Afterglow SED at the epoch of mm observations
Based on the present analysis and using the afterglow data in X-ray, , bands and the results published by de Ugarte Postigo et al. (2014) and Fong et al. (2014), an afterglow SED was constructed for the epoch of our earliest millimeter observations i.e. 0.22d after the burst (see Fig. 5). We first built a time-sliced X-ray spectrum from the Leicester XRT webpages 333http://www.swift.ac.uk/xrt_spectra/, extracting data in the range 10ks - 18ks after the trigger. This tool provides the appropriate spectral and response files that are compatible for use with the spectral fitting package XSPEC. The source spectral file was normalized so that it has the same count rate as a single epoch spectrum measured at 0.22d (see Schady et al. (2010) for details). For the optical data, we created appropriate spectral and response files for each filter. The flux values at 0.22d for each spectral file were determined from an extrapolation/interpolation the data between 10ks and 30ks by fitting a powerlaw and fixing the slope as 0.81. This is the decay index found for the first segment of the broken-powerlaw fit to the r-band data. The optical errors were estimated by taking the average error of the data between 10 and 30ks and adding a 5% systematic error in quadrature.
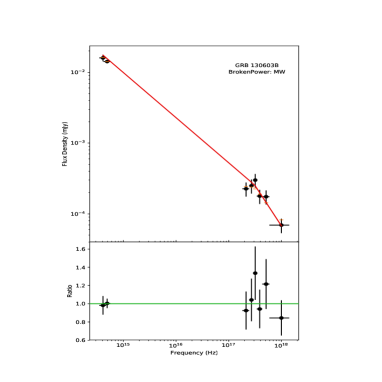
The SEDs were fitted using XSPEC, following the procedure outlined in Schady et al. (2010, 2007). We fit two different models, a power-law and broken power-law, which include Galactic and host galaxy absorption and extinction components (phabs, zphabs and zdust). The best-fit results obtained using the procedure mentioned above are plotted in Fig. 5 which supports broken power-law model for Milky-way (MW) type of host extinction. Values of the best-fit borken power-law model and MW type of host extinction are consistent with those derived by de Ugarte Postigo et al. (2014). Assuming around mm-wavelengths, 86.7 GHz upper limits of the sGRB 130603B at 0.22d post-burst (see Table 2) are also consistent with the extrapolated modeled flux values.
3.3 Broad-band modeling of sGRB 130603B afterglow
The multi-band afterglow data of sGRB 130603B discussed above along with those published in Fong et al. (2014) were used to fit numerical-simulation-based model to constrain physical parameters of the jetted emission as described in Zhang et al. (2015). The numerical modeling (Zhang et al., 2015) calculates the flux density at any frequency and observer time. The Monte Carlo method is used to determine the best parameter values (i.e., with the smallest value) utilizing the MultiNest algorithm from Feroz et al. (2009). The optical-NIR data were corrected for the Galactic and host extinction values as constrained in Fong et al. (2014). The XRT data was also corrected for absorption effects. Based on the literature, it was decided to utilize the data 1000s after the burst for the modeling to avoid possible prompt emission effects at early epochs as described in Zhang et al. (2015).
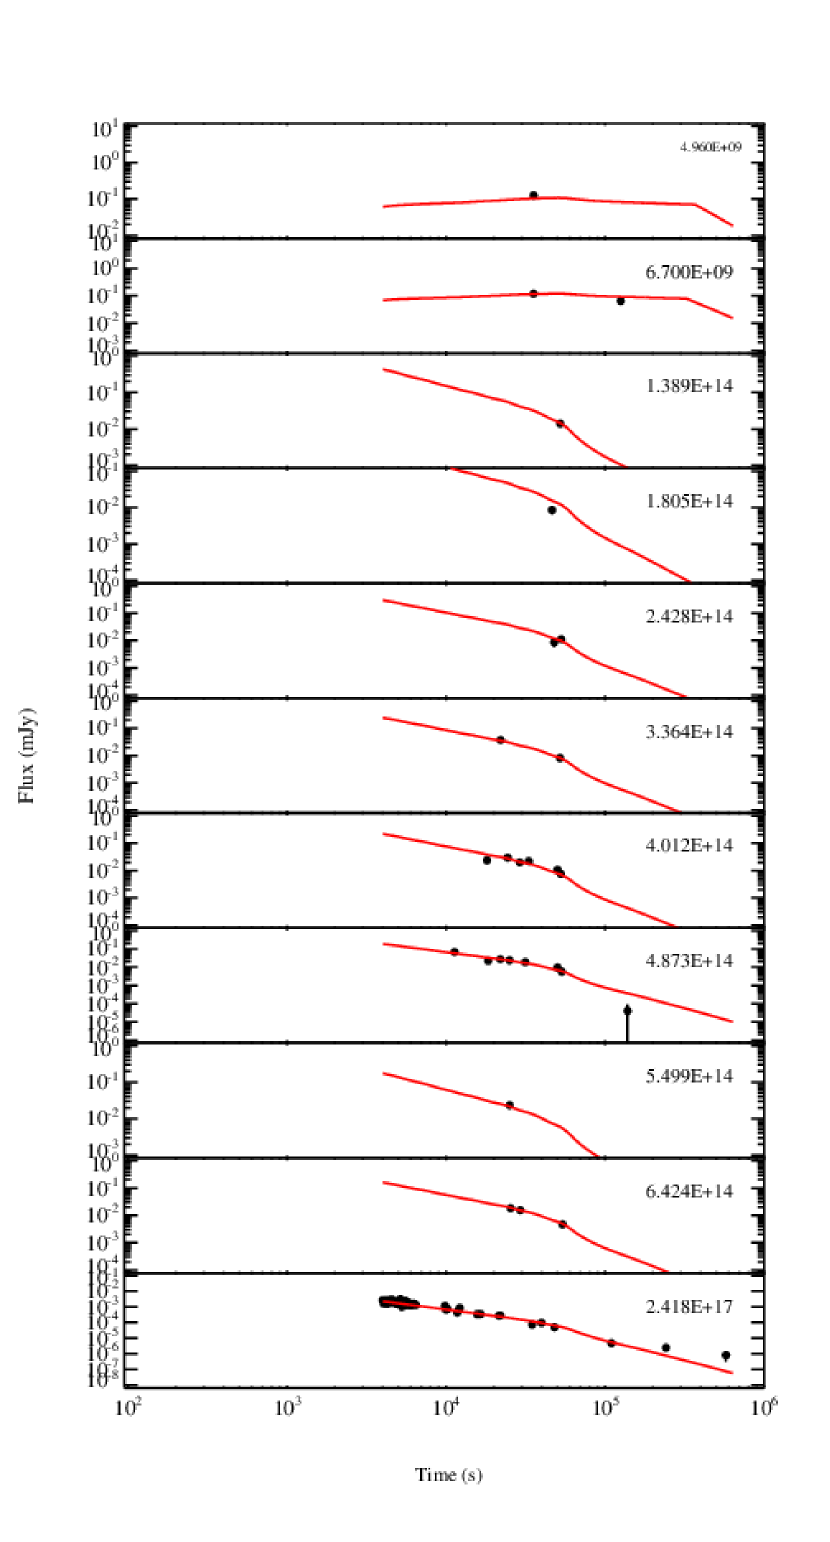
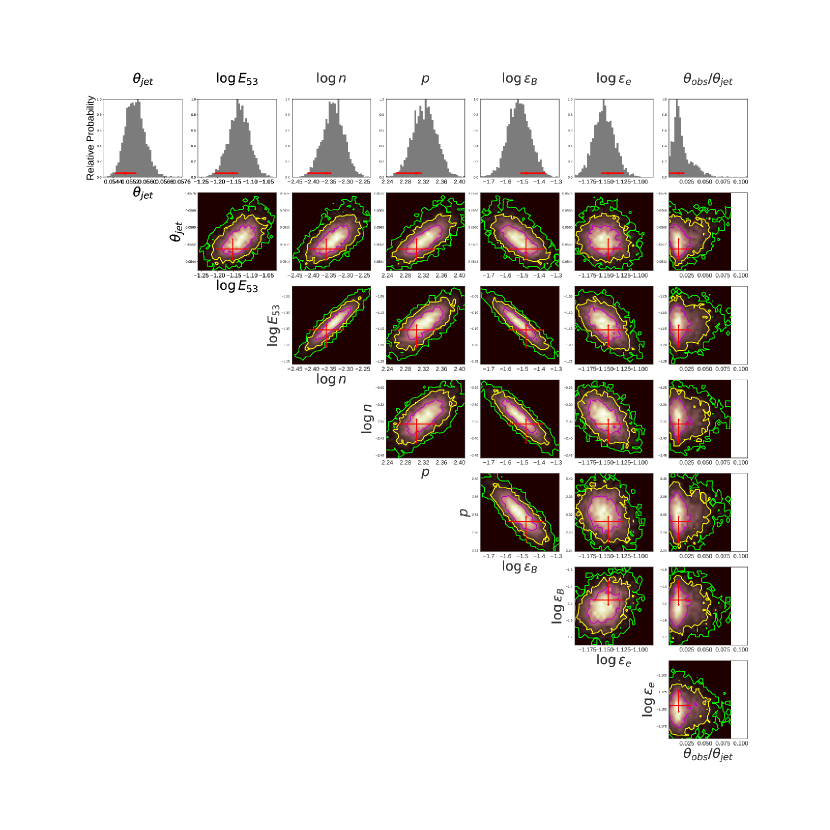
Using the model and initial guess values, following set of parameter values were determined: the blast wave total energy Eiso,53 (in the units of ergs), the ambient number density , the electron energy density fraction , the magnetic field energy density fraction , the electron energy index and values of jet opening angle and the observed angle . The best-fit light-curves obtained at different wavelengths are plotted in Fig. 6, the Monte Carlo parameter distributions are plotted in Fig. 7 and the resulting best-fit parameters and their uncertainties are listed in Table 3. A cross-check using an updated version of the scalefit package (van Eerten & MacFadyen, 2012; Ryan et al., 2015), produces a similar jet opening angle and inferred energy.
| Parameters | Value (-/+) |
|---|---|
| log | |
| log | |
| log | |
| logEiso,53 | |
Using the new data set discussed in this work, derived values of the physical parameters using present modeling method (Table 3) are constrained better than those reported by Fong et al. (2014). The derived value of observed jet opening angle, is 3.2 degrees. This value of gives rise to the beaming corrected Eiso,53 is erg. It is also clear from the present modeling that the best-fit model was unable to reproduce the very late time X-ray emission observed in case of sGRB 130603B as noticed by using Chandra observations Fong et al. (2014). It is also noted that values of the isotropic-equivalent gamma-ray energy is Eiso and the blast wave energy Eiso,γ are comparable, which in turn indicates the GRB radiative efficiency to be 23% (with an uncertainty of 4%), one of the highest among the known sample of sGRBs (Lloyd-Ronning & Zhang, 2004; Wang et al., 2015).
3.4 sGRB 130603B and “kilonovae” connection
The “kilonova” or “macronova” events are electromagnetic transients powered by the radioactive decay of r-process elements synthesized in dynamical ejecta, and in the accretion disk winds during compact binary mergers where at least one component is a neutron star (Li & Paczynski, 1998; Kulkarni, 2005; Rosswog, 2005). Compact binary mergers are also expected to be sources of gravitational waves (Metzger & Berger, 2012; Tanaka & Hotokezaka, 2013; Nissanke et al., 2013; Siegel & Ciolfi, 2016a; Abbott et al., 2017a, b). For “kilonovae”, ejection of radioactive material during the merging process of the compact binaries could lead to an excess emission at optical-infrared or ultra-voilet frequencies. The brightness, duration and spectrum of such emission is a function of the opacity, velocity, ejecta mass and viewing angle (Metzger et al., 2010; Barnes & Kasen, 2013; Piran et al., 2013; Rosswog et al., 2014; Tanaka et al., 2014; Mooley et al., 2018; Radice et al., 2018). In turn, the opacity depends crucially on the neutron richness of the ejecta, which determines how far any r-process nucleosynthesis proceeds. The high mass lanthanides, in particular, create heavy line-blanketing which is expected to largely block out light in the optical bands. Recently, hydrodynamical modeling of such processes (Metzger & Fernandez, 2014; Kasen et al., 2015) has predicted a brief early blue emission component produced in the outer lanthanide-free ejecta and a rather longer infrared transient produced in the inner lanthanide-blanketed regions at later epochs (Bulla et al., 2019). Using their disk-wind model for a case with a non-spinning black-hole (Kasen et al., 2015), the optical bump observed in the case of sGRB 080503 (Perley et al., 2009) was interpreted in terms of an underlying “kilonova” emission for an assumed redshift of z=0.25. Their (Kasen et al., 2015) models were, however, unable to explain the observed infrared excess in sGRB 130603B which required higher accretion disk mass and perhaps a rapidly spinning black hole (Fan et al., 2013; Tanaka et al., 2014; Just et al., 2014). In this section, we attempt to place some constraints on the possible blue-component of associated “kilonova” based on the observed prompt emission and afterglow observations in bluer wavelengths for sGRB 130603B and their comparison with theoretical models.
It has been proposed by Barkov & Pozanenko (2011) that one should observe extended prompt emission in the case of sGRBs initiating Blandford-Znajek (BZ) jets (Blandford & Znajek, 1977) due to large accretion disk mass and high accretion rate. However, in the case of sGRB 130603B EE was not detected (see section 2 and Fig. 1). The absence of observable EE may indicate either that the observer is located off-axis with respect to the narrow BZ-jet, or that the accretion disk mass is small. In general, accretion disk mass should correlate with the ejected mass and the presence of EE could be an indicator of the emerging “kilonovae” in sGRBs. Indeed, the plateau phase in X-ray emission observed in sGRB 130603B cannot be explained by a BZ-jet model (Kisaka & Ioka, 2015) if we assume a small accretion disk mass. The absence of the EE and the presence of a plateau phase could be explained by a low accretion rate which has still initiated BZ jet but with moderate bulk relativistic gamma-factor. Alternatively, the magnetar model could explain the plateau phase of sGRB 130603B and “kilonovae” features (Fan et al., 2013; Metzger & Piro, 2014). Observing EE during the burst phase, along with the presence/absence of an early time X-ray plateau during afterglow phase for a larger sample of sGRBs, would allow discriminating among the possible progenitors as a sub-class of compact-binary mergers producing magnetars (Zhang et al., 2011; Rowlinson et al., 2013; Siegel & Ciolfi, 2016a, b) but would also allow predicting some of them as potential candidates like GW170817.
In addition to the analysis described above, using published early time afterglow data of sGRB 130603B in Swift-UVOT and Gemini bands around 1.5d post-burst (de Ugarte Postigo et al., 2014), we attempt to constrain the possible early time blue emission contributing to the underlying “kilonova”. The observed limiting magnitude in 22.3 mag and > 25.7 mag place limits on the corresponding luminosities of erg/s/Hz and erg/s/Hz respectively. Using the transformation equations (2) & (3) given in Tanaka (2016) (also see equations (7) & (8) in Fernandez & Metzger 2016), we tried to constrain the parameter called ejected mass . However, these limiting values of luminosities in the two bands are not sufficiently deep to constrain values of the ejected mass meaningfully ( 1.5 ) for the bluer component of “kilonova” at the given epoch for the assumed values of the standard parameters. Considering the models of “kilonovae” with rather lower opacity and expansion velocities (Tanaka, 2016; Kasen et al., 2015; Metzger & Fernandez, 2014), constraints for the ejected mass are even weaker i.e. a few which is un-physical. We caution that the placed limits on could be shallower if there were some contribution from the afterglow at the epoch of observations, which is certainly plausible. It is also worth mentioning that the some of parameters in the “kilonovae” models like the range spin of the neutron star, f-parameter, neutron richness have not been well-constrained so far (Metzger et al., 2010; Kasen et al., 2015), causing large uncertainty when predicting the possible emission at UV, optical or IR frequencies. On the other hand, in case of recently observed under-luminous and nearby event sGRB 170817A/GW170817, lanthanide-poor observed blue-components were successfully modeled using a three-component “kilonova” model (Villar et al., 2017a, b) with more realistic value of 0.016 . So, present constrain on in case of sGRB 130603B indicate that either blue-component “kilonova” emission was absent/weaker in comparison to the observed blue-component in case of GW170817. These constraints further indicate that it could be possible to get a range of blue-component of “kilonovae” emission due to possible effects caused by range of the dynamical ejecta, life-time and spin of the promptly formed magnetar/Black Hole, viewing angle effects etc. in case of some of the sGRBs. Early time deeper observations at bluer wavelengths for many such events at various distances are required to determine the range of properties like brightness, duration and possible diversity among these events.
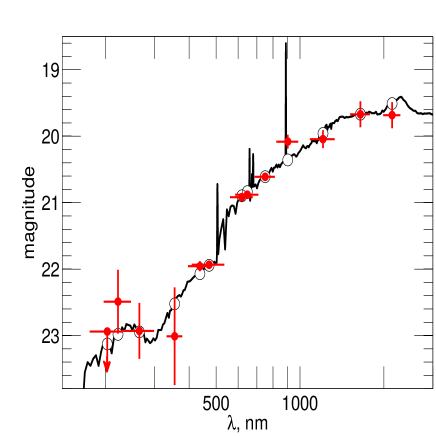
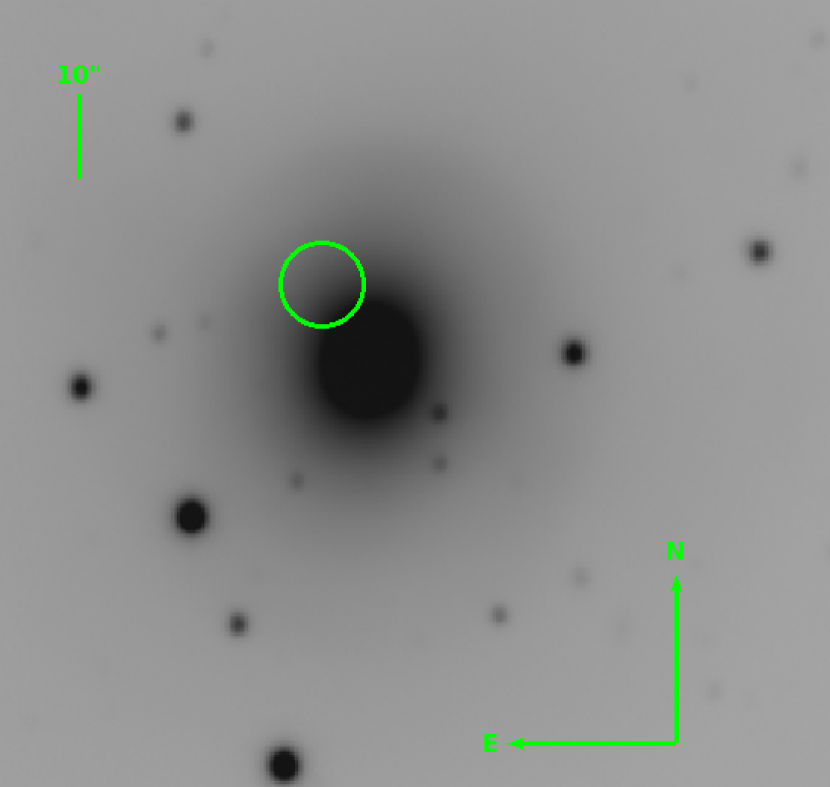
3.5 Host galaxy SED modeling of sGRB 130603B
Information about the host galaxy, such as the characteristic age of the dominant stellar population and the average internal extinction, were obtained by analyzing its broad-band SED (Table 4) using stellar population synthesis models. The host galaxy of GRB 130603B is a perturbed spiral galaxy as seen in high-resolution HST image (Tanvir et al., 2013) due to interaction with another galaxy. We combined our observational data in filters obtained with GTC, CAHA, and DOT telescopes (see Table 1) and combined them with ultra-violet data in bands from de Ugarte Postigo et al. (2014) to construct the broad-band SED of the host galaxy. Taking into account a Galactic reddening along the line of sight of mag, and fixing the redshift of , we fitted the host SED using Le Phare software package (Arnouts et al., 1999; Ilbert et al., 2006). We used the PEGASE2 population synthesis models library (Fioc & Rocca-Volmerange, 1997) to obtain the best-fitted SED and the main physical parameters of the galaxy: type, age, mass, star-formation rate (SFR) etc. We tried different reddening laws: Milky Way (Seaton, 1979), LMC (Fitzpatrick, 1986), SMC (Prévot et al., 1984), and the reddening law for starburst galaxies (Calzetti et al., 2000; Massarotti et al., 2001).
According to the best fit, the host is a type Sd galaxy with absolute magnitude in rest-frame , moderate bulk extinction of , and Milky Way dust extinction law. It is about Gyr years old, has a mass of M☉ and a low star-formation rate of SFR Myr. All the parameters are listed in the Table 4. The reduced , galaxy morphological type, bulk extinction, absolute rest-frame magnitude, age, mass, star formation rate, and specific star formation rate (SSFR) per unit galaxy stellar mass are listed for all 4 tested extinction laws. Fig. 8 represents the best model corresponding to the Milky Way extinction law.
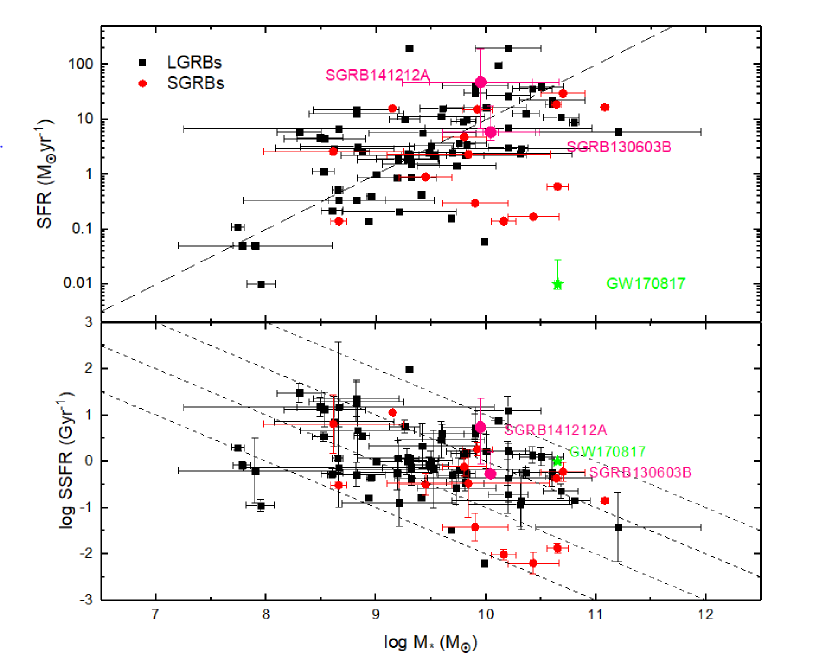
These results confirm the previous host galaxy studies (Cucchiara et al., 2013a; de Ugarte Postigo et al., 2014; Chrimes et al., 2018) by independent observations and modeling, and adding new piece of information about the extinction law inside the host galaxy. Our SED modeling results also constrain that SFR and mass of the host galaxy of sGRB 130603B are typical to those observed in case of other short bursts as shown in Fig. 11. However, the resulting SFR is 5 times higher than that obtained by Chrimes et al. (2018) using different population synthesis libraries.
| Fitted | Starburst | Milky Way | LMC | SMC |
|---|---|---|---|---|
| parameters | model | model | model | model |
| /DOF | 12.0/11 | 11.1/11 | 11.7/11 | 12.2/11 |
| Type | Sbc | Sd | Sd | Sc |
| , mag | 0.05 | 0.20 | 0.20 | 0.00 |
| , mag | ||||
| Age, Gyr | ||||
| Mass, M☉ | ||||
| SFR, M☉/yr | ||||
| SSFR, yr-1 |
4 Multi-wavelength observations of 8 sGRBs during 2012-2015
During 2012-2015, a total of 45 sGRBs were localized by several space-missions. Only 23/45 of these sGRBs were seen by Swift-XRT. Out of those 23, only 9 were detected at optical bands, and, for 7 such events redshifts were determined. In this section, details of the prompt emission and multi-band observations to detect optical afterglow and host-galaxy of eight events (sGRB 121226A, sGRB 131224A, sGRB 140606A, sGRB 140622A, sGRB 140903A, sGRB 140930B, sGRB 141212A and sGRB 151228A) besides sGRB 130603B are discussed. Out of these 8 sGRBs, 3 events namely sGRB 131224A, sGRB 140606A and sGRB 151228A were not detected by Swift- XRT. However, sGRB 140606A and sGRB 151228A were seen by Fermi-Gamma-ray Burst Monitor (GBM) continuous Time-Tagged Event (TTE) data having detailed description in Appendix “A”. Out of the 8 sGRBs from the present sample during 2012-2015, late time follow-up observations using GTC 10.4 m and Gemini-N 8.0 m could be obtained for 4 Swift-XRT localized bursts i.e. for sGRB 121226A, sGRB 140622A, sGRB 140930B and sGRB 141212A, useful to constrain late-time afterglow emission, placing limits on possible “kilonovae” emission and host galaxy as described in respective sections of Appendix “A”.
The INTEGRAL SPI-ACS having a stable background (see Bisnovatyi-Kogan & Pozanenko 2011 and Minaev et al. 2010 for details) is particularly useful in the search for EE after the prompt emission phase of sGRBs. As a part of the present analysis, prompt emission INTEGRAL SPI-ACS observations of sGRB 121226A, sGRB 130603B, sGRB 140606A, sGRB 140930B, sGRB 141212A and sGRB 151228A were analyzed and compared with other contemporaneous observations with the Swift-BAT and Fermi-GBM, when available. Details about the gamma-ray and X-ray data analysis are described in respective sub-sections of Appendix “A”. The analysis of the sub-set of these events do not show any signature of extended emission except sGRB 121226A and their spectral and temporal properties do not differ from those seen by Swift-BAT. Out of the eight sGRBs, for sGRB 140606A and sGRB 151228A, the characteristic photon peak energy Epeak could be determined using the prompt emission Fermi-GBM data. These two sGRBs along with others discussed in this paper with presumed redshift values allowed us to construct the Amati diagram along with published lGRBs (see Fig. 9). Based on this diagram, nature of these four bursts (namely sGRB 140606A, sGRB 140622A, sGRB 140930B and sGRB 151228A) are clearly categorized as short bursts.
Follow-up observations of these eight sGRBs suggest that the afterglows of these events were faint and were located either next to a bright star or embedded within the host galaxy, making the photometry complicated at the epoch of observations. Photometric results regarding the afterglow or host galaxies observed by the GTC 10.4 m and other ground-based telescopes as a part of the present analysis are tabulated in Table 5. Our optical-NIR observations indicate that for sGRB 141212A, the observed host galaxy was relatively bright and had star formation activity. Deeper GTC 10.4 m observations of the sGRB 140622A reveal that the burst could belong to a group of host-less bursts (Tunnicliffe et al., 2014). Follow-up optical observations of sGRB 140903A constrain any underlying “kilonovae” emission down to a limiting magnitude of R 22 mag at 10d after the burst. Our early to late time afterglow observations of sGRB 140930B using William Herschel Telescope (WHT) 4.2 m and Gemini-N 8.0 m observations along with those observed by Swift-XRT are able to constrain the decay nature of the burst and late time 10.4 m GTC observations places a deeper upper limit of mag for any possible host galaxy. Details about observations of the afterglows, host galaxies and their data analysis, calibrations etc. of each of the 8 individual bursts are described in the Appendix “A” below. A summary of the observed prompt emission and afterglow properties of all the 9 sGRBs are also listed in Table 6.
5 GW170817 and the sample of sGRBs
On 17 August 2017, 12:41:04.82 UT, the LIGO and Virgo interferometers detected a transient gravitational wave (GW)
signal from a source named GW170817 (Abbott et al., 2017b). The Fermi-GBM
triggered and located a short burst named sGRB 170817A (von Kienlin A. et al., 2017) about 1.7 s after the
GW signal spatially consistent with the GW event (Blackburn et al., 2017).
The error region was later followed-up extensively at lower frequencies to search for the underlying “kilonova” signature (Coulter et al., 2017; Pian et al., 2017; Covino et al., 2017; Tanvir et al., 2017; Troja et al., 2017; Evans et al., 2017; Smartt et al., 2017; Cowperthwaite et al., 2017). Discovery of this first GW event called GW170817/AT 2017gfo/SSS17a
associated with the very nearby (host galaxy NGC 4993 at Mpc) sGRB 170817A and the
underlying bright “kilonova” provides strong evidence favoring compact binary mergers as the
progenitors for at least some of these events (Abbott et al., 2017a, b, and references therein).
The T90 duration of this GW170817 connected sGRB 170817A was 0.50.1 s (70-300 keV) having multiple
emission episodes and had a relatively soft spectrum with Epeak = 65 keV (Goldstein al., 2017; Pozanenko et al., 2018). The burst was also detected by SPI-ACS onboard INTEGRAL (Savchenko et al., 2017)
and morphology of the -ray light-curve is similar to that seen in the case of presently discussed
sGRB 140930B i.e. having multiple episodes of emissions and belong to pattern-II class of bursts (Lu et al., 2017),
suggesting a diverse set of progenitors and central engines (Dichiara et al., 2013).
sGRB 170817A turned out to be the weakest detected sGRB having a soft spectrum with a thermal tail
and was under-luminous by a factor of 1000 in comparison to known sGRBs. So, observed properties like:
harder pulse with multiple episodes of emissions and a softer tail emission in the spectra have attracted
significant attention in an effort to understand the nature of the event in terms of various
physical models (Granot et al., 2017a, b; Gottlieb et al., 2018; Pozanenko et al., 2018; Zhang et al., 2018).
Except for resemblance with the duration T90, all other
observed prompt emission properties of the sGRB 170817A like the morphology of the -ray
light-curve, Epeak, Eiso etc. were outliers with
the known set of sGRBs including those discussed in this paper as described in Fig. 9.
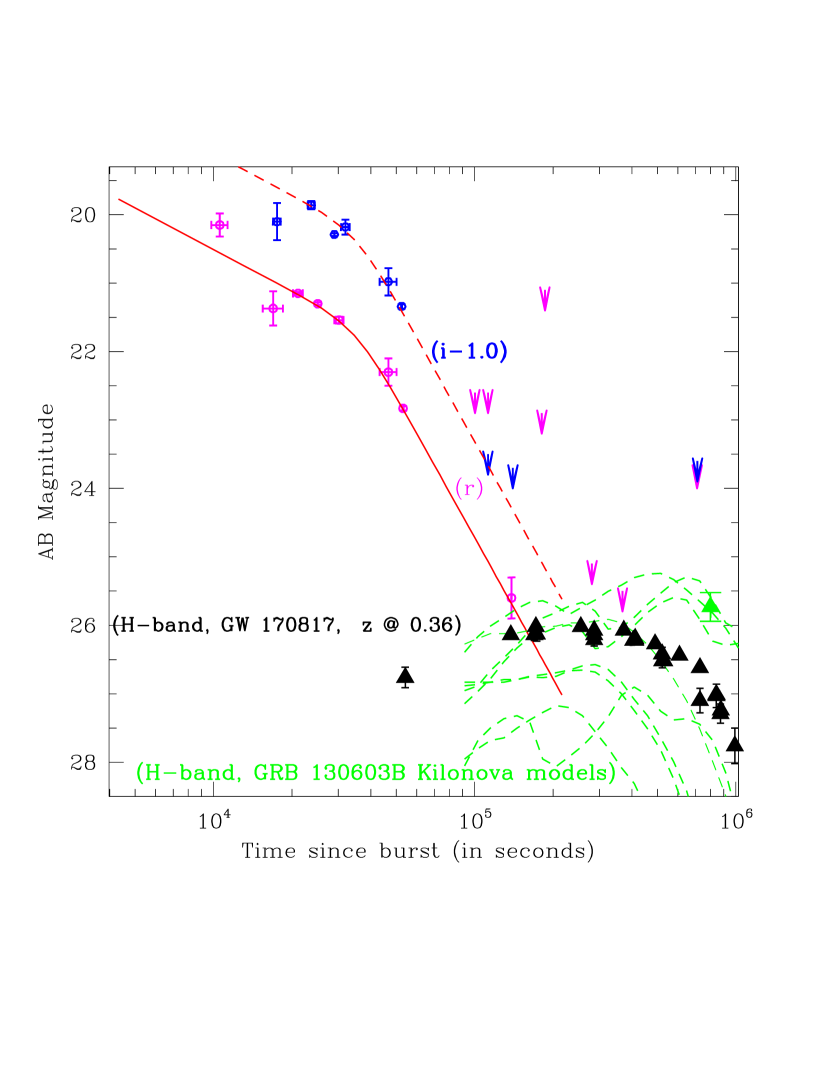
sGRB 170817A counterparts at UV-optical-NIR frequencies are distinct to those expected for GRB afterglows (Piran, 1999) and predominantly follow physical mechanisms suggested for underlying “kilonova” emission (Pian et al., 2017; Tanvir et al., 2017; Troja et al., 2017) consistent with a compact binary merger origin for this event. However, contrary to red “Kilonova” associated with the sGRB 130603B, sGRB 170817A UV-optical-NIR emission was explained well in terms of r-processed three-component sub-relativistic accretion disk powered “kilonova” model (Villar et al., 2017a, b). In Fig. 4, the H-band light curve of the GW170817 counterpart (redshifted at z = 0.36) is compared along with “kilonova” detection and models for the sGRB 130603B (Tanvir et al., 2013; Tanaka et al., 2014). The H-band redshifted light curve of the GW170817 counterpart is fainter in comparison to the corresponding HST detection of the “kilonova” associated with the sGRB 130603B and exhibits distinct nature of the overall temporal decay.
Early time non-detection by the Swift-XRT until 9d post-burst for sGRB 170817A
compared to other known cases of X-ray detected sGRBs (Fong et al., 2017), places a constraint on the underlying
emission mechanisms and supports a non-afterglow origin for the observed emission at lower frequencies.
Recently, using deeper data-set of other bursts Gompertz et al. (2017) have concluded that not all sGRBs
are associated with “kilonovae” and share a diverse range of observed brightness.
No detection of GW170817 like “kilonova” for a good number of well-studied sGRBs to a deeper
limit also indicate a diverse set of progenitors for some of the bursts (Gompertz et al., 2017; Rossi et al., 2019).
As a part of the present study, sGRB 170817A/GW170817 was observed using GTC 10.4 m in -band starting around 05:47:40 UT on 19-01-2018 for a total exposure time of one hour (120sx30). The images were stacked and processed as per standard techniques. A 3- upper limit of the stacked image is 25 mag whereas at the location of the optical transient (see Fig. 10 and Table 5), rather shallow value of 23.5 mag was estimated due to contamination of the host. As a part of the present analysis, second epoch of GTC 10.4 m observations of the host galaxy NGC 4993 were also on 06-02-2019 around 5:10:00 UT in -band (120sx30) and after image subtraction a deeper limit of 24 mag was estimated at the location of the GW170817. This observed limiting magnitude ( 154.7d post-burst) at the location of the optical transient is in agreement with the extrapolated at contemporaneous epochs by Margutti et al. (2018) and thus supports a non-thermal origin of the emission at the epoch of our observations. On the other hand, detections of the sGRB 170817A/GW170817/AT 2017gfo/SSS17a at X-ray (Troja et al., 2017) and VLA radio frequencies (Alexander et al., 2017) 9d to 160d post-burst exhibit rising lightcurves both at X-ray and radio frequencies and are broadly consistent with non-thermal collimated emission viewed off-axis or structured outflow (Margutti et al., 2017; Fong et al., 2017; Hallinan et al., 2017; Haggard D. et al., 2017; Evans et al., 2017; Smartt et al., 2017; Lazzati et al., 2017; Troja et al., 2017; Granot et al., 2017a, 2002). However, Xie et al. (2018) and Lyman et al. (2018) have found that the late time multi-band data of the sGRB 170817A is well explained both by narrow and wide engine mild-relativistic models, though, early time non-detection at X-ray frequencies disfavors wide engine model. So, it is clear that none of the models have been able to re-produce the full set of multi-band data for this nearby event.
The host galaxy SED modeling of sGRB 130603B and sGRB 141212A from the present sample of bursts indicate that
their respective hosts are young and bluer with moderate values of star formation activity. However,
in case of sGRB 170817A, the host galaxy NGC 4993 is an old elliptical galaxy with
little star formation activity and the projected offset of the burst location is rather
closer to what has been seen in case of other sGRBs (Fong et al., 2017; Levan et al., 2017).
Fig. 11 shows the distribution of star formation rates versus stellar mass (top panel) and specific
star formation rates versus stellar mass (bottom panel) for the known set of host galaxies of lGRBs and sGRBs
(Savaglio et al., 2009) and GW170817 (Blanchard et al., 2017). In Fig. 11, corresponding values for the
sGRB 170817A/GW170817 clearly indicate that the star formation rate for sGRB 170817A/GW170817 host
galaxy is well below from those seen in case of normal population of GRBs.
Overall properties of the GRB 170817A/GW170817 and their comparison with other sGRBs indicate that
we need multi-wavelength observations of a significantly larger number of nearby events to explore
the full diversity of “kilonovae” and their association with sGRBs.
| t-t0 mid(d) | exp(s) | Afterglow/ | pass-band | Telescopes |
| Host galaxy | ||||
| sGRB 121226A | ||||
| 0.0042 | 519 | 19 | clear | 0.6 m BOO-4 MET |
| 0.0833 | 3004 | 18.8 | Ic | 1.04 m ST ARIES |
| 0.0833 | 3006 | 19.5 | Rc | 1.04 m ST ARIES |
| 0.432 | 752 | 23.650.37 | GTC 10.4 m | |
| 0.441 | 855 | 24.030.32 | GTC 10.4 m | |
| 0.451 | 708 | 24.300.30 | GTC 10.4 m | |
| 53.25 | 5031 | 23.79 | GTC 10.4 m | |
| 53.27 | 7012 | 24.47 | GTC 10.4 m | |
| sGRB 131224A | ||||
| 1.111 | 301 | 18.3 | GTC 10.4 m | |
| 1.113 | 603 | 19.5 | GTC 10.4 m | |
| 1.116 | 753 | 24.3 | GTC 10.4 m | |
| 7.099 | 4+101 | 23.6 | GTC 10.4 m | |
| 7.105 | 4+101 | 22.8 | GTC 10.4 m | |
| sGRB 140606A | ||||
| 0.3315 | 3600 | 21.7 | clear | Abastumani AS-32 |
| 0.4292 | 430+3120 | 26.0 | BTA6.0 m | |
| 0.3857 | 120+30 | 24.2 | BTA6.0 m | |
| 0.3893 | 120 | 24.4 | BTA6.0 m | |
| 271.642 | 605 | 25.36 | GTC 10.4 m | |
| sGRB 140622A | ||||
| 0.0687 | 4320 | 23.64 | r | RATIR 1.5 m |
| 0.0687 | 4320 | 23.49 | i | RATIR 1.5 m |
| 0.0687 | 1836 | 19.41 | Z | RATIR 1.5 m |
| 0.0687 | 1836 | 18.73 | Y | RATIR 1.5 m |
| 0.4752 | 4800 | 22.5 | R | TShAO Ziess-1000 |
| 0.781 | 1006+52 | 25.8 | GTC 10.4 m | |
| sGRB 140903A | ||||
| 0.1406 | 100 | 18.6 | clear | ISON-Kislovodsk |
| SANTEL-400A | ||||
| 1.0648 | 720 | 22.0 | R | Maidanak AZT-22 |
| 3.0072 | 900 | 22.0 | R | Maidanak AZT-22 |
| 4.0090 | 900 | 22.0 | R | Maidanak AZT-22 |
| 10.0500 | 720 | 22.0 | R | Maidanak AZT-22 |
| sGRB 140930B | ||||
| 0.0291 | 3600 | 20.4 | clear | ISON-Kislovodsk, |
| SANTEL-400A | ||||
| 0.0145 | 1200 | 19.5 | clear | ISON-Kislovodsk, |
| SANTEL-400A | ||||
| 0.0309 | 2000 | 19.6 | clear | ISON-Krasnodar, |
| Astrosib | ||||
| 0.0249 | 415 | 16.1 | clear | UAFO ORI-65 |
| 0.133 | 3005 | 22.650.09 | WHT 4.2 m/ACAM | |
| 0.153 | 3005 | 22.610.06 | WHT 4.2 m/ACAM | |
| 0.172 | 4002 | 23.170.12 | WHT 4.2 m/ACAM | |
| 0.677 | 1509 | 24.010.04 | Gemini North/GMOS-N | |
| 1.656 | 1509 | 25.110.11 | Gemini North/GMOS-N | |
| 3.141 | 6013 | 24.5 | GTC 10.4 m | |
| 1535.5 | 9034 | 24.75 | GTC 10.4 m | |
| sGRB 141212A | ||||
| 0.0189 | 6010 | 22.2 | R | Mondy AZT33-IK |
| 0.0363 | 6060 | 22.730.26 (h) | R | Mondy AZT33-IK |
| 0.0783 | 12030 | 22.750.28 (h) | R | Mondy AZT33-IK |
| 0.0573 | 6060+12030 | 22.710.19 (h) | R | Mondy AZT33-IK |
| 0.0242 | 605 | 18.5 | clear | Khureltogot ORI-40 |
| 0.0641 | 6074 | 19.9 | clear | Khureltogot ORI-40 |
| 0.6814 | 1805 | 22.130.04 (h) | Gemini North/GMOS-N | |
| 1.1563 | 30013 | 22.630.18 (h) | R | TShAO Ziess-1000 |
| 1.7461 | 1805 | 22.230.04 (h) | Gemini North/GMOS-N | |
| 2.0544 | 12057 | 22.760.33 (h) | R | Mondy AZT33-IK |
| 6.0676 | 12085 | 22.860.16 (h) | R | Mondy AZT33-IK |
| 427.375 | 53+12011 | 23.860.08 (h) | GTC 10.4 m | |
| 427.385 | 1207 | 22.800.06 (h) | GTC 10.4 m | |
| 427.403 | 906 | 22.32 0.05 (h) | GTC 10.4 m | |
| sGRB 151228A | ||||
| 0.0011 | 603+202 | 17.5 | 0.60 m T60 | |
| 1.1429 | 560 | 23.7 | GTC 10.4 m | |
| 69.0036 | 775 | 24.8 | GTC 10.4 m | |
| sGRB 170817A/GW170817 | ||||
| 154.7 | 12030 | 24.0 | GTC 10.4 m | |
| 536.8 | 12010 | 24.0 | GTC 10.4 m |
| sGRB | Redshift | T90 | Eisoa | Epeak | Early first observation | Afterglow detection | Host galaxy | Comments | |||
| sec | erg | keV | t-t0,mid(s) | Magnitude | Pass-band | Telescope | |||||
| 121226A | 1.000.20a | 93 | 17.5 | R | Zadkoa | 24.6() | EE | ||||
| 130603B | 0.35640.0002a | 0.180.02b | (2.10.2)1051b | 660100a | 137 | 19.6 | UVOTb | 22.130.05() | KN | ||
| 131224A | 0.8c | 44 | 15.5 | MASTER IIc | 23.6() | not a GRB | |||||
| 140606A | 1.960.1 | 0.340.09d | 4.91050 | 185.13d | 143 | 21.1 | UVOTd | 25.3() | |||
| 140622A | 0.959b | 0.130.04e | (1.00.2)1050 | 448b | 106 | 17.5 | R | TAROTe | 25.8() | ||
| 140903A | 0.351c | 0.300.03f | (6.00.3)1049c | 152 | 20.0 | UVOTf | 20.580.09()a | ||||
| 140930B | 0.840.12g | 1302c | 44 | 16.0 | MASTER IIg | 25.1() | |||||
| 141212A | 0.596d | 0.300.08h | (6.71.1)1049 | 51 | 16.8 | MASTER IIh | 22.800.06() | ||||
| 151228A | 0.270.01i | 261.18d | 95 | 17.5 | R | T60 | 24.8() | ||||
| References | |||||||||||
| Redshift: a Xu et al. (2012), b Hartoog et al. (2014), c Cucchiara et al. (2014), d Chornock et al. (2014) | |||||||||||
| T90: a Baumgartner et al. (2012), b Barthelmy et al. (2013), c Mereghetti et al. (2013), d Cummings et al. (2014), e Sakamoto et al. (2014) | |||||||||||
| Eiso: a for GRB 130603B and GRB 140622A in the range 1-10000 keV, for other GRBs in the range 15-150 keV, b Frederiks et al. (2013), c Troja et al. (2016) | |||||||||||
| f Palmer et al. (2014), g Baumgartner et al. (2014), h Palmer et al. (2014b), i Barthelmy et al. (2015) | |||||||||||
| Epeak: a Golenetskii et al. (2013), b Sakamoto et al. (2014), c Golenetskii et al. (2014), d Present analysis | |||||||||||
| Early first observation: a Klotz et al. (2012), b Melandri et al. (2013), c Gorbovskoy et al. (2013), d Marshall and Stroh (2014), e Klotz et al. (2014) | |||||||||||
| f Breeveld and Cummings (2014), g Gorbovskoy et al. (2014), h Gres et al. (2014) | |||||||||||
| Host galaxy: a Troja et al. (2016) | |||||||||||
6 Conclusions
-
[I]
-
1.
In the present work, we have analyzed and reported prompt emission data of nine short bursts including sGRB 130603B as observed by Swift, INTEGRAL and Fermi observatories. The SPI-ACS INTEGRAL prompt emission observations of sGRB 130603B, sGRB 140930B, sGRB 141212A and sGRB 151228A in the energy range 0.1-10 MeV do not show any EE which is in agreement with those seen in the case of Swift observations. However, in case of sGRB 121226A, the EE was seen as discussed in Appendix section A1. Using Fermi-GBM data, Epeak values were determined for sGRB 140606A, sGRB 151228A and Amati diagram was constructed to establish the nature of the five sGRBs from the present sample. Also, analysis of the INTEGRAL/JEM-X observations indicates that sGRB 131224A may not be of a cosmological origin as discussed in the Appendix section A2.
-
2.
Multi-wavelength afterglow observations for sGRB 130603B presented in this paper include the earliest ground-based optical detection and millimeter observations complementary to those published in the literature. Our and -band data together with those previously published have helped to produce a well-sampled band light curve, made it possible to estimate the value of pre-jet break temporal index robustly. The derived values of pre- and post-jet break temporal flux decay indices along with the X-ray and optical-NIR spectral indices support the ISM afterglow model with cooling frequency between optical and X-ray frequencies.
-
3.
Derived values of the jet-break time, electron energy index were used to model the afterglow data of sGRB 130603B using numerical simulation-based Monte Carlo model as described in Zhang et al. (2015). Except at very early times ( 1000s) and very late time ( 100000s), largely the multi-band data of sGRB 130603B are explained in terms of forward shock fireball model. The derived values of micro-physical parameters of the burst are better constrained than those reported in Fong et al. (2014). The observed mm and cm-wavelength upper limits for sGRB 130603B are also consistent with forward-shock model predictions.
-
4.
In this paper, using the reported values of photometric upper limits in bluer bands (i.e. Swift-UVOT and Gemini-N bands at 1.5d after the burst), we attempted to constrain the possible blue-component of “kilonova” emission in case of sGRB 130603B. Accordingly, the values of the ejected mass were calculated as proposed by Kasen et al. (2015) and Metzger et al. (2010) for the possible blue emission. However, the shallower observed limits at early epochs in Swift-UVOT and Gemini-N bands do not provide any meaningful constraint for the blue-component of “kilonova” emission for sGRB 130603B but indicate that some of sGRBs may not have the predicted blue-component.
-
5.
Deep afterglow observations of a further 8 sGRBs using GTC 10.4 m and other telescopes reveal the nature of the decay and the complex environments of some of sGRBs not well-studied so far. In case of sGRB 140930B, our early to late time afterglow observations using 4.2 m WHT and 8.0 m Gemini-N along with those observed by Swift-XRT are able to constrain the decay nature of the burst and the late time 10.4 m GTC observations places a deeper upper limit of mag for any possible host galaxy. Whereas, in the case of sGRB 140622A, our optical observations using 10.4 m GTC puts a deep limit of 25.6 mag for any afterglow or a host galaxy within XRT error-box. These deep observations by the GTC 10.4 m also indicate that sGRB 140622A could belong to the category of known host-less bursts.
-
6.
Observed limiting flux values at mm and cm-wavelengths for a set of 9 sGRBs using PdBI and their comparison with published light-curve of lGRB 130427A at 3-mm place constraints on the possible underlying physical mechanisms and demand for much deeper observations at these wavelengths.
-
7.
Deeper optical-NIR follow-up observations of 4 Swift-XRT localized bursts sGRB 121226A, sGRB 140903A, sGRB 140930B and sGRB 141212A using GTC 10.4 m, Gemini-N 8.0 m and Maidanak AZT-22 1.5m upto a few days post-burst constrain for any “kilonova” such as the one associated with the GW170817. Using prescription given in Rossi et al. (2019), comparison of rest-frame luminosity of “kilonova” associated with GW170817 indicate that for sGRB 141212A, any such event would have been detected at the epoch of our Gemini-N 8.0 m observations. However, in cases of sGRB 121226A, sGRB 130603B, sGRB 140903A and sGRB 140930B the derived luminosity values were found to be dominated by afterglow i.e. brighter than the “kilonova” associated with the GW170817.
-
8.
Upper limit derived using late time (154.7d post-burst) GTC 10.4 m observations ( 23.5 mag) of the GW170817 is in agreement with non-thermal origin of the emission as seen at other wavelengths. Comparison of prompt emission and properties of the host galaxy of the GW170817 discussed in the present work point towards diverse properties of associated “kilonovae” and in turn points towards possibly diverse classes of compact binary mergers producing normal sGRBs and those with associated “kilonovae”.
-
9.
Optical-NIR photometry of the host galaxy of sGRB 130603B was independently modeled using LePHARE software. The modeling results support the Milky-way Galaxy model with a moderate value of the star formation activity in the host galaxy. We also conclude that the SFR and mass of the host galaxy are typical of those seen in case of other GRBs. The host galaxy modeling of the sGRB 141212A indicates that the host is a MW type of Sc galaxy with a moderate value of star formation.
-
10.
Our observations and analysis of the 8 sGRBs and sGRB 170817A/GW170817 (Table 5 and 6) demand for systematically deeper and more prompt multi-wavelength observations of many of these events to detect the afterglow or to constrain the possible associated “kilonovae”, host galaxies and their properties in more detail. In the future, and other upcoming ground-based optical-NIR facilities like TMT and E-ELT will facilitate the study of sGRBs and GW events with unprecedented sensitivity.
Acknowledgments
Swift data/science center is thankfully acknowledged for the publically available data about GRBs. AJCT acknowledges support from the Junta de Andalucia (Project P07-TIC-03094) and support from the Spanish Ministry Projects AYA2012-39727-C03-01 and 2015- 71718R. This work has been supported by the Spanish Science Ministry "Centro de Excelencia Severo Ochoa” Program under grant SEV-2017-0709. The work is partly based on the observations made with the Gran Telescopio Canarias (GTC), installed in the Spanish Observatorio del Roque de los Muchachos of the Instituto de Astrofisica de Canarias, in the island of La Palma Based on observations collected at the Centro Astronómico Hispano Alemán (CAHA) at Calar Alto, operated jointly by the Max-Planck-Institut for Astronomie and the Instituto de Astrofisica de Andalucia (CSIC). This research was also partially based on observations carried out at the OSN operated by CSIC. FEDER funds are acknowledged. This work is partly based on observations carried out under project numbers xa52, s14dd001, s14dd002 and s14dd006 with the IRAM NOEMA Interferometer (http://www.iram-institute.org/EN/content-page-188-7-55-188-0-0.html). S.B.P. acknowledge BRICS grant number “DST/IMRCD/BRICS/PilotCall1/ProFCheap/2017(G)”for the present work. IRAM is supported by INSU/CNRS (France), MPG (Germany) and IGN (Spain). SRO gratefully acknowledges the support of the Leverhulme Trust Early Career Fellowship. SJ acknowledges support from Korean grants NRF-2014R1A6A3A03057484 and NRF-2015R1D1A4A01020961. E.S. acknowledges assistance from the Scientific and Technological Research Council of Turkey (TUBITAK) through project 112T224. We thank to TUBITAK for a partial support in using T100 telescope with project number 10CT100-95. S.B.P. acknowledge discussions with Dr. Masaomi Tanaka on kilonovae and related science. A.S.P acknowledges partial support grants RFBR 17-02-01388, 17-51-44018 and 17-52-80139. E.D.M., A.A.V. and P.Yu.M. are grateful to RSCF grant 18-12-00522 for support. B.-B.Z. acknowledges support from National Thousand Young Talents program of China and National Key Research and Development Program of China (2018YFA0404204). R.Ya.I. is grateful for partial support by the grant RUSTAVELI/FR/379/6-300/14. We thank the RATIR project team and the staff of the Observatorio Astronómico Nacional on Sierra San Pedro Mártir. RATIR is a collaboration between the University of California, the Universidad Nacional Autonóma de México, NASA Goddard Space Flight Center, and Arizona State University, benefiting from the loan of an H2RG detector and hardware and software support from Teledyne Scientific and Imaging. RATIR, the automation of the Harold L. Johnson Telescope of the Observatorio Astronomico Nacional on Sierra San Pedro Martir, and the operation of both are funded through NASA grants NNX09AH71G, NNX09AT02G, NNX10AI27G, and NNX12AE66G, CONACyT grants INFR-2009-01-122785 and CB-2008-101958 , UNAM PAPIIT grant IN113810, and UC MEXUS-CONACyT grant CN 09-283. R.S.R. acknowledges support from ASI (Italian Space Agency) through the Contract No. 2015-046-R.0 and from European Union Horizon 2020 Programme under the AHEAD project (grant agreement No. 654215). SJ acknowledges the support of the Korea Basic Science Research Program through NRF-2015R1D1A4A01020961. Mondy observations were performed with budgetary funding of Basic Research program II.16 and the data were obtained using the equipment of Center for Common Use "Angara" (http://ckp-rf.ru/ckp/3056/). We are also thankful to I. Márquez for useful discussions.
References
- Abbott et al. (2016) Abbott B. P., Abbott R., Abbott T. D. et al., 2016, Phys. Rev. Lett., 116x, 061102
- Abbott et al. (2017b) Abbott, B. P., Abbott, R., Abbott T. D. et al., 2017, Phys. Rev. Lett., 119p, 161101
- Abbott et al. (2017a) Abbott, B. P., Abbott, R., Abbott T. D. et al., 2017a, ApJ, 848, L12
- Adrian et al. (2016) Adrian-Martinez, S., Albert, A., Andre, M. et al., 2016, Phys. Rev. D, 93, 122010
- Alard & Lupton (1998) Alard, C. & Lupton, R. H., 1998, ApJ, 503, 325
- Albert et al. (2017) Albert A., Andre M., Anghinolfi M. et al., 2017, ApJ, 850, L35
- Alexander et al. (2017) Alexander K. D., Berger E., Fong W. et al., 2017, ApJ, 848, L21
- Amati et al. (2008) Amati L., Guidorzi C., Frontera F., et al. 2008, MNRAS, 391, 577
- Arnouts et al. (1999) Arnouts S., Cristiani S., Moscardini L. et al., 1999, MNRAS, 310, 540
- Barkov & Pozanenko (2011) Barkov M. V. & Pozanenko A. S., 2011, MNRAS, 417, 2161
- Barthelmy et al. (2013) Barthelmy S. D., Cummings J. R., Gehrels, N. et al., 2015, GCN Circular 18754
- Barthelmy et al. (2015) Barthelmy S. D., Baumgartner W. H., Cummings J. R. et al., 2013, GCN Circular 14741
- Barnes & Kasen (2013) Barnes J. & Kasen D., 2013, ApJ, 775, 18
- Baumgartner et al. (2012) Baumgartner W. H., Barthelmy S. D., Cummings J. R. et al., 2012, GCN Circular 14111
- Baumgartner et al. (2014) Baumgartner W. H., Barthelmy S. D., Cummings J. R., et al., 2014, GCN Circular 16870
- Berger et al. (2010) Berger E., 2010, ApJ, 722, 1946
- Berger (2011) Berger E., 2011, NewAR, 55, 1
- Berger et al. (2013) Berger E., Fong W. & Chornock R., 2013, ApJ, 774, 23
- Berger (2014) Berger E., 2014, ARA&A, 52, 43
- Beuermann et al. (1999) Beuermann K., Hessman F. V., Reinsch K., et al., 1999, A&A, 352, L26
- Bernes & Kasen (2013) Bernes J. & Kasen D., 2013, ApJ, 775, 18
- Bhatt et al. (2012) Bhatt V. K., Pandey S. B. & Kumar B., 2012, GCN Circular 14109
- Bildsten (2000) Bildsten L., 2000, COSMIC EXPLOSIONS: Tenth Astrophysics Conference. AIPC, 522, 359
- Bisnovatyi-Kogan & Pozanenko (2011) Bisnovatyi-Kogan G. S. & Pozanenko A. S., 2011, Astrophysics and Space Science, 332, 57
- Bissaldi et al. (2015) Bissaldi E., Zhang, B. B. & Veres, P., 2015, GCN Circular 18736
- Blackburn et al. (2017) Blackburn L., Briggs M. S., Broida J. et al., 2017, GCN Circular 21506
- Blanchard et al. (2017) Blanchard P. K., Berger E., Fong W. et al., 2017, ApJ, 848, L22
- Blandford & Znajek (1977) Blandford R. D. & Znajek R. L., 1977, MNRAS, 179, 433
- Bloom et al. (2002) Bloom J. S., Kulkarni S. R., & Djorgovski S. G., 2002, AJ, 123, 1111
- Breeveld & Krimm (2012) Breeveld A. A. & Krimm H. A., 2012, GCN Circular 14113
- Breeveld & De Pasquale (2013) Breeveld A. A. & De Pasquale M. 2013, GCN Circular 15615
- Breeveld & De Pasquale (2014) Breeveld A. A. & De Pasquale M., 2014, GCN Circular 16869
- Bromberg et al. (2013) Bromberg O., Nakar E., Piran T. & Sari R., 2013, ApJ, 764, 179
- Bulla et al. (2019) Bulla M., Covino S., Kyutoku K. et al., 2019, Nature Astronomy, 3, 99
- Burrows & Kennea (2014) Burrows D. N. & Kennea J. A., 2014, GCN Circular 16356
- Burrows et al. (2006) Burrows D. N., Grupe D., Capalbi M. et al. 2006, ApJ, 653, 468
- Burrows et al. (2014) Burrows D. N., Kennea J. A., Evans P. A. et al., 2014, GCN Circular 16439
- Butler et al. (2014) Butler N., Watson A. M., Kutyrev A. et al., 2014, GCN Circular 16436
- Calzetti et al. (2000) Calzetti D., Armus L., Bohlin R. C. et al., 2000, ApJ, 533, 682
- Capone et al. (2014) Capone J., Toy V., Cenko S. B. et al., 2014, GCN Circular 16769
- Castro-Tirado et al. (2005) Castro-Tirado A. J., de Ugarte-Postigo A., Gorosabel J. et al., 2005, A&A, 439, L15
- Castro-Tirado et al. (2012) Castro-Tirado A. J., Jelinek M., Sánchez-Ramírez R., Tello, J. C. et al., 2012, GCN Circular 14114
- Castro-Tirado et al. (2019) Castro-Tirado A. J., Bremer M., Winters J. M. et al., 2019, to be submitted to A&A
- Cenko et al. (2014) Cenko S. B., Cucchiara A., Tanvir N. R., Levan A. J. & Perley D. A., GCN Circular 16873
- Cenko & Perley (2014) Cenko S. B. & Perley D. A., 2014, GCN Circular 16770
- Chernenko (2011) Chernenko. A., 2011, Acta Politechnica, 51, 61
- Chornock (2014) Chornock R., Fong W. & Fox D. B., 2014, GCN Circular 17177
- Chrimes et al. (2018) Chrimes A. A., Stanway E. R., Levan A. J. et al., 2018, MNRAS, 478, 2
- Cornelisse et al. (2004) Cornelisse R., in’t Zand J. J. M., Kuulkers E., et al., 2004, Physics B Proceedings Supplements, 132, 518
- Coulter et al. (2017) Coulter D. A., Kilpatrick C. D., Siebert M. R. et al., 2017, GCN Circular 21529
- Cowperthwaite et al. (2017) Cowperthwaite P. S., Berger E., Villar E. et al., 2017, ApJ, 848, L17
- Covino et al. (2017) Covino S., Wiersema K., Fan Y. Z. et al., 2017, Nature Astronomy, 1, 791
- Cummings et al. (2014) Cummings J. R., Barthelmy S. D., Baumgartner W. H., et al., 2014, GCN Circular 16354
- Cucchiara et al. (2013) Cucchiara A., Perley D. & Cenko S. B., 2013, GCN Circular 14748
- Cucchiara et al. (2013a) Cucchiara A., Prochaska J. X., Perley D. et al., 2013a, ApJ, 777, 94
- Cucchiara et al. (2014) Cucchiara A., Cenko S. B., Perley D. A. et al., 2014, GCN Circular 16774
- Cummings et al. (2014) Cummings J. R., Burrows D. N., Evans P. A. et al., 2014, GCN Circular 16763
- D’Avanzo et al. (2014) D’Avanzo P., Salvaterra R., Bernardini M. G. et al., 2014, MNRAS, 442, 2342
- D’Elia et al. (2014) D’Elia V., Barthelmy S. D., Izzo L. et al., 2014 GCN Circular 16433
- Desai et al., (2018) Desai D., Metzger B. D. & Foucart F., 2018, submitted to MNRAS, arXiv:1812.04641
- de Ugarte Postigo et al. (2012) de Ugarte Postigo A., Lundgren A., Martin S. et al., 2012, A&A, 538, 44
- de Ugarte Postigo et al. (2013) de Ugarte Postigo A., Malesani D., Xu D. et al., 2013, GCN Circular 14743
- de Ugarte Postigo et al. (2014) de Ugarte Postigo A., Thone C. C., Rowlinson A., 2014, A&A, 563, 62
- De Pasquale et al. (2014) De Pasquale M., Maselli, A. & Cummings J., R., 2014, GCN Circular 16767
- De Pasquale et al. (2014) De Pasquale M., Barthelmy S. D., Gehrels N. et al., GCN Circular 16857
- Dichiara et al. (2013) Dichiara S., Guidorzi C., Frontera F. et al., 2013, ApJ, 777, 132
- Dichiara et al. (2014) Dichiara S., Guidorzi C. & Japelj J., 2014, GCN Circular 16781
- Eichler et al. (1989) Eichler D., Livio M., Piran T. et al., 1989, Nature, 340, 126
- Evans et al. (2017) Evans P. A., Cenko S. B., Kennea J. A. et al., 2017, Science, 358, 1565
- Fan et al. (2013) Fan Y-Z., Yu Y-W., Xu D., 2013, ApJ, 779, 25
- Feroz et al. (2009) Feroz F., Hobson M. P. & Bridges M., MNRAS, 2009, 398, 1601
- Fernandez & Metzger (2016) Fernandez R. & Metzger B. D., 2016, Annual Review of Nuclear and Particle Science, 66, 23
- Fioc & Rocca-Volmerange (1997) Fioc M., Rocca-Volmerange B., 1997, A&A 326, 950
- Fitzpatrick (1986) Fitzpatrick E. L., 1986, AJ, 92, 1068
- Foley et al. (2013) Foley R. J., Chornock R., Fong W., Berger E. & Jha S., 2013, GCN Circular 14745
- Fong W. & Berger E. (2013) Fong W. & Berger E., 2013, ApJ, 776, 18
- Fong et al. (2013) Fong W., Berger E., Chornock R. et al., 2013, ApJ, 769, 56
- Fong (2014n) Fong W., Zauderer B. A. & Berger E., 2012, GCN Circular 14126
- Fong (2014a) Fong W., 2014a, GCN Circular 16777
- Fong et al. (2014) Fong W., Berger E., Metzger B. D. et al., 2014, ApJ, 780, 118
- Fong et al. (2014) Fong W., Calkins M. & Berger E., 2014, GCN Circular 16863
- Fong et al. (2016) Fong W., Margutti R., Chornock R. et al., 2016, ApJ, 833, 151
- Fong et al. (2017) Fong W., Berger E., Blanchard P. K. et al., 2017, ApJ, 848, L23
- Fox & Cummings (2014) Fox D. B. & Cummings J. R., 2014, GCN Circular 16766
- Fujiwara (2014) Fujiwara T., Yoshii T., Saito Y. et al., 2014, GCN Circular 17160
- Furchter (2014) Furchter A. S., 2014, GCN Circular 16776
- Gal et al. (2003) Gal R. R., de Carvalho R. R., Lops P. A. A. et al., 2003, AJ, 125, 2064
- Gehrels et al. (2005) Gehrels N., Sarazin C. L., O’Brien, P. T. et al., 2005, Nature, 437, 851
- Gehrels et al. (2006) Gehrels N., Norris J. P., Barthelmy, S. D. et al., 2006, Nature, 444, 1044
- Gehrels et al. (2009) Gehrels N., Ramirez-Ruiz E. & Fox D. B., 2009, ARA&A, 47, 567
- Gibson et al. (2017) Gibson S. L., Wynn G. A., Gompertz B. P. and O’Brien P. T., 2017, MNRAS, 470, 4925
- Goldstein al. (2017) Goldstein A., Veres P., Burns E. et al., 2017, ApJ, 848, L14
- Golenetskii et al. (2013) Golenetskii S., Aptekar R., Frederiks D. et al., 2013, GCN Circular 14771
- Golenetskii et al. (2014) Golenetskii, S., Aptekar, R., Frederiks, D. et al., 2014, GCN Circular 16868
- Gompertz et al. (2013) Gompertz B. P., Page, K. L. & De Pasquale, M., 2013, GCN Circular 15610
- Gompertz et al. (2017) Gompertz B. P., Levan A. J., Tanvir N. R. et al., 2018, ApJ, 860, 62
- Gorbovskoy et al. (2013) Gorbovskoy E., Lipunov V., Kornilov V. et al., 2013, GCN Circular 15608
- Gorbovskoy et al. (2014) Gorbovskoy E., Lipunov V., Pruzhinskaya M. et al., 2014, GCN Circular 16875
- Gorosabel et al. (2014) Gorosabel J., Hellmich S. & Mottola S., 2014, GCN Circular 16860
- Gottlieb et al. (2018) Gottlieb O., Nakar E. & Piran T., 2018, MNRAS, 473, 576
- Graham et al. (2014) Graham J., Nicuesa Guelbenzu A., Bolmer J. & Greiner J., 2014, GCN Circular 16872
- Granot et al. (2002) Granot J., Panaitescu A., Kumar P. et al., 2002, ApJ, 570, L61
- Granot et al. (2017b) Granot J., Gottlieb O., Piran T. et al., 2018, ApJ, 867, 18
- Granot et al. (2017a) Granot J., Guetta D., Gill R. et al., 2017, ApJ, 850, L24
- Gres et al. (2014) Gres O., Ivanov K., Yazev S. et al., 2014, GCN Circular 17162
- Guilloteau et al. (1992) Guilloteau S., Delannoy J., Downes D. et al., 1992, A&A, 262, 624
- Guziy et al. (2012) Guziy S., Lara-Gil O., Cunniffe, R. et al., 2012, GCN Circular 14106
- Haggard D. et al. (2017) Haggard D., Nynka M., Ruan J. J. et al., 2017, ApJ, 848, L25
- Hakkila & Preece, (2011) Hakkila, J. & Preece R. D., 2014, ApJ, 783, 88
- Hallinan et al. (2017) Hallinan G., Corsi A., Mooley K. P. et al., 2017, Science, 358, 1579
- Hartoog et al. (2014) Hartoog O. E., Malesani D., Sánchez-Ramírez R., et al., 2014, GCN Circular 16437
- Hotokezaka et al. (2013) Hotokezaka K., Kyutoku, K., Tanaka, M. et al., 2013, ApJ, 778, L16
- Ilbert et al. (2006) Ilbert O., Arnouts S., McCracken H. J. et al., 2006, A&A, 457, 841
- Just et al. (2014) Just O., Bauswein A., Ardevol Pulpillo R. et al., 2015, MNRAS, 448, 541
- Kann et al. (2011) Kann D. A., Klose S., Zhang B., 2011, ApJ, 734, 96
- Kasen et al. (2015) Kasen D., Fernández, R., Metzger, B. D., 2015, MNRAS, 450, 1777
- Kasliwal et al. (2017) Kasliwal M. M., Korobkin O., Lau R. M. et al., 2017, ApJ, 843, L34
- Kisaka & Ioka (2015) Kisaka S. & Ioka K., 2015, ApJ, 804, L16
- Koo & Kron (1982) Koo D. C. & Kron, R. G., 1982, A&A, 105, 107
- Kouveliotou et al. (1993) Kouveliotou C., Meegan C. A., Fishman G. J. et al. 1993, ApJ, 413, L101
- Kouveliotou et al. (1998) Kouveliotou C., Dieters S., Strohmayer T. et al., 1998, Nature, 393, 235
- Klotz et al. (2012) Klotz A., Macpherson D., Coward D., et al., 2012, GCN Circular 14107
- Klotz et al. (2014) Klotz A., Turpin D., Boer M., et al., 2014, GCN Circular 16468
- Krimm et al. (2012) Krimm H. A., Cummings J. R., D’Elia V. et al., 2012, GCN Circular 14105
- Kulkarni (2005) Kulkarni S. R., 2005, arXiv:0510256
- Kumar et al. (2018) Kumar B. et al., 2018, Bulletin de la Société Royale des Sciences de Liiége, 87, 29
- Kumar & Zhang (2015) Kumar P., Zhang B., 2015, Physics Reports, 561, 1
- Lamb & Kobayashi (2018) Lamb G. P. & Kobayashi S. et al., 2018, MNRAS, 478, 733
- Lattimer & Schramm (1974) Lattimer J., & Schramm D. N., 1974, ApJ, 192, L145
- Lazzati et al. (2017) Lazzati D., Perna R., Morsony B. J. et al., 2018, PRL, 120, 1103
- Lee & Ramirez-Ruiz (2007) Lee W. H. & Ramirez-Ruiz E., 2007, New Journal of Physics, 9, 17
- Leibler & Berger (2010) Leibler C. N. & Berger E., 2010, ApJ, 725, 1202
- Levan et al. (2014) Levan A. J., Lyman J. D., Tanvir N. R. et al., 2017, ApJ, 848, 28
- Levan et al. (2017) Levan, A. J., Cenko, S. B., Cucchiara, A. et al., 2014, GCN Circular 16784
- Lewin et al. (1995) Lewin, W. H. G., van Paradijs J. & Taam R. E., 1995, X-ray binaries, 175
- Li & Paczynski (1998) Li L. & Paczynski B., 1998, ApJ, 507, L59
- Li et al. (2018) Li L., Wang Y., Shao L. et al., 2018, ApJS, 234, 26
- Littlejohns et al. (2012) Littlejohns, O. M., Sbarufatti, B., Stratta, G., et al., GCN Circular 14112
- Lloyd-Ronning & Zhang (2004) Lloyd-Ronning N. M., & Zhang B., 2004, ApJ, 613, 477
- Loeb (2016) Loeb A., 2016, ApJ, 819, 21
- Lu et al. (2017) Lu R. J., Du S. S., Cheng J. G. et al., 2017, submitted to ApJ, arXiv:1710:06979v1
- Lyman et al. (2018) Lyman J. D., Lamb G. P., Levan A. J. et al., 2018, Nature Astronomy, 2, 751
- Malesani et al. (2012) Malesani D., D’Avanzo P., Melandri A., et al., 2013, GCN Circular 14139
- Malesani et al. (2014) Malesani D., D’Avanzo P., D’Elia V., et al., 2014, GCN Circular 17170
- Margutti et al. (2017) Margutti R., Berger E., Fong W. et al., 2017, ApJ, 848, L20
- Margutti et al. (2018) Margutti R., Alexander K. D., Xie X. et al., 2018, ApJ, 856, 18
- Marshall & D’Elia (2014) Marshall F. E. & D’Elia V., 2014, GCN Circular 16446
- Massarotti et al. (2001) Massarotti M., Iovino A., Buzzoni A. et al., 2001, A&A, 380, 425
- Mazets et al. (1981) Mazets E. P., Golenetskii S. V., Ilinskii V. N. et al. 1981, Astrophysics and Space Science, 80, 3
- Metgzer et al. (2010) Metzger B. D., Martinez-Pinedo G., Darbha S. et al., 2010, MNRAS, 406, 2650
- Metzger & Berger (2012) Metzger B. D. & Berger E., 2012, ApJ, 746, 48
- Metzger & Piro (2014) Metzger B. D. & Piro A. L., 2014, MNRAS, 439, 3916
- Metzger & Piro (2014) Metzger B. D. & Rodrigo F., 2014, MNRAS, 441, 3444
- Mayya (1991) Mayya Y. D. 1991, JApA, 12, 319
- Melandri et al. (2013) Melandri A., Baumgartner W. H., Burrows D. N. et al., 2013, GCN Circular 14735
- Mereghetti et al. (2013) Mereghetti S., Gotz D., Bozzo E. et al., 2013, GCN Circular 15607
- Metzger et al. (2008) Metzger B. D., Piro A. L., Quataert E., 2008, MNRAS, 390, 781
- Metzger et al. (2010) Metzger B. D., Martínez-Pinedo G., Darbha S. et al., 2010, MNRAS, 406, 2650
- Metzger & Berger (2012) Metzger B. D. & Berger E., 2012, ApJ, 746, 48
- Metzger & Fernandez (2014) Metzger B. D. & Fernandez R., 2014, MNRAS, 441, 3444
- Minaev et al. (2010) Minaev P. Yu., Pozanenko, A. S. & Loznikov V., 2010, Astronomy Letters, 36, 707
- Minaev et al. (2012) Minaev P. Yu., Grebenev S. A., Pozanenko, A. S. et al., 2012, Astronomy Letters, 38, 613
- Minaev et al. (2014) Minaev P. Yu., Pozanenko A. S., Molkov S. V. & Grebenev S. A., 2014, Astronomy Letters, 40, 235
- Minaev & Pozanenko (2017) Minaev P. Yu. & Pozanenko, A. S., 2017, Astronomy Letters, 43, 1
- Minaev et al. (2018) Minaev P. Yu., Pozanenko A. S., Molkov S., 2018, IJMPD, 274, 4013
- Minaev & Pozanenko (2019) Minaev P. Yu. & Pozanenko A. S., 2019, under preperation
- Mooley et al. (2018) Mooley K. P., Nakar E., Hotokezaka K. et al., 2018, Nature, 554, 207
- Moskvitin et al. (2014) Moskvitin A. S., Valeev A. F., Komarova V. N., et al., 2014, GCN Circular 16411
- Nakar (2007) Nakar E., 2007, Physics Reports, 442,166
- Narayan et al. (1992) Narayan R., Paczynski B., Piran T., 1992, ApJ, 395, L83
- Nayana & Chandra (2014) Nayana A. J. & Chandra, P., 2014, GCN Circular 16815
- Nesterov et al (2000) Nesterov N. S., Volvach A. E., Strepka I. D., 2000, Astronomy Letters, 26, 204
- Nicuesa Guelbenzu et al. (2012) Nicuesa Guelbenzu A., Klose S., Greiner J. et al., 2012, A&A, 548, 101
- Nissanke et al. (2013) Nissanke S., Mansi K. & Georgieva A., 2013, ApJ, 767, 124
- Norris et al. (2013) Norris J., Gehrels N., Barthelmy S. D. et al., 2013, GCN Circular 14746
- Oates & Ukwatta (2014) Oates S. R., & Ukwatta T. N., 2014, GCN Circular 17180
- Page (2015) Page K. L., 2015, GCN Circular 18772
- Palmer et al. (2014) Palmer D. M., Barthelmy S. D., Baumgartner W. H., et al., 2014, GCN Circular 16768
- Palmer et al. (2014a) Palmer D. M., Barthelmy S. D., Baumgartner W. H., et al., 2014, GCN Circular 17175
- Pandey et al. (2018) Pandey S. B., Yadav R. K. S., Nanjappa N. et al., 2018, Bulletin de la Société Royale des Sciences de Liége, 87, 42
- Perley et al. (2009) Perley D. A., Matzger B. D., Granot J. et al., 2009, ApJ, 696, 1871
- Perley et al. (2014) Perley D. A., Cenko S. B., Corsi A. et al., 2014, ApJ, 781, 37
- Perley & Jencson (2014) Perley D. A. & Jencson J., 2014, GCN Circular 16867
- Pian et al. (2017) Pian E., et al. 2017, Nature, 852, 30
- Piran (1999) Piran T., 1999, Physics Reports, 314, 575
- Piran et al. (2013) Piran T., Nakar, E., Rosswog, S., 2013, MNRAS, 430, 2121
- Polyakov et al. (2014) Polyakov K., Pozanenko A., Volnova A. & Molotov I., 2014, GCN Circular 16862
- Pozanenko et al. (2014) Pozanenko A., Volnova A., Polyakov N. et al., 2014, GCN Circular 16779
- Pozanenko et al. (2018) Pozanenko A., Barkov M. V., Minaev P. Y. et al., 2018, ApJL, 852, L30
- Prévot et al. (1984) Prévot, M. L., Lequeux, J., Maurice E. et al., 1984, A&A, 132, 389
- Radice et al. (2018) Radice D., Perego A., Hotokezaka K. et al., 2018, submitted to ApJ, arXiv:1809.1161
- Rhoads (1999) Rhoads J. E., 1999, ApJ 525, 737
- Rossi et al. (2019) Rossi A., Stratta G., Maiorano E. et al., 2019, submitted to MNRAS, arXiv:1901.05792V1
- Rosswog (2005) Rosswog S., 2005, ApJ, 634, 1202
- Rosswog et al. (2014) Rosswog S., Korobkin O., Arcones A. et al., 2014, MNRAS, 439, 744
- Rowlinson et al. (2013) Rowlinson A., O’Brien P. T., Metzger B. D., Tanvir N. R., Levan A. J., 2013, MNRAS, 430, 1061
- Ryan et al. (2015) Ryan G., van Eerten H., MacFadyen A., Zhang B.-B., 2015, ApJ, 799, 3
- Sagar & Pandey (2012) Sagar R. & Pandey S. B., 2012, Astronomical Society of India Conference Series, 5, 1
- Sakamoto et al. (2014) Sakamoto T., Barthelmy S. D., Baumgartner W. H., et al., 2014, GCN Circular 16438
- Sakamoto et al. (2014a) Sakamoto T., Norris J. & Barthelmy S. D., 2014a, GCN Circular 16771
- Salvaterra et al. (2010) Salvaterra R., Devecchi B., Colpi M. & DÁvanzo, P., 2010, MNRAS, 406, 1248
- Sari et al. (1999) Sari R., Piran T., Halpern J. P., 1999, ApJ, 519, L17
- Sari et al. (1998) Sari R., Piran T., Narayan R., 1998, ApJ, 497, L17
- Savaglio et al. (2009) Savaglio S., Glazebrook K., & Le Borgne D., 2009, ApJ, 691, 182
- Savchenko et al. (2017) Savchenko V., Ferrigno C., Kuulkers E. et al., 2017, ApJ, 848, L15
- Sánchez-Ramírez et al. (2013) Sánchez-Ramírez R., Castro-Tirado A. J., Gorosabel J. et al., 2013, GCN Circular 14747
- Schady et al. (2007) Schady P., Mason K. O., Page M. J. et al., 2007, MNRAS, 377, 273
- Schady et al. (2010) Schady P., Page M. J., Oates S. R. et al., 2010, MNRAS, 401, 2773
- Schwarz et al. (1980) Schwarz D. J. et al., 1980, mm calibrators,
- Seaton (1979) Seaton M. J. 1979, MNRAS, 187, 73
- Siegel & Ciolfi (2016a) Siegel D. M. & Ciolfi R, 2016a, ApJ, 819, 14
- Siegel & Ciolfi (2016b) Siegel D. M. & Ciolfi R, 2016b, ApJ, 819, 14
- Serino et al. (2014) Serino M., Sakamoto T., Kawai N. et al., 2014, GCN Circular 16778
- Shibata & Taniguchi (2011) Shibata M., & Taniguchi K. 2011, Living Reviews in Relativity, 14, 6
- Smartt et al. (2017) Smartt S. J., Chen T-W., Jerkstrand A. et al., 2017, Nature, 551, 75
- Sonbas et al. (2015) Sonbas E., Parmaksizoglu M., Guver T., et al., 2015, GCN Circular 18746
- Stroh et al. (2014) Stroh M. C., Beardmore A. P., Cummings J. R., et al., 2014, GCN Circular 16353
- Marshall & Stroh (2014) Stroh M. C., Kennea J. A., Gehrels N., 2014, GCN Circular 16357
- Tanaka & Hotokezaka (2013) Tanaka, M. & Hotokezaka, K., 2013, ApJ, 775, 113
- Tanaka et al. (2014) Tanaka M., Hotokezaka K., Kyutoku K. et al., 2014, ApJ, 780, 31
- Tanaka (2016) Tanaka M., 2016, accepted to Advances in Astronomy, 6341974, 1, http://th.nao.ac.jp/MEMBER/tanaka/tanaka16.pdf
- Tanga et al. (2014) Tanga M., Delvaux C. & Greiner J., 2014, GCN Circular 16435
- Tanvir et al. (2013) Tanvir N. R., Levan A. J., Fruchter A. S. et al., 2013, Nature, 500, 547
- Tanvir et al. (2014) Tanvir N. R., Levan A. J. & Fraser M., 2014, GCN Circular 16861
- Tanvir et al. (2017) Tanvir N. R., Levan A. J., Gonzalez-Fernandez C., 2017, ApJ, 848, L27
- Troja et al. (2007) Troja E., Cusumano G., O’Brien P. T. et al., 2007, ApJ, 665, 599
- Troja et al. (2008) Troja E., King A. R., O’Brien P. T. et al., 2008, MNRAS, 385, L10
- Troja et al. (2010) Troja E. Rosswog S. & Gehrels N., 2010, ApJ, 723, 1711
- Troja et al. (2016) Troja E., Sakamoto, T., Cenko, S. B. et al., 2016, ApJ, 827, 102
- Troja et al. (2017) Troja E., Piro L., van Eerten H. et al., 2017, Nature, 551, 71
- Troja et al. (2018) Troja E., Ryan G., Piro L., van Eerten H. et al., 2018, Nature Communications, 9, 4089
- Tunnicliffe et al. (2014) Tunnicliffe R. L., Levan A. J., Tanvir N. R., et al., 2014, MNRAS, 437, 1495
- Ukwatta et al. (2014) Ukwatta T. N., Barthelmy S. D., Beardmore A. P., 2014, GCN Circular 17158
- Ukwatta et al. (2015) Ukwatta T. N., Barthelmy S. D., Cummings J. R., 2015, GCN Circular 18731
- Usov (1992) Usov V. V., 1992, Nature, 357, 472
- van Eerten & MacFadyen (2012) van Eerten H. J., MacFadyen A. I., 2012, ApJ, 747, 30
- van Eerten (2015) van Eerten H. J., 2015, Journal of High Energy Astrophysics 7, 23
- Vigano (2009) Vigano D. & Mereghetti S., 2009, arXiv:0912.5329, proceedings of The Extreme sky: Sampling the Universe above 10 keV, held in Otranto (Lecce, Italy) on 2009 October 13-17
- Villar et al. (2017b) Villar V. A., Berger E., Metzger B. D. et al., 2017b, ApJ, 849, 70
- Villar et al. (2017a) Villar V. A., Guillochon J., Berger E. et al., 2017a, ApJ, 851, 21
- Villata et al. (2006) Villata M., Raiteri C.M., Balonek T.J. et al., 2006, A&A, 453, 817
- Volnova et al. (2014) Volnova A., Inasaridze, R., Kvaratskhelia, O. et al., 2014, GCN Circular 16371
- von Kienlin A. et al. (2017) von Kienlin A. et al., 2017, GCN Circular 21520
- Wang et al. (2015) Wang X. G., Zhang B., Liang E. N. et al., 2015, ApJS, 219, 9
- Xie et al. (2018) Xie X., Zrake J., MacFadyen A., 2018, ApJ, 863, 58
- Xu et al. (2012) Xu D., Smirnova O., Purismo T. et al., 2012, GCN Circular 14110
- Xu et al. (2013) Xu D., de Ugarte Postigo A., Malesani D. et al., 2013, GCN Circular 14757
- Xu et al. (2014) Xu D., Niu H.-B., Yang T.-Z. et al., 2014, GCN Circular 16359
- Xu et al. (2014a) Xu D., Geier S., Malesani D. et al., 2014a, GCN Circular 16783
- Yang et al. (2015) Yang B., Zin Z-Ping, Li Xiang et al., 2015, NatureCo, 6, 7323
- Zhang & Meszaros (2001) Zhang B. & Meszaros P., 2001, ApJ, 552, L35
- Zhang et al. (2009) Zhang B., Zhang B.-B., Virgili F. J., et al., 2009, ApJ, 703, 1696
- Zhang et al. (2011) Zhang B. & Meszaros P., 2011, ApJ, 552, L35
- Zhang et al. (2007) Zhang B.-B., Liang, E.-W., & Zhang, B., 2007, ApJ, 666, 1002
- Zhang et al. (2015) Zhang B.-B., van Eerten, H., Burrows, D. N. et al., 2015, ApJ, 806, 15
- Zhang et al. (2018) Zhang B. B., Zhang B., Sun H. et al., 2018, Nature Co, 9, 447
- Zheng et al. (2014) Zheng W., Filippenko A. V., Morgan A., et al., 2014, GCN Circular 16441
- Jin et al. (2016) Zhi-Ping J., Kenta H., Xiang L. et al., 2016, Nature Communications, 7, 12898
Appendix A Multi-wavelength observations of sGRBs in 2012-2015
A.1 sGRB 121226A
Swift discovered sGRB 121226A (trigger=544027) on 2012 December 26 at 19:09:43 UT (Krimm et al., 2012) which had a duration of = 1.000.20s and a hard spectrum, i.e. energy fluence ratio 50-100 keV/25-50 keV = 1.4, classified as a short-hard burst (Baumgartner et al., 2012). The light curve of the burst in Swift-BAT data has a complex structure with negligible spectral lag, which is also in good agreement with the phenomenology of short-hard bursts. The light curve of the burst in the energy range of 100-350 keV has a feature of 2s duration at approximately 25s after the trigger with a statistical significance of 3. This feature was also found in the light curve obtained by SPI-ACS INTEGRAL ( 100 keV) at a significance of 2.5 sigma. The off-axis angle of the SPI-ACS detector is 58 degrees and the detector has no in-flight IBAS trigger at the time of sGRB 121226A. Taking into account simultaneous detection of the Swift-BAT and INTEGRAL SPI-ACS of the feature 25s after the burst onset, we can classify it as EE. The corresponding fluence of EE component in SPI-ACS is S erg cm-2 in the (75, 1000) keV range.
Starting at 36s, 62.8s and 104s after the burst, respectively, the 0.6 m BOOTES-4/MET robotic telescope at the Lijiang Astronomical Observatory (China), 1.0m Zadko robotic telescope located at the observatory at Gingin, Australia and Swift-UVOT responded automatically to the trigger and did not find any optical afterglow down to a limiting magnitude of 19-20 mag (Guziy et al., 2012; Klotz et al., 2012; Breeveld & Krimm, 2012). Ground-based optical follow-up observations taken with 1.04m ST at ARIES Nainital 2 hours (Bhatt et al., 2012) to 11.5 hours (Xu et al., 2012) after the burst did not detect any optical source at the XRT location (Littlejohns et al., 2012). However, GTC 10.4 m multi-band observations taken 10.2–10.8 hour post-burst (Castro-Tirado et al., 2012) show a faint optical source consistent with the XRT position. The finding chart locating the XRT error circle is shown in Fig. A1 based on the data taken by the GTC 10.4 m as a part of the present analysis. Magnitudes of the optical source detected by the GTC 10.4 m in the bands are reported in Table 5. Observations at the same location using the 3.6 m TNG 15.4d after the burst also detect an object (Malesani et al., 2012) which did not appear to have faded in comparison to the detection in the band taken much earlier by the 10.4 m GTC. However, the and colors of the 10.4 m GTC data is similar to those of other optical afterglows, though with large photometric errors. Our follow-up observations by the 10.4 m GTC taken around 53d post-burst in ( 24.5 mag) and ( 23.8 mag) pass-bands place deep limits for any possible host galaxy or possible underlying “kilonova” emission in the observed pass-bands. However, the 10.4 m GTC multi-band data from the present analysis together with those observed by Malesani et al. (2012) do not firmly establish afterglow decay nature of the optical source coincident with the Swift-XRT (Littlejohns et al., 2012) and VLA (Fong, 2014n) detections. Considering that the optical source is not the host galaxy, flatter behaviour of the source between 0.5d to 15.4d post-burst has a luminosity of erg/s/Hz for an assumed redshift z 0.5. This luminosity corresponds to 5 times brighter than the rest-frame luminosity of any possible GW170817 like “kilonova” at similar epochs and indicates, infered value of luminosity to be afterglow dominated as seen in case of some of the sGRBs (Rossi et al., 2019). It is also notable that the Swift-XRT spectral analysis favors a higher Galactic absorption column density towards the burst direction (Littlejohns et al., 2012) having a steeper photon index. Further deeper observations would be required to look for any possible blue dwarf galaxy within the XRT error circle.
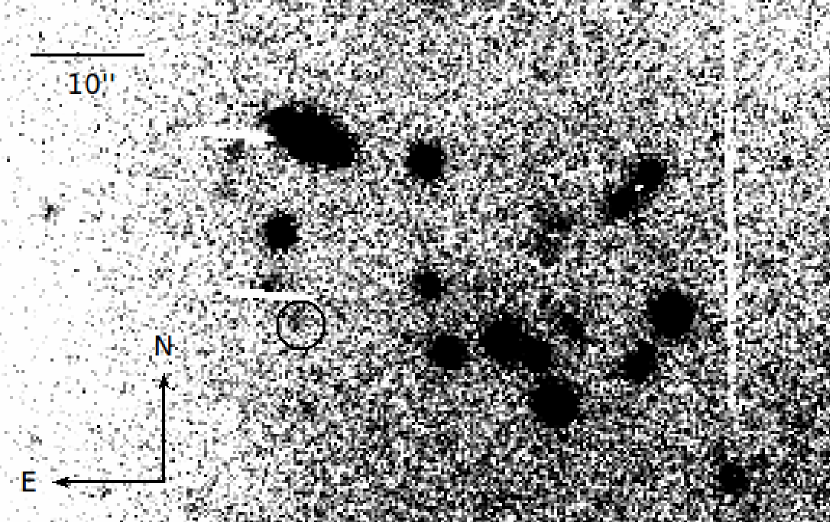
A.2 sGRB 131224A
sGRB 131224A was discovered on 2013 December 24 at 16:54:37 UT by the Imager on Board of the INTEGRAL Satellite (IBIS/ISGRI) with a fluence in the energy range 20- 200 keV of about and duration of 0.8s (Mereghetti et al., 2013). The burst position is 2.7 degrees off axis and was also found by the Joint European X-Ray Monitor (JEM-X), X-ray telescope on-board INTEGRAL. The refined coordinates (J2000) are: R.A.= 296.821 deg, DEC.= +31.663 deg with an uncertainty of 1 arcmin (90% c.l.). The burst is located (in projection) in the Galactic plane. Spectral lag between the light curves in energy ranges 3-35 keV and 20-200 keV is negligible. The burst consists of a single FRED pulse in the 3-35 keV energy range, emission is visible up to 4s after the trigger and nearly symmetric in the hard IBIS/ISGRI channels as derived in the analysis presented in this paper (see Fig. A2). Further, we analyzed Fermi/GBM data and found that sGRB 131224A was within the field of view but didn’t trigger Fermi/GBM. In the temporal analysis, we found nothing significant in the Fermi daily Time-Tagged Event (TTE) data. Optical observations of the INTEGRAL error-box by the MASTER-II robotic telescope starting 39s after the burst trigger do not reveal any counterpart down to a limiting magnitude of 15.5 mag (Gorbovskoy et al., 2013). Swift- XRT and UVOT observations starting around 2.9h after the burst do not reveal any X-ray counterpart down to a limiting flux of (Gompertz et al., 2013) or to a limiting magnitude of 21.1 mag in the UVOT -band (Breeveld & De Pasquale, 2013), consistent with those seen in the case of other sGRBs.
It could also be discussed whether the event 131224A genuinely is a GRB event. The burst energy and morphology is very similar to type-I X-ray bursts which are thermonuclear flashes on the surfaces of weakly magnetic accreting neutron stars in low-mass X-ray binaries (LMXBs, for reviews see e.g. (Lewin et al., 1995; Bildsten, 2000)). The burst is unusually soft for a short GRB and is not detected above 70 keV. The duration of the event in the soft (3-20 keV) energy band is 10s longer than in the hard (20-70 keV) energy band. The burst came from the direction of the Galactic plane, where the greatest number of known LMXBs are located. If the event is a type-I X-ray burst and taking into account no detection of any persistent X-ray emission in the follow-up XRT observation then this source is a new member of the rare class of X-ray bursters with very low ( erg/s) luminosity, the so-called “burst-only” sources (see e.g. Cornelisse et al. (2004) and references therein).
Deeper observations of this burst were performed under our program using the 10.4 m GTC starting 1.11d and around 7d after the burst in and filters. Within the JEM-X INTEGRAL error-box no new fading source was revealed down to a limiting magnitude of 23.6 mag in band. The photometric results based on our analysis of the GTC data are tabulated in Table 5.
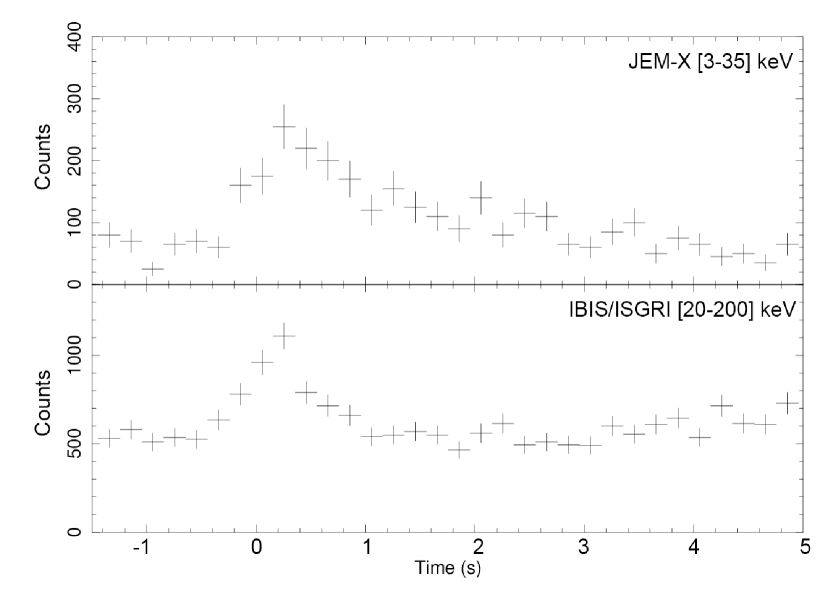
A.3 sGRB 140606A
Swift discovered sGRB 140606A (trigger=600951) on 2014 June 06 at 10:58:13 UT which had a duration of = 0.340.09 s (Stroh et al., 2014; Cummings et al., 2014). The time-averaged spectrum from T-0.04 to T+0.35 is best fit by a simple power-law model. The burst is not visible in the soft energy channel (15-25 keV) and has negligible spectral lag. This confirms the short nature of the burst. Fermi/GBM data of the sGRB 140606A show that the burst was seen within the field of view but didn’t trigger Fermi/GBM. However, significant gamma-ray emission in the Fermi Daily continuous Time-Tagged Event (TTE) data archive. We fit the spectrum of NaI n4 between T0-0.04 and T0+0.8s and found that cutoff-PL model is the best fit to the data. The low-energy photon index = 0.82 and Epeak = 185.13 keV. The corresponding GBM flux is 6.0 in 1-104 keV. The spectral fitting plot with cutoff-PL model is shown in Fig. A3 (top panel). The burst was detected by IBAS in SPI-ACS INTEGRAL (off-axis angle is 40 deg) as a 0.25s single pulse and we do not detect EE (for details of SPI-ACS data analysis see, Minaev et al. (2010)). At a time scale of 50s, the upper limit on EE activity in SPI-ACS for sGRB 140606A is 7000 counts i.e. fluence S erg cm-2) at the 3 significance level in the (75, 1000) keV range.
No XRT counterpart of this burst could be observed due to an observing anomaly (Burrows & Kennea, 2014). Swift UVOT observations, starting 68 sec after the BAT trigger, do not detect any new optical source within the error circle (Marshall & Stroh, 2014) down to a limiting magnitude of 20 mag. Further optical observations by Xu et al. (2014), also do not find any new optical source within the BAT error circle. Optical observations using the Abastumani AS-32 telescope starting 0.332d after the burst do not find any optical afterglow down to a limiting magnitude of 21.7 in a clear filter as reported by Volnova et al. (2014).
The field of sGRB 140606A was observed in B, V and Rc bands with the 6 m BTA/Scorpio-I (SAO RAS, Russia) on the night of June, 7 2014. The observations started 10 hours after the trigger (Moskvitin et al., 2014). The first BTA image covers 100% of the BAT refined error circle. In the stacked R-band image we detected a few hundred objects down to the limiting magnitude mag (total exposure of 150 seconds). The stacked image combined from all obtained frames (total exposure of 480 seconds) covers 14.7 square minutes, 82% of the BAT circle. The limiting magnitude of this image is mag. The field was also observed with the 10.4 m GTC/Osiris (ORM, Spain) on February 26 2015, almost 9 months after the burst. The stacked image combined from seconds frames in band covers 13.2 square minutes, 73% of the BAT circle. We detected a few hundred faint objects down to the same limiting magnitude mag. The brightest galaxies in the BAT circle are USNO 1275-0258796 and 1275-0258743 with magnitudes of about . Due to the large number of objects in the BAT circle we can not suggest a single candidate for the host galaxy or any possible flaring activity by an active galaxy in the observed error circle. As a part of the present analysis, mm-wavelength observations using the IRAM Plateau de Bure Interferometer for the full BAT error circle do not result any detection down to a limiting flux of 0.330.19 mJy around 4-15d post burst. The details of the mm observations of the sGRB 140606A taken at 86.74 GHz are tabulated in Table 2.
A blue object within the sGRB 140606A BAT error box at coordinates RA=13 27 07.9, Dec=+37 37 10.8 (1 arcmin error) with magnitude R =20.600.04 was found to be a quasar at z = 1.96 (see Fig. A3, bottom panel). The expected chance of finding a quasar within the BTA field of view is 0.08 (following the QSO surface number from (Koo & Kron, 1982)) but the lack of variability between the initial BTA frame and the late-time GTC image does not support a relationship. As mentioned above, due to lack of full coverage of the BAT error circle, the chance coincidence of the QSO gamma-ray flaring with the observed sGRB 140606A can not be established.
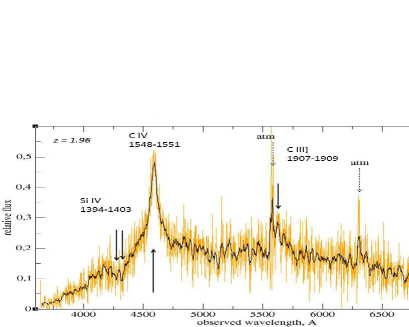
A.4 sGRB 140622A
Swift discovered sGRB 140622A (trigger=602278) on 2014 June 22 at 09:36:04 UT with a duration of = 0.130.04 s (D’Elia et al., 2014; Sakamoto et al., 2014). The mask-weighted light curve shows a weak single FRED peak with a soft spectrum, which is best fit by a black-body with kT = 11.61.8 keV which is not typical for the class of short bursts (Sakamoto et al., 2014). The quickly fading X-ray light curve (temporal decay index, 7.10.9 and mostly taken in photon counting mode) does, however, appear consistent with a short burst model, and does not appear to be similar to the light curves of SGRs or other Galactic sources (Burrows et al., 2014). The burst was not detected by SPI-ACS INTEGRAL most probably due to the soft spectrum. The SPI-ACS INTEGRAL off–axis is 125 degrees. The early optical observations by 0.25m TAROT (Klotz et al., 2014) 23.2 s post-burst, by Swift UVOT 97 s post-burst (Marshall & D’Elia, 2014) and by 0.76 m KAIT 198 s post-burst (Zheng et al., 2014) do not reveal any optical source down to a limiting magnitude of 18, 21 and 19 mag respectively. However, optical observations taken by the TSHAO Zeiss-1000 (East) telescope starting 0.475d after the burst in filters with an exposure time of 6060s+5240s marginally detect a source at RA=21 08 41.69 Dec= -14 25 08.7 ( 0.22”) at a magnitude of 22.50.3 mag. In the light of other non-detection to deeper limits from the data taken before and after the epoch of observations by TSHAO Zeiss-1000 (East), it seems that this marginal detection could be false one. So, an upper limit of 22.5 mag is reported in Table 5. The 2.2m GROND observations taken 252 s after the burst do not reveal any optical counterpart within the XRT error-box down to a limiting magnitude of 24.3 mag, however they do detect an optical source just outside the XRT error circle (Tanga et al., 2014) at a measured redshift of z 0.959 using VLT observations (Hartoog et al., 2014). At this redshift, the host distance from the XRT error circle would be around 21 kpc which could easily rule out the suspected galaxy as a potential host for sGRB 140622A. The XRT error-box was also observed by the RATIR camera at the 1.5m telescope starting 1.2 min after the burst in several filters and no counterpart could be detected to deeper limits (Butler et al., 2014). As a part of the present analysis, mm-wavelength observations using the IRAM Plateau de Bure Interferometer for the full BAT error circle do not result any detection down to a limiting flux of -0.370.12 mJy within a few hours post burst. The details of mm observations of the sGRB 140622A taken at 86.74 GHz are tabulated in Table 2.
So, to search for the potential host galaxy/counterpart, we triggered our proposal on the 10.4 m GTC. The analysis of the GTC -band data (6100+52 s) reveal that there is no optical counterpart down to a limiting magnitude of 25.8 mag at around 0.78d post-burst. So, it is clear from the above observations that the host galaxy of this burst is fainter than 25.8 mag. It is worth mentioning that no detection of any host galaxy down to a deep limit of 25.8 mag indicates sGRB 140622A to be a candidate belonging to the sub-set of other host-less events (Berger et al., 2010; Tunnicliffe et al., 2014). The Swift-BAT fluence in the 15–150 keV band is 2.70.5 along with a 0.3 micro-Jansky limit at optical frequencies place a very crude limit for this burst as a possible high redshift one (Berger et al., 2010). Early epoch deeper observational limits at optical wavelengths and along with unusual Swift-BAT and XRT spectra (Sakamoto et al., 2014; Burrows et al., 2014) also indicate the peculiar nature of this burst. The finding chart locating the XRT error-circle is shown in Fig. A4 based on the data taken by the GTC 10.4 m.
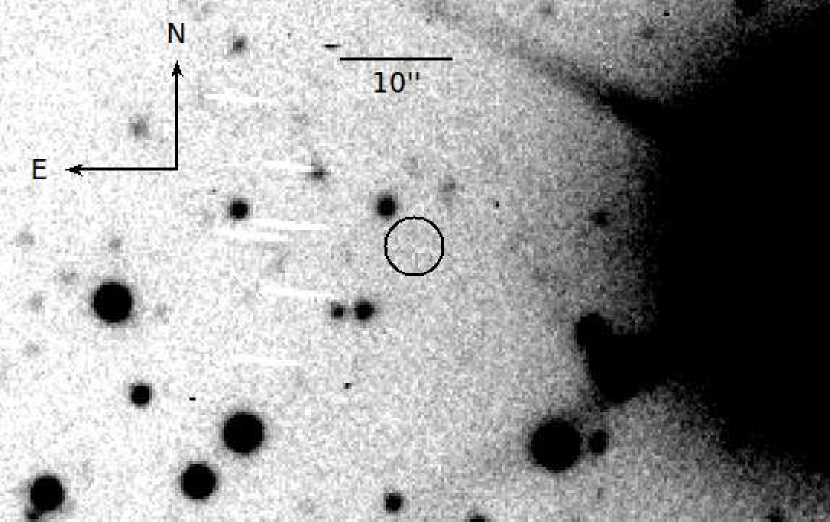
A.5 sGRB 140903A
Swift- BAT triggered on a possible GRB on 2014 September 03 at 15:00:30 UT. Due to a TDRSS telemetry gap, the XRT localization was performed 2.5 hours post-burst and ultimately the burst was found to be a duration of = 0.300.03s (Cummings et al., 2014; Palmer et al., 2014). The BAT and XRT data indicated a soft burst spectrum and an excess column density was observed (De Pasquale et al., 2014), not very common in the case of sGRBs. The time-averaged spectrum from T-0.01 to T+0.35s was best fitted by a simple power-law model. The power law index of the time-averaged spectrum is 1.990.12. Extended emission was not found (Sakamoto et al., 2014a; Serino et al., 2014) in the prompt emission light curve of this burst and the mask-weighted light curve shows a single FRED peak. The SPI-ACS INTEGRAL detector was switched off at the time of the burst. The spectral-lag analysis was performed by Sakamoto et al. (2014a) found that: the spectral lag for the 50-100 keV to 100-350 keV bands is 167ms, and 21 7 ms for the 15-25 keV to 50-100 keV bands. According to Sakamoto et al. (2014a) these lag values indicate that GRB 140903A belongs to the long GRB population. This interpretation contradicts results obtained for individual pulses of BATSE bursts by Hakkila & Preece, (2011). According to Hakkila & Preece, (2011), short and long bursts show the same spectral evolution behavior if spectral lag analysis is performed for individual pulses of bursts instead of analyzing the whole burst structure. Similar results were also noted by Minaev et al. (2014) in their analysis of several other INTEGRAL bursts. sGRB 140903A is single-pulsed and belongs to the bottom-left region of the lag duration correlation constructed for individual pulses of BATSE bursts (Figure 3 in Hakkila & Preece, (2011)), which means that this burst belongs to the short GRB population. A low Eiso value (0.041051 erg, see below) is also more common for short bursts than for long ones. Recently, Troja et al. (2016) have shown that the burst has negligible lag and other prompt emission properties are very typical of those in case of other sGRBs. It was also noticed that this burst is located within 2.5 arc-min of the center of the galaxy cluster NSC J155202+273349 at a photometric redshift of 0.295 (Fox & Cummings, 2014; Gal et al., 2003). However, Troja et al. (2016) have established that the burst was not associated with the galaxy cluster.
The optical afterglow of this sGRB was discovered by the 4.3m Discovery Channel Telescope (DCT) within the XRT error circle around 12 hours after the burst (Capone et al., 2014; Troja et al., 2016). The optical afterglow candidate was also seen in further follow-up observations (Cenko & Perley, 2014; Dichiara et al., 2014; Xu et al., 2014a). Furchter (2014) noticed that the candidate optical afterglow was present in archival images of the Pan STARRS survey and was later suspected to be the host galaxy candidate. Troja et al. (2016) measured the redshift of the afterglow as 0.351 using the Gemini-N 8.0 m telescope equipped with the Gemini Multi-Object Spectrographs (GMOS) camera. The fading behavior of the optical afterglow candidate was established in further observations by Levan et al. (2014) and Cenko et al. (2014). The radio afterglow of the burst were also observed by JVLA at 6 GHz (Fong, 2014a; Troja et al., 2016) and by GMRT at 1390 MHz (Nayana & Chandra, 2014). However, mm-wavelength observations using the IRAM Plateau de Bure Interferometer at the XRT location do not result any detection down to a limiting flux of 0.120.13 mJy within a few days post burst. The afterglow modeling of the multi-band data by Troja et al. (2016) indicates that our mm-wavelength IRAM observations were shallower in comparison to detected signals at the level of a few micro Jy at JVLA and GMRT frequencies. The details of our mm observations of the sGRB 140903A taken at 86.74 GHz are tabulated in Table 2. Spectroscopy of the afterglow was also performed using the 10.4 m GTC and the redshift value determined was 0.351 (Troja et al., 2016) consistent with that reported by Cucchiara et al. (2014). Using the measured redshift of this burst (Troja et al., 2016) and the -ray fluence by Palmer et al. (2014), the isotropic-equivalent gamma-ray energy is E erg (20 to keV, rest-frame).
As a part of the present work, ISON-Kislovodsk SANTEL-400A optical telescope started observations 0.141d after the burst and did not see any afterglow down to a limiting magnitude of 18.6 mag (Pozanenko et al., 2014). To search further for the optical afterglow or for any possible “kilonova” emission for this nearby sGRB, we observed the field of GRB 140903A with the 1.5 m AZT-22 telescope of Maidanak astronomical observatory on 2014 September 4, 6, 7, and 13, taking 12-15 images of 60 s exposure in the -filter. All images were processed using NOAO’s IRAF software package. The position of the optical source is in the wing of a bright star SDSS J155202.58+273611.7 (R = 12.9 mag). The limiting magnitude for every epoch far away from the bright star were obtained using nearby SDSS stars. To find a possible afterglow we subtracted the combined image obtained on September 13, 2014 from that of September 4, 2014. At the position of the afterglow in the residual image we do not find any source implying an equivalent upper limit variability of the source less than 0.5 magnitudes () between the two epochs. This is in agreement with observations by Xu et al. (2014a) and confirms the absence of an afterglow signature 30 hours after the burst trigger. Based on our present observations we can also exclude the possibility of an underlying “kilonova” brighter than R 22.0 () at 10d associated with sGRB 140903A. The corresponding limiting value of the luminosity for the given redshift erg/s/Hz seems afterglow dominated and brighter by a factor of 6 than any GW170817 like associated “kilonova” at similar epochs (Rossi et al., 2019).
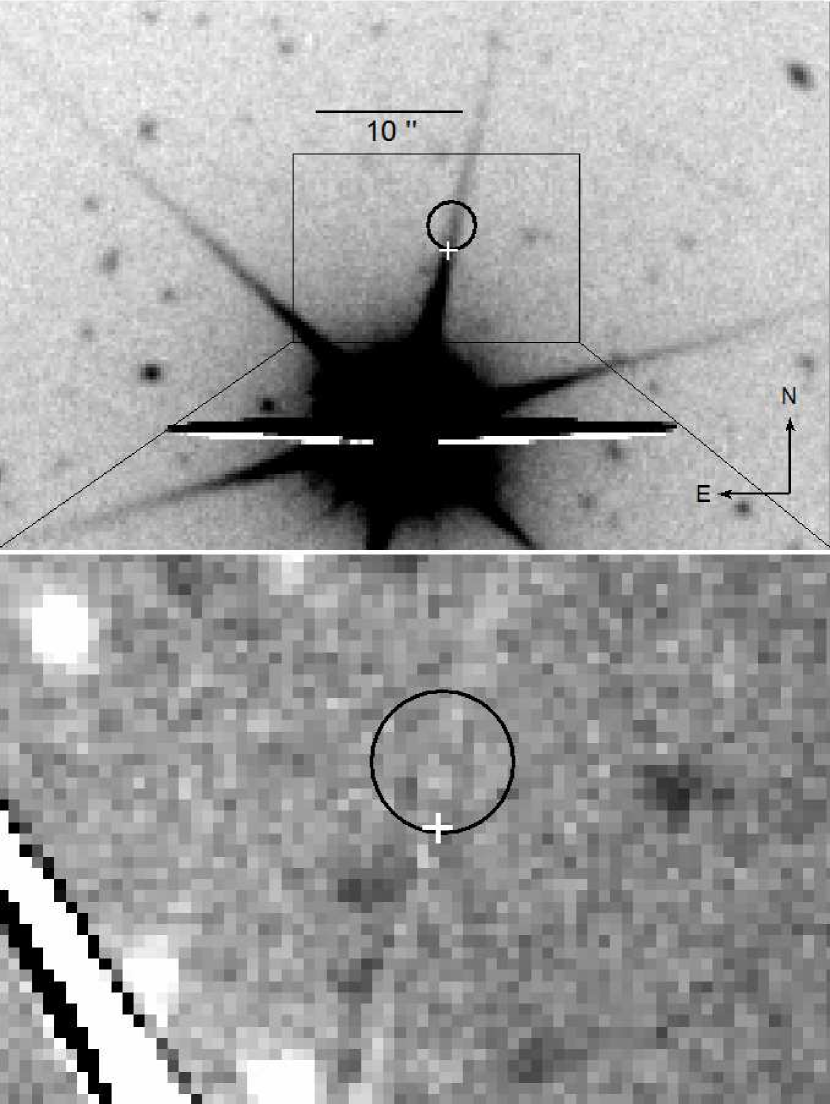
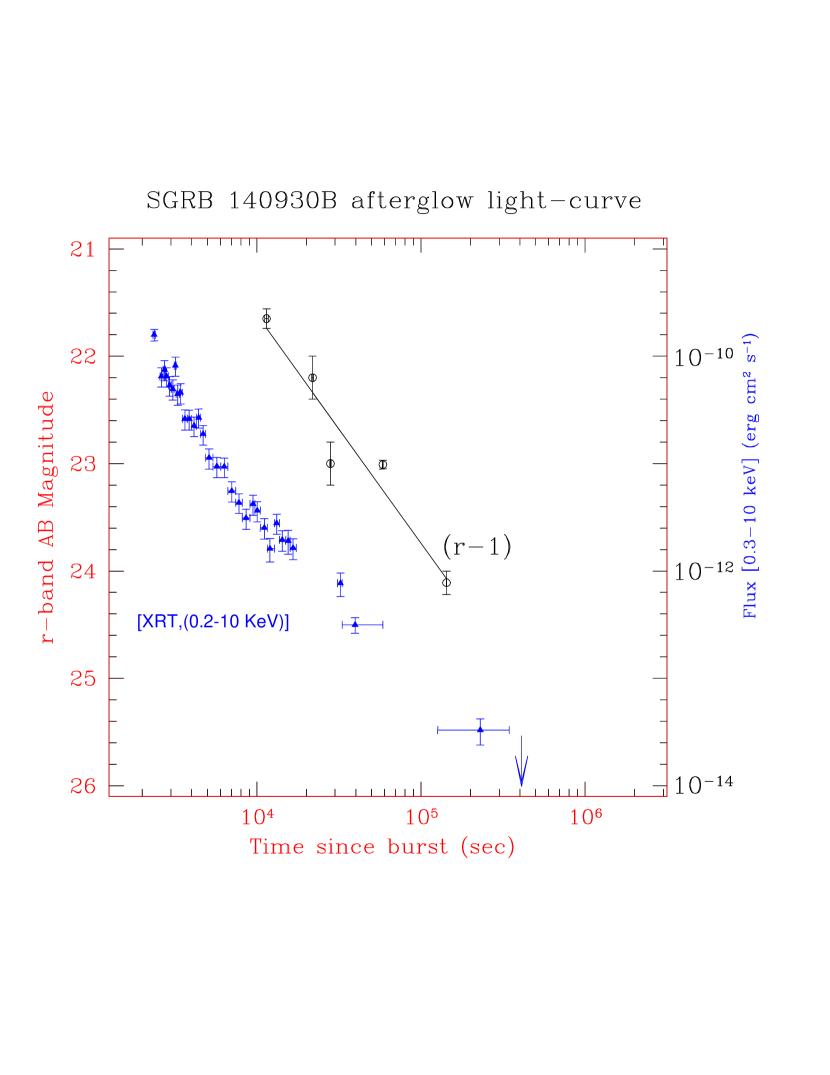
A.6 sGRB 140930B
Swift detected sGRB 140930B (trigger=614094) on 2014 September 30 at 19:41:42 UT with a duration of = 0.840.12s (De Pasquale et al., 2014; Baumgartner et al., 2014). The burst was also observed by with the light curve having a complex multi-pulsed structure with a duration of 1.0s and the emission was seen up to 10 MeV (Golenetskii et al., 2014). The time-averaged spectrum of the burst (measured by from T0 to T0+8.448s) had a best fit in the 20 keV - 15 MeV range by a power-law with exponential cutoff model with Epeak = 1302 keV and total fluence of 8.1 (Golenetskii et al., 2014). Since the redshift z of the sGRB 140930B is unknown, the trajectory of sGRB 140930B on the Amati diagram as a function of z (Fig. 9, see also Minaev et al. (2012)) can be constructed using the fluence and Epeak(1+z) estimates. It follows from Fig. 9 that the trajectory does not cross the correlation region and lies above those drawn for lGRBs, which may suggest that sGRB 140930B belongs to the class of short bursts. The higher Epeak value confirms that the burst is spectrally hard. Overall a FRED light curve with three pulses after the main peak is visible in SPI-ACS INTEGRAL (Fig. A5). The SPI-ACS INTEGRAL off-set is 67 degrees. There is no EE in either BAT (Baumgartner et al., 2014) or SPI-ACS INTEGRAL light curves. At a time scale of 50 s, the upper limit on EE activity in SPI-ACS for sGRB 140930B is 7300 counts i.e. S erg cm-2) at the 3 significance level in the (75, 1000) keV range. Fermi-/GBM could not observe the burst as the satellite was passing in its South Atlantic Anomaly.
Early time optical observations using Swift UVOT (Breeveld & De Pasquale, 2014), MASTER-II (Gorbovskoy et al., 2014) and 1.23m CAHA (Gorosabel et al., 2014) do not reveal any optical afterglow down to a limiting magnitude of R 21.1 mag. UAFO ORI-65 and ISON-Kislovodsk SANTEL-400A telescopes started observations around 0.025 and 0.029d after the burst and did not see any afterglow down to a limiting magnitude of 16.1 mag and 20.4 mag respectively (Polyakov et al., 2014). However, starting 3 hours after the burst 4.2 m WHT found an optical source (Tanvir et al., 2014) that decayed in later images obtained by the 6.5m MMT (Fong et al., 2014) and the 2.2m GROND (Graham et al., 2014) telescopes. The spectroscopic observations using Gemini-south were reported by Cenko et al. (2014) and the afterglow candidate was also observed in and bands using Keck-MOSFIRE (Perley & Jencson, 2014).
We started to observe the field of GRB 140930B on October 3, 2014 at 22:58:33 UT, i.e. 3.1d after the trigger taking 13 frames with an exposure of 60 seconds in the filter under mean FWHM of 0.8 arcsec using GTC 10.4 m. The refined position of the optical and infrared afterglow is strongly affected by a spike from nearby bright star S1 (J002523.61+241727.0, mag). All bright stars in the frames from GTC have six symmetrical spikes from a secondary mirror mount. We found the central position of the S1 star and then we rotated the combined image around this position 60 degrees clockwise, to use a rotated image as a template for subtraction of the spike contaminating the position of the afterglow. In the resulting image we do not find any source at the position of the optical afterglow down to limiting magnitude of mag. The finding chart locating the XRT error circle is shown in Fig. A6 based on the late time data taken by the GTC 10.4 m. At the epoch of our GTC observations, limiting value of afterglow luminosity would be erg/s/Hz for an assumed redshift of z 0.5. This value is nearly similar to the expected luminosity of GW170817 like “kilonova” at similar epochs (Rossi et al., 2019).
Also, as a part of the present study, the 4.2m WHT/ACAM and Gemini North/GMOS-N photometric data of the optical afterglow (Tanvir et al., 2014) were analysed. The results based on our multi-band photometry using the 4.2 m WHT, the Gemini North and GTC 10.4 m are reported in Table 5. The photometry was performed using NOAO’s IRAF software package and calibrated using nearby SDSS stars. The band photometry from the present study along with those given in the GCN (Fong et al., 2014; Graham et al., 2014) were used to produce the afterglow light as shown in Fig. A7. The temporal flux decay index using the band lightcurve was derived as during 0.13 to 1.65d after the burst. The contemporaneous Swift XRT light curve decay index is where as X-ray spectral index . Assuming the cooling break frequency lying between the two observed bands, the closure relations in case of the ISM afterglow model (Sari et al., 1998) are broadly consistent with the observed values of temporal decay at optical bands whereas the temporal decay index at X-rays are steeper than the expected model predictions. GTC 10.4 m was further triggered to search for any possible host galaxy on 10th Dec 2018 and a total of 30 images of 120s each were acquired (see Table 5) in -band. In the stacked image, we do not see any object down to a limiting magnitude of 24.8 mag at the location of the afterglow after accounting far the possible effects of the nearby bright star. So, it is concluded that the host galaxy of the sGRB 140930B would be fainter than 24.8 mag.
A.7 sGRB 141212A
sGRB 141212A was discovered on 2014 December 12 at 12:14:01 UT by the Swift-BAT (Ukwatta et al., 2014). The BAT light curve shows a single spike with a duration of about 0.1 sec in the energy range (25–350) keV. In the soft energy channel 15–25 keV a second pulse is clearly visible with a duration of 0.1s at 0.3s after the trigger. The duration parameter in the 15–350 keV energy range is 0.300.08s (Palmer et al., 2014a). The time-averaged spectrum from T+0.00 to T+0.34s is best fit by a simple power-law model with power-law index of 1.610.23. The fluence in the 15–150 keV band is 7.21.2 (Palmer et al., 2014a). GRB 141212A was also found in INTEGRAL SPI-ACS data (there was no IBAS trigger) as a single pulse with duration of 0.15 sec and statistical significance of 7.3 sigma (Fig. A8). The second soft pulse is not visible in SPI-ACS which is sensitive above 80 keV. At a time scale of 50s, the upper limit on EE activity in SPI-ACS for sGRB 141212A is 7300 counts i.e. S erg cm-2) at the 3 significance level in the (75, 1000) keV range. Ground based MITSuME (Fujiwara, 2014), MASTER network of telescopes (Gres et al., 2014) and UVOT on-board Swift did not find any new optical source within the XRT error-box in the images taken around 31s, 46s and 72s after the BAT trigger respectively down to a limiting magnitude of V 19 mag.
We started observation of the sGRB 141212A with the 1.5 m AZT-33-IK telescope at Mondy observatory on 12 December 2014 at 12:36:10.7650 UT i.e. 22 minutes after the trigger. We also observed it later with the same telescope on December 14 and December 18. We also observed the field with the 0.4m telescope at Khureltogot observatory and 1.0m telescope at Tien Shan observatory (see Table 5 for the complete log of observations). The host galaxy suggested by Malesani et al. (2014) was also detected from our observations using 1.0 – 1.5m telescopes. We did not find any evidence for the optical afterglow signature in our observations taken in filter. As a part of the present analysis, a deeper photometric data using Gemini-N/GMOS-N 8.0 m (Gemini program ID = GN-2014B-Q-10) data in band was analyzed and the bright host galaxy candidate was clearly detected in the data taken at the two epochs as listed in Table 5. Using the Gemini-N/GMOS-N band data, the possibility of any point source in the vicinity of the host galaxy candidate (Malesani et al., 2014) is ruled-out up to limiting magnitude of mag (3-sigma) at 0.68d post-burst. This deep limiting value translates to a luminosity of erg/s/Hz (a factor of 3 deeper than rest-frame luminosity of GW170817 like “kilonova” at contemporaneous epochs), further implies that at the epoch of our observations in band, any associated GW170817 like “kilonova” with the burst would have been detected as seen in a few cases of sGRBs in Rossi et al. (2019).
As a part of the present study, multi-band photometry with the 10.4 m GTC in -filters was performed at late epochs i.e. around 427.3d post burst to investigate properties of the host galaxy (see Table 5). The finding chart with the XRT error circle superimposed on the data taken by the GTC 10.4 m is shown in Fig. A9. The observed flux of the host galaxy of sGRB 141212A obtained by 10.4 m GTC in different filters (see Table 5) and the suggested redshift of the burst (Chornock, 2014) allowed us to model the SED of the host galaxy. We also added upper limits in filters and from Swift-UVOT data (Oates & Ukwatta, 2014). To build the SED of the host galaxy of sGRB 141212A and to estimate parameters we used the Le Phare software package (Arnouts et al., 1999; Ilbert et al., 2006) with fixed redshift. We used the PEGASE2 population synthesis models library to obtain the best-fit SED, the mass and the age of the galaxy, and star formation rate. We tested four different reddening laws: the Milky Way extinction law by Seaton (1979), LMC (Fitzpatrick, 1986), SMC (Prévot et al., 1984), and the reddening law for starburst galaxies (Calzetti et al., 2000; Massarotti et al., 2001). The reduced , galaxy morphological type, bulk extinction, absolute rest-frame magnitude, age, mass, star formation rate, and specific star formation rate (SSFR) per unit galaxy stellar mass are listed in the Table A.1 for all 4 tested extinction laws. Fig. A10 represents the best model corresponding to the Milky Way extinction law.
The best fit shows that the host is a galaxy of elliptic type with mag and a moderate linear size along the major axis about 13 kpc. The major axis is oriented 45 degrees North-West. Age of the host galaxy is Gyr, and the average internal extinction in the galaxy is rather high, mag. The host galaxy has a mass of M☉, and a high star formation rate of SFR M☉/yr. All obtained parameters are in a good agreement with previous studies by Chrimes et al. (2018) except for SFR which is two orders higher in our results.
| Fitted | Starburst | Milky Way | LMC | SMC |
|---|---|---|---|---|
| parameters | model | model | model | model |
| /DOF | 2.8/3 | 2.7/3 | 2.8/3 | 5.9/3 |
| Type | E | E | E | S0 |
| , mag | 0.50 | 0.50 | 0.50 | 0.00 |
| , mag | ||||
| Age, Gyr | ||||
| Mass, M☉ | ||||
| SFR, M☉/yr | ||||
| SSFR, yr-1 |

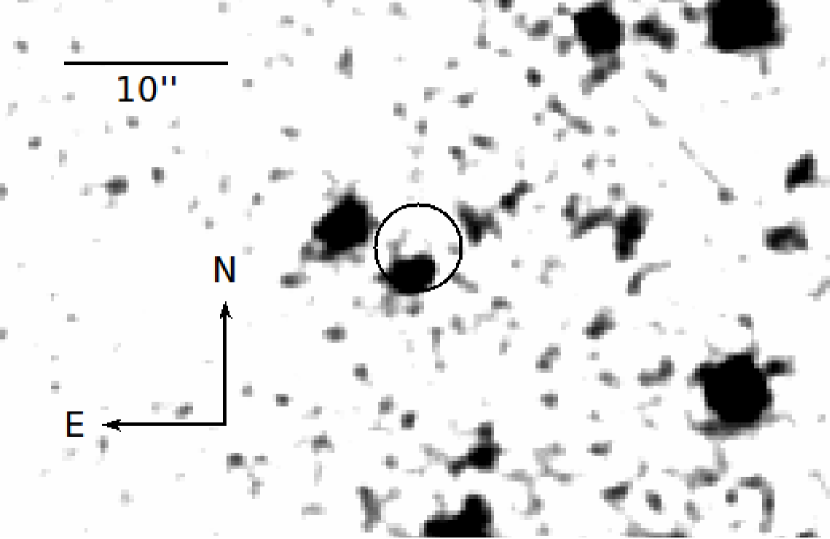
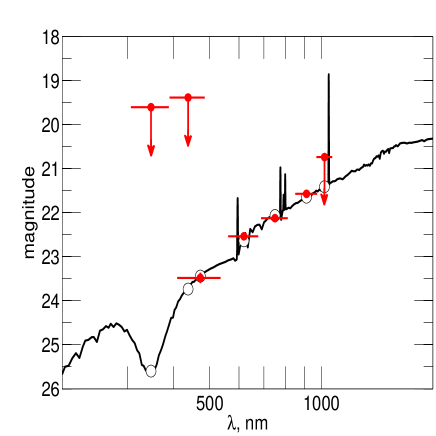
A.8 sGRB 151228A
sGRB 151228A (trigger=668543) was discovered by Swift on 2015 December 28 at 03:05:12 UT with a duration of = 0.270.01s (Ukwatta et al., 2015; Barthelmy et al., 2015). The burst was also detected by Fermi-GBM (Bissaldi et al., 2015) but there was no Swift-XRT localization (Page, 2015) due to an observing constraint. The burst was also detected by INTEGRAL SPI-ACS and triggered its IBAS system. The SPI-ACS light curve of sGRB 151228A is presented in Fig. A11 (top panel) and shows two overlapping pulses with a total duration of about 0.3 sec. At a time scale of 50s, the upper limit on EE activity in SPI-ACS for sGRB 151228A is 7700 counts i.e. S erg cm-2) at the 3 significance level in the (75, 1000) keV range. As a part of the present analysis, Fermi-GBM data was fitted for the time-averaged spectrum of the NaI n4 data and was found that cutoff-PL model as the best fit. The low-energy photon index = 0.720.84 and Epeak = 261.18 keV, much lower than reported in Bissaldi et al. (2015). The corresponding GBM flux is (1.4) in 1-104 keV. The lightcurve of Fermi-GBM also have two overlapping pulses with a total duration of about 0.4 sec. The spectral fitting plot with cutoff-PL model is shown in Fig. A11 (bottom panel) 444https: //fermi.gsfc.nasa.gov/ssc/data/analysis/rmfit/. As estimated in case of sGRB 140930B, we constructed the trajectory for sGRB 151228A on the Amati diagram (see Fig. 9), because the redshift z for sGRB 151228A was unknown. The trajectory lies above the main correlation at any z, which may suggest that sGRB 151228A belongs to the class of the short bursts. Since the burst does not fall into the Epeak(1+z)/Eiso correlation region at any z, the redshift and Eiso of this burst cannot be estimated.
Early optical searches within the BAT error circle do not find any new optical source down to a limiting magnitude of 17 mag using the 0.60m T60 telescope (TUBITAK National Observatory, Antalya - Turkey) starting 90 sec after the burst (Sonbas et al., 2015). The GTC 10.4 m was triggered around 1.143d after the burst and covered the full error box in filter with a total exposure time of 560 sec. The GTC observations cover the full BAT error circle, except for a gap between chips of a CCD camera (the gap covers 7.4% of the total error box). The BAT error-circle was again observed by the GTC 10.4m in filter around 69d after the burst with a total exposure of 775 sec. Due to different limiting magnitude, FWHM and inadequate flat-fielding for the whole FOV of the CCD camera we could not use image subtraction method to search for the source at the first epoch. Instead, we performed a catalog extraction at S/N = 3 for each epoch. We did not find any new object at the first epoch down to a limiting magnitude of 23.7 mag comparing with the second epoch (limiting magnitude for the second epoch was 24.8 mag). The results of our photometry and values of the limiting magnitude for sGRB 151228A are reported in Table 5.

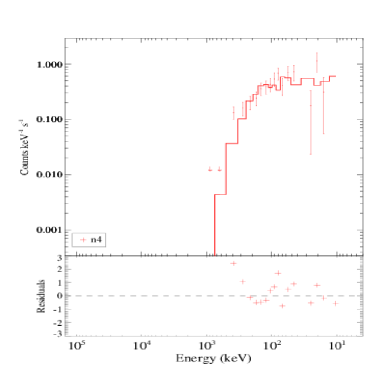
Affiliations
1Aryabhatta Research Institute of Observational Sciences, Manora Peak, Nainital - 263 002, India.
2Instituto de Astrofisica de Andalucia (IAA-CSIC), Glorieta de la Astronomia s/n, E-18008, Granada, Spain.
3Unidad Asociada Departamento de Ingeniería de Sistemas y Automática, E.T.S. de Ingenieros Industriales, Universidad de Málaga, Spain.
4Unidad Asociada Grupo Ciencias Planetarias UPV/EHU-IAA/CSIC, Departamento de Fisica Aplicada I, E.T.S., Universidad del Pais Vasco UPV/EHU, Bilbao, Spain.
5Ikerbasque, Basque Foundation for Science, Bilbao, Spain.
6Nikolaev National University, Nikolska 24, Nikolaev 54030, Ukraine.
7Nikolaev Astronomical Observatory, Nikolaev, Ukraine.
8Institute for Science and Technology in Space, SungKyunKwan University, Suwon 16419, Korea.
9Astronomical Institute of the Academy of Sciences, Boční II 1401, CZ-14100 Praha 4, Czech Republic
10Universidad de Jaén, Campus Las Lagunillas, s/n, Jaén, Spain.
11Institute de Radioastronomie Millimétrique (IRAM), 300 rue de la Piscine, 38406 Saint Martin d’Hères, France.
12Space Research institute, Moscow, Russia.
13National Research Nuclear University MEPhI (Moscow Engineering Physics Institute), Moscow, Russia.
14Thuringer Landessternwarte, Tautenburg, Germany.
15Special Astrophysical Observatory, Nizhniy Arkhyz, Zelenchukskiy region, Karachai-Cherkessian Respublic, 369167, Russia.
16Department of Physics, University of Adiyaman, 02040 Adiyaman, Turkey.
17Instituto de Astrofśica de Canarias (IAC), Vía L’actea s/n, 38205 Santa Cruz de La Laguna, Tenerife, Spain.
18School of Earth and Space Exploration, Arizona State University, Tempe, AZ 85287, USA.
19NASA, Goddard Space Flight Center, Greenbelt, MD 20771, USA.
20Radio Astronomy Laboratory of the Crimean Astrophysical Observatory, Katsiveli, Crimea.
21Kharadze Abastumani Astrophysical Observatory of Ilya State University,
K. Cholokashvili Ave. 3/5, Tbilisi 0162, Georgia.
22Ulugh Beg Astronomical Institute of the Uzbek Academy of Sciences, Tashkent, Usbekistan.
23Fesenkov Astrophysical Institute, Almaty, Kazakhstan.
24Astronomical Scientific Center, Moscow, Russia.
25Ussuriysk Astrophysical observatory of Far-East Department of Russian Academy of Sciences, Ussuriysk, Russia.
26Kuban State University, Krasnodar, Russia.
27Istanbul University Science Faculty, Department of Astronomy and Space Sciences, 34119, University-Istanbul, Turkey.
28Instituto de Astronomia, UNAM, Unidad Academica en Ensenada. Ensenada 22860 Mexico.
29University of Leicester, Department of Physics & Astronomy and Leicester Institute of Space & Earth Observation, University Road, Leicester, LE1 7RH, UK.
30Astronomy Department, University of California, Berkeley, CA 94720-7450, USA.
31Department of Astronomy and Astrophysics, University of California, 1156 High Street, Santa Cruz, CA 95064, USA.
32Institute of Solar-Terrestrial Physics, Irkutsk, Russia.
33Yunnan National Astronomical Observatory, Chinese Academy of Sciences, Phoenix Hill, 650011 Kunming, Yunnan, China.
34Beijing National Astronomical Observatory, Chinese Academy of Sciences, 20A Datun Road, Chaoyang District Beijing 100012, China.
35Center of Astronomy and Geophysics Mongolian Academy of Sciences, Ulaanbaatar, Mongolia.
36National Research University Higher School of Economics, Moscow, 101000, Russia.
37Keldysh Institute of Applied Mathematics, Moscow, Russia.
38INAF - Istituto di Astrofisica e Planetologia Spaziali, Via Fosso del Cavaliere 100, 00133 Roma, Italy.
39 Key Laboratory of Modern Astronomy and Astrophysics, Nanjing University, Ministry of Education, Nanjing, 210093, China.
40School of Astronomy and Space Science, Nanjing University, 210093, Nanjing, China.
41Department of Physics, University of Warwick, Coventry, CV4 7AL, UK.
42Department of Physics, University of Bath, Claverton Down, Bath BA2 7AY, UK.
43Samtskhe Javakheti State university, Rustaveli st.113, Akhaltsikhe, 0080, Georgia.
44Instituto de Astronomía, Universidad Nacional Autónoma de Mèxico, Apartado Postal 70-264, 04510 México, CDMX, Mexico.