High-efficiency broadband THz emission via diffraction-radiation cavity
Abstract
Accelerator-based terahertz (THz) radiation has been expected to realize a high-power broadband source. Employing a low-emittance and short-bunch electron beam at a high repetition rate, a scheme of coherent diffraction-radiation in an optical cavity layout is proposed. The scheme’s stimulated radiation process between bunches can greatly enhance the efficiency of the radiation emission. We performed an experiment with a superconducting linac constructed as an energy recovery linac (ERL) test facility. The electron beam passes through small holes in the cavity mirrors without being destroyed. A sharp THz resonance signal, which indicates broadband stimulated radiation correlated with beam deceleration, was observed while scanning the round-trip length of the cavity. This observation proves the efficient beam-to-radiation energy conversion due to the stimulated radiation process.
I Introduction
Light sources have played important roles in the progress of science in various fields. The terahertz (THz) spectrum range, which is usually defined from 0.3 to 3 THz, spans the technological gap between microwave and optical technologies Tonouchi (2007). THz light sources are the most immature over a wide spectrum of light. As it corresponds to a photon energy of 1.2 to 12 meV and a temperature of 14 to 140 K, the natural environment at room temperature is filled with THz-scale phenomena. For example, the excitation energy of molecular dynamics, such as the rotation and oscillation of a molecule and lattice, corresponds to the THz scale. Development of THz sources is necessary for investigating such dynamics. For the production of high-power radiation, the efficiency of THz radiation production is the key for the source development.
A table-top Fourier-transform infrared spectroscopy system (FT-IR) Griffiths and de Hasseth has been developed utilizing a thermal source. The spectrum of the thermal source is determined by black-body radiation, which peaks in the near-infrared range, and its power in the THz range is quite small and unstable. A time-domain spectroscopy (TDS) system has been developed utilizing photoconductive antenna or nonlinear crystal. When excited by a short pulse laser, the emitter can produce a short pulse of an electric field, which contains a broad frequency component in the THz range. Although it can produce a high peak amplitude of the electric field, the average power is limited. As for a narrow-band source, laser-based technologies have been developed. From high-peak-power optical pulse lasers, a signal in the THz range can be produced by frequency down-conversion utilizing a nonlinear crystal. Although high peak power can be obtained, these systems are limited to low-duty pulse operation of the pump laser. Recently, semiconductor laser technology has been under development in the THz range. A device called the quantum cascaded laser (QCL) can now produce milliwatt level of cw power Kohler et al. (2002); Walther et al. (2007). From microwave technology, a backward wave oscillator (BWO) system is now commercially available Perov et al. (2014). Basically, it utilizes radiation emitted from the coherent motion of electrons, and the principle is similar to those developing in accelerator based system.
Accelerator-based sources have been under development. The conventional ones use incoherent synchrotron radiation in an electron storage ring Nanba et al. (1986). When the emission of synchrotron radiation occurs coherently in the structure of a bunch, very high-power radiation is generated. A coherent synchrotron radiation (CSR) source can be realized at the storage rings by using short-bunch beam optics Wang et al. (2006); Byrd et al. (2004); Sannibale et al. (2008) or imprinting electron density modulation by interaction with a laser pulse Byrd et al. (2006); Shimada et al. (2007). The electron-linac-based system has advantage in producing a short-bunch beam. When the bunch length is shorter than the radiation wavelength, the radiation becomes coherent for all the electrons in a bunch. The radiation intensity is proportional to the square of the bunch charge. This system can realize a much higher intensity at higher frequencies than ring-based systems, although the repetition rate is limited by the machine cycle.
Various radiation mechanisms can be considered. The most conventional one is CSR emitted at a bending magnet Carr et al. (2002). Using an undulator G.A.Krafft (2004); Shevchenko et al. (2012), a narrow spectrum of radiation can be produced. By inserting a target in the path of the beam, coherent transition radiation (CTR) can be produced at the target. It is radiation emitted when a relativistic beam passes through an interface between materials with different refraction indexes. The advantages of CTR over CSR are that it can be set up in a simple geometry in the straight pass of the beam, and it has a uniform frequency dependence. CTR is widely used for electron beam diagnostics of accelerators Murokh et al. (1998); Kung et al. (1994). However, it cannot be used as a high-power source because it destroys the electron beam and produces background radiation; also, the target is damaged. Coherent diffraction radiation (CDR) is a radiation mechanism that is similar to CTR. Radiation is emitted when an electron beam nondestructively passes through an aperture or near the edge of a target Potylitsyn (1998). It can be used with a high-power beam. It also has been used for beam diagnostics Cianchi et al. (2011); Karataev et al. (2004).
Conventional linacs of normal conducting accelerator cavities only work at low-duty pulsed operation limited by the rf power loss on the cavity wall. On the other hand, recently developed superconducting linacs can be operated in a continuous mode (cw). The average beam power can be much higher compared with that from normal conducting linacs. Especially with an energy recovery linac (ERL) scheme Ben-Zvi (2016) that recycles the beam power, beam loading effects can be neglected, and a much higher beam power than that applied by the external rf source can be operated. The features of the high current beam realized by a superconducting linac fit the nondestructive schemes of THz sources, such as CSR and CDR, and it has the potential to be a high-power source Green et al. (2016).
Here, we consider an optical cavity system that stacks the coherent radiation emitted in the cavity; in other words, the beam excites the optical cavity. When the cavity is excited at resonance, an electron bunch in a multi-bunch beam coherently emits radiation in the electromagnetic field that already exists in the cavity. This results in more radiated power being extracted from the electron bunch than in a simple setup that is not based on a cavity. This mechanism is called stimulated radiation.
The principle of stimulated radiation in the THz range was first tested in a destructive layout by CTR Lihn et al. (1996). The electron beam struck one of the mirrors of an optical cavity and emitted CTR. By measuring the internal cavity power while scanning the cavity length, a resonance structure was observed. Tests by CSR were performed using a two-mirror cavity with a bending magnet in the center Shibata (1997, 2004a, 2004b). The test was also performed in a destructive layout, with the beam striking and being transmitted by one of the mirrors. Resonance peaks of millimeter waves were observed with a narrow-band detection setup. Recently, a test in the millimeter wave range in a CDR layout that used cavity mirrors with a hole for beam passage was performed Aryshev et al. (2014). Although some resonance behavior was observed, the structure of the resonance peak was not clear. There might be several reasons for this. The cavity design was not optimized for broadband excitation. The number of bunches was limited under the experimental conditions. There was difficulty in passing the beam without loss.
Broadband stimulated radiation in the THz range in a CDR layout without beam loss has not been established. Because it requires a low-emittance short-bunch beam at a high repetition rate, the experimental setup has become feasible only with the development of a recent high-quality linac. One of the practical problem with CDR layout is the severe requirement of the passage of a high current beam through a small aperture. This requires experimental demonstration Alarcon et al. (2013). From the standpoint of beam dynamics, the CDR layout enables us to measure the beam downstream of the cavity. It provides useful information such as beam deceleration due to the radiation emission. Such an energy diagnostic obtained downstream turned out to be quite useful in free electron laser (FEL) machine studies Huang et al. (2010); Ratner et al. (2015).
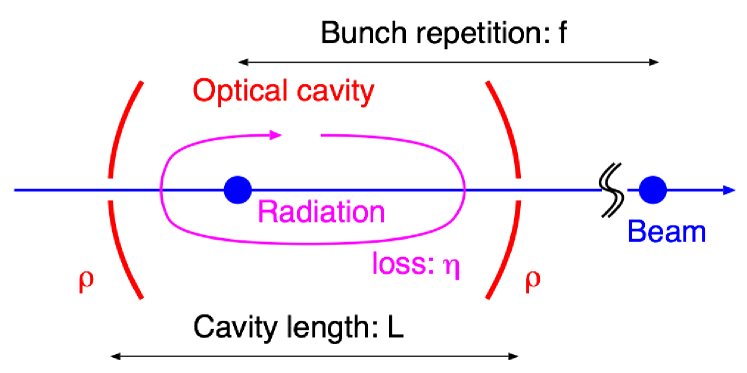
We present an experiment performed with a modern superconducting linac constructed as a test facility of an ERL Akemoto et al. (2018). The low-emittance beam produced by the photocathode injector can realize the CDR layout. The sub-picosecond short-bunch beam generated in the bunch compression mode Honda et al. (2017) emits coherent radiation in the THz range. The schematic of the experimental situation is shown in Figure 1. An optical cavity formed by two spherical mirrors with a small hole in the center was installed in a straight pass of an electron beam. The beam emits radiation in the THz range in the cavity via the CDR process at the boundary of the mirrors. When the cavity round-trip time matches the bunch spacing of the multi-bunch beam, radiation occurs coherently between bunches, and higher radiation power than just a simple intensity summation of the number of bunches is produced.
We presented a result showing evidence of stimulated radiation in the THz range in the CDR layout for the first time by measuring the resonance peak while scanning the cavity length Honda et al. (2018). In this paper, we report detailed studies, such as observations of resonance peaks obtained in separated frequencies and by changing the number of bunches in a beam macro-pulse. Measurement of the cavity power growth in the time domain was performed using a fast detector, and the result was compared with the calculation. The beam energy was measured downstream of the cavity, and it showed the effect of beam-to-radiation energy conversion at the cavity resonance.
II Principle
We describe the principle of excitation of optical cavity modes by beam passage. Although the mirrors have a hole at the center in the actual setup, we ignore the effect of the holes in this section. This situation can be understood as the case of the CTR cavity, i.e., infinitesimal hole size.
II.1 Excitation of an optical cavity mode
First, we recall the conventional procedure for calculating the interaction between a charged particle and an rf cavity structure in a beam duct, as illustrated in Figure 2. When a cavity structure is given, one can calculate its eigen modes. The question is how much electromagnetic power will be excited in a specific eigen mode by the beam passage Inoue et al. (2008). When an eigen mode of interest is given, its normalized shunt impedance is defined as
| (1) |
where is the angular frequency, and is the electric field of the mode. is the energy stored in the cavity corresponding to the electric field distribution. The numerator indicates integration of the electric field along the beam trajectory moving at the speed of the beam. The excited energy in the cavity can be calculated by
| (2) |
where is the bunch charge. Here, we assume that the bunch length is negligibly smaller than the wavelength.
As can be understood from Eq. 1, in order to be excited by the beam, the mode has to have a component of the electric field that is longitudinal with respect to the beam trajectory. In the case of a plane wave that is traveling parallel to the beam, however, its electric field is perpendicular to the beam trajectory. Hence, such a mode does not interact with the beam. In this paper, we consider an optical cavity that stores optical modes that travel parallel to the beam. Because the modes of interest here are not a simple plane wave, they can be excited by the beam.
By describing the electromagnetic amplitude of the field localized in the vicinity of the -axis and propagating in the direction as , the time-independent part is described by the paraxial equation,
| (3) |
where and are the axes transverse to the propagation direction, and is the wave number, which is related to the radiation wavelength and the speed of light, , as . The simplest solution of Eq. 3 is the well-known Gaussian beam
| (4) |
where , and is the beam size at the waist. is the beam size at location : . is the curvature radius of the wavefront: . is the Rayleigh length, which is defined as . is called the Gouy phase: . is an arbitrary scale factor.
In the case of an optical cavity, due to the boundary condition of the mirrors, solutions of discontinuous are accepted as eigen modes and are called longitudinal modes. One important difference between an optical cavity and a typical rf cavity is that it contains thousands of longitudinal modes. This results in the picture of mode-lock pulse that a light pulse propagates back and forth in the cavity.
The fundamental Gaussian mode explained above does not have a longitudinal field on the beam axis; hence, it is not excited by the beam. Here, we consider higher-order transverse mode solutions, called the Hermite-Gaussian beam. The -th mode can be described as Siegman (1986)
| (5) |
where is the -th order Hermite function. For simplicity, we limit the discussion to a cylindrical symmetric case. The transverse electric field of the first-order mode is explicitly written as follows:
| (6) |
The round-trip propagating energy in the cavity of length , corresponding to of Eq. 1, can be calculated by integrating the electromagnetic energy as
| (7) | |||||
where is the vacuum permittivity. indicates the contribution of the round-trip. Here, the contribution of the small longitudinal field component which will be discussed in the following, is neglected.
Because the three-dimensional field components are related to each other, the longitudinal component of the electric field can be determined by the transverse field distribution Scully and Zubairy (1991). The general relation that connects the longitudinal and transverse fields is given as
| (8) |
Applying Eq. 8 to Eq. 6, the longitudinal field distribution can be calculated as shown in Figure 3. At the center of the beam, the longitudinal field is maximum, while the transverse field is zero. The longitudinal field on the axis can be explicitly written as
| (9) |
Approximating the velocity of the beam as the speed of light, , the excited energy becomes
| (10) | |||||
| (11) |
The integration along the -axis should be performed between the cavity mirrors. As can be seen, the result basically depends only on and the cavity boundaries.
depends on the design of the cavity, which is determined by the cavity length and the curvature radius of the mirrors . Figure 4 shows that the relative beam to cavity coupling strength, in other words, the efficiency of cavity mode excitation, depends on the cavity parameter under a fixed cavity length for the symmetric cavity case. The highest coupling is realized at . It corresponds to , and this type of cavity is called confocal.
II.2 Excitation by a multi-bunch beam
When the cavity is excited by a multi-bunch beam whose bunch spacing matches the round-trip time of the cavity, the radiation signal of each bunch is stacked as a coherent amplitude addition. The amplitude of a mode in the cavity after the -th bunch becomes
| (12) |
where is the relative power loss in one round trip; indicates the total loss, and the zero loss. is the phase shift over a single round trip. can be changed by finely changing in a scale within the wavelength. The power enhancement gain after an infinite number of bunches can be obtained as
| (13) |
and is plotted in Figure 5 as a function of . We note that this resonance function is the same as the one that appears when an external optical cavity is excited by a laser Siegman (1986). We define the finesse of the cavity by . The gain at resonance is . The cavity mode is excited more strongly at a lower cavity loss. When we are interested in the extracted radiation power available outside the cavity, instead of the cavity internal power, the effective power gain becomes . Here, we assume that the cavity loss mostly corresponds to the out-coupling.
The full-width-half-maximum resonance width is determined by the cavity loss. It can be written using the cavity length variation as
| (14) |
Further, it can be written using the bunch timing variation as
| (15) |
In order to resonantly excite a cavity of small loss, mechanical stability of the cavity length and stability of the bunch arrival time are required. For example, in the case of m (1 THz) and (), nm and fs.
II.3 Broad-band excitation
The discussion in Sec.II.2 focused on one of the cavity modes. As explained in Sec.II.1, the optical cavity has many longitudinal modes (and sets of transverse modes belonging to each longitudinal mode) that correspond to frequencies that are integral multiples of the round-trip frequency. The frequency of the -th longitudinal mode is , where is the fundamental frequency and matches the bunch repetition. Here, we consider the shift of resonance conditions in the longitudinal modes. For simplicity, we limit the discussion to the symmetric cavity and the first-order transverse mode. The additional phase effect due to the Gouy phase affects the resonance condition of the cavity by as the round-trip phase. This shifts the resonance condition for the -th longitudinal mode as
| (16) |
where is the curvature radius of the mirrors.
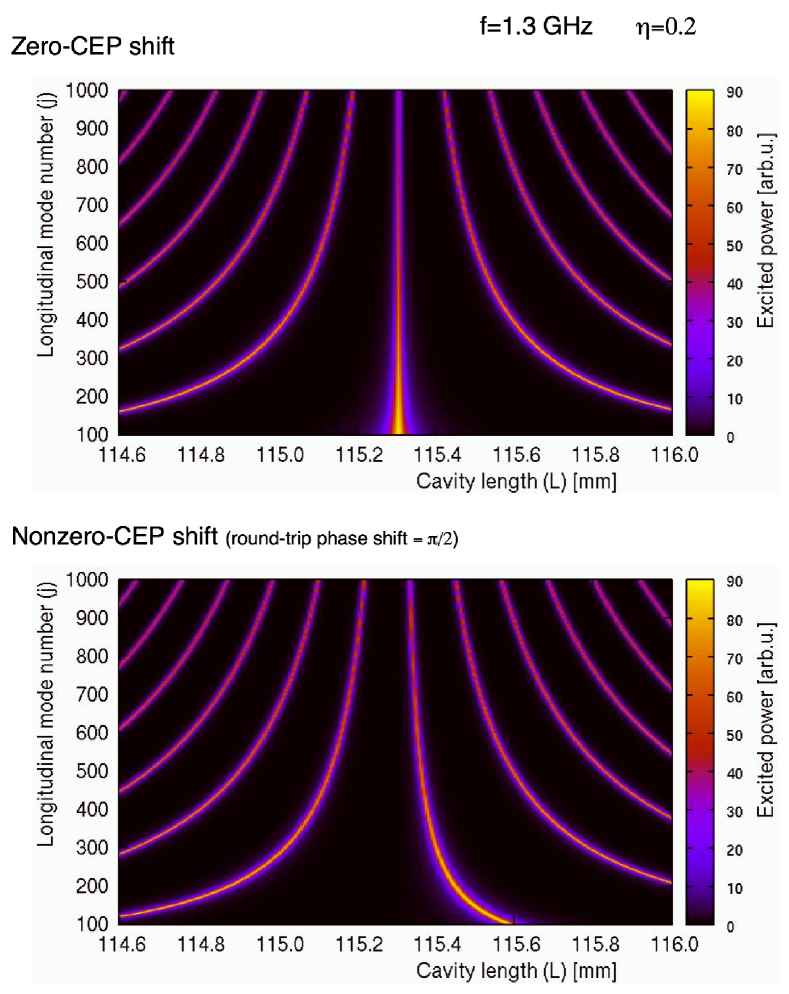
In general, the resonance condition in the cavity length is different for each mode. Hence, modes of different frequency cannot be excited by a multi-bunch beam at the same time. However, in the special case of confocal cavity design, , becomes an integral multiple of for all ’s, resulting in all longitudinal modes being excited simultaneously. This mechanism can be described as a picture of the carrier-envelope phase (CEP) of the pulse traveling back and forth in the optical cavity. In the general case, the CEP shifts in every round trip of the pulse. Signals of the multi-bunch beam cannot be stacked coherently in such a case. The confocal cavity is a special case with a zero-CEP shift, and hence it can coherently add broad spectral signal in a multi-bunch. Figure 6 explains the cavity resonance on a map of the cavity length and longitudinal mode number. If one only focuses on the longitudinal modes in a narrow bandwidth, the resonance structure repeats at every half wavelength in the cavity length, as already seen in Figure 5. But in a broad bandwidth, the resonance condition spreads due to the wavelength difference. Only under the perfect synchronized condition, in which means that the cavity length exactly matches the bunch repetition, do all the longitudinal modes resonate at the same time. Note that the broadband excitation is possible only with the zero-CEP shift design. The bottom figure of Figure 6 shows an example of a nonzero-CEP shift case, i.e., with chosen to be non-confocal, where the resonance line curved as the mode number; broadband excitation cannot be realized. When one observes the radiation with a broadband detector while scanning the cavity length, the projected resonance curve as shown in Figure 7 will be seen. If the cavity is designed to be zero-CEP shift, a strong peak that corresponds to the excitation of the broad spectrum is seen under the perfect synchronized condition. The other peaks are smeared out and appear as a plateau.
When broadband excitation is realized, the total radiation power can be estimated by considering the following factors: excitation of a mode by a single bunch, the effective power gain of stimulated radiation by a multi-bunch, and the number of longitudinal modes excited at the same time. The upper limit of the radiation frequency, , is given by the bunch length of the electron beam. The total radiation power becomes,
| (17) |
Because of the energy conservation, the electron beam loses its kinetic energy corresponding to the energy converted to the radiation.
III Experimental Setup
III.1 Accelerator
We performed the experiment with a compact ERL (cERL) in KEK. cERL is a test facility for the development of accelerator technologies for an ERL. A detailed description of cERL is given elsewhere Akemoto et al. (2018). Figure 8 shows the layout of the cERL. The beam is produced at the photocathode DC gun. After it is accelerated by the injector superconducting accelerator up to a total energy of 5.3 MeV, it is merged with the circulating path. The beam is then accelerated by the main superconducting accelerator up to a total energy of 17.9 MeV. After passing through the return loop, which consists of two arc sections and a straight section, the beam re-enters the main accelerator in the deceleration phase and it loses energy down to the injector energy. It is then sent to the beam dump. Because the main accelerator recycles the energy by decelerating the beam, it does not have a net beam loading and can operate with high beam power.
Although the nominal operation mode of cERL is the energy recovely mode, this experiment was performed in the burst operation of the energy nonrecovery mode. The beam was stopped at the end of the return loop. In the burst operation, the electron beam emission at the gun was time-gated by the photocathode laser system to form a macro-pulse of a multi-bunch beam, while all the rf systems in the accelerator cavities operated in the cw mode. The bunch repetition rate was 1.3 GHz, which is determined by the rf frequency of the accelerator cavities. The beam conditions in this experiment are summarized in Table 1.
| Beam energy at return loop | 17.9 MeV |
|---|---|
| Bunch repetition | 1.3 GHz |
| Bunch charge | 1.2 pC |
| Macro-pulse length | 1 s (can be changed) |
| Repetition of macro-pulse | 5 Hz |
| Normalized emittance | 2.0 (X), 0.7 (Y) m |
| RMS bunch length | 120 fs |
The experiment is set up at the straight section, where a short-bunch beam is available. The detailed layout of this section is shown in Figure 9. Because of the achromatic optics of the arc section, transverse dispersion is designed to be zero in the straight section. The first three quadrupole magnets in the straight section can be used to adjust the beta function of the beam for this experiment. The quadrupole magnets have correction coils to produce a dipole field for finely steering the beam orbit. The screen monitor system just behind the setup of this experiment can be switched to a metal target for producing CTR. It was used for bunch length diagnostics. The first screen monitor in the second arc section was used to measure the beam energy variation.
III.2 Optical cavity
Figure 10 shows the structure of the optical cavity, which consists of two spherical mirrors facing each other. The distance between the two mirrors, the cavity length, is designed to be 115 mm. The round-trip time of the cavity matches to the bunch repetition rate of 1.3 GHz. The two cavity mirrors are identical. The mirror substrate is made of copper. Its spherical surface is gold coated to obtain a high reflectance in the THz range. The thickness of the mirrors is 10 mm, and their diameter is 50 mm. The radius of curvature of the mirror is specified to be 115 3 mm, which is equal to the cavity length for confocal cavity design. The opposite surface of the mirror is flat. The mirror has a hole at the center. The diameter of the hole is 3 mm at the spherical surface, and it is enlarged to 6 mm at the opposite surface having a tapered shape. Because the mirror substrate was fabricated by rotation machining of better than 20 m precision, the outer shape, i.e., the flat surface and the cylindrical surface, can be used as a good mechanical reference in the initial alignment. The mirror holders have a kinematic adjustment system to finely align the angle of the mirror. In order to scan the cavity length, the downstream mirror holder is mounted on a piezoelectric stage (Model 3030 of attocube Inc.). It can be controlled up to 1 nm precision in a closed loop system within a 10 mm range.
| Cavity length () | 115 mm |
| Range of adjustment | 10 mm |
| Diameter of mirror | 50 mm |
| Thickness of mirror | 10 mm |
| Radius of curvature of mirror () | 115 3 mm |
| Diameter of mirror hole | 3 mm (tapered to 6 mm) |
| Material of mirror | Au-coated Cu |
As shown in Figure 11, the cavity is installed in a big cylindrical vacuum chamber of 244 mm diameter. The cavity structure is suspended by a manipulator so that the structure can be repositioned upward from the beam axis in the chamber. A shielding duct to facilitate smooth connection of the beam duct can be inserted in the space. This is to protect against interference with the accelerator operation from other experiments. A screen monitor consisting of a Ce-doped YAG scintillator of 1212 mm2 and 0.1 mm thickness can be inserted at the center of the cavity at a 45∘ angle with respect to the beam axis. This screen monitor was used for measuring the beam size and position at the cavity. It could also be used for blocking the cavity resonance to confirm the resonance signal.
The optical cavity was designed to be symmetric and confocal. The eigen mode beam size at the center , and on the mirrors are given as
| (18) |
In our setup, mm for 0.5 THz radiation.
Because the first-order transverse mode has a node at the center, the power loss at the hole can be small enough even with a hole of a few millimeters size. The contribution of the power in the central 3-mm-diameter area is estimated to be 1% of the total power of the mode for one mirror at 0.5 THz.
A fraction of the radiation power inside the cavity is emitted through the mirror holes in both directions. The tapered structure of the mirror hole was optimized to function as a horn antenna to improve the directivity of the radiation emission King (1950). Only emission in the upstream direction is measured in this experimental setup. As seen in Figure 11, a separated vacuum chamber is connected 309 mm upstream of the cavity chamber. It works as a radiation extraction chamber that reflects the radiation from downstream to the transverse direction by a gold-coated flat stainless steel plate mirror angled 45∘ with respect to the beam line. It has an elliptic hole, which appears as a 10-mm-diameter circular aperture from the perspective of the electron beam, on the beam axis. The radiation is transmitted to air through a sapphire window of 1.5 mm thickness.
The layout of the THz detection system is shown in Figure 12. The radiation extracted from the vacuum chamber is first collimated by a plastic (PFTE) lens of 500 mm focal length. It is then split into two paths by a Si plate beam splitter. One of the paths is for detection with a liquid-helium cooled Si bolometer (product of Infrared Laboratories Inc.). The bolometer has a sensitivity up to 20 THz. Its time resolution is 100 s, which is not enough to observe the time structure of power growth. Reflecting with an off-axis parabolic mirror of focusing length 230 mm, the radiation is focused on the detector aperture. We prepared a remote-controlled filter mount in front of the detector. Four types of bandpass filters (BPFs), with center frequencies of 0.3, 0.5, 1.0, and 1.5 THz of 10% bandwidth (full width at half maximum), can be inserted. If the detector is saturated with too large signal, three types of doped-Si power reducers, with transmittances of 10, 3, and 1%, can be inserted in front of the detector. The second path is for detection with a diode-type detector that has a time resolution of a few nanoseconds, which is sufficient to resolve the time structure in a beam macro-pulse. At the focal point of an off-axis parabolic mirror of focusing length 230 mm, a quasi-optical detector (QOD) (product of Virginia Diodes Inc.) is mounted on a two-dimensional stage. The sensitive frequency range of the QOD is lower than that of the bolometer and is not uniform. It mainly measures a lower frequency range than 0.3 THz.
III.3 Beam tuning
For realizing this experimental layout of a small beam aperture without serious beam loss, low beam emittance is the key. We measured the beam emittance in the straight section under the same beam conditions as in this experiment, i.e., a bunch charge of 1.2 pC and in bunch compression mode. The measurement was performed with a waist-scan method. A quadrupole magnet and a screen monitor, namely, Q3 and SCM1 in Figure 9, were used. The normalized emittance was estimated to be 2.0 m (horizontal) and 0.7 m (vertical), respectively.
In order to produce coherent radiation in the THz spectrum range, a short-bunch electron beam is necessary. In the bunch compression mode of cERL, a short bunch of 100 fs (rms) can be realized at the straight section by manipulating the longitudinal phase space Honda et al. (2017). The original bunch length at the injector is designed to be 2 ps (rms). The accelerating rf phase of the main linac was shifted from the crest in order to imprint the time and energy correlation in the bunch. Next, the longitudinal dispersion, the correlation of the path length and energy (), of the first arc section was adjusted using quadrupole magnets in the arc section. The bunch length was evaluated by the CTR interferometer system at the straight section that was installed just behind the setup of this experiment. The details of the CTR bunch length monitor system and the tuning procedure for bunch compression are given elsewhere Honda et al. (2017). The measurement was performed under the same beam conditions as this experiment, except that the beam focus point was shifted to the CTR target location to minimize the effect of the beam size on the bunch length measurement. The result is shown in Figure 13. The autocorrelation interferogram was fitted by a model function including the effects of the low-frequency cutoff. The rms bunch length was estimated to be 120 fs. The spectrum was obtained with a Fourier transform and shows that the frequency reached up to 2.0 THz. The reduction at a lower frequency range than 0.5 THz is due to the sensitivity of the detector and the transfer line. This confirms that THz coherent radiation can be produced in the experiment.
After the bunch compression tuning, we tuned the beam optics of the straight section to focus the beam at the cavity. Two quadrupole magnets placed 4.78 m and 1.58 m upstream of the cavity, Q2 and Q3 in Figure 9, were used. In this beam tuning, the cavity structure was removed from the beam axis, and the screen monitor was inserted at the location for beam size and position tuning. By scanning the strength of the quadrupole magnets, the rms beam size was minimized to 236 m (horizontal) and 61 m (vertical) at the location.
Prior to the beam experiment, an alignment laser light was injected through the holes of the cavity mirrors to simulate the beam path. By inserting the screen monitor in the cavity, the scattered laser light was recorded. It was used as a reference for establishing the beam path on the cavity axis. Using the four steering magnets around the cavity, namely, the correction coils of Q25, we prepared a combined knob to finely adjust the local beam path at the cavity without affecting the orbit outside the area. By scanning the local offset and angle adjustment, we established the best beam conditions for minimizing beam loss. Referring to the beam loss monitors, which detect radiation produced by incidence on the mirror, we confirmed the beam had a mm clearance. The fraction of beam loss at the cavity was estimated to be 2,500 ppm Honda et al. (2018).
IV Experimental Result
IV.1 Observation of resonance signal
The cavity length was scanned while measuring the bolometer signal. Figure 14 shows the results. The scan was performed in 2 m steps in a 1.2 mm range. A sharp peak was observed when the cavity satisfied the condition of broad-band excitation. In the case of the narrow-band measurement, i.e., when inserting a BPF in front of the bolometer, small bumps were repeatedly observed with a separation corresponding to the observation frequency. These results qualitatively agree with the discussion given in Sec.II.3.
Figure 15 shows the results of precise scans in 50 nm steps around the main resonance peak measured with various BPFs. It turned out that the peak had fine structures. The signal became weaker as the frequency increased. It is mainly because of the original beam spectrum determined by the bunch length shown in Figure 13. The overall shape and positions of the fine structures were the same in the measured frequency range of 0.3 GHz to 1.5 THz.
In order to discuss the signal growth in a macro-pulse, we obtained data by varying the macro-pulse length. Figure 16 shows the results of a precise cavity length scan with 0.5 THz BPF. As the number of bunches increases, the intensity becomes stronger, and the peaks in the fine structure becomes narrower. The width of a single peak was measured 150 nm for the 1 s pulse width (1300 bunch) case.
IV.2 Observation of time structure
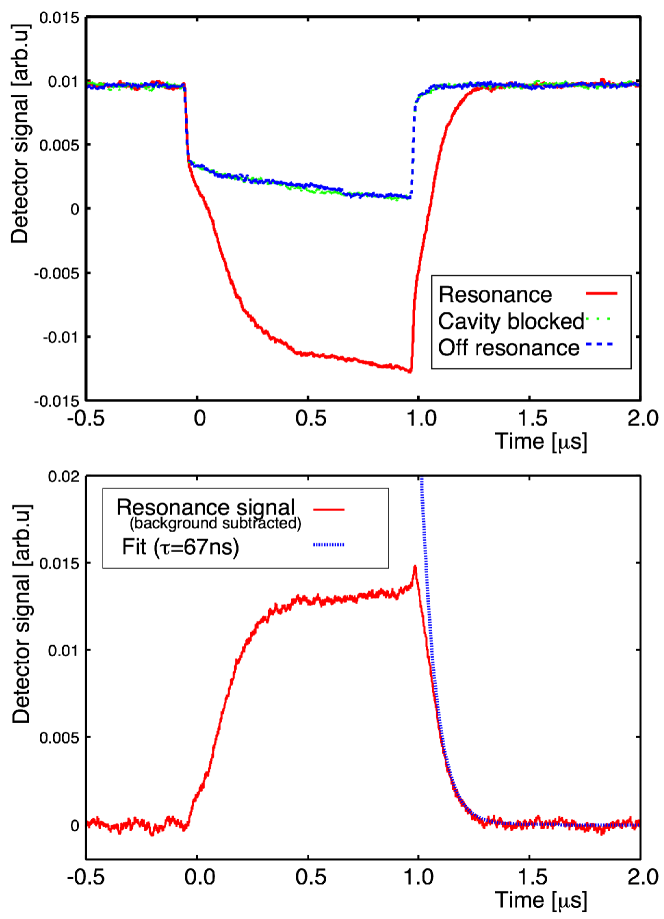
In order to directly observe the signal growth in a macro-pulse, we recorded the waveform of the QOD signal. By measuring the bolometer signal at the same time, the cavity length was set at one of the resonance peaks. As shown in Figure 17 (top), the signal increased gradually at the beginning of the macro-pulse, reached saturation, and then decayed after the pulse ended. The behavior with a time constant is an indication of resonance characteristics. To confirm that this was a resonance signal, following two measurements were performed simultaneously. One was a measurement off the resonance peak, setting the cavity length far away from the peak. The other was a measurement at the resonance peak but blocking the cavity by inserting the screen monitor in the cavity. In both of these cases, a small signal with sharp rising and falling edges was detected. Because these were not related to the cavity resonance, the origin of these signals was single pass diffraction radiation at the outer surface of the upstream cavity mirror.
Figure 17 (bottom) shows the resonance signal obtained by subtracting the non-resonant background contribution. By fitting the decaying part of the signal with an exponential curve, where and are free parameters, the time constant was estimated to be 67 ns. Using the relation , we see that it corresponds to a cavity round-trip loss of .
IV.3 Beam deceleration
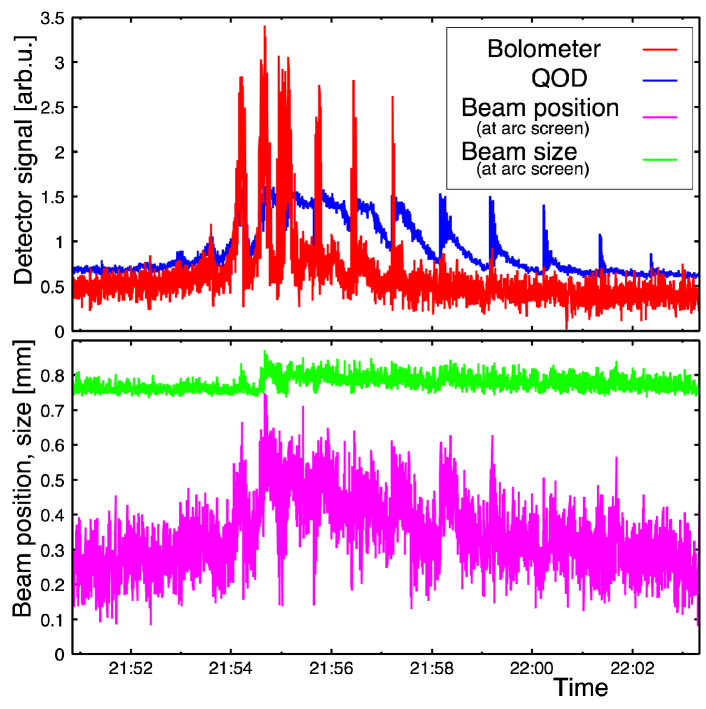
For the performance of a THz source, the power of the THz signal is important. However, a direct measurement of the absolute power was technically difficult because of problems related to the aperture and calibration of the detection system. Instead, in order to evaluate the conversion efficiency from the beam energy to the radiation power, we measured the beam energy downstream of the cavity. A screen monitor in the second arc section, SCM2 in Figure 9, was used. The horizontal dispersion at the screen monitor was designed to be 0.49 m. We set the last quadrupole magnet in the straight section to focus the beam horizontally at the screen to improve the energy resolution. The horizontal rms beam size was 0.8 mm on the screen. By fitting the recorded beam profile with a Gaussian curve with the height, width, and the center position as free parameters, the beam position was obtained. Figure 18 shows the result obtained while slowly scanning the cavity length. The beam position on the screen is plotted with the THz signal. It can be clearly seen that the beam position shifts to the low-energy direction correlating with the THz radiation emission. The maximum position shift at the resonance peak is evaluated as 0.3 mm, which corresponds to of the beam energy deceleration.
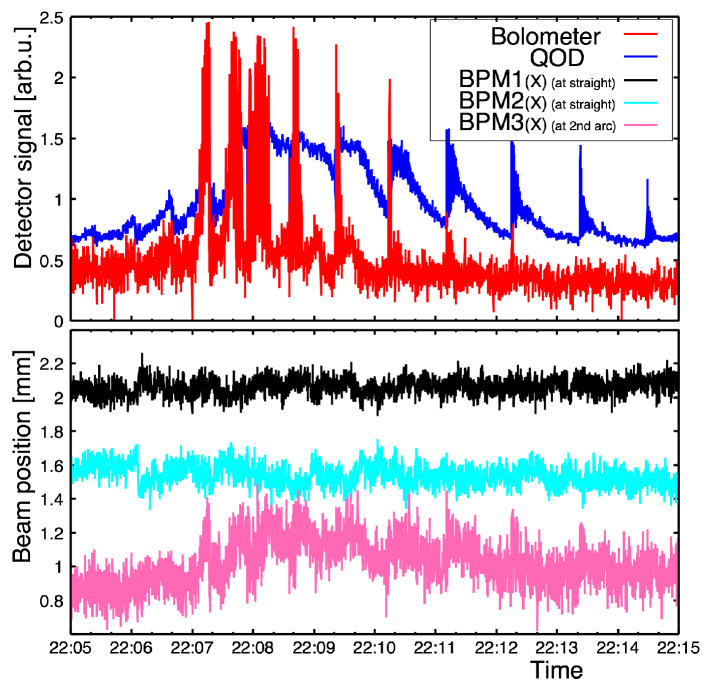
We repeated the same measurement using several strip-line beam position monitors (BPMs). The BPMs are located throughout the straight section to the arc section. As seen in Figure 19, only the BPM at the arc section (BPM3) shows a position shift, while the BPMs at the straight section show no change. This confirms that the beam position shift was caused by energy variation and not by the transverse kick.
V Discussion
The appearance of the resonance structure in the cavity length scan (Figure 14) proves that stimulated emission occurs in the cavity. Strong resonance occured at the perfect synchronization between the radiation round-trip rate and the bunch repetition rate. This is the first result to clearly show stimulated radiation in the THz range in the CDR layout.
From the data obtained by changing the observation frequency range (Figure 15), it was proved that the resonance condition coincides in the broad range of the longitudinal modes. This agrees with the expectation from the zero-CEP shift design of the optical cavity.
The fine structures of the peaks are not what we originally expected. We guess that each peak will correspond to higher-order transverse modes in the cavity. Resonance conditions of higher-order transverse modes are degenerate in the ideal case of the confocal cavity. However, a small perturbation, for example, misalignment of mirrors and the effect of the mirror holes, might split the resonance conditions. Further studies will be needed to establish the reason conclusively.
The waveform measurement of the THz signal (Figure 17) confirms the resonance characteristics: the signal growed and decayed with a time constant. From the time constant, the cavity round-trip loss was estimated to be . On the other hand, from the designed mode size calculated by neglecting the effects of the mirror holes, the intensity contribution to the hole area becomes 0.02 for 0.5 THz as a single path model. However, this seems to be an overestimation for the round-trip loss of the cavity eigen mode. The result obtained from the waveform of the QOD is not inconsistent with the order estimation.
The resonance width in Figure 16 contains information on the number of bunches whose signal stacked coherently, and it should be related to the cavity round-trip loss. The width of each fine structure peak becomes narrower as the number of bunches in the macro-pulse increases. However, due to the interference of many fine peaks and the baseline background, it is difficult to quantitatively determine the resonance width. By roughly estimating the width as 150 nm, the finesse turns out to be 3000 for 0.5 THz, which cannot be explained by only 1300 bunches.
Beam deceleration due to the cavity resonance was experimentally confirmed. This proves that the stimulated emission converts more beam power to the radiation than is obtained by just a simple multiplication by the number of bunches. At resonance, the decelerated energy was measured to be of the beam energy. Under the experimental conditions of 1.2 pC bunch charge of a 17.9 MeV beam at 1.3 GHz repetition, it corresponds to 18 W of power conversion. This estimation neglected the contribution of the rising and falling parts of the macro-pulse. Although we did not measure the radiation power directly, according to energy conservation, the radiation power should be equal to this energy loss of the beam. If we operate the accelerator in the cw mode and correct the emission of one of the directions of the cavity, it becomes a broad-band THz source of 9 W power. We also note that as can be understood from Figure 6, if the cavity length is intentionally shifted from the perfect synchronization condition, the cavity can selectively resonate limited longitudinal modes. In this case, it becomes a narrow-band THz source.
We note that the frequency ranges observed by the QOD and the bolometer are different. Figure 18 shows the THz signal measured by the two detectors at the same time. Although they share similarities, the QOD shows wider peaks, and the overall position looks shifted. We suppose this is because the QOD measured a lower frequency part than did the bolometer.
Here, we compare the beam deceleration result with the calculation in Sec.II.3. According to the beam spectrum of Figure 13, the effective upper limit of the frequency is estimated to be 1.0 THz although it is a smoothly decaying spectrum instead of the sharp cut-off of the simple model. The round-trip loss of the cavity is chosen to be 0.01 using the result of the waveform measurement. The total radiation power is then calculated to be 180 W at 1.2 pC of bunch charge. Comparing this with the beam deceleration result, we observe that the results differ by a factor of 1/10. So far, we have ignored the effects of the hole on the mirrors. In the simple case of a single pass emission from a target, the difference between CDR and CTR can be explained by the fact that CDR has a high-frequency cut-off due to the aperture Potylitsyn (1998). Figure 20 shows the calculation. In the case of the 3-mm-diameter aperture, the radiation intensity reduced by 1/10 at approximately 0.5 THz. This effect can explain most of the difference. Although the cut-off frequency becomes higher as the aperture diameter becomes smaller, there will be a trade-off against the difficulties in handling the electron beam.
Because the 17.9 MeV beam energy of this experiment was relatively low, the approximation in Sec. II.1 that the beam travels at the speed of light may need to be corrected. The time difference for traveling the length of the cavity with respect to the case of the speed of light is calculated to be 150 fs, which corresponds to 1/6.6 of the wavelength at 1 THz. This effect will be an 20% reduction in the excitation efficiency.
Because this was the first experiment, we set the beam parameter at a low bunch charge of 1.2 pC, with which it was easy to establish low-emittance and short-bunch beam conditions. On the other hand, the intensity of coherent radiation will be proportional to square of the bunch charge, and a higher bunch charge will be more efficient in developing a high-power THz source. We plan to establish beam operation at a higher bunch charge, for example, 60 pC, while maintaining the low-emittance and short-bunch length. In this case, the beam conditions may change in the macro-pulse due to the beam loading effects in the accelerator cavities. Further machine studies will be important.
This experiment was performed in the burst operational mode. For a high-average-power THz source, cw operation will be necessary. Although we could focus the beam for having a 4- clearance with respect to the aperture of the cavity, a non-Gaussian beam halo was present that produced beam loss at the mirrors. In order to operate a high-current cw beam with the cavity, management of the beam halo will be important. Machine studies for high-current cw beam operation have been under way.
We have demonstrated beam deceleration due to the cavity resonance. In the energy recovery operation of an ERL, the beam will be decelerated at the main accelerator cavities before being dumped. The energy variation at the dump line will be enhanced by the gain of the main accelerator. Sufficient energy acceptance in the dump line will be necessary for transporting the beam to the dump without beam loss.
VI Conclusion
Accelerator-based THz sources have been expected to realize high average power at broad spectrum. A scheme based on the CDR layout is attractive, because the layout is easy to install in a straight section, it does not destroy the electron beam, and it may be compatible with a high-power electron beam, such as the one in an ERL. Utilizing an optical cavity whose round-trip length matches the beam bunch repetition rate, a stimulated radiation process can be realized, and the power extraction efficiency of the CDR can be greatly increased.
We performed an experiment with an ERL test accelerator that produced a low-emittance and short-bunch beam at a high repetition rate. An optical cavity with a small hole was installed in the straight beam path. A sharp resonance in the broadband THz emission was observed in the cavity length scan. By measuring the time structure of the THz signal, the characteristics of resonance was confirmed. Measurement of the beam deceleration downstream of the cavity proved that the beam energy was converted to radiation efficiently by the stimulated radiation process. This is the first experiment to clearly demonstrate THz-range broad-band stimulated radiation in a CDR layout.
Acknowledgements.
We would like to thank the cERL development team for their support in regard to the beam operation. This work was partially supported by JSPS KAKENHI Grant Number 16H05991 and 18H03473, and by Photon and Quantum Basic Research Coordinated Development Program from the Ministry of Education, Culture, Sports, Science and Technology, Japan.References
- Tonouchi (2007) M. Tonouchi, nature photonics 1, 97 (2007).
- (2) P. Griffiths and J. A. de Hasseth, Wiley-Interscience .
- Kohler et al. (2002) R. Kohler et al., nature 417, 156 (2002).
- Walther et al. (2007) C. Walther et al., Appl. Phys. Lett 91, 131122 (2007).
- Perov et al. (2014) A. N. Perov et al., Journal of Physics Conference Series 486, 012027 (2014).
- Nanba et al. (1986) T. Nanba et al., Int. J. Infrared and Millimeter Waves 7, 1769 (1986).
- Wang et al. (2006) F. Wang et al., Phys. Rev. Lett. 96, 064801 (2006).
- Byrd et al. (2004) J. M. Byrd et al., Infrared Physics and Technology 45, 325 (2004).
- Sannibale et al. (2008) F. Sannibale et al., Journal of Synchrotron Radiation 15, 655 (2008).
- Byrd et al. (2006) J. M. Byrd et al., Phys. Rev. Lett. 97, 074802 (2006).
- Shimada et al. (2007) M. Shimada et al., Jpn. J. Appl. Phys. 46, 7939 (2007).
- Carr et al. (2002) G. L. Carr et al., nature 420, 153 (2002).
- G.A.Krafft (2004) G.A.Krafft, Phys. Rev. ST-AB. 7, 060704 (2004).
- Shevchenko et al. (2012) O. Shevchenko et al., Proceedings of FEL2012 (2012).
- Murokh et al. (1998) A. Murokh et al., Nucl. Instrum. Meth. A 410, 452 (1998).
- Kung et al. (1994) P. Kung et al., Phys. Rev. Lett. 73, 967 (1994).
- Potylitsyn (1998) A. Potylitsyn, Nucl. Instrum. Meth. B 145, 169 (1998).
- Cianchi et al. (2011) A. Cianchi et al., Phys. Rev. ST-AB. 14, 102803 (2011).
- Karataev et al. (2004) P. Karataev et al., Phys. Rev. Lett. 93, 244802 (2004).
- Ben-Zvi (2016) I. Ben-Zvi, Supercond. Sci. Technol. 29, 103002 (2016).
- Green et al. (2016) B. Green et al., Scientific Reports 6, 22256 (2016).
- Lihn et al. (1996) Lihn et al., Phys. Rev. Lett. 76, 4163 (1996).
- Shibata (1997) Shibata, Phys. Rev. Lett. 78, 2740 (1997).
- Shibata (2004a) Shibata, Nucl. Instrum. Meth. A 528, 162 (2004a).
- Shibata (2004b) Shibata, Nucl. Instrum. Meth. A 528, 157 (2004b).
- Aryshev et al. (2014) A. Aryshev et al., Nucl. Instrum. Meth. A 763, 424 (2014).
- Alarcon et al. (2013) R. Alarcon et al., Phys. Rev. Lett. 111, 164801 (2013).
- Huang et al. (2010) Z. Huang et al., Phys. Rev. ST-AB. 13, 020703 (2010).
- Ratner et al. (2015) D. Ratner et al., Phys. Rev. AB. 18, 030704 (2015).
- Akemoto et al. (2018) M. Akemoto et al., Nucl. Instrum. Meth. A , 197 (2018).
- Honda et al. (2017) Y. Honda et al., Nucl. Instrum. Meth. A 875, 156 (2017).
- Honda et al. (2018) Y. Honda et al., Phys. Rev. Lett. 121, 184801 (2018).
- Inoue et al. (2008) Y. Inoue et al., Phys. Rev. ST-AB. 11, 062801 (2008).
- Siegman (1986) A. Siegman, University Science Books (1986).
- Scully and Zubairy (1991) M. O. Scully and M. S. Zubairy, Phys. Rev. A. 44, 2656 (1991).
- King (1950) A. P. King, Proceedings of the IRE , 249 (1950).