Asymmetric mid-plane gas in ALMA images of HD 100546
Abstract
In this paper we present new ALMA observations towards the proto-planet hosting transitional disc of Herbig Ae/Be star HD 100546. This includes resolved 1.3 mm continuum, 13CO and the first detection of C18O in this disc, which displays azimuthal asymmetry in regions spatially coincident with structures previously identified in HST images related to spiral arms. The lower limit on the mass of the dust disc is calculated to be 9.6 M⊙. A firm lower-limit on the total gas mass calculated from optically thin, mid-plane tracing C18O (2-1) emission is 0.018 M⊙ assuming ISM abundances. These mass estimates provide an estimate of gas-to-dust ratio in the disc of 19, the ratio will increase if C18O is relatively under-abundant in the disc compared to CO and H2. Through deprojection and azimuthal averaging of the image plane we detect 1.3 mm continuum emission out to 29010 au, 13CO to 39010 au and C18O to 300 au. We measure a radially increasing millimetre spectral index between wavelengths of 867 m and 1.3 mm, which shows that grain sizes increase towards the star, with solid particles growing to cm scales in the inner disc.
keywords:
protoplanetary discs – techniques: interferometric – stars: pre-main sequence1 Introduction
Interferometric observations at millimetre and sub-millimetre wavelengths often reveal millimetre-sized particles in the outer regions of Herbig and T-Tauri discs. Radial drift timescales for particles in the outer regions of the disc (100 au) are of order years, however disc lifetimes are of order years, meaning the particles in the outer disc should have already drifted onto the star. Retention of large grains in the outer disc, or alternatively some form of continuous replenishment, therefore seems to be essential in order to explain the observational data (Klahr & Bodenheimer, 2006; Birnstiel & Andrews, 2013). The consequences of mechanisms that concentrate disc material locally are now becoming frequently observed. Results from ALMA have revealed highly asymmetric, so called ‘lop-sided discs’ such as SAO 206462 and SR 21 (Perez et al., 2014), IRS 48 (van der Marel et al., 2015) and HD 142527 (Casassus et al., 2015). Radial gas pressure bumps can also result in dust traps that form symmetric, concentric rings in the dust disc (Pinilla et al., 2012b; Dullemond et al., 2018).
Continuum emission at mm-wavelengths is also a diagnostic tool for tracing the dust in a protoplanetary disc, specifically the coolest dust contained in the mid-plane and in the outer disc, where the majority of solid mass is expected to be contained. Measured flux can be related to the mass of emitting particles by assuming optically thin emission and using
| (1) |
where Fν is the continuum flux measured at frequency , is the specific opacity and D is the distance to the source from the observer. Continuum emission also depends on particle size; millimetre continuum emission comes most efficiently from a narrow range of grain sizes between 1mm and 1cm (Takeuchi & Lin, 2005). If grains have grown beyond , where is the wavelength of observation, they emit less efficiently (Draine, 2006). Radial drift and grain growth predict the largest solid particles to be concentrated toward the star, leaving the smaller ones behind. As emission brightness is related to grain size we can therefore expect a variation in observed disc size at different observing wavelengths, but also a variation in spectral index, , across the disc. Spatially resolved continuum images of discs at multiple wavelengths allow for a calculation of a position-dependent , where, for optically thin emission, S (e.g. HD 163296, Guidi et al. 2016). Surveys of star forming regions find that disc-averaged spectral indices can lie in the range 1.5 3.5 (Ricci et al., 2012; Pinilla et al., 2014). If the size of grains in the disc varies with radius, then so will the spectral index.
Draine (2006) computed the frequency dependent opacity of different grain size distributions. A calculation of the opacity index , where , between two spatially resolved observations at different frequency can therefore provide a quantitative estimate as to how large grains have grown in different parts of the disc by a comparison to the calculations of Draine (2006). values evolve with grain growth; 1.5-2 is associated with the ISM (Mathis et al., 1977), and for the vast majority of disc masses, these ‘lower’ values of are likely to be as a result of grain growth rather than other potential explanations such as optically thick emission (Ricci et al., 2012).
In order to calculate a reliable total mass of the disc we must have a robust gas mass measurement (Williams et al., 2014) as well as one for the dust. The mass of the dust disc is canonically related to the gas mass by an empirical ratio taken from the ISM; g/d (gas-to-dust ratio) = 100. Modelling of gas emission has increasingly suggested this may not be the case however. A complication is that modelling of the gaseous spectral lines is generally degenerately sensitive to g/d - that there is no unique g/d that satisfies the observations (Bruderer et al., 2012; Boneberg et al., 2016). Using ALMA data, a recent survey of the Lupus star forming region gives evidence that supports low observed g/d in protoplanetary discs; Miotello et al. (2017) find that 23 out of their 34 discs with gas and dust detections have g/d < 10. Chemical reprocessing can leave CO depleted in discs, with CO locked into larger icy bodies (Du et al., 2015) or converted into complex molecules (Kama et al., 2016; Yu et al., 2016). The carbon chemistry that controls the abundances is highly sensitive to the temperature profiles of the dust within the disc (Reboussin et al., 2015).
A complication for inferring gas properties such as the total mass is that gas emission is typically either optically thick or requires high sensitivity to detect. In this study we observe C18O, a less optically thick alternative to other CO isotopologues (Van Zadelhoff et al., 2001; Dartois et al., 2003). The trade-off here is that high sensitivity is required to detect a molecule much less abundant than other gas tracers. For example in the ALMA survey of Lupus, Ansdell et al. (2016) detect C18O (3-2) emission in 11 out of their 89 targets with integrations of between 30-60 seconds per source. Detection rates are higher for intermediate mass Herbig stars, where the brighter star supports a warmer disk meaning more C18O is found in the gas phase. To date there is only a handful of C18O detections in the discs of Herbig stars, including MWC 480 (Guilloteau et al., 2013), HD 169142 (Panić et al., 2008; Fedele et al., 2017), HD 163296 (Rosenfeld et al., 2013) and AB Aur (Pacheco-Vazquez et al., 2016). When the optically thin C18O and other isotopologues are observed it permits us to compute the CO disc mass and temperature. Emission from C18O traces the dense disc mid-plane (Van Zadelhoff et al., 2001; Dartois et al., 2003), where we expect grain growth and the formation of giant planets. Resolved detections of emission from this molecule will therefore allow us to study a part of the disc that is crucial for planet formation.
Much recent work has focused on transition discs. Transition discs are a class of protoplanetary discs that have a lesser flux in the mid-IR due to the opening of a gap or cavity in the inner disc which is generally explained by some combination of mechanisms such as grain-growth (Tanaka et al., 2005), photo evaporation (Owen, 2016; Ercolano & Pascucci, 2017), clearing by a forming exoplanet or binary companion (Baruteau et al., 2014; Price et al., 2018) and dead-zones (Dzyurkevich et al., 2010). This clearing eventually leads to gas-poor, optically thin, debris discs (Espaillat et al., 2014; Wyatt et al., 2015). There is now an increasing number of observational examples of resolved inner cavities of transition discs (Williams & Cieza, 2011; van der Marel, 2017; Pinilla et al., 2018). Characterising the distribution of gas and dust in such systems may be able to shed light on how this transition occurs.
In this paper we present new ALMA observations towards Herbig Ae/Be star HD 100546 in order to characterise the dust and gas in its disc. In the next section we briefly review recent and related published work on HD 100546. In Section 3 we describe the data taken and then present the initial results and measurements in Section 4. In Section 5.1 we calculate the gas and dust mass in the disc and assess apparent asymmetry in the interferometric images produced. We use the deprojected, azimuthally averaged flux profiles to determine the radial extent of the emission for each of the observed tracers and calculate to infer levels of grain growth. Our main results are summarised in Section 6.
2 HD 100546
This study focuses on a fascinating example of planet formation; the well-studied disc around Herbig Ae/Be star HD 100546. The star is located at a distance of 110pc (Lindegren et al., 2018) with a mass reported by van den Ancker et al. (1997) of 2.4 M⊙ from pre-main sequence (PMS) track fitting and more recently 1.9 M⊙ by Fairlamb et al. (2015) derived through X-shooter spectroscopy and PARSEC PMS tracks (Bressan et al., 2012). Although previously thought to be as old as 10Myr (van den Ancker et al., 1997), Fairlamb et al. (2015) calculate an age for the star of 7.021.49 Myr and using the updated parallax from GAIA data release 2, Vioque et al. (2018) find a younger age of 5.5 Myr.
2.1 Evidence for proto-planet(s)
The system has been long associated with active planet formation and so is well studied. A protoplanet has been confirmed at 50 au via direct imaging (Quanz et al., 2015) and there has been some evidence of an inner companion as well. This includes SED modelling and mid-IR interferometry (Mulders et al., 2013; Panić et al., 2014) , ALMA observations (Walsh et al., 2014) , near IR spectroscopy (Brittain et al., 2013, 2014) and a point source in GEMINI Planet Imager (GPI) data at 10 au (Currie et al., 2015) support the potential HD 100546‘c’. However this predicted companion has alluded detection in more recent GPI and Magellan Adaptive Optics System observations by Follette et al. (2017). The position of the potential inner companion coincides with the position of the rim of the inner gap at au, interior to which is a small inner dust disc of 0.7 au (Panić et al., 2014) and a recently detected bar-like structure reaching across the inner gap in both continuum and H emission (Mendigutía et al., 2017).
2.2 Structure in the disc
Observing with ATCA, 7mm continuum emission can be fit by a Gaussian with FWHM between 50 and 60 au (Wright et al., 2015), and the authors assert that grains in the disc are well-processed and have grown as large as 5cm and possibly further. Walsh et al. (2014) are able to detect a significant amount of weak, extended continuum emission beyond this and find a best-fit model for the dust in the uv plane comprised of two rings with a Gaussian profile; one centred at 26 au with a FWHM of 21 au and one at 190 au with FWHM 75 au. Pineda et al. (2014) find that mm-sized grains are trapped within a similar inner ring and note brightness asymmetries in the dust between the South-East and North-West of the disc. All three of these studies at (sub-)millimetre wavelengths favour arguments of at least one giant planet orbiting within the disc. The disc does not appear to be axi-symmetric; scattered light studies routinely observe multiple asymmetric features and spiral arms within the dust disc (Garufi et al., 2016; Follette et al., 2017), including a ‘dark lane’ observed by Avenhaus et al. (2014) in the same direction as the horse-shoe shaped asymmetry identified in 7 mm images of (Wright et al., 2015). The exact nature of this asymmetry at millimetre wavelengths has until now remained largely undefined.
The gas in the disc is much more spatially extended than the dust, CO has been measured out to 400au (Walsh et al., 2014). Very little is known about the gas mass of this uniquely interesting disc due to a lack of data observing optically thin gas lines. Gas mass calculations based on optically thick 12CO emission can lead to underestimations of as large as two orders of magnitude in comparison to those using optically thin CO isotopologues (Moór et al., 2011; Miley et al., 2018).
3 Observations & Data Reduction
We present new ALMA observations of HD 100546 with band 6 receivers across 4 unique spectral windows (SPWs); project ID 2015.1.01600.S, PI: O. Panić. The two continuum windows, SPW0 and SPW1, both contain 128 channels of width 15625 kHz to give a total bandwidth of 2 GHz, SPW0 has a central frequency of 232 GHz, with SPW1 at 234 GHz. SPW2 contains 1920 channels of width 61.035 kHz, which at central frequency 220398 MHz gives resolution of 0.083kms-1 for the window containing the 13CO (2-1) emission line. The C18O (2-1) line is in SPW3, this window has 3840 channels of 0.166 kms-1 at central frequency 219560 MHz. Observations were made on the 28th March 2016 for a total time of 625s on source, employing 43 antennas with a baseline range of 15-460 metres giving a maximum angular scale of 106. The flux calibrator was J1107-4449 and the phase calibrator was J1136-6827, the latter is found at the position 11:36:02.09787 -68:27:05821, which is (022, 173) degrees offset from the target.
Calibration and reduction was carried out using casa version 4.7.0. and imaging was performed using casa tasks and the clean algorithm (Rau & Cornwell, 2011). Line free continuum channels were used to construct image models to be used for self-calibration, the solutions were then applied to all channels. After applying self-calibration, images were created with briggs weighting and robust=0.5, giving a synthesized beam of 105 x 077, P.A. = -20∘ for the continuum image. Source emission is contained within the inner third of the primary beam and so primary beam correction was not applied to images. Data cubes were created for the line emission by subtracting the continuum from SPWs containing the line emission using casa task uvcontsub. Images of the lines have beam sizes of 108 x 082, P.A. = -19∘ for 13CO and 110 x 083, P.A. = -20∘ for C18O. Integrated intensity, from which fluxes are measured, and intensity weighted velocity maps were created with casa task immoments by summing all emission in channels containing significant (>3) signal; in the case of 13CO this corresponds to a range between -0.62 and 11.4 kms-1 and for C18O between -2.0 and 10.8 kms-1.
We also utilise archival cycle 0 ALMA observations of HD 100546 in band 7 (Project ID: 2011.0.00863.S, PI: C. Walsh), as described by Walsh et al. (2014). We re-reduce and image this data, applying self calibration as described above, to obtain continuum emission observed at a wavelength of 867m. The cycle 0 data used J1147-6753 as a phase calibrator, offset from the primary target by (12, 23). The continuum image has a synthesized beam of dimensions 095 x 042, 38∘. The minimum baseline of 21 m results in a maximum angular scale of 3.
4 Results
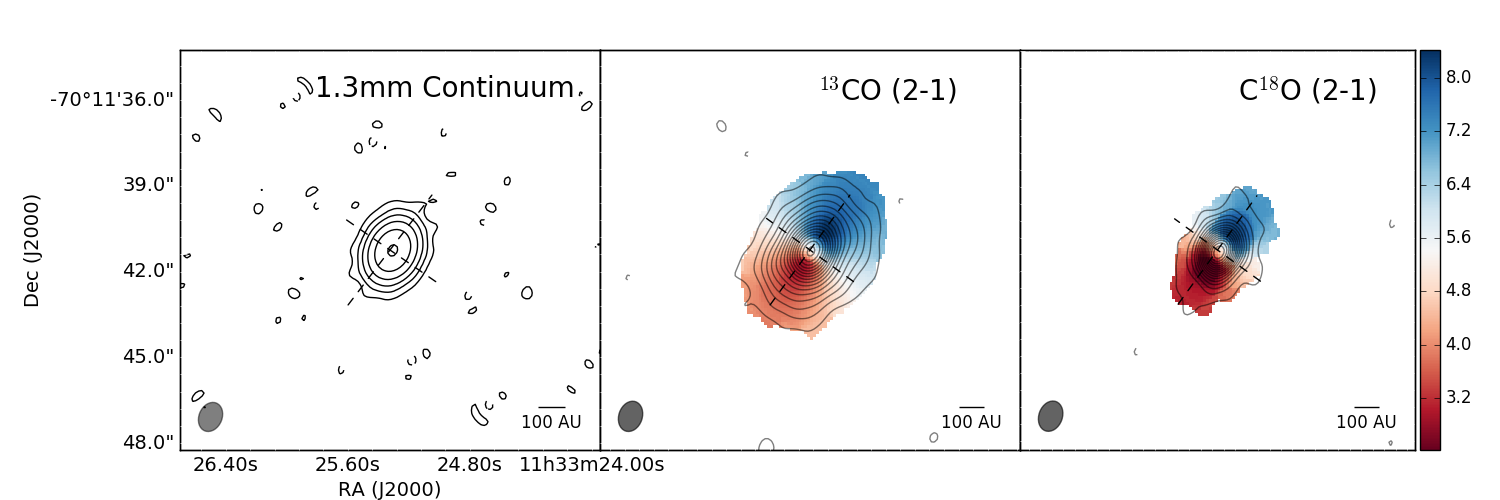
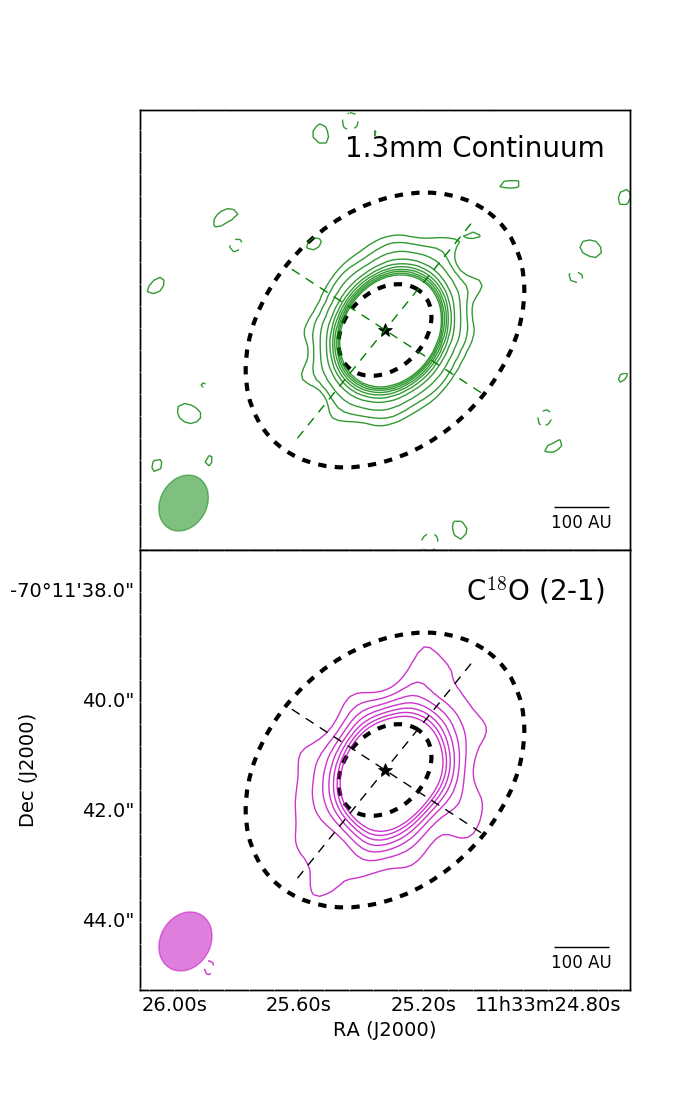
The integrated continuum flux in the 1.3 mm image of 492 mJy is measured with an image rms of 0.5 mJy/beam. The 13CO (2-1) integrated flux is measured at 12.872 Jy kms-1 and the first detection of C18O in the disc gives an integrated flux of 2.948 Jy kms-1 for the (2-1) transition, with rms noise 0.033 Jy/beam kms-1 and 0.027 Jy/beam kms-1 respectively. The 2 contour reaches a maximum separation of 25 in the 1.3 mm image, 36 in 13CO and 30 in C18O. We discuss asymmetry and the radial extent of the emission maps thoroughly in Section 5.2.
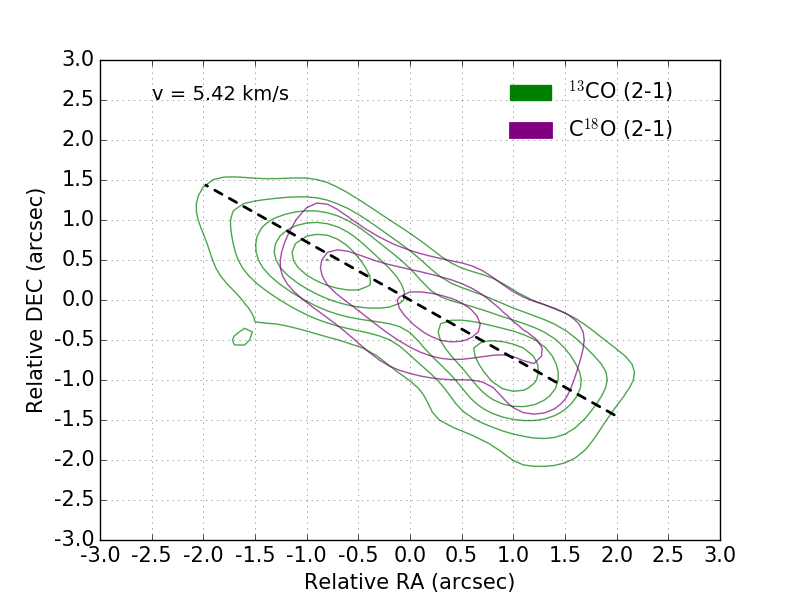
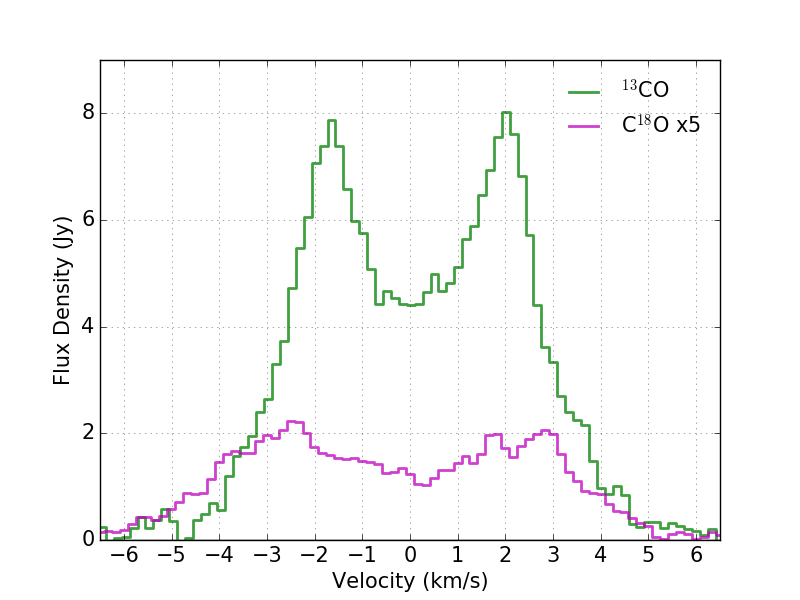
To find a position angle for the source we use the data cubes from the CO isotopologue emission to identify the minor axis of the disc. We find the minor axis by locating the channel at the systemic velocity of the source, identified by the symmetry of the map as here it will show no Doppler shifting. Channel maps show the minor axis of 13CO in the channel at 5.510.08 kms-1 and for C18O at 5.330.17 kms-1. We adopt an average of these two velocities as from this data set, giving 5.42 kms-1, shown in Figure 2 along with the minor axis channel of each isotopologue. This average is consistent with the two determined from the channel maps within the uncertainties (which we assume to be represented by the channel widths). Figure 3 plots the observed spectrum of each of the two lines. Both lines display a double peaked spectrum, where each of the C18O peaks is broader than the peaks of 13CO. The mid-point of the 13CO spectrum is consistent with the average . The mid-point of the C18O spectrum is harder to determine due to its shape. The local minimum at the centre of the double peak profile is offset from the adopted by 0.33 kms-1. Walsh et al. (2014) constrain a system velocity of 5.7 kms-1 from their ALMA observations of 12CO.
The orientation of the disc minor axis is used to determine the position angle of the disc. We use our constrained position angle as an a priori estimate for a Gaussian fit of the data, in order to determine the inclination of the source. Any asymmetry in the emission map will influence the fitting of a Gaussian, by using this observationally determined a priori estimate for position angle, we can ensure our fitted inclination is more accurate.
For 13CO this method gives a position angle of the major axis, measured East of North, of and for C18O, . The average value of the two is which we adopt henceforth. Uncertainties give the variation in position angle when measured from the adjacent spectral channels. Keeping this position angle fixed, we then fit an elliptical Gaussian to each of the CO isotopologue integrated emission maps to determine inclinations of and for 13CO and C18O respectively. We adopt an average inclination of for all further analysis.
These values are consistent with most reported position angles from previous sub-mm observations of the disc with ALMA; Walsh et al. (2014) find a position angle of 146 and inclination 44, whilst Pineda et al. (2014) find 145.14 and 41.94. Panić et al. (2014) observed the disc with the MID-infrared Interferometric instrument (MIDI) on the VLT and find a position angle of 145, their inclination is considerably higher however because their observations probe the inner wall of the disc at 11 au. There is growing evidence for a warp in the disc (Quillen, 2006; Panić et al., 2010; Walsh et al., 2017) which would cause inclination to deviate radially.
Asymmetry in the 12CO line profile is detected in both APEX and ALMA observations (Panić & Hogerheijde, 2009; Walsh et al., 2017). Images of the ALMA observations of 12CO achieve a synthesizing beam of 0x038 (Pineda et al., 2014). We do not detect this asymmetry in the less abundant 13CO or C18O lines, finding instead double peaked line profiles symmetric to within uncertainties (Figure 3). 12CO emission traces higher scale heights in the disc, meaning that the asymmetry could be restricted to the upper vertical layers of the disc. There already exists evidence for asymmetry of the disc surface in the scattered light images that identify spiral arms and other structures (Ardila et al., 2007; Avenhaus et al., 2014; Garufi et al., 2016; Follette et al., 2017). The APEX observations have a larger beam and therefore the results may be affected by the extended envelope of the disc as detected by scattered light as far as au (Grady et al., 2001; Ardila et al., 2007).
We adjusted the GAIA data release 2 (2018) position of HD 100546 for proper motion between the dates of the ALMA and GAIA observations, giving a position of 11h33m25.3209s -70d11m41.2432s, within an accuracy of (0.04, 0.05) mas (Lindegren et al., 2018). We find that the centre of emission for each of the tracers we observe is offset from this position.
| Coordinates of best | Offset from Stellar | |
|---|---|---|
| fitting model | Position ("), P.A. | |
| Cont. (Im.) | 11:33:25.305 -70.11.41.258 | 0.082, 79∘ |
| 13CO (Im.) | 11:33:25.310 -70.11.41.291 | 0.073, 49∘ |
| C18O (Im.) | 11:33:25.305 -70.11.41.300 | 0.098, 55∘ |
| Cont. (uv) | 11:33:25.305 -70.11.41.257 | 0.082, 80∘ |
| 13CO (uv) | 11:33:25.308 -70.11.41.276 | 0.072, 63∘ |
| C18O (uv) | 11:33:25.300 -70.11.41.280 | 0.110, 71∘ |
Table 1 gives the coordinates of the centre of emission for the continuum and CO isotopologues, accompanied by its offset from the GAIA coordinates. A 2D Gaussian is fitted to the emission maps in Figure 1, the positions of these fits are taken to be the centre of emission. We also undertake a similar analysis, this time fitting a uniform, elliptical disc geometry in the uv plane using CASA task uvcontsub. We repeat this for each tracer, giving the position of the best-fit disc model in Table 1. The benefit of uv-analysis is that it avoids being misled by spurious artefacts that can be introduced into images during the image reconstruction process. In each case the uv-fitted position is very similar to that determined in the image plane. The uniform-disc fits give a position angle of 146∘ and inclination of 42∘, values which are within a few degrees of those we constrain above, and those from previous ALMA observations (Pineda et al., 2014; Walsh et al., 2014).
The uncertainty in an astrometric position in an ALMA image depends on a number of factors, which we address here. The signal-to-noise based target position-fitting error is 1.3 mas. This is consistent with the ALMA technical handbook Section 10.6.6 . The dominating factor in positional uncertainty is introduced when the phase corrections are transferred from the phase calibrator to the target. The phase calibrator is 1.7 degrees in separation from HD 100546, and from the phase drift between scans we estimate an total uncertainty on the astrometric position of 10 mas. This is relatively low as a result of a stable phase in the observations. Other factors such as antenna position errors can degrade astrometry; the ALMA technical handbook cautions that with reasonable phase stability, positional accuracy is 1/20 of resolution, which in this case would correspond to a maximum of 50 mas. We adopt this greater value of 50 mas as a conservative uncertainty on coordinate positions in the image. Each of the best-fit centres of emission in Table 1 have a separation from the central star that exceeds the 50 mas uncertainty in ALMA image positions. An offset of emission from the stellar position may indicate an over-density of disc material towards one side of the disc. We discuss asymmetry in the disc in more detail in Section 5.2.1.
5 Analysis and Discussion
5.1 Disc Mass
5.1.1 Dust Mass
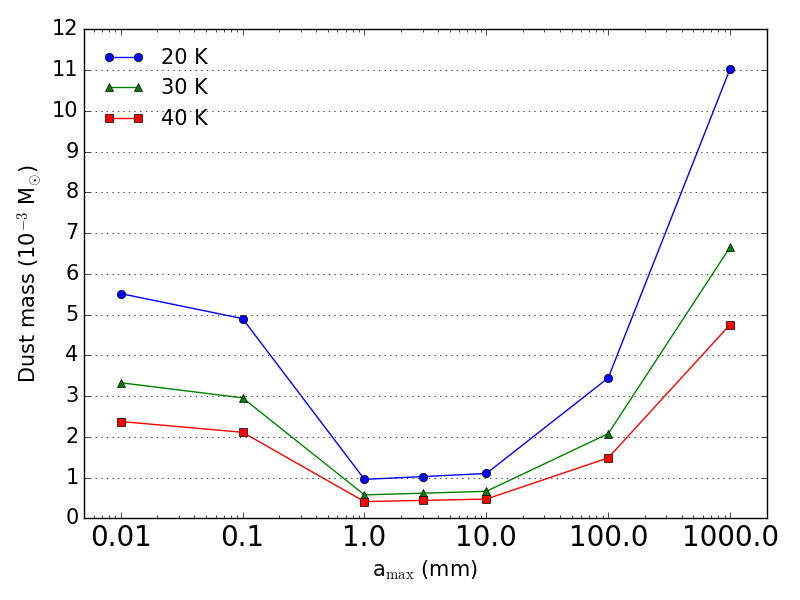
We measure the flux within a 3 contour of the 1.3 mm continuum image. The opacity depends on the maximum grain size, for which we only have loose constraints. A minimum dust mass estimation can be made by assuming a dust grain size distribution (Mathis et al., 1977). Assuming a maximum grain size = 1 mm yields = 1.15 (Draine, 2006). Mid-plane temperature of the dust is difficult to constrain from observations, however we can get a firm handle on the mid-plane disc mass by assuming a sensible temperature range for this dense, cool environment, we therefore adopt a range of 20K – 40K. In this transition disc, gas and dust are likely to be well coupled, and our strong gas line detections suggest that the disc temperature must be over the CO freeze-out temperature of 20 K. Herbigs host more luminous, warmer discs than their T Tauri counterparts, and so the temperature is likely to be above this 20 K lower bound. We adopt an upper bound of 40 K. In the radiative transfer models of A type stars by Panić & Min (2017), gas mass in the disc must be increased by over two orders of magnitude to increase mid-plane disc temperatures from 20 to 40 K at short separations from the star, and so we consider this to be a generous upper limit.
Using Equation 1 with the assumptions above, this gives a minimum total dust mass of 4.1M⊙ for = 40 K, and 9.6M⊙ for = 20 K. In Figure 4 we show how this dust mass can vary with mid-plane temperature or if the assumed level of grain growth varies, thereby changing and the emissivity of the dust. Between = 1 mm and 10 mm, the most likely values in a protoplanetary disc at this stage of evolution, the masses remain almost constant and are less sensitive to temperature. This indicates that for reasonable assumptions of and mid-plane temperature, the dust mass is 10M⊙.
The mass range calculated is comparable with the estimate of Wright et al. (2015) who employ the accretion disc models of d ’Alessio et al. (2005) to find Mdust of order 1.0M⊙. Repeating the calculation above using instead the ALMA measured flux at 867m from Walsh et al. (2014) with a temperature of 30K and = 1 mm, a disc mass of 0.7M⊙ is found, similar to the results between 1mm and 10mm in Figure 4.
This is more massive than most discs around low-mass stars, which fall in the range (Manara et al., 2018). This dust mass is also at the higher end of the range found for Herbig Ae stars (Panić at al., in prep). Given the age of the star this is quite exceptional, suggesting a prime object to study longevity of dust in discs.
5.1.2 Gas Mass
From the integrated line flux of C18O above 3, assuming optically thin emission and local thermodynamic equilibrium, we calculate the total gas mass similarly to Hughes et al. (2008); Matrà et al. (2015); White et al. (2016),
| (2) |
where F21 is the integrated line flux, is the rest frequency of the transition, d the distance to the source, m is the mass of the CO molecule, is the appropriate Einstein coefficient, and is the fractional population of the upper level. We adopt ISM fractional abundances for CO and its isotopologues, specifically CO/H, and then adopt the relative fraction of C18O in the ISM, CO/C 550 (Wilson & Rood, 1994). A gas mass is calculated in this way over a range of temperatures. The minimum gas mass was calculated with a temperature of 20 K, giving a minimum disc gas mass of 0.018 M⊙. This estimated gas mass is around 1% of the stellar mass, corresponding to around 18 Jupiter masses. For comparison, in an ALMA survey of Lupus, most low-mass discs have a gas disc mass of . The gas mass found here is large even for Herbig stars, where the majority have discs within the range (1-10) when calculated from mid-plane tracing CO isotopologues (Panić at al., in prep). HD100546 therefore appears to still possess enough disc mass to form Jupiter mass planets, a very significant amount for a disc that has reached the transition disc stage of its evolution and shows detections of active planet formation (Quanz et al., 2015).
The calculated gas mass assumes ISM abundances of C18O relative to CO. Isotope-selective photodissociation can alter these ratios significantly in some discs, which can lead to underestimates of disc mass by up to an order of magnitude (Miotello et al., 2014). The CO line luminosities we measure in this data are unable to conclusively determine the extent of any isotope-selective photodissociation when compared to the the models of (Miotello et al., 2016), and so our calculation represents a lower limit. Carbon freeze-out beyond the snowline can also result in low measured gas masses; T Tauri discs appear to have significant levels of carbon freeze-out, for example in TW Hya (Schwarz et al., 2016). Herbig discs such as HD 100546 on the other hand remain warmer for a greater radial extent due to the more massive host star (Panić & Min, 2017). This pushes the CO snowline to a larger radial separation allowing a larger amount of carbon in the disc to remain in the gas phase. In the disc of HD 100546 we do not expect freeze-out to play a significant role. Fitting physical-chemical models to observations, Kama et al. (2016) find that within the disc of TW Hya, C and O are strongly under-abundant, whereas in HD 100546, the depletion of gas-phase carbon appears quite low.
In light of the discussion above, our calculated gas estimate represents a firm lower limit, but a very large one in comparison to other Herbig discs. The gas mass estimated here is similar to that achieved through line modelling of another bright Herbig disc, HD 163296 (Boneberg et al., 2016), and shows there is still a large budget remaining in the disc for giant planet building in comparison to discs that are in a more advanced stage of their evolution towards a debris disc, e.g. HD 141569 (White et al., 2016; Miley et al., 2018).
5.1.3 Gas To Dust Ratio
Taking the dust mass calculated with =20K and the minimum gas mass calculated at the same temperature, we calculate a g/d for HD 100546 of 19. Low g/d (< 100) is observed in the majority of sources in recent surveys of discs in star forming regions (Ansdell et al., 2016; Long et al., 2017). Studies of individual Herbig discs suggest g/d is generally low in these larger, brighter discs too (Meeus et al., 2010; Boneberg et al., 2016). The g/d affects disc evolution because gas dynamics dominate the behaviour of the dust in gas-rich protoplanetary discs. The uncoupling of these two populations when gas densities drop sufficiently low is a signpost for the transition to a debris disc.
Low observed g/d can mean a great amount of gas has been lost, or it can be the result of carbon depletion in the disc through sequestration into large icy bodies or the conversion of CO into more complex molecules. This ratio is indicative only of regions within the CO snowline where freeze out is avoided. In the similar Herbig disc HD 163296 the snowline is calculated to be at around 90 au (Boneberg et al., 2016), in cooler discs the snowline will be at a lesser separation, e.g. TW Hya, 40 au (Schwarz et al., 2016).
5.2 Disc Asymmetry
5.2.1 Evidence in ALMA Images
Asymmetry in the disc has previously been reported with evidence in asymmetric 12CO line profiles (Panić & Hogerheijde, 2009), horse-shoe structures in cm-wavelength observations (Wright et al., 2015) and the identification of multiple scattered light features (e.g. Ardila et al., 2007; Garufi et al., 2016; Follette et al., 2017). Asymmetric features can form in the disc as a result of mechanisms such as planet-disc interactions (Baruteau et al., 2014), interactions between binary companions (Price et al., 2018) or particle traps within the disc (van der Marel et al., 2013; Van Der Marel et al., 2016). Such features are therefore particularly interesting in a disc such as that of HD 100546 which is known to host an embedded protoplanet, and exhibits a range of observed structures across different spatial scales.
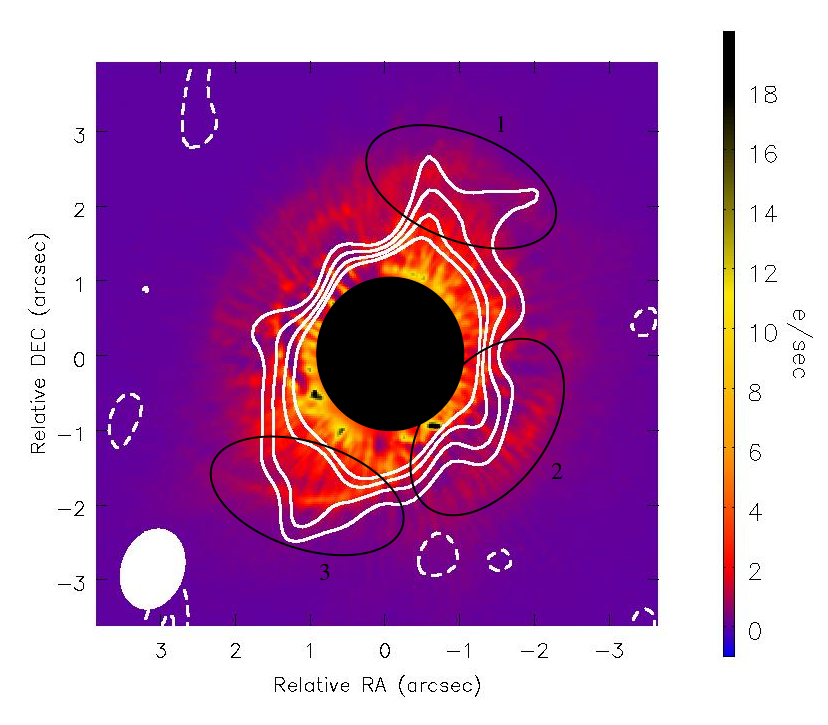
In the data presented here we see a striking match with the extended emission in the C18O map and the structures in HST scattered light observations of the disc. The low-level bulges in C18O emission (Figure 5) persist in images created using different weighting parameters in the image reconstruction process, and are present both before and after applying self-calibration. Using the Advanced Camera for Surveys (ACS) on board the Hubble Space Telescope (HST) Ardila et al. (2007) identify 3 structures in the outer disc which are attributed to the known spiral arms in the disc. The authors name these structures 1, 2 and 3 and we adopt this convention here as well. Figure 5 displays the HST image in the F435W band presented by (Ardila et al., 2007). Each of the low-level bulges in the extended C18O (2-1) emission is found in the same region of the disc as one of the 3 scattered light structures. This provides tentative evidence of a mid-plane gas equivalent to the scattered light features. The C18O emission is optically thin, and can therefore be interpreted as an increase in local mid-plane density. An increased local gas density will increase the scale height of the disc, the subsequent elevation of small particles towards the scattering surface will result in a stronger scattered light flux, as we see in the HST data. The C18O emission bulges towards the outer disc may therefore be signalling the mid-plane density features that correspond with the disc’s spiral arms. In this section we make a general analysis of any observational evidence for asymmetry in the disc, within the limits of the angular resolution of our ALMA observations.
In Section 4 we accurately measure the inclination and position angle, both of which are very close to values derived from previous sub-millimetre ALMA observations of the disc (Pineda et al., 2014; Walsh et al., 2014). We take this geometry to construct an ellipse with a semi-major axis equivalent to 100 au in the disc. We can make an initial visual assessment of asymmetry in the disc by plotting this ellipse over the emission maps in Figure 1 centred at the stellar position. The mid-plane tracing 1.3 mm continuum and C18O (2-1) emission in particular show evidnece on an offset disc in Figure 6, on scales larger than that the offsets listed in Table 1. In both panels we omit high level contours internal to the inner ellipse for clarity. Towards the northwest in the panels of Figure 6, the 75 contour (in the 1.3 mm image) and the 15 contour (C18O) overlap with the 100 au ellipse, whereas to the southeast there is a significant offset. C18O in particular shows azimuthal asymmetry in the outer disc, with low level emission extending much outward as previously highlighted in Figure 5.
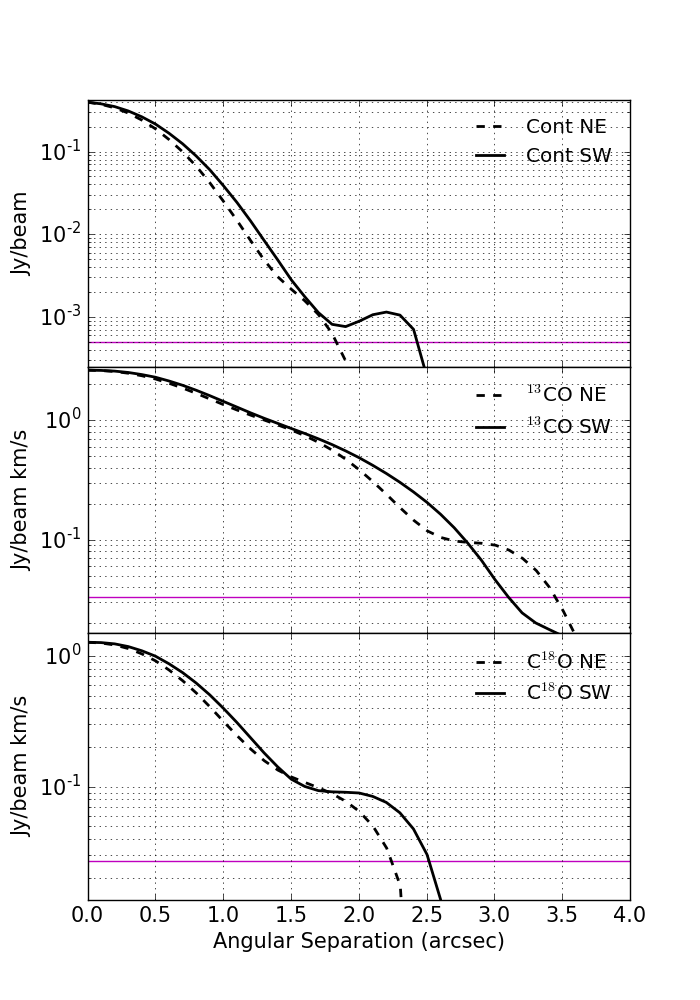
The largest asymmetry in the disc is along the minor axis (Figure 6) with the brighter region found towards the position of Structure 2 in Figure 5. We can also see this in Figure 7, which shows slices from the emission maps taken along the minor axis in both directions, centered at the stellar position.
C18O (bottom panel) is brighter in the southwest for the majority of the disc, and emission extends further by 03 in comparison to that in the northeast. In the continuum (top panel) the southwest side is brighter than the northeast throughout the disc. The greatest difference between the two sides is at an angular separation of 07, where the southwest is brighter by 50. A low-level bump in the continuum emission just beyond 20 occurs at the same radial location as the extended C18O emission and scattered light emission in Figure 5. 13CO emission (middle panel) is also brighter in the southwest for as far as 8, beyond which the northeast of the disc is brighter.
5.2.2 Comparison to previous asymmetries in HD 100456
Figure 5 displays how the low-level, extended emission towards the edge of the gas disc is spatially coincident with structures identified by Ardila et al. (2007), potentially linking observed scattered light features with the mid-plane gas above which the small, scattering grains are suspended. In other scattered light observations, Avenhaus et al. (2014) see a dark lane that extends from along the minor axis. The authors attribute this to effects due to the polarised scattering function, rather than any physical feature in the disc. However Wright et al. (2015) also observe an arc of millimetre emission in the same direction, at the same separation as the scattered light dark lane, but not quite as extended.
Mid-IR interferometry is able to resolve the inner disc, where asymmetry is found close to the inner gap of the disc at 9 au (Panić et al., 2014). Features in the the inner disc can have a strong effect on the outer disc. For example there has been recent evidence of warps from ALMA observations, e.g. this disc (Walsh et al., 2017) and T Tauri star AA Tau (Loomis et al., 2017). A warp of the inner disc can lead not only to shadowing of the outer disc but potentially even a break of the disc into two distinct planes. Substructure can then develop as a result of this geometry; a misaligned disc can result in shadows that create asymmetric illumination of the disc, whilst a ‘broken’ disc can contain dust streamers that cross gaps in the disc (Dutrey et al., 2014; Loomis et al., 2017). Recent very high angular resolution (0) ALMA observations of the disc resolve the very inner regions of the disc, revealing an asymmetric circumstellar ring in the continuum, brightest towards the North East (Pineda et al., 2018). The authors attribute this asymmetry to another scattered light spiral feature, this time identified by SPHERE (Garufi et al., 2016), on angular scales much less than that of the synthesized beam achieved in the observations presented here.
Many of these features can arise through interactions with a central companion as shown by 3D hydrodyanamic simulations of the transition disc HD 142527 (Price et al., 2018), this is particularly interesting in regard to any asymmetries found in the HD 100546 disc when bearing in mind the evidence found in recent years for a further companion at smaller separation.
5.3 Asymmetry Analysis
Asymmetry in the surface brightness of the gas emission can occur from increased temperature, increased density or a combination of the two.
In 3D hydrodynamic simulations, spiral arms launched by planets observed at 1.3 mm have been shown to induce azimuthal variation in gas surface density of approximately 50-60% (Juhász & Rosotti, 2018), and should also be observable in optically thin gas observations. In this scenario, a large spiral arm could increase gas density locally, thereby elevating the scale height of micron-sized grains to produce the scattered light features. Alternatively a local density increase of 30% over a length scale disc scale height is enough to provide the conditions for dust trapping of larger particles in the outer disc (Pinilla et al., 2012a). Another explanation for local increase in density is a gravitationally unstable disc, where clumping occurs due to gravitational forces if the free fall time scale is short compared to sound speed crossing time scales and shearing time scales (Toomre, 1964). This is generally found in discs at an earlier stage in their evolution whilst discs are still very massive ), which is not the case here.
Brightness asymmetry can also result from varying temperature in the disc. Azimuthal variation in disc temperature may result from an inner warp that obscures sections of the disc or azimuthal variation of density.
5.3.1 Density Scenario
In this scenario we assume that the difference in observed brightness is due solely to changes in gas density. We split each half of the disc, bisected along the major axis, into three 60∘ degree segments and sum the flux in the segment. By calculating the brightness ratio between two segments on opposite sides of the disc, we can calculate the increase in surface density required to produce the difference in flux. The intensity of integrated line emission is given by
| (3) |
where AJ,J-1 is the Einstein coefficient for spontaneous emission from level J to level J-1, and N(J) is the column density in a specific level. The intensity is therefore proportional to the density of molecules in the N(J) level.
The largest brightness difference is between the two segments along the minor axis; the southwest is brighter than the northeast by a factor of 1.100.15 . The asymmetry identified in Section 5.2.1 is most obvious in the outer disc. We also compare the brightness ratio of the outer disc, we do this in the same fashion, except only summing the emission beyond a deprojected radius of 100 au. In this case, the brightness ratio is 1.270.18 . We are limited to comparisons that average over regions of the disc due to the angular resolution of our observations, but local density increases on smaller scales can alert us to certain physical mechanisms in the disc, some of which we discuss below.
Given the 10 resolution of the data, it is feasible that there are much larger azimuthal density variations for a given radial separation that are diluted by the beam. This might arise due to a local increase in density due to, for example, a spiral arm. Ardila et al. (2007) associate the three structures in Figure 5 with spiral arms, and it is towards each of these structures that the outer disc of C18O emission seems least symmetric.
From this data we cannot rule out the possibility of an unresolved vortex capable of trapping particles at large separation in the HD 100546 disc, as our density variation is similar to that predicted by Pinilla et al. (2012a). High resolution data across multiple wavelengths would help to identify any such feature (e.g. Cazzoletti et al., 2018).
Calculation of the Toomre parameter, Q, based on the radial profile of C18O rules out gravitational instability in the disc. Assuming C18O traces total disc mass, Q(R) for this disc reaches a minimum at 80 au confirming that the disc is stable against gravitational collapse. However a clump in the outer disc will experience relatively long orbital timescales, meaning it will take longer to break up. Fragments of the disc that were previously unstable might linger at the outer edges of the disc as they dissipate.
5.3.2 Temperature Scenario
To test the possibility of temperature variation as the cause of asymmetry in the outer C18O disc, we measure the average flux in different segments of the disc as in the previous section, and then calculate the temperature variation that would be required to reproduce such a flux difference. Through a comparison of the average fluxes in opposite segments, we can calculate the increase in temperature required if this was to be due to temperature alone (i.e. no density increase).
We calculate the column density of C18O gas in the J=2 level using
| (4) |
where T is the midplane temperature and Be is the rotation constant. The partition function, Z, is calculated using
| (5) |
Substituting for Z and N(J), Equation 3 becomes
| (6) |
Assuming a range of mid-plane temperatures, we then calculate T required to produce the observed brightness ratio of 1.27 from Section 5.3.1. We plot the results against the range of assumed mid-plane temperatures in Figure 8.
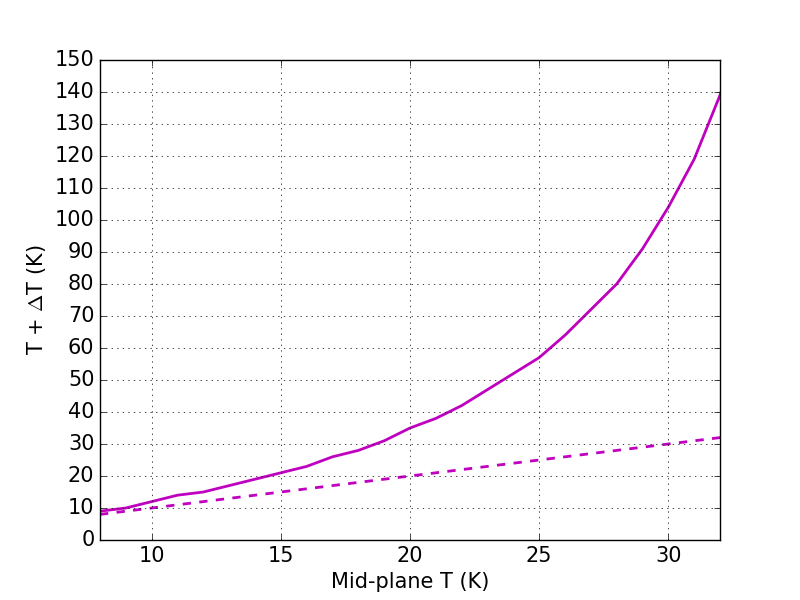
Figure 8 shows that even for a mid-plane temperature as cool as 20K (below which CO is no longer in the gas phase), a 75% increase in average temperature is required. From 24K and above, the average temperature of the outer disc mid-plane must increase by greater than 200%. There are no known physical processes expected within the disc mid-plane which could produce such a large change in temperature, especially when averaged over such a large proportion of the disc. If we were to assume that inner parts of the disc dominate the flux in each segment, temperatures may be larger than in the cool outer disc. However, the radiative transfer models of Panić & Min (2017) show that in reality an increase in disc temperature from 20 to 32K (comparable to the 20-35K increase in Figure 8), requires an increase in gas density of order 10, far greater than what we detect here. We can therefore rule out temperature as a sole cause of any flux asymmetry. In order to explain the difference in brightness between the two regions of the disc we must invoke some sort of density increase as well.
5.4 Radial Flux Profiles
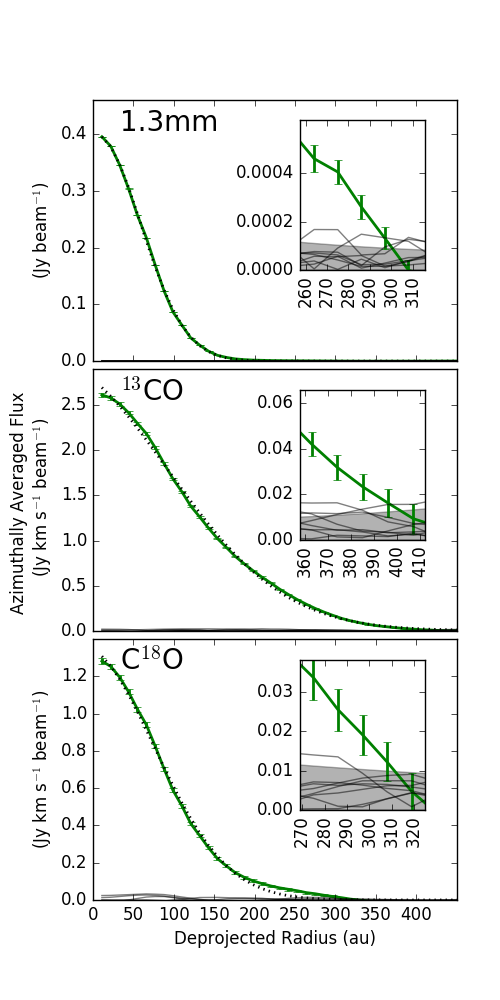
Ignoring azimuthal variations in disc emission, we can consider how the flux changes in the radial direction by de-projecting and then azimuthally averaging, around the mm continuum centre, the emission from images in Figure 1. The resultant average profiles are shown in Figure 9.
Taking advantage of the high signal to noise in the data we adopt the following method to obtain an accurate uncertainty estimate for the radial flux profiles.
Each image is averaged off-source in ‘empty’ sky locations at 45∘ position angle intervals at a separation that does not include any significant emission from the central source, but is also well within the primary beam. The resultant radial profile gauges the level of fluctuations due to background noise in that part of the image (shown as grey lines in Figure 9, more visible in the insets). The amplitudes of these fluctuations as a function of radius are fitted with polynomials, the polynomials are then averaged over the different off-source locations. The resulting final polynomial gives the average level of off-source fluctuations in the image as a result of the azimuthal averaging process. We use this for error bars on the average flux curve. Our method also allows for a determination of average outermost detection radius that does not rely on a pre-defined function or model, we take this to be the point at which the average flux becomes less than 2 times the average noise fluctuations at that radius; in Figure 9 this corresponds to the error bars reaching the grey shaded area.
Figure 9 plots the azimuthally averaged continuum flux and integrated line emission against deprojected radius (using inclination=43∘ and PA=144∘ as determined in Section 4). The 1.3 mm continuum for as far as an average, deprojected radial separation of 28611 au. The 13CO profile shows us that the gas in the disc is significantly more extended; detected as far out as 38511 au, a comparable distance to the 39020 au extent of 12CO in the disc reported by Walsh et al. (2014).
The less abundant molecule C18O is detected out to a shorter separation of 29711 au. Found at lower scale-heights, this molecule traces the cool, dense mid-plane Van Zadelhoff et al. (2001); Dartois et al. (2003) in which giant planets are expected to form.
A large amount of mass spread over large radial separations is important for planet formation in the disc. Giant planets grow more massive in discs of higher initial disc (gas) mass (Mordasini et al., 2012). Furthermore, population synthesis models show that significant amounts of giant planets migrate into the central star after formation (See review Mordasini, 2018). In order to survive, some cores accrete late in the disc lifetime and grow as they migrate inward (Baruteau et al., 2014). Our results suggest the disc of HD 100546 is well placed to support such late survivors, because a large amount of planet building material (18 MJ) still exists over a large region of the disc (297 au outermost detection of C18O). This is particularly relevant in the case of this disc, where a confirmed proto-planet lies towards the outer disc at a radial separation of 50 au (Quanz et al., 2015).
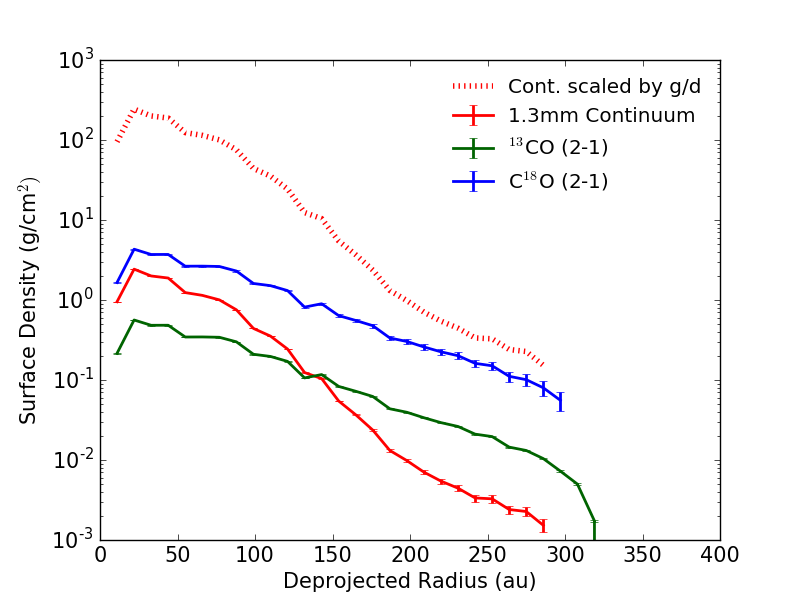
The difference in the outer radius at which the discs are detected may be a true physical difference, or could be as a result of the different sensitivity between the continuum and the line emission. We explore this by calculating surface density profiles for each tracer, which are plotted in Figure 10.
In Figure 10 we plot the surface density profile of each tracer in order to assess how it changes with radial separation. The 13CO curve represents a lower bound because the emission is optically thick for most of the disc. The continuum surface density profile is scaled by an assumption that g/d in the disc is the canonical value of 100, giving an upper bound with which we can compare to the gas. The profiles in Figure 10 tend to show a steady decline towards the outer disc, rather than a sharp fall that might signify a definitive outer edge of the disc.
The surface density of mm particles, as calculated from the 1.3 mm emission, is fairly large to begin with but begins to drop sharply after 100 au. The C18O surface density declines over the extent of the disc on the log scale in Figure 10, converging with the g/d scaled continuum curve. The mass calculations in Section 4 result in a disc g/d lower than 100. If values of <100 are used to scale the 1.3 mm surface density curve, in the outer disc C18O would soon have a greater surface density than the scaled dust, suggesting we have enough sensitivity in our gas line observations to confirm that the gas is more extended than the dust. Determining the outer radius of a disc in either gas or dust is complex, but Facchini et al. (2017) use thermo-chemical models to find that the observed difference between dust and gas disc radii is largely down to optical depth effects. The effect of radial drift is shown by a sharp outer edge to the dust disc. Such a feature is absent from the dust surface density profile in Figure 10 due to the 100 au resolution in these observations.
We see evidence of optical depth effects in this data set in the CO isotopologues; throughout the disc 13CO has a lower surface density than the much less abundant C18O. In order to estimate the optical depth of these species we use Equation 7,
| (7) |
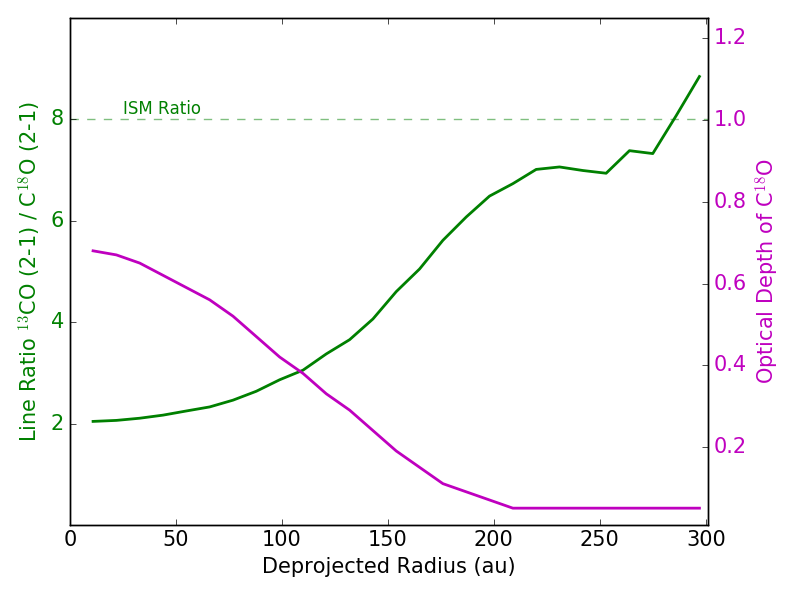
This is a method adopted from Schwarz et al. (2016) where we have used the ratio of fluxes instead of brightness temperatures. We assume 13CO to be optically thick and the isotopic ratio 13CO/C18O=8 based on ISM values (Wilson, 1999). The ratio of excitation temperatures of the two isotopologues is assumed to be 1. Figure 11 shows the resulting (R) as well as the flux ratio from the two isotopologues.
At the outer edge of C18O detection, the ratio of isotopologue emission rises up to 7, with a steep increase towards the ISM ratio of 8 from 250 au as the edge of the C18O disc is approached. C18O is found to be optically thin for the full radial distance over which we detect it, with 0.68 as shown in Figure 11. This optical depth result can help to explain the isotopic ratio curve, which rises as the optical depth decreases. Assuming the intrinsic isotopic abundance ratio within the disc remains constant, the 13CO optical depth will decrease as the C18O does with separation from the star. As 13CO becomes increasingly optically thin, the observed abundance ratio will tend towards its true value.
5.4.1 Spectral Index
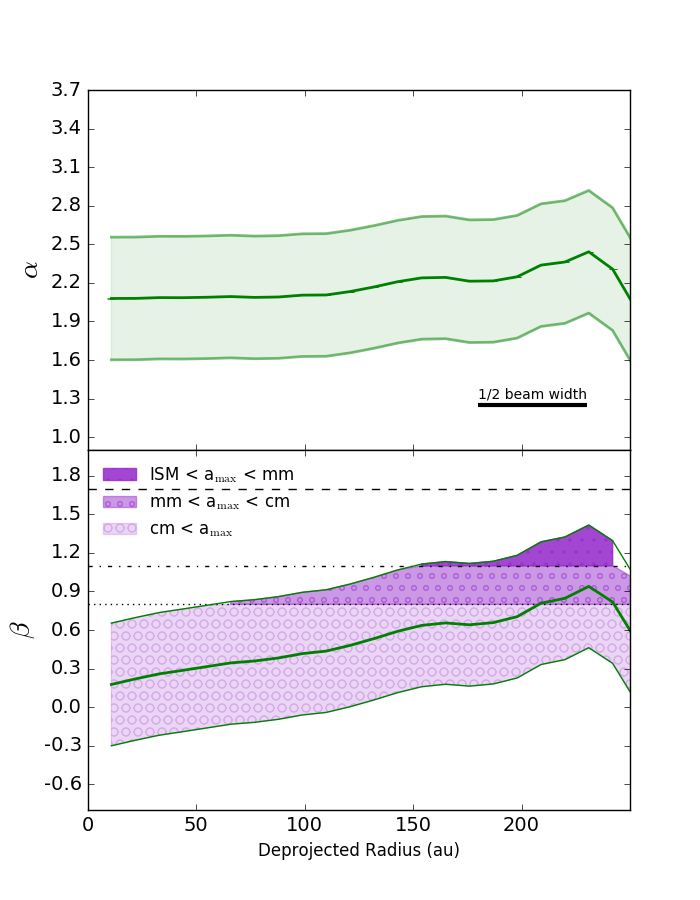
We now utilise the 867 m continuum data from the ALMA band 7 data on this source (Walsh et al., 2014). The continuum from this data is imaged using the same beam as the band 6 1.3mm continuum. Using azimuthal averaged profiles of each continuum image we can directly calculate an average, radially dependent spectral index for the disc, plotted as the central green line in Figure 12. In the upper panel of Figure 12, (R) begins in the inner disc with a value of 2.1 and steadily rises with radius by 0.3 .
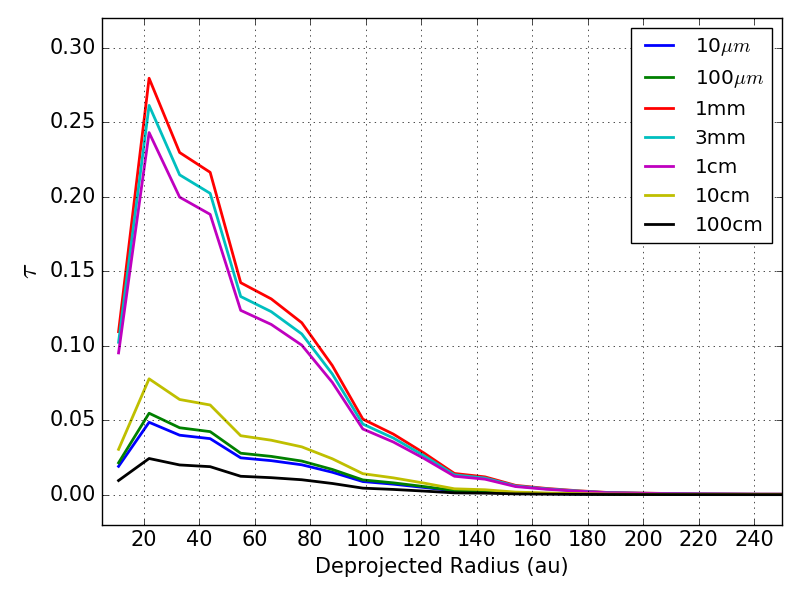
(R) remains within the range typically seen in protoplanetary discs (Ricci et al., 2012; Pinilla et al., 2014), covering a range of values that are low in comparison to that of the ISM. Low spectral index at millimetre wavelengths can be down to one of two reasons; grain growth has lead to larger dust particles () which emit less efficiently and reduce the calculated , or optically thick emission. As we do not have robust information on the sizes of grains present in the disc, we calculate the optical depth of 1.3 mm continuum emission as a function of radius using a range of emissivities at 1.3 mm corresponding to different particle sizes from Draine (2006) . The results are shown in Figure 13 and suggest that over all emissivities tested, the 1.3 mm emission is always optically thin for the entirety of the disc. Through comparing spectral indices calculated from previous mm observations, Walsh et al. (2014) find that at sub-mm wavelengths the continuum emission may be approaching the optically thick regime however.
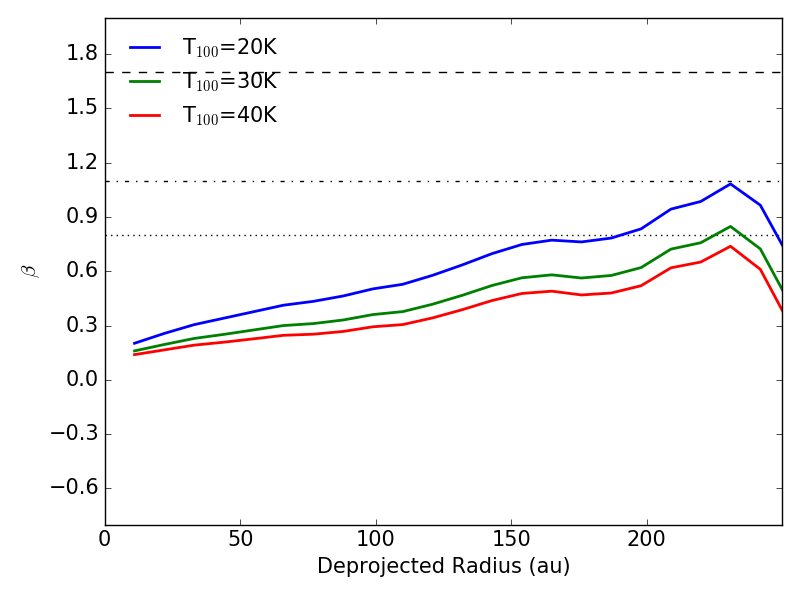
In order to constrain what the size of the emitting grains are we calculate the opacity index . In an optically thin disc under the Rayleigh-Jeans approximation, this can be related to the spectral index by . At 1 mm we trace the cooler dust, where the Rayleigh-Jeans approximation does not hold, and so we take an approach similar to that of Guidi et al. (2016) and calculate with
| (8) |
We adopt a temperature profile that obeys a power law, , and take =25K. Figure 14 demonstrates how temperature affects the calculated (R). Although temperatures in the mid-plane and the outer disc are cool and relatively stable, Figure 14 shows that an inaccurate temperature prescription can alter the significantly; a difference of 20K in changes at 200 au by 0.32. For comparison, this difference is larger than the difference between the characteristic for =1mm and =1cm. Under-estimating disc temperature increases the inferred size of grains in the cooler outer disc, meaning the radial size sorting of grain sizes is of a lesser degree and that grain sizes thoughout the disc are of large (mm) sizes.
In the lower panel of Figure 12 we show as a function of radius compared with opacity indexes calculated by Draine (2006). Coloured areas on the plot show radii at which indicates a particular has been achieved through grain growth, determined by when the lower bound of the calculation crosses the indicative horizontal lines. The curve takes a similar form to that in the top panel, except for a larger variation of 0.8 over the extent of the disc.
The main result from Figure 12 is that calculated between 867m and 1.3 mm indicates grain growth to cm-sizes throughout the disc. In fact, the characteristic for cm, at millimetre wavelengths are all (see Draine, 2006, Figure 2), so dust could be growing even larger than cm sizes without us being able to detect it. Within the uncertainties due to flux calibration, this result is consistent with grain growth to cm-size for the full extent of the disc detected at both continuum wavelengths, where we calculate over the shorter au band 7 continuum radius (Walsh et al., 2014). for the disc inward of 200 au is consistent with pebble (>cm) sized dust. The upper curve remains below the top dashed line for the full extent of the disc, confirming that grains have evolved from an ISM-like throughout the disc. Overall, mid-plane dust has grown substantially from ISM levels within the disc.
Radially increasing in the outward direction has been predicted by dust evolution models that include realistic coagulation and fragmentation (Brauer et al., 2008; Birnstiel et al., 2010). Radially increasing also agrees with past studies that fit multi-wavelength observations with parametric models of discs in the uv-plane, where only those with a radially increasing could reproduce observed emission (Banzatti et al., 2011; Pérez et al., 2012; Trotta et al., 2013; Tazzari et al., 2016).
Guidi et al. (2016) use high resolution data from ALMA and the VLA to observationally confirm a radially increasing dust opacity in the disc of intermediate mass star HD 163296, a bright disc around a Herbig star that has been found to have a series of dust-depleted rings (Isella et al., 2016). We have been able to confirm this now for HD 100546, adding further evidence for the prediction of Wright et al. (2015) who suggest grains may have grown to at least 5 cm. Walsh et al. (2014) compare their measured flux with previous mm observations by Henning et al. (1994); Wilner et al. (2003) in order to calculate disc-averaged =0.7-0.8, and =-0.4, values that lie within the range we see over the extent of the disc in Figure 12.
We have assumed in our analysis that dust grains in the disc have a size distribution of , where p=3.5, an index typical of the ISM (Mathis et al., 1977) that is canonically adopted when modelling discs. As grains grow, the overall distribution of mass between grain sizes is likely to evolve. Birnstiel et al. (2011) showed that when both coagulation and fragmentation are included within a disc grain growth model, the size distribution will deviate from p=3.5; growth of grains tends to lower p, whereas fragmentation will re-introduce small particles and raise p. Draine (2006) demonstrates how decreases with index p for a constant in Figure 6 of that paper. We would expect ISM-like grains at the outer edge of the disc, yet this is not shown in Figure 12. Either we lack the sensitivity to detect the full extent of the dust, or the dust in the disc would be better suited to an alternative value of p. The latter would corroborate with the results of Wright et al. (2015) when studying HD 100546, where the authors find that only d ’Alessio et al. (2005) disc models with p=2.5 fit their data. Tighter constraints could be achieved by comparing against an extensive grid of opacity calculations at millimetre wavelengths over a range of p values.
6 Conclusions
We have presented new ALMA observations of the HD 100546 protoplanetary disc, including the first detection of C18O in the disc.
We measure an integrated flux of 492 mJy from the 1.3 mm continuum image. We derive an outer-most detection of the dust disc at a radial separation from the star of 29010 au at 1.3 mm and the lower limit on dust disc mass was calculated to be 4.1-9.6 M⊙.
We detect line emission from CO isotopologue transitions 13CO (2-1) and C18O (2-1). 13CO has an integrated flux of 12.872 Jy kms-1 and extends out to 39010 au, a size comparable with previous observations of 12CO in the disc. The optically thinner, mid-plane tracing isotopologue C18O is detected for the first time in the disc, giving an integrated flux of 2.948 Jy kms-1 with emission detected as far as 30010 au.
From these detections we calculate a considerable gas mass of 0.018 M⊙, around 1% of the stellar mass. We do not expect freeze-out in this warm Herbig disc. If carbon sequestration is efficient the total gas mass may be larger, but not lower, by our calculations. The ALMA observations of continuum and CO isotopologue emission presented here suggest the lower limit of the gas to dust ratio for the HD 100546 disc is 19. We have assumed ISM abundances of C18O relative to H2 in the disc and so the gas to dust ratio in the disc will be larger in the event that C18O is significantly depleted relative to other species.
We observe low-level extended C18O emission that is spatially coincident with spiral arm structures identified in scattered light observations by the HST. The extended C18O emission may be tracing the mid-plane density variation that creates the scattered light features. In each of our observed tracers, the disc is seen to have a puzzling offset from the known stellar position of between 70-110 milliarcseconds.
Spectral index, , is derived as a function of radius in the disc and rises with separation from the star suggesting a decrease of maximum dust grain size in the outward direction. We directly relate this to the size of grains through calculating the opacity index, . This gives results consistent with the growth of grains beyond mm-sizes throughout the disc, and to larger cm-sized ‘pebbles’ within 200 au. A shallower dust grain size distribution is the alternative explanation, suggesting a larger proportion of the solid mass is contained within the largest grains in comparison to the ISM, or indeed optically thick dust at 867m.
Acknowledgements
JM is funded through the University Research Scholarship from the University of Leeds. The work of OP is supported by the Royal Society Dorothy Hodgkin Fellowship. TJH is funded by an Imperial College Junior Research Fellowship. We thank Catherine Walsh for useful advice and discussion. We thank David Ardila for providing the HST images of HD 100546. This paper makes use of the following ALMA data: ADS/JAO.ALMA2015.1.01600.S, ADS/JAO.ALMA2011.0.00863.S . ALMA is a partnership of ESO (representing its member states), NSF (USA) and NINS (Japan), together with NRC (Canada), NSC and ASIAA (Taiwan), and KASI (Republic of Korea), in cooperation with the Republic of Chile. The Joint ALMA Observatory is operated by ESO, AUI/NRAO and NAOJ. This research made use of APLpy, an open-source plotting package for Python hosted at http://aplpy.github.com, of Astropy, a community-developed core Python package for Astronomy (The Astropy Collaboration et al., 2013), of NASA’s Astrophysics Data System and the SIMBAD database, operated at CDS, Strasbourg, France.
References
- Ansdell et al. (2016) Ansdell M., et al., 2016, ApJ, 828, 46
- Ardila et al. (2007) Ardila D. R., Golimowski D. A., Krist J. E., Clampin M., Ford H. C., Illingworth G. D., 2007, ApJ, 665, 512
- Avenhaus et al. (2014) Avenhaus H., Quanz S. P., Meyer M. R., Brittain S. D., Carr J. S., Najita J. R., 2014, ApJ, 790, 56
- Banzatti et al. (2011) Banzatti A., Testi L., Isella A., Natta A., Neri R., Wilner D. J., 2011, A&A, 525
- Baruteau et al. (2014) Baruteau C., Crida A., Paardekooper S.-J., Guilet J., Bitsch B., Nelson R., Kley W., Papaloizou J., 2014, in Henrik Beuther Ralf S. Klessen Cornelis P. Dullemond Thomas Henning eds, , PPVI. Univ.of Arizona Press, Tucson, pp 667–689, https://arxiv.org/pdf/1312.4293.pdf
- Birnstiel & Andrews (2013) Birnstiel T., Andrews S. M., 2013, ApJ, 780, 153
- Birnstiel et al. (2010) Birnstiel T., et al., 2010, A&A, 516, L14
- Birnstiel et al. (2011) Birnstiel T., Ormel C. W., Dullemond C. P., 2011, A&A, 525, A11
- Boneberg et al. (2016) Boneberg D. M., Panić O., Haworth T. J., Clarke C. J., Min M., 2016, MNRAS, 461, 385
- Brauer et al. (2008) Brauer F., Dullemond C. P., Henning T., 2008, A&A, 480, 859
- Bressan et al. (2012) Bressan A., Marigo P., Girardi L., Salasnich B., Cero C. D., Rubele S., Nanni A., 2012, MNRAS, 427, 127
- Brittain et al. (2013) Brittain S. D., Najita J. R., Carr J. S., Liskowsky J., Troutman M. R., Doppmann G. W., 2013, ApJ, 767, 159
- Brittain et al. (2014) Brittain S. D., Carr J. S., Najita J. R., Quanz S. P., Meyer M. R., 2014, ApJ, 791, 136
- Bruderer et al. (2012) Bruderer S., van Dishoeck E. F., Doty S. D., Herczeg G. J., 2012, A&A, 541, A91
- Casassus et al. (2015) Casassus S., et al., 2015, ApJ, 812, 126
- Cazzoletti et al. (2018) Cazzoletti P., et al., 2018, A&A, 619, A161
- Currie et al. (2015) Currie T., et al., 2015, ApJ, 814, L27
- Dartois et al. (2003) Dartois E., Dutrey A., Guilloteau S., 2003, A&A, 399, 773
- Draine (2006) Draine B. T., 2006, ApJ, 636, 1114
- Du et al. (2015) Du F., Bergin E. A., Hogerheijde M. R., 2015, ApJL, 807, L32
- Dullemond et al. (2018) Dullemond C. P., et al., 2018, ApJL, 869, L46
- Dutrey et al. (2014) Dutrey A., et al., 2014, Nature, 514, 600
- Dzyurkevich et al. (2010) Dzyurkevich N., Flock M., Turner N. J., Klahr H., Henning T., 2010, A&A, 515, A70
- Ercolano & Pascucci (2017) Ercolano B., Pascucci I., 2017, Royal Society Open Science, 4, 170114
- Espaillat et al. (2014) Espaillat C., et al., 2014, in Beuther H., Klessen R. S., Dullemond C. P., Henning T., eds, , PPIV. Univ. Arizona Press, Tucson, p. 475
- Facchini et al. (2017) Facchini S., Birnstiel T., Bruderer S., Van Dishoeck E. F., 2017, A&A, 605, 16
- Fairlamb et al. (2015) Fairlamb J. R., Oudmaijer R. D., Mendigutía I., Ilee J. D., van den Ancker M. E., 2015, MNRAS, 453, 976
- Fedele et al. (2017) Fedele D., et al., 2017, A&A, 600, A72
- Follette et al. (2017) Follette K. B., et al., 2017, AJ, 153, 264
- Garufi et al. (2016) Garufi A., et al., 2016, A&A, 588, A8
- Grady et al. (2001) Grady C. A., et al., 2001, AJ, 122, 3396
- Guidi et al. (2016) Guidi G., et al., 2016, A&A, 588, A112
- Guilloteau et al. (2013) Guilloteau S., Di Folco E., Dutrey A., Simon M., Grosso N., Piétu V., 2013, A&A, 549, A92
- Henning et al. (1994) Henning T., Launhardt R., Steinacker J., Thamm E., 1994, A&A, 291, 546
- Hughes et al. (2008) Hughes A. M., Wilner D. J., Kamp I., Hogerheijde M. R., 2008, ApJ, 681, 626
- Isella et al. (2016) Isella A., et al., 2016, PRL, 117, 251101
- Juhász & Rosotti (2018) Juhász A., Rosotti G. P., 2018, MNRASL, 474, L32
- Kama et al. (2016) Kama M., et al., 2016, A&A, 592, A83
- Klahr & Bodenheimer (2006) Klahr H., Bodenheimer P., 2006, ApJ, 639, 432
- Lindegren et al. (2018) Lindegren L., et al., 2018, A&A, 616, A2
- Long et al. (2017) Long F., et al., 2017, ApJ, 844, 99
- Loomis et al. (2017) Loomis R. A., Öberg K. I., Andrews S. M., MacGregor M. A., 2017, ApJ, 840, 23
- Manara et al. (2018) Manara C. F., Morbidelli A., Guillot T., 2018, A&A, 618
- Mathis et al. (1977) Mathis J. S., Rumpl W., Nordsieck K. H., 1977, ApJ, 217, 425
- Matrà et al. (2015) Matrà L., Panić O., Wyatt M. C., Dent W. R. F., 2015, MNRAS, 447, 3936
- Meeus et al. (2010) Meeus G., et al., 2010, A&A, 518
- Mendigutía et al. (2017) Mendigutía I., et al., 2017, A&A, 608, A104
- Miley et al. (2018) Miley J., Panic O., Wyatt M., Kennedy G., 2018, A&A, 615, L10
- Miotello et al. (2014) Miotello A., Bruderer S., van Dishoeck E. F., 2014, A&A, 572, A96
- Miotello et al. (2016) Miotello A., van Dishoeck E. F., Kama M., Bruderer S., 2016, A&A, 594, A85
- Miotello et al. (2017) Miotello A., et al., 2017, A&A, 599, A113
- Moór et al. (2011) Moór A., et al., 2011, ApJ, 740, L7
- Mordasini (2018) Mordasini C., 2018, in Deeg H. J., Belmonte J. A., eds, , Handbook of Exoplanets. Springer, Cham, doi:10.1007/978-3-319-30648-3_143-1, https://arxiv.org/pdf/1804.01532.pdfhttp://arxiv.org/abs/1804.01532
- Mordasini et al. (2012) Mordasini C., Alibert Y., Benz W., Klahr H., Henning T., 2012, A&A, 541, A97
- Mulders et al. (2013) Mulders G. D., Paardekooper S.-J., Panić O., Dominik C., van Boekel R., Ratzka T., 2013, A&A, 557, A68
- Owen (2016) Owen J. E., 2016, Publications of the Astronomical Society of Australia, 33, e005
- Pacheco-Vazquez et al. (2016) Pacheco-Vazquez S., et al., 2016, A&A, 589, A60
- Panić & Hogerheijde (2009) Panić O., Hogerheijde M. R., 2009, A&A, 508, 707
- Panić & Min (2017) Panić O., Min M., 2017, MNRAS, 467, 1175
- Panić et al. (2008) Panić O., Hogerheijde M. R., Wilner D., Qi C., 2008, A&A, 491, 219
- Panić et al. (2010) Panić O., van Dishoeck E. F., Hogerheijde M. R., Belloche A., Güsten R., Boland W., Baryshev A., 2010, A&A, 519
- Panić et al. (2014) Panić O., Ratzka T., Mulders G. D., Dominik C., van Boekel R., Henning T., Jaffe W., Min M., 2014, A&A, 562, A101
- Pérez et al. (2012) Pérez L. M., et al., 2012, ApJ, 760, L17
- Perez et al. (2014) Perez S., et al., 2014, ApJ, 798, 85
- Pineda et al. (2014) Pineda J. E., Quanz S. P., Meru F., Mulders G. D., Meyer M. R., Panić O., Avenhaus H., 2014, ApJL, 788
- Pineda et al. (2018) Pineda J. E., et al., 2018, ApJ
- Pinilla et al. (2012a) Pinilla P., Birnstiel T., Ricci L., Dullemond C. P., Uribe A. L., Testi L., Natta A., 2012a, A&A, 538, A114
- Pinilla et al. (2012b) Pinilla P., Benisty M., Birnstiel T., 2012b, A&A, 545, A81
- Pinilla et al. (2014) Pinilla P., et al., 2014, A&A, 564, A51
- Pinilla et al. (2018) Pinilla P., et al., 2018, ApJ, 859, 32
- Price et al. (2018) Price D. J., et al., 2018, MNRAS, 477, 1270
- Quanz et al. (2015) Quanz S. P., Amara A., Meyer M. R., Girard J. H., Kenworthy M. A., Kasper M., 2015, ApJ, 807, 64
- Quillen (2006) Quillen A. C., 2006, ApJ, 640, 1078
- Rau & Cornwell (2011) Rau U., Cornwell T. J., 2011, A&A, 532, A71
- Reboussin et al. (2015) Reboussin L., Wakelam V., Guilloteau S., Hersant F., Dutrey A., 2015, A&A, 579, A82
- Ricci et al. (2012) Ricci L., Trotta F., Testi L., Natta A., Isella A., Wilner D. J., 2012, A&A, 540, A6
- Rosenfeld et al. (2013) Rosenfeld K. A., Andrews S. M., Hughes A. M., Wilner D. J., Qi C., 2013, ApJ, 774, 16
- Schwarz et al. (2016) Schwarz K. R., Bergin E. A., Cleeves L. I., Blake G. A., Zhang K., Öberg K. I., van Dishoeck E. F., Qi C., 2016, ApJ, 823, 91
- Takeuchi & Lin (2005) Takeuchi T., Lin D. N. C., 2005, ApJ, 623, 482
- Tanaka et al. (2005) Tanaka H., Himeno Y., Ida S., 2005, ApJ, 625, 414
- Tazzari et al. (2016) Tazzari M., et al., 2016, A&A, 588, A53
- The Astropy Collaboration et al. (2013) The Astropy Collaboration et al., 2013, A&A, 558, A33
- Toomre (1964) Toomre A., 1964, ApJ, 139, 1217
- Trotta et al. (2013) Trotta F., Testi L., Natta A., Isella A., Ricci L., 2013, A&A, 558, A64
- Van Der Marel et al. (2016) Van Der Marel N., Cazzoletti P., Pinilla P., Garufi A., 2016, ApJ, 823, 178
- Van Zadelhoff et al. (2001) Van Zadelhoff G.-J., Van Dishoeck E. F., Thi W.-F., Blake G. A., 2001, A&A, 377, 566
- Vioque et al. (2018) Vioque M., Oudmaijer R. D., Baines D., Mendigutía I., Pérez-Martínez R., 2018, A&A, 620, 128
- Walsh et al. (2014) Walsh C., et al., 2014, ApJL, 791, L6
- Walsh et al. (2017) Walsh C., Daley C., Facchini S., Juhász A., 2017, A&A, 607, A114
- White et al. (2016) White J. A., Boley A. C., Hughes A. M., Flaherty K. M., Ford E., Wilner D., Corder S., Payne M., 2016, ApJ, 829, 6
- Williams & Cieza (2011) Williams J. P., Cieza L. A., 2011, ARA&A, 49, 67
- Williams et al. (2014) Williams J. P., et al., 2014, ApJ, 796, 120
- Wilner et al. (2003) Wilner D. J., Bourke T. L., Wright C. M., Jørgensen J. K., Van Dishoeck E. F., Wong T., 2003, ApJ, 596, 597
- Wilson (1999) Wilson T. L., 1999, RPPh, 62, 143
- Wilson & Rood (1994) Wilson T. L., Rood R. T., 1994, ARA&A, 32, 191
- Wright et al. (2015) Wright C. M., et al., 2015, MNRAS, 453, 414
- Wyatt et al. (2015) Wyatt M. C., Panić O., Kennedy G. M., Matrà L., 2015, Ap&SS, 357, 103
- Yu et al. (2016) Yu M., Willacy K., Dodson-Robinson S. E., Turner N. J., Evans Ii N. J., 2016, ApJ, 822, 53
- d ’Alessio et al. (2005) d ’Alessio P., Merín B., Calvet N., Hartmann L., Montesinos B., 2005, RMxAA, 41, 61
- van den Ancker et al. (1997) van den Ancker M. E., Thé P. S., Tjin H. R. E., Djie A., Catala C., De Winter D., Blondel P. F. C., Waters L. B. F. M., 1997, A&A, 324, 33
- van der Marel (2017) van der Marel N., 2017, in Pessah M., Gressel O., eds, , Formation, Evolution, and Dynamics of Young Solar Systems. Springer, Cham, pp 39–61, doi:10.1007/978-3-319-60609-5_2, http://link.springer.com/10.1007/978-3-319-60609-5_2
- van der Marel et al. (2013) van der Marel N., et al., 2013, Science, 340, 1199
- van der Marel et al. (2015) van der Marel N., et al., 2015, ApJ, 810, L7