An Infrared Census of DUST in Nearby Galaxies with Spitzer (DUSTiNGS):
V. The Period-Luminosity relation for dusty metal-poor AGB stars
Abstract
The survey for DUST In Nearby Galaxies with Spitzer (DUSTiNGS) has identified hundreds of candidate dust-producing Asymptotic Giant Branch (AGB) stars in several nearby metal-poor galaxies. We have obtained multi-epoch follow-up observations for these candidates with the Spitzer Space Telescope and measured their infrared (IR) lightcurves. This has allowed us to confirm their AGB nature and investigate pulsation behavior at very low metallicity. We have obtained high-confidence pulsation periods for 88 sources in seven galaxies. We have confirmed DUSTiNGS variable star candidates with a 20% success rate, and determined the pulsation properties of 19 sources already identified as Thermally-Pulsing AGB (TP-AGB) stars. We find that the AGB pulsation properties are similar in all galaxies surveyed here, with no discernible difference between the DUSTiNGS galaxies (down to 1.4% solar metallicity; [Fe/H] = ) and the far more metal-rich Magellanic Clouds (up to 50% solar metallicity; [Fe/H] = ). These results strengthen the link between dust production and pulsation in AGB stars and establish the IR Period-Luminosity ( – ) relation as a reliable tool ( 4%) for determining distances to galaxies, regardless of metallicity.
Subject headings:
galaxies: dwarf - galaxies: stellar content - Local Group - stars: AGB and post-AGB - stars: carbon - infrared: stars1. INTRODUCTION
Variable Stars on the asymptotic giant branch (AGB) are known to show a linear correlation between the logarithm of the period and luminosity (Gerasimovič, 1928). This relationship reveals details about the stellar physics that drives AGB evolution and, like the period-luminosity (–) relationship for Cepheids and RR Lyrae, is a useful distance indicator. As such, the AGB – relationship has been studied extensively over the years (Feast et al., 1989; Hughes & Wood, 1990; Ita et al., 2004; Glass et al., 2009; Soszyński et al., 2009). Many of these studies focus only on Galactic and Magellanic AGB variables, since AGB stars are difficult to identify and resolve in more distant galaxies, mainly due to extinction by circumstellar dust that almost always accompanies large amplitude pulsation. As a result, the properties of the AGB – relation are not well constrained at low metallicity, and some uncertainty remains regarding its usefulness as a distance indicator in metal-poor galaxies and/or metal-poor galaxy halos (Feast, Whitelock & Menzies, 2002).
Strong AGB pulsations and dust production are known to be tightly linked (Lagadec & Zijlstra, 2008; Sloan et al., 2016; McDonald et al., 2018; McDonald & Trabucchi, 2019). As a star evolves through the AGB phase, the strength of pulsations grows, which simultaneously levitates more material to large circumstellar radii where it condenses into dust. AGB stars can either be oxygen-rich (M-type) or carbon-rich (carbon stars), producing silicate-rich dust and carbonaceous dust, respectively. The processes dictating the envelope chemistry are third dredge-up events (TDUs) and hot-bottom burning (HBB), which depend primarily on a star’s initial mass (see the reviews by Herwig, 2005; Karakas & Lattanzio, 2014), and metallicity. Carbon stars produce enough carbon internally that they can produce significant amounts of dust regardless of their initial metallicity (Sloan et al., 2012), while oxygen-rich stars require heavier elements (e.g. Fe, Mg, Al, Si) which must be produced by a previous generation of stars or the byproducts of TDU and HBB (e.g. Sloan et al., 2010; Bladh et al., 2015).
How AGB mass loss, dust production, and evolution are affected by metallicity is still unclear. Variability studies in the Large (LMC) and Small (SMC) Magellanic Clouds have produced large samples of long-period variables (LPVs), but these samples span a narrow range in metallicity. Additional works have discovered large samples of LPVs in globular clusters, and smaller samples in nearby dwarf galaxies (see §1.3). Here we present the first large-scale IR survey of LPVs in nearby galaxies, reaching lower metallicity than ever before.
| 12 + log(O/H) | V | Number of sources | Number from | Previous work | |||
|---|---|---|---|---|---|---|---|
| Galaxy | (Mpc) | [Fe/H] | (mag) | (mag) | with high-confidence | previous work | Reference |
| fit periods | |||||||
| And IX | 0.77 | 0 | |||||
| DDO 216 | 0.92 | 5 | |||||
| Fornaxaafootnotemark: | 0.15 | 7 | Whitelock et al. (2009) | ||||
| IC 10 | 0.79 | 16 | |||||
| IC 1613 | 0.76 | 15 | 9 | Menzies et al. (2015) | |||
| Leo Iaafootnotemark: | 0.25 | 0.3 | 26 | Menzies et al. (2010) | |||
| NGC 147 | 0.68 | 8 | 168 | Lorenz et al. (2011) | |||
| NGC 185 | 0.62 | 29 | 419 | Lorenz et al. (2011) | |||
| NGC 6822aafootnotemark: | 0.46 | 50+ | Whitelock (2012) | ||||
| Phoenixaafootnotemark: | 0.42 | 1 | Menzies et al. (2008) | ||||
| Sag DIG | 1.07 | 0 | 3 | Whitelock et al. (2018) | |||
| Sculptoraafootnotemark: | 0.09 | 2 | Menzies et al. (2011) | ||||
| Sextans A | 1.43 | 6 | |||||
| Sextans B | 1.43 | 0 | |||||
| WLM | 0.93 | 9 |
aafootnotemark: Galaxies not analyzed in this work.
1.1. Long-Period Variable stars
The driving force behind AGB pulsations is poorly understood. While sources within the instability strip of the Hertzsprung Russell (HR) diagram (e.g., Cepheid variables or RR Lyrae stars) pulsate as a result of a gravity-opacity instability known as the -mechanism, the large convection cells within an AGB star would likely disrupt both spherical symmetry and this mechanism (Liljegren et al., 2018).
Red giants and supergiants (RSGs) and AGB stars can follow several sequences on the – diagram often labeled A through E (Wood et al., 1999; Ita et al., 2004)aaaThese sequences have also been labeled as 1–4, D, and E (e.g., Riebel et al., 2010).. Many of the sources on these sequences pulsate in multiple modes, with secondary periods falling on the other sequences (see Trabucchi et al., 2018). The B and C′ sequences are composed of Red Giant Branch (RGB) and AGB first overtone radial pulsators. The dusty and evolved AGB stars, or Mira variables, primarily lie along the fundamental mode (sequence 1; Riebel et al., 2010), also known as sequence C (Wood et al., 1999), however some ( 30%) lie along sequence D, with pulsation periods between days. These have been referred to as Long Secondary Periods (LSPs), yet are clearly the dominant mode in some evolved stars (Nicholls et al., 2009; Trabucchi et al., 2017); the sequence will be discussed further in Section 5.5.
1.2. Dust at low metallicity
AGB stars can have considerably different lifetimes as a result of their different masses. The main-sequence lifetime of AGB progenitors (low- and intermediate-mass stars; 0.88 M⊙) is between 0.1 and 12 Gyr, after which they typically spend 20% of that time as red giants, of that as early-AGB stars, and as Thermally-Pulsing AGB (TP-AGB) stars (Marigo et al., 2008, 2017; Javadi, van Loon & Mirtorabi, 2011b; Javadi et al., 2017). On the TP-AGB, these stars will produce the most dust and contribute the most mass back to the ISM (see review by Höfner & Olofsson, 2018). Recent works exploring the metallicity dependence of dust production in carbon stars have produced mixed results. A strong dependence was originally suggested by van Loon (2000) and corroborated by van Loon (2006) and van Loon, Marshall & Zijlstra (2005), while McDonald et al. (2011); Sloan et al. (2012, 2016) found little to no dependence. Nanni et al. (2013), Nanni et al. (2014), and Ferrarotti & Gail (2006) have given estimates on the metallicity dependence of the dust production using theoretical models. Work within the Galaxy and the Magellanic Clouds has also allowed us to study the effect of metallicity on the mass loss of oxygen-rich AGB stars (van Loon, 2000, 2006; Goldman et al., 2017), with results showing little-to-no effect on the measured mass loss rates.
The DUST in Nearby Galaxies with Spitzer survey (DUSTiNGS; Boyer et al., 2015b, hereafter Paper I) searched for dust-producing AGB stars in 50 nearby (< 1.5 Mpc) metal-poor ( < [Fe/H] < 1.0) dwarf galaxies using Spitzer Space Telescope (Werner et al., 2004; Gehrz et al., 2007) InfraRed Array Camera (IRAC; Fazio et al., 2004) channels 1 and 2. The survey discovered hundreds of candidate dust-producing AGB stars at metallicities as low as 0.6% solar and provided no evidence for a strong metallicity dependence in overall dust production (Boyer et al., 2015a, hereafter Paper II). Observations at wavelengths longer than = 5 m, where thermal emission from circumstellar dust dominates the IR spectral energy distribution (SED), will be required to confirm this. Boyer et al. (2017, hereafter Paper IV) identified 146 carbon- and oxygen-rich type stars by exploiting the strength of the water features in M-type stars and the CN+C2 features found in carbon stars. Though most (120) of these sources were classified as carbon rich, 26 were identified as M-type. These observations showed that dust is produced both by carbon- and oxygen-rich AGB stars over the full metallicity range spanned by DUSTiNGS. This suggests that metal-poor high-mass AGB stars can produce dust as early as 30 Myr after forming (for a 10 M⊙ star), while lower-mass carbon stars form dust after roughly 0.3–3.6 Gyr (van Loon, Marshall & Zijlstra, 2005). AGB stars are therefore likely important contributors of dust in the early Universe. This work also led to the discovery of a potential dust-producing super-AGB star in IC 10 with an assumed mass M⊙ and strong water absorption indicative of an AGB star. Super-AGB stars are more massive (6 M 9 M⊙) AGB stars that are capable of fusing carbon and developing a degenerate oxygen-neon core. There is evidence that they can be dusty (Javadi et al., 2013), and produce the ONeMg white dwarfs that are responsible for neon nova explosions (Evans & Gehrz, 2012). These stars may also be capable of ending in an electron-capture supernova without developing an iron core like the observationally similar RSGs (Doherty et al., 2015). We did not detect variability in this source, due to a lack of temporal coverage (2-epochs).
1.3. Metal-poor LPV samples
Much of the information known about metal-poor LPVs is from the Optical Gravitational Lensing Experiment (OGLE; Udalski, Kubiak & Szymański, 1997), Massive Compact Halo Object (MACHO; Alcock et al., 1997), and Spitzer Surveying the Agents of a Galaxy’s Evolution surveys (SAGE; Meixner et al., 2006; Gordon et al., 2011; Riebel et al., 2010, 2015), with a handful of surveys in other galaxies (shown in Table 1). While a large number of metal-rich samples exists (Huang et al., 2018; Yuan et al., 2018), the majority of the more metal-poor LPVs have been found in Leo I, NGC 185, NGC 147, and NGC 6822, galaxies all only slightly more metal-poor than the SMC. The most metal-poor sources to date were found by McDonald et al. (2010) who discovered two sequence D variables in the globular cluster M15 at [Fe/H] = 2.37 dex (Harris, 1996), and by Whitelock et al. (2018) who discovered three LPVs in the Sagittarius Dwarf Irregular Galaxy (Sag DIG). The metallicity of Sag DIG has been measured in both stars, using red giants ([Fe/H] = ; Kirby et al., 2017) and isochrones ([Fe/H] = 2.1; Momany et al., 2002), and also the gas (12 log(O/H) = 7.26 7.50; Skillman, Terlevich & Melnick, 1989; Saviane et al., 2002). One of these LPVs in Sag DIG has a pulsation period of 950 days, indicating a very late stage of evolution, and was found to be oxygen-rich (Paper IV). Variables have also been detected in globular clusters (Clement et al., 2001; Feast, Whitelock & Menzies, 2002; Lebzelter & Wood, 2005). However, their low mass limits these sources to the lower regions of the – sequences.
It is difficult to study the – relation at lower metallicities because so few LPVs have been discovered in this regime. The DUSTiNGS survey initially identified several LPV candidates using two-epoch photometry. Here, we follow up with additional epochs and provide a larger sample to populate the – diagram over a large metallicity range (1.27 > [Fe/H] > 1.85). DUSTiNGS is the first large-scale IR survey to identify the dustiest evolved stars in these galaxies. These stars can be obscured in the near-IR and optical. Observing in the IR ensures that all of the prominent dust producers are detected.
| Galaxy | PID | AOR | R.A. | Decl. | Start Date | |
|---|---|---|---|---|---|---|
| (J2000) | (J2000) | (UT) | (h) | |||
| IC 10 | 69 | 4424960 | 00h20m24.50s | +59d17m30.0s | 2004-Jul-23 | 0.12 |
| IC 10 | 61001 | 33204224 | 00h20m24.00s | +59d18m14.0s | 2010-Jan-29 | 0.92 |
| IC 10 | 61001 | 33203968 | 00h20m24.00s | +59d18m14.0s | 2010-Feb-19 | 0.87 |
| IC 10 | 61001 | 33203456 | 00h20m24.00s | +59d18m14.0s | 2010-Mar-10 | 0.95 |
| IC 10 | 61001 | 33202944 | 00h20m24.00s | +59d18m14.0s | 2010-Sep-09 | 0.87 |
| IC 10 | 61001 | 33202432 | 00h20m24.00s | +59d18m14.0s | 2010-Oct-04 | 0.83 |
| IC 10 | 61001 | 33201920 | 00h20m24.00s | +59d18m14.0s | 2010-Oct-14 | 0.83 |
| IC 1613 | 61001 | 33184000 | 01h04m58.20s | +02d09m44.0s | 2010-Jan-26 | 0.97 |
2. Data and Observations
We construct lightcurves using 3.6 and 4.5 m imaging data from the IRAC on board Spitzer, with a mix of programs from both the cryogenic and post-cryogenic phase. Data include new and archival observations from 2003 to 2017.
2.1. DUSTiNGS
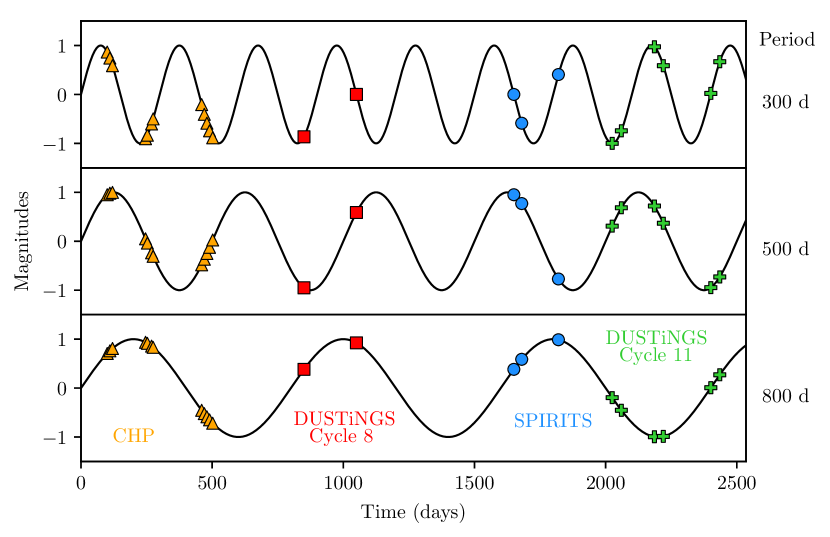
The DUSTiNGS data include both the original Cycle 8 data obtained in 2011–2012 (PID: 80063) and data obtained during the Cycle 11 follow-up program (PID: 11041) in 2015–2016. Lightcurves are sparsely sampled owing to the spacing of the Spitzer visibility windows for the DUSTiNGS galaxies, which are roughly 4–6 weeks long. There are typically two windows each year, separated by approximately 6 months. The Cycle 8 program, described in Paper I, obtained two epochs, one in each visibility window. The Cycle 11 program obtained six additional epochs, with a pair of observations at the beginning and end of each of the three consecutive visibility windows. The cadence is illustrated in Figure 1.
2.2. Archival Data
By taking advantage of rich archival history of the Spitzer Space Telescope, we have been able to use data from 11 observing programs (Table 2). Most of the archival data that we use here are from two programs:
SPIRITS
The SPitzer InfraRed Intensive Transients Survey (SPIRITS; Kasliwal et al., 2017) program (Cycles , PID: 10136, 11063) was aimed at discovering explosive transients, eruptive variables, and new IR events lacking optical counterparts. The SPIRITS targets include a few of the DUSTiNGs galaxies: IC 1613, NGC 147, NGC 185, Sextans A, and Sextans B. These observations were taken between the original DUSTiNGS epochs and the follow-up DUSTiNGS observations, filling a gap in our temporal coverage (Figure 1). Additional SPIRITS epochs cover the same epochs covered by the DUSTiNGS Cycle 11 observations and are included here.
The Carnegie Hubble Program
The Carnegie Hubble Program (CHP; Cycle 6, PID: 61001; Freedman et al., 2011) was aimed at determining distances to nearby galaxies using Cepheid variables. The CHP observations, taken between July 2009 and March 2010, preceded both the DUSTiNGS and SPIRITS observations. The time between each epoch is 10 d given the focus on short-period variability (Figure 1).
We also use data from eight additional programs (individual observations are listed in Table 2) which sporadically sample the lightcurves between CHP and DUSTiNGS. The observations target 10 galaxies (listed in Table 1) that span a range in size (8.1 > V > 15.2 mag), distance (0.62 – 1.43 Mpc), and most notably, metal content (1.27 > [Fe/H] > 1.85). We will use this range in metallicity to investigate its effect on the pulsation properties of evolved stars.
3. Methods
3.1. PSF Photometry
We have performed point-spread function (PSF) photometry on all of the DUSTiNGS sources and archival data using the DUSTiNGS pipeline (described in Paper I). We performed PSF photometry using DAOphot II and ALLSTAR (Stetson, 1987) on the co-added frames for the fainter sources ([3.6] > 16 mag) and individual frames for the brighter sources. For the fainter sources, mosaicked images were used to reduce Eddington bias (Eddington, 1913) in sources near the detection threshold. A mosaicked and subsampled image can smear the PSF, for example, if it includes a rotation between frames. As a result, single frames were used for the brighter sources, which are more sensitive to changes in the PSF. For the photometry of our sample in IC 10, we have adjusted the magnitudes by 0.2 mag to account for foreground interstellar extinction (described further in 5.2). Paper I provides additional details on the photometry, saturation limits, the photometric correction, and the photometric completeness.
3.2. Identifying LPVs
The non-uniformity of the observing programs has resulted in varying depths and spatial coverage for each epoch. Therefore, many lightcurves are sparsely sampled. We have implemented the Lomb-Scargle algorithm (Lomb, 1976; Scargle, 1982), to determine the pulsation periods and pulsation amplitudes. The method fits a simple single-term sinusoidal lightcurve to different frequencies and then normalizes the results using the residuals. This method reduces the effects of unevenly-spaced data using a more appropriate means of weighting within the Fourier transform (see review by VanderPlas, 2018).
| (1) | (2) | (3) | (4) | (5) | (6) | (7) | (8) | (9) | (10) | (11) | (12) | (13) | (14) |
|---|---|---|---|---|---|---|---|---|---|---|---|---|---|
| Galaxy | Target | RA | Dec | 3.6 m | 4.5 m | P | P[4.5] | 2nd fit | 2nd[4.5] | amp | color | Flag | |
| ID | (deg) | (deg) | (mag) | (mag) | (d) | (d) | (d) | (d) | (mag) | (mag) | (%) | ||
| DDO 216 | 45582 | 352.2400208 | 14.61585045 | 16.65 | 16.46 | 101 | 131 | 0.35 | IE | ||||
| DDO 216 | 58694 | 352.2214661 | 14.70353794 | 15.80 | 15.07 | 389 | 389 | 482 | 354 | 1.05 | 0.70 | 13.5 | RF |
| DDO 216 | 76368 | 352.1983032 | 14.75455666 | 16.98 | 16.06 | 1308 | 196 | 223 | 178 | 0.34 | 0.92 | 16.2 | IE |
| DDO 216 | 77533 | 352.1968384 | 14.73819065 | 17.04 | 15.91 | 103 | 174 | 110 | 1008 | 0.23 | 1.14 | 13.9 | UF |
| DDO 216 | 83518 | 352.1894836 | 14.68728733 | 16.11 | 15.62 | 212 | 212 | 1339 | 1339 | 0.48 | 0.52 | 11.8 | UF |
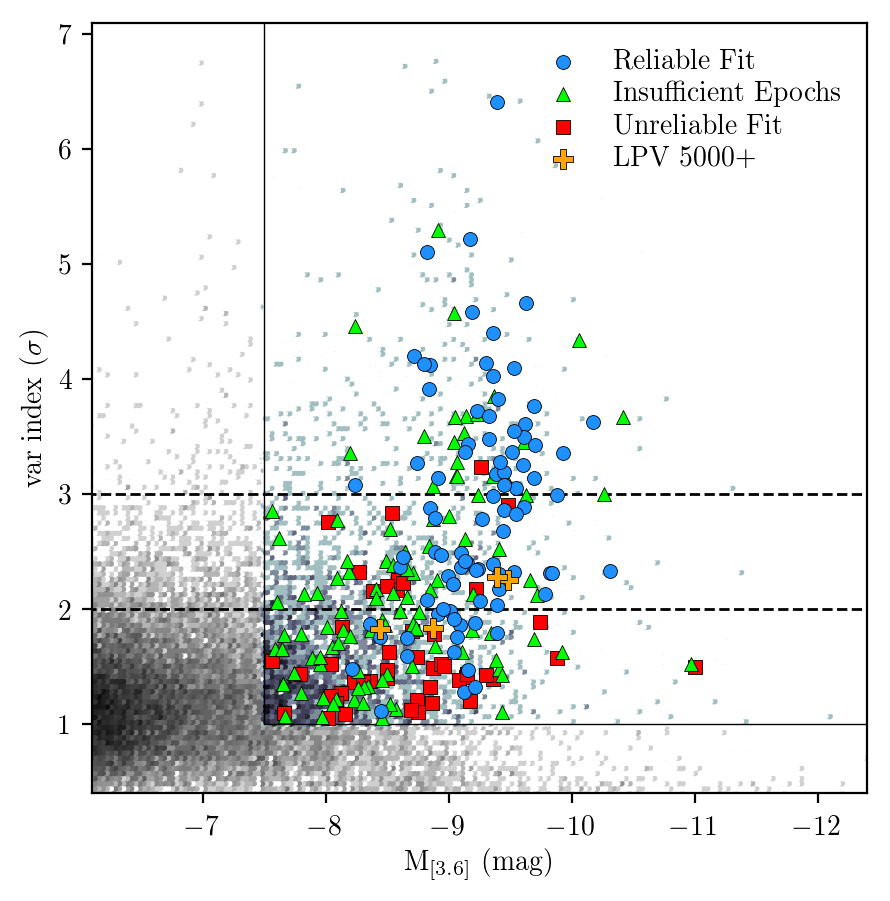
The nonuniform temporal and spatial coverage of the archival data has resulted in many sources with incomplete lightcurves from which we cannot derive reliable periods. To identify sources with sufficiently sampled lightcurves, we start by calculating the variability index (e.g. Gallart et al., 2004) that is defined as the ratio of standard deviation of the measurements for a given star to the mean internal photometric uncertainty. A value of 1, 2, and 3 indicates variability at the 1, 2, and 3-sigma levels. We first restrict our lightcurve fitting to stars with variability index > 1. Second, we exclude sources with < 6 epochs from our lightcurve analysis, a number that was also concluded as sufficient by Javadi et al. (2015). Finally, we restrict lightcurve fitting to sources brighter than M[3.6] = 7.5 mag, which includes all extreme AGB stars (x-AGB; Blum et al., 2006) in the LMC sample from Riebel et al. (2010). The x-AGB stars are the dustiest AGB stars that are likely in the superwind phase and very close to the end of their evolution. By restricting our sample to stars in the same brightness range as the LMC x-AGB stars, we limit contamination from fainter variable dusty objects, such as young stellar objects (YSOs) and background active galactic nuclei (AGN).
3.3. Lightcurve Analysis
For the sources that were included in the lightcurve fitting, frequencies corresponding to 100–2000 d were fitted to each of the lightcurves using the Lomb-Scargle periodogram. Sources that were considered for further analysis were those which fit the following criteria:
-
1.
A [3.6][4.5] color of which the standard deviation did not deviate by more than 50% to eliminate sources that were not clearly dustybbbSources that lacked 4.5 m measurements were still included in the final categorization and analysis. across epochs.
-
2.
A best-fit solution where the peak frequency within the Fourier power spectrum was more than 6% higher than any other peak.
-
3.
A best-fit solution constrained within a 95% confidence interval.
These three criteria determine which stars are included in further analysis. Stars excluded by these criteria are more likely to suffer from aliasing or poor data quality. The quality of the remaining sources was determined visually, with an eye for ensuring that the direction of brightness changes in the lightcurves matched the best-fit lightcurve, especially for short-term changes. The results of the lightcurve fitting are shown in Table 3, which includes the mid-line magnitudes, the fit periods and amplitudes for both 3.6 and 4.5 m data, the color properties and the classification confidence (described further below). An initial inspection of stars that pass these above three criteria indicate that, at these distances, we are only able to reliably determine pulsation periods of the dusty evolved sources using Spitzer.
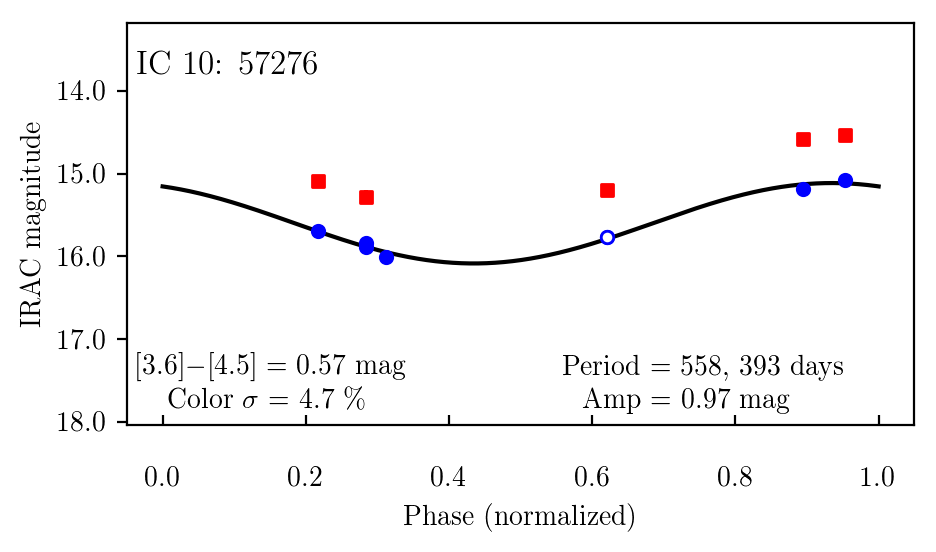
Variations in spatial coverage between epochs caused some stars to be observed in only one of the filters, either [3.6] or [4.5]. Some of these lightcurves can be augmented where [3.6] data does not exist by including the 4.5 m data and using the mean color to derive 3.6 m magnitudes. This was done only if the color was determined to be stable ( < 20%) and had at least three epochs with color values. We refer to these photometric points as “simulated” photometry and show them in our lightcurves as empty circles (Appendix A, Figure A1)cccThe displayed errors for the simulated photometry include the as well as the 4.5 m photometric uncertainties.. We have also fitted the lightcurves of any sources with at least six epochs of 4.5 m data similarly using simulated 4.5 m photometric values when possible. Only one source (IC 10 57276) did not have enough epochs to fulfill this requirement. These data are less sensitive (and therefore noisier), so we include them in Table 3 but use only the [3.6] data for further classification. For 65% of the full sample, the 3.6 and 4.5m periods are the same. For 87% of the sample, the periods agree to within 10%. For the remaining 11 sources, the standard deviation of the [3.6][4.5] color is large, and there is a difference in the number of epochs for all but two of the sources.
3.4. Lightcurve Categorization
The lightcurves that pass the three criteria listed in the previous section are further categorized based on our confidence in the fits. These fall into 4 categories, two each considered “high-confidence” and “low-confidence”. These groups are discussed further in Sections 4.1 and 4.2; the lightcurves of the high-confidence variables are shown in Appendix A.
High-confidence variables:
-
•
Reliable Fit (RF) sources with lightcurves that pass a visual inspection, meant to isolate sources with unique fit solutions.
-
•
LPV sources that do not necessarily have reliable fits but are clearly variable on long timescales; described further in Section 5.4.
Low-confidence variables:
-
•
Insufficient epochs (IE) variable sources with reliable fits but where the uniqueness of the fit is unclear.
-
•
Unreliable Fit (UF) variable sources that do not pass visual inspection.
| Galaxy | Initial | Var. | Dusty & | Low | High |
|---|---|---|---|---|---|
| sample | index > 2 | variable | conf. | conf. | |
| And IX | 16 | 2 | 1 | 0 | 0 |
| DDO 216 | 24,688 | 2,166 | 15 | 7 | 5 |
| IC 10 | 80,351 | 5,555 | 228 | 59 | 18 |
| IC 1613 | 311 | 96 | 27 | 5 | 15 |
| NGC 147 | 60,446 | 3,712 | 70 | 20 | 8 |
| NGC 185 | 53,011 | 3,506 | 58 | 4 | 29 |
| Sag DIG | 51 | 10 | 8 | 3 | 0 |
| Sextans A | 22,946 | 2,959 | 83 | 40 | 6 |
| Sextans B | 22,629 | 2,281 | 89 | 26 | 0 |
| WLM | 33,184 | 2,860 | 34 | 5 | 11 |
| Total | 308,083 | 24,160 | 613 | 169 | 92 |
Recall that both the high- and low-confidence variables have a of at least 95% (Section 3.3), yet additional information about the uniqueness or quality of the fit is taken into account. The sources categorized as insufficient epochs are sources where a unique fit solution to the unphased lightcurve is not visibly clear. This may include a lightcurve lacking temporal coverage towards the maximum or minimum of the lightcurve, or where a shorter pulsation period could plausibly fit the source. A source designated as an unreliable fit is typically one that has a change in brightness in several epochs that is in the opposite direction of the change in the best-fit unphased lightcurve, outside the value of the uncertainty. Figure B2 in Appendix B shows examples of an insufficient epochs source and unreliable-fit source.
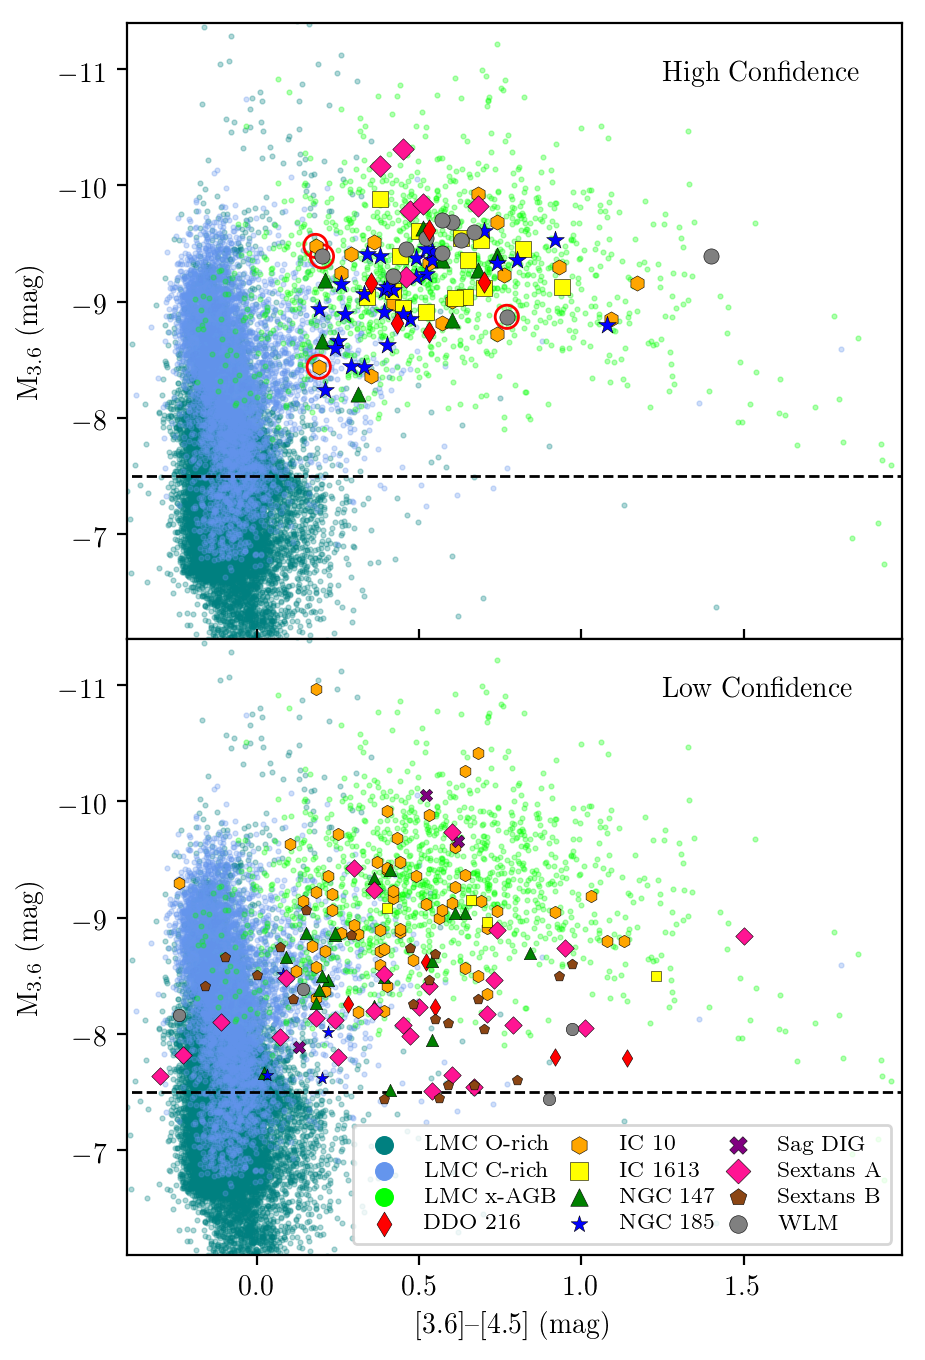
We show the average [3.6][4.5] vs. absolute 3.6 m magnitude color-magnitude diagram (CMD) of both high- and low-confidence sources in Figure 2. It is clear that we are only sensitive to the highly evolved and dusty x-AGB stars here as relatively dust-free C-AGB and O-AGB stars have smaller amplitude pulsations closer to the level of our photometric uncertainty (Riebel et al., 2015). We are also less sensitive to shorter period variables due to our observing cadence. As a result, we do not obtain any high-confidence variables with median [3.6][4.5] colors less than 0.1 mag and most of our measured pulsation periods are longer than 200 days.
Our final results include 92 high-confidence variables with 4 LPV and 88 reliable-fit sources with a median period of 437 d. Figure 3 shows the variability of our low- and high-confidence variables. Note that unreliable-fit sources cluster towards low variability index. We categorize the LPV sources as high-confidence variables but with a limited temporal baseline, we cannot definitively confirm their periodicity. The lightcurves of the low- and high-confidence variables are available for download in the electronic version and on VizieR.
| Galaxy | ID | IDLit. | RA | Dec | P | PLit. | Type | Flag |
|---|---|---|---|---|---|---|---|---|
| (deg) | (deg) | (d) | (d) | |||||
| IC 1613 | 95038 | 1093 | 16.24090 | 2.15469 | 318 | 305 | C | RF |
| IC 1613 | 142830 | 3198 | 16.18219 | 2.05673 | 395 | 370 | C | RF |
| NGC 147 | 68407 | 112 | 8.35656 | 48.55440 | 449 | 406 | RF | |
| NGC 147 | 112918 | 171 | 8.27302 | 48.47706 | 385 | C | RF | |
| NGC 147 | 113288 | 158 | 8.27241 | 48.50505 | 317 | 226 | C | IE |
| NGC 147 | 123715 | 161 | 8.25264 | 48.46111 | 335 | 371 | UF | |
| NGC 185 | 70862 | 009 | 9.79879 | 48.32867 | 196 | 277 | C | RF |
| NGC 185 | 77053 | 313 | 9.78671 | 48.35519 | 418 | 519 | RF | |
| NGC 185 | 83286 | 049 | 9.77481 | 48.38233 | 416 | 399 | M | RF |
| NGC 185 | 87065 | 062 | 9.76783 | 48.36058 | 226 | 219 | RF | |
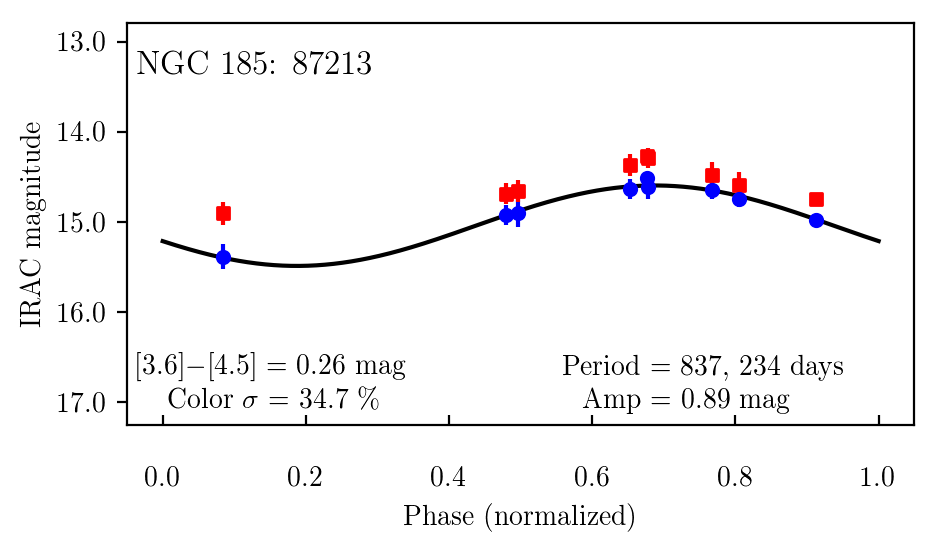
| NGC 185 | 87213 | 398 | 9.76754 | 48.35008 | 837 | 427 | RF | |
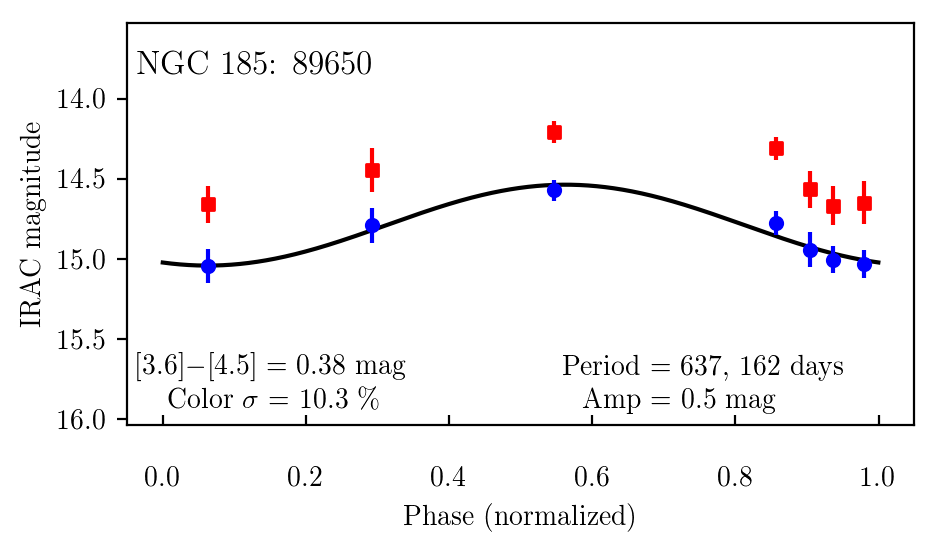
| NGC 185 | 89650 | 384 | 9.76315 | 48.32895 | 637 | 82 | S | RF |
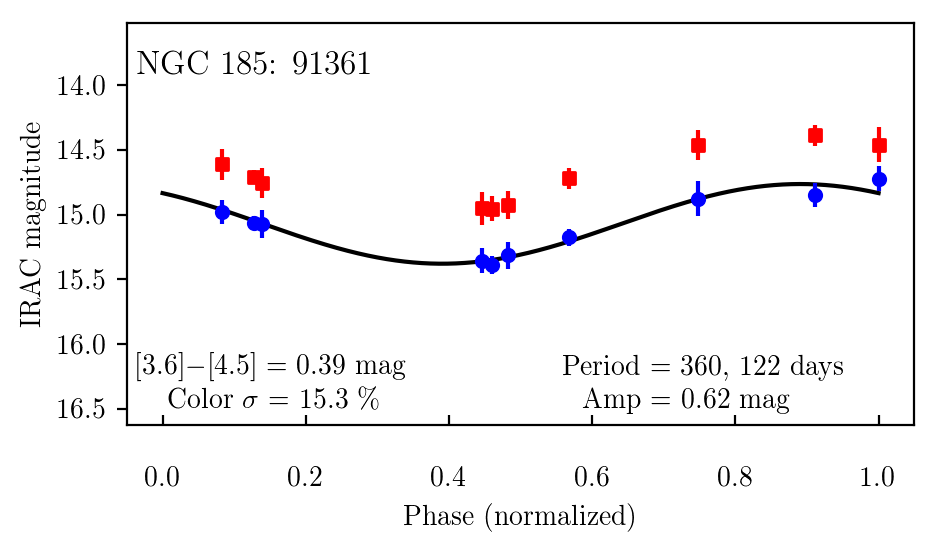
| NGC 185 | 91361 | 076 | 9.76007 | 48.31672 | 360 | 358 | C | RF |
| NGC 185 | 92015 | 078 | 9.75888 | 48.32191 | 416 | 420 | S | RF |
| NGC 185 | 95982 | 404 | 9.75180 | 48.32625 | 381 | 367 | RF | |
| NGC 185 | 96014 | 099 | 9.75173 | 48.32416 | 327 | 287 | C | RF |
| NGC 185 | 131142 | 249 | 9.68842 | 48.33260 | 227 | 231 | RF | |
| NGC 185 | 136723 | 160 | 9.67694 | 48.31031 | 347 | 361 | C | RF |
| NGC 185 | 132331 | 396 | 9.68612 | 48.35306 | 227 | 234 | C | UF |
4. Results
4.1. High-confidence variables
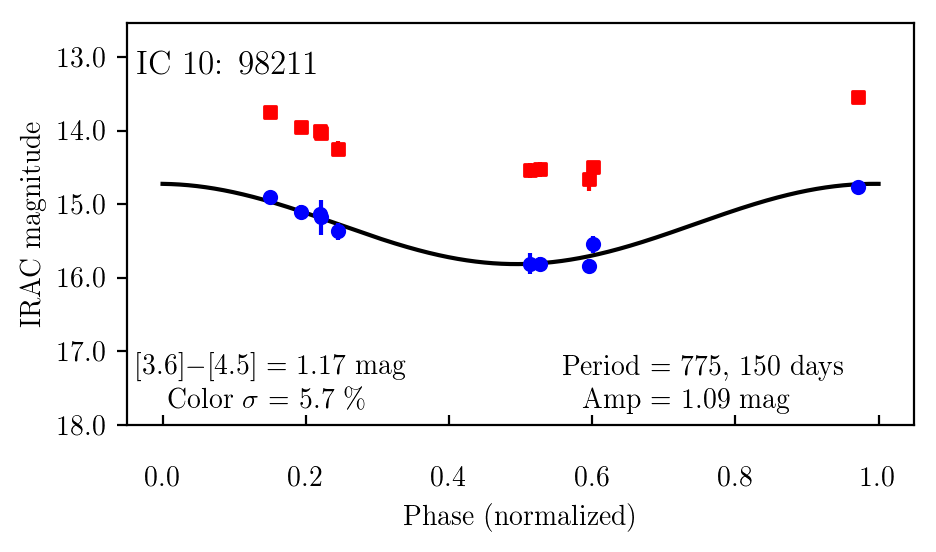
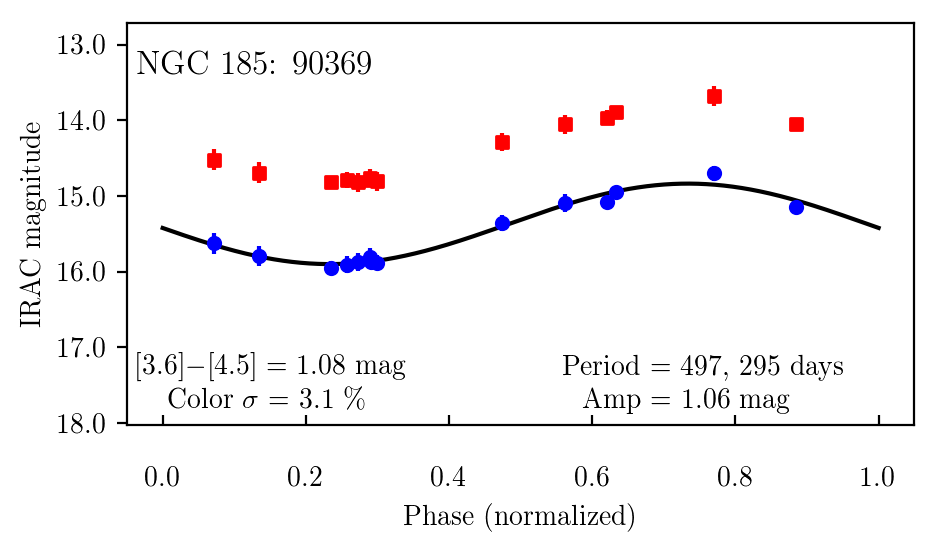
Figure 2 shows that the high-confidence variables occupy the same space as the x-AGB sources found in the SAGE program (Riebel et al., 2010). The reliable-fit sample has a median 3.6 m absolute magnitude of 9.2 0.26 (1). Four high-confidence variables have IR colors much redder than the rest of the sample ([3.6][4.5] > 1): IC 10 98211, IC 10 105991, NGC 185 90369, WLM 84699; their lightcurves, as well as the rest of the reliable-fit sources, are shown in Figure A1. We were not able to detect any reliable fits in And IX, Sextans B, or Sag DIG. This is not surprising given And IX and Sag DIG have limited temporal coverage and a small AGB population.
4.2. Low-confidence variable
The low-confidence sample is composed of 113 sources with insufficient epochs and 56 sources with unreliable fits. The low-confidence variables have a median absolute magnitude of 8.55 0.17 (1), which is low compared to most of the LMC x-AGB sample. Sextans B has 14 sources with insufficient epochs and 12 sources with unreliable fits. This may be the result of stochastic sampling. At fainter magnitudes the photometric uncertainty is higher, making it more difficult to detect changes in brightness. This likely indicates that some sources in the low-confidence sample are not LPVs but in fact YSOs and AGN, which sometimes show irregular variability in the IR. We expect that low-confidence sources that cluster together may be YSOs in a star formation region. Sources far from the galaxy center may be AGN. However, given the non-uniform positioning of the detectors and our sporadic temporal coverage, these sources are hard to disentangle (Paper I).
4.3. Detection statistics
Of sources that were included in our lightcurve analysis, we have isolated a small subset of them as potential AGB stars from their [3.6][4.5] color and variability alone. These sources have already been limited to those which have at least 6 epochs and are bright in the IR (M[3.6] < 7.5 mag). Table 4 shows the number of variable sources (Var. index > 2) in this sample, and the number of sources that were dusty ([3.6][4.5] > 0.2) and also variable. Many of the sources that we were not able to confirm as AGB stars may be less luminous and less dusty. These may have been confirmed as AGB stars given more observations.
In Paper II, we showed that our photometry is sensitive enough to detect variability down to peak-to-peak amplitudes of 0.15 mag. We have now compared the number of sources with high-confidence reliable fits that were covered in each epoch of the Cycle 11 observations with the number of 3 x-AGB stars from Paper II also found in that region (Appendix C). Of the 3 variables originally detected in Paper II and categorized as x-AGB stars, we have confirmed 19% as reliable fits and likely TP-AGB stars. The remaining Paper II variables are outside of our spatial footprints and/or have temporal coverage that is too sporadic to measure a reliable lightcurve. The variable star catalogs presented here should therefore be considered a representative subset of the total variable population in each galaxy.
LPVs have been previously detected in four of our galaxies: IC 1613 (Menzies, Whitelock & Feast, 2015), NGC 147, NGC 185 (Lorenz et al., 2011), and Sag DIG (Whitelock et al., 2018). We have classified nineteen of these previously detected sources as high-confidence LPVs. The pulsation periods measured in these works are comparable to those measured in this work (Table 5).
5. discussion
Our new sample of LPVs allows us to study the pulsation properties of evolved stars in metal-poor environments and how they are affected by other observable parameters. These results along with previous observations suggest that dust production is unaffected by metallicity.
5.1. Dust & Pulsation
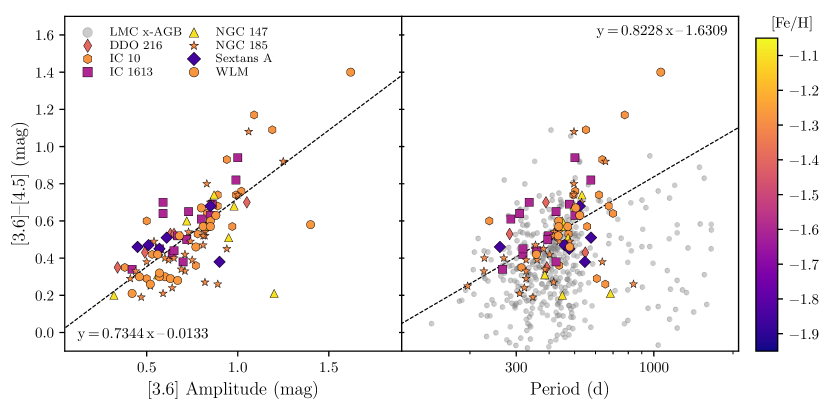
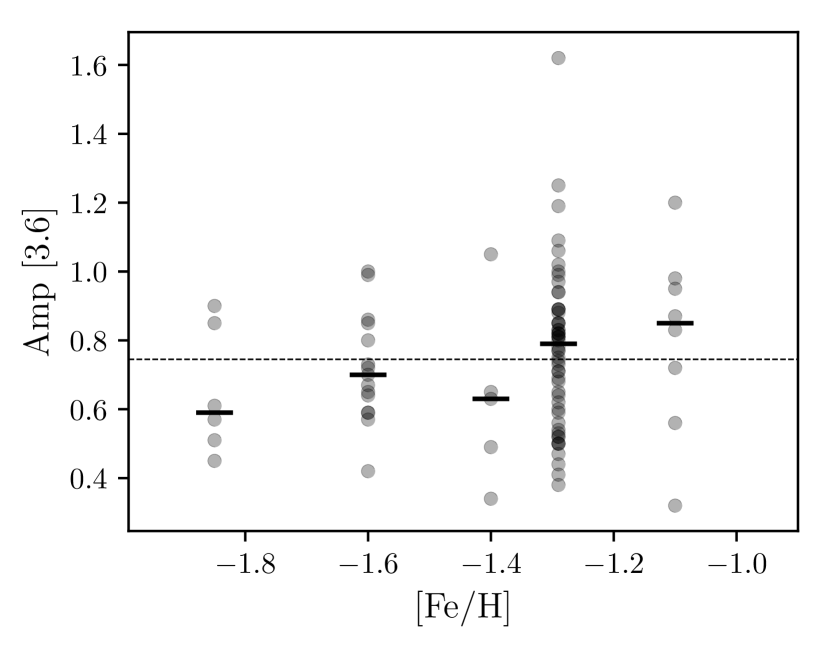
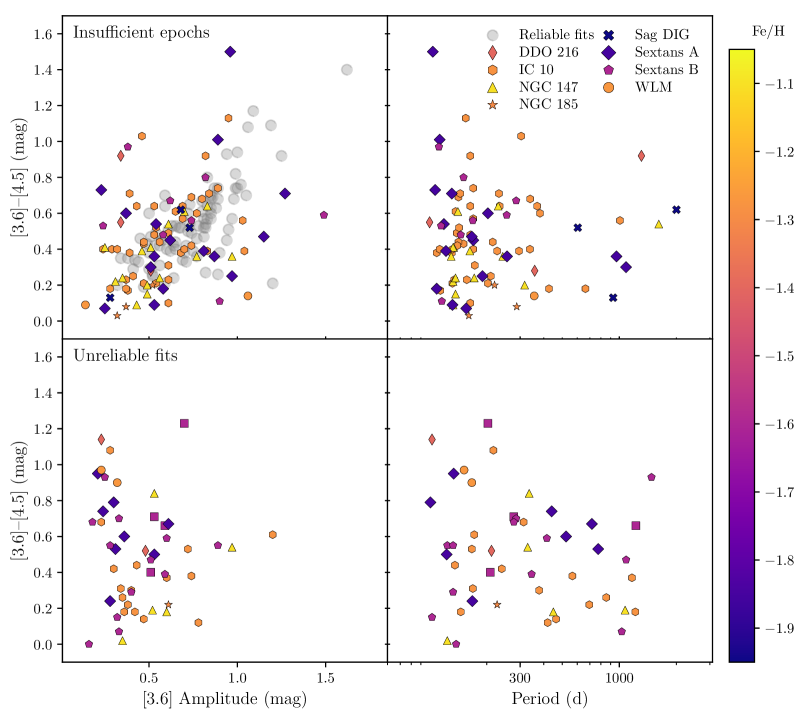
The [3.6][4.5] color has been shown to scale approximately with the dust content (Paper II; Riebel et al., 2015). Within our sample, both pulsation period and (especially) pulsation amplitude also correlate well with [3.6][4.5] colordddPulsation amplitude and period have also been seen to scale with mass-loss rate (Javadi et al., 2013; Goldman et al., 2017). (Figure 4). This correlation has been seen in more metal-rich samples in the galaxy, Magellanic Clouds, M33, and Sgr dSph (Whitelock et al., 2006; McQuinn et al., 2007; Javadi, van Loon & Mirtorabi, 2011a; McDonald et al., 2014; Riebel et al., 2015). Figure 5 shows our amplitudes with respect to metallicity. We see an apparent slight increase in median amplitude towards higher metallicity. This is however dominated by stochastic sampling especially at the metallicity extremes, and if real, would only result in an increase of 0.1 mag over the entire metallicity range of our sample. Based on these relationships, it follows that the dust production should also be unaffected by metallicity.
Uncertainties
There are uncertainties underlying our assumptions of dust production and metallicity. Given that most of our LPVs are expected to be carbon stars, we can only claim that dust production is unaffected by metallicity for carbon stars. The [3.6][4.5] color, a key metric in this analysis, will also depend on the dust temperature and wind speed, and the opacity of the dust may also differ at lower metallicities (McDonald et al., 2011, 2019). In determining the impact of metallicity on the dust production, we have assumed metallicities for our sample that were derived primarily from samples of RGB stars. These stars represent populations older and more metal-poor than our intermediate-mass LPVs. We expect the true metallicities of our LPVs to lie between these metallicities and ISM gas-phase oxygen abundances (shown in Table 1), yet neither show a correlation with amplitude.
5.2. Infrared – relation
Wood (2015) reviewed what is known about the – sequences of variable stars and suggests an evolutionary scenario with current mass decreasing towards longer period at a given luminosity. This allows us to follow the amount of mass that has been lost as a star moves towards the latest stages of its evolution.
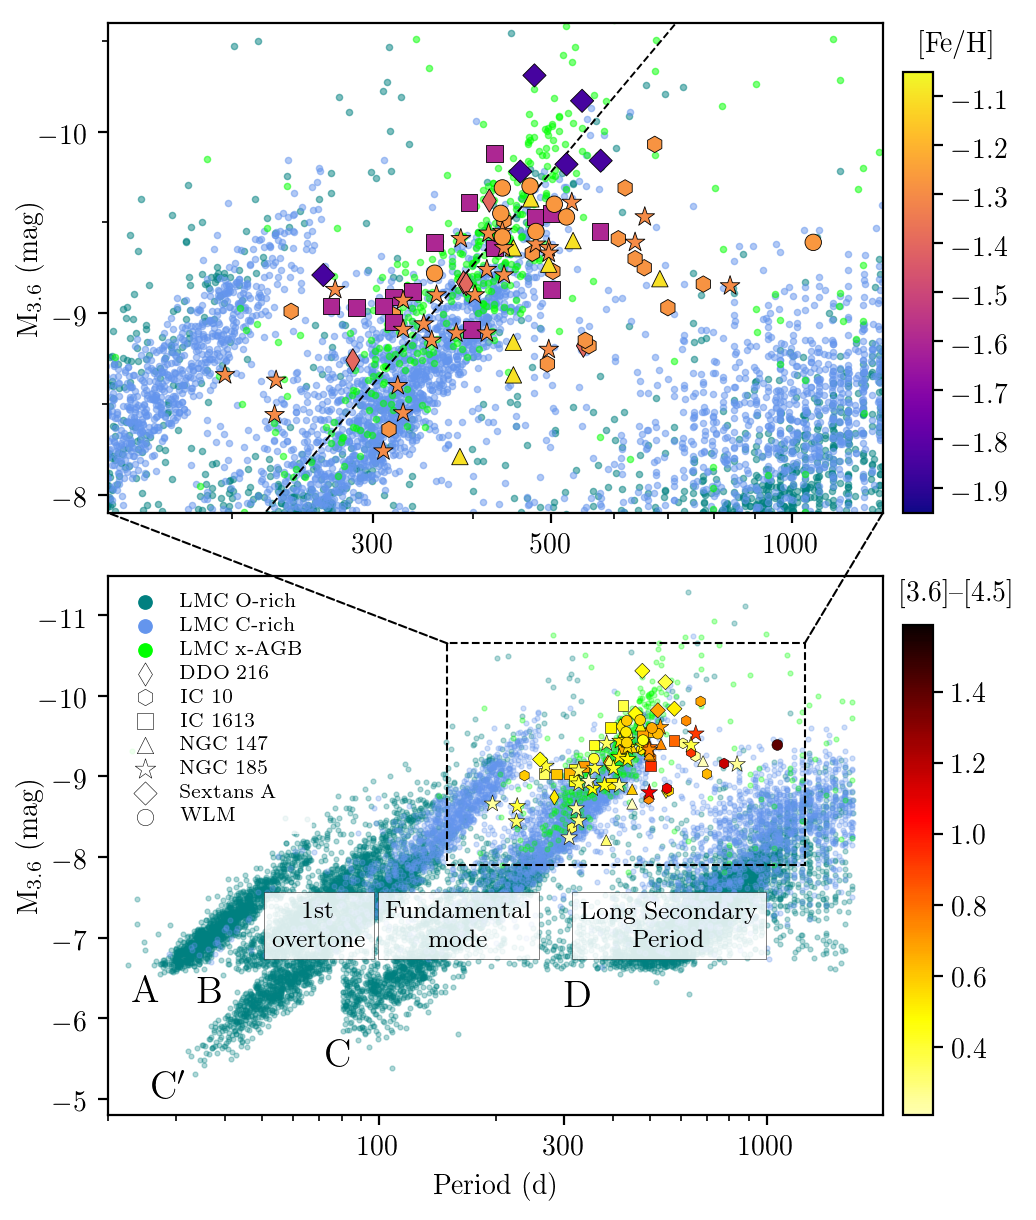
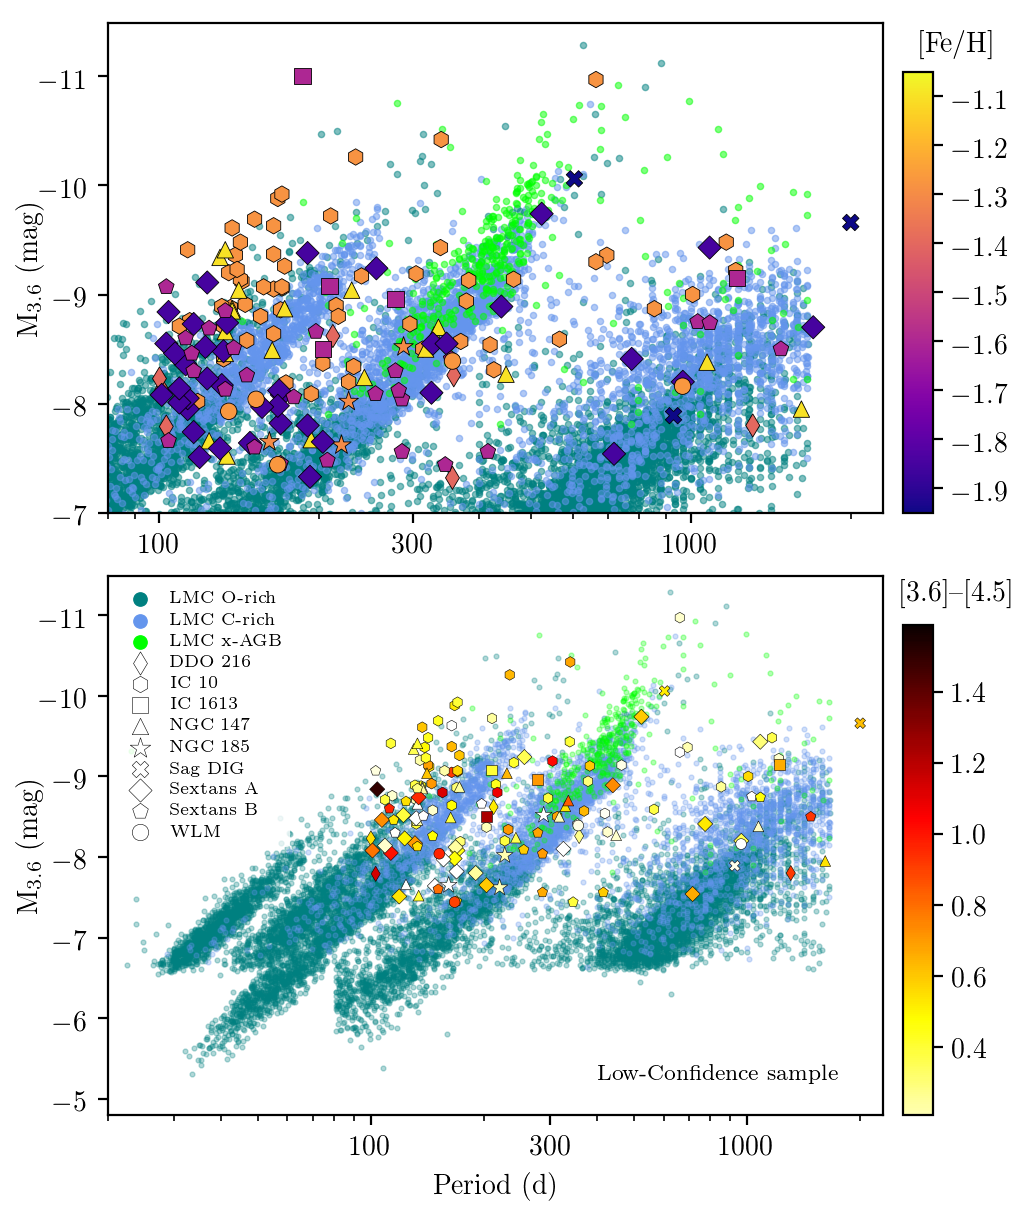
Figure 6 shows period with respect to luminosity for our LPVs, with [3.6][4.5] color and metallicity in color. Our sample spans 1 dex in metallicity, providing a first look at how the IR – relation behaves at very low metallicity. Compared to the SAGE+MACHO sample (Riebel et al., 2010), most of our LPVs follow the fundamental-mode sequence. We find that the reddest objects fall below the fundamental mode at 3.6 m, a phenomenon that has also been seen in LPVs in the Magellanic Clouds (Ita et al., 2004; Ita & Matsunaga, 2011) and IC 1613 (Whitelock, Kasliwal & Boyer, 2017). These sources, likely obscured by circumstellar extinction, have a decreased 3.6 m flux. IC 10, in particular, has a high number of reddened sources, which may be a combination of circumstellar and, to a lesser degree, interstellar extinction. IC 10 lies near the Galactic Plane and has an estimated interstellar extinction of AV 2.33 mag which has been measured using a CMD analysis (Weisz et al., 2014). This should cause a mean approximate shift of 0.2 mag in the IRAC magnitudes for which we have corrected for all sources in IC 10.
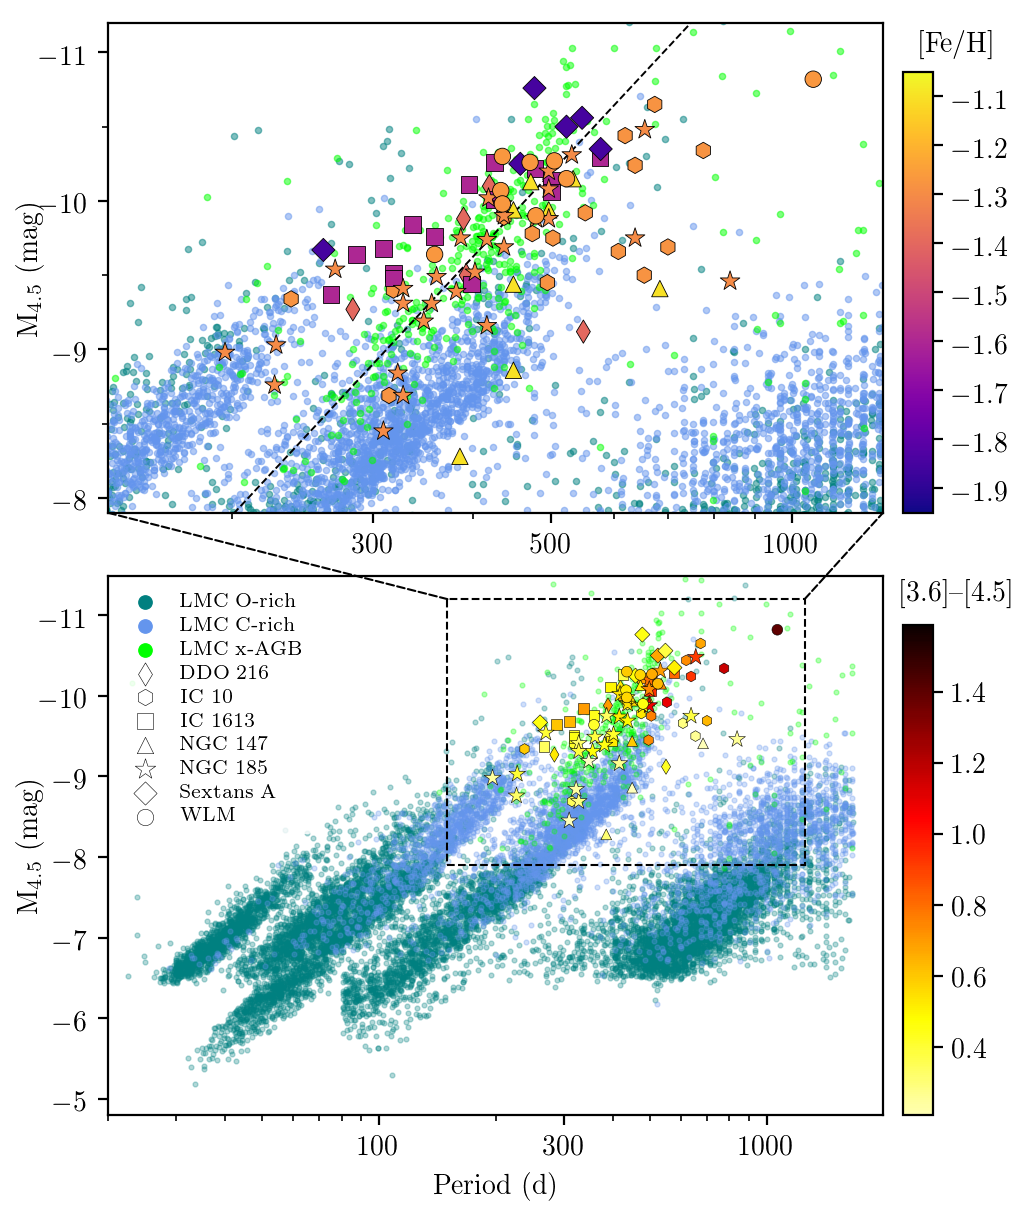

Our data suggest that, down to a [Fe/H] = 1.85, the – relation of the fundamental mode (at 3.6 m) is largely unaffected by metallicity. This suggests that the fundamental mode may be a robust tool for measuring distances to galaxies in the IR (e.g. Yuan et al., 2018). Since dusty AGB stars are among the brightest IR sources in galaxies, this technique can reach more distant galaxies than what can currently be measured with TRGB distance estimates. However, there is a 1 mag uncertainty in the absolute magnitude stemming from the width of the fundamental mode sequence at 3.6 m. The spread of the sequence may be a result of differences in the current mass, as a result of mass loss. For the DUSTiNGS reliable-fit sources and x-AGB stars in the LMC that are firmly on the fundamental mode, we calculate standard errors of the best fit of the x-AGB sample of 0.066 and 0.022, respectively. This excludes several shorter period and fainter LPVs, and several strongly affected by the circumstellar dust. The smaller standard error we calculate for the LMC sample is expected given the galaxy’s larger and more complete sample, and more accurately known interstellar extinction and distance. We modeled the LMC x-AGB – relation with 3 parameters: the slope, the intercept, and the intrinsic scatter. We used a 1st order Student t likelihood function, which has more weight in the tails than a Gaussian, and is therefore less vulnerable to the effects of outliers (Galliano, 2018). We sampled this likelihood function using PyMC3, a Monte Carlo Markov Chain package for Python (Salvatier, Wieckiâ & Fonnesbeck, 2016), with 5000 steps along 15 independent chains. Equation 1 shows the fit of the fundamental mode x-AGB sample, calculated with a scatter of ; the fit is also shown in Figure 6.
| (1) |
Using the intercept error, this translates to a 4% uncertainty on the distance to a galaxy measured using the LMC – relationship. This is smaller than the 8 uncertainty typically measured using the TRGB method (e.g. McQuinn et al., 2013), but uses only sources firmly on the fundamental mode. This may provide a more accurate tool at larger distances.
Using a similar approach as in Eq. 1, we have also fitted the same LMC x-AGB sample at 4.5 m with a scatter of :
| (2) |
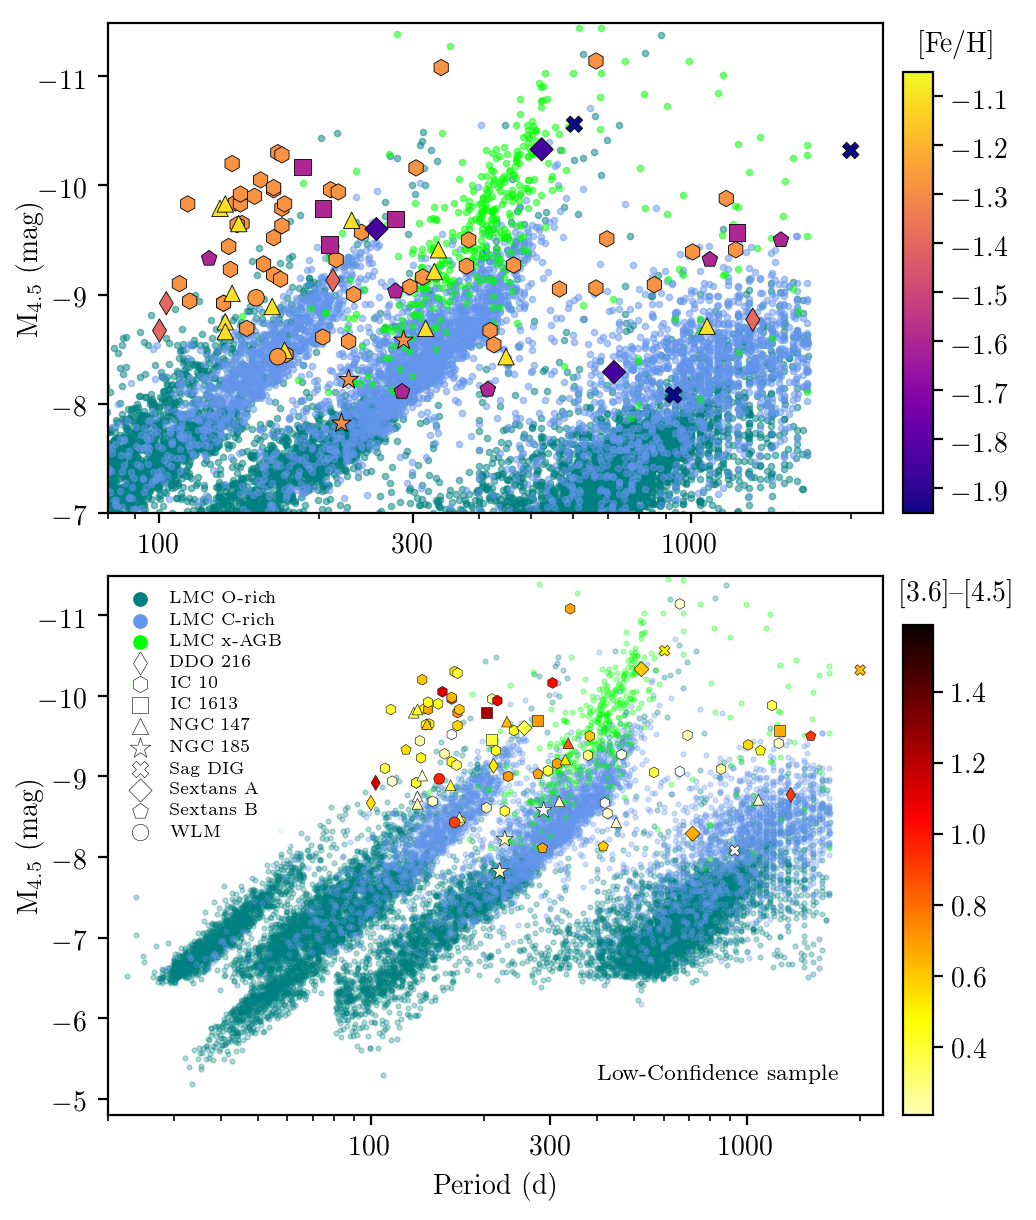
At 4.5 m (Figure 7) the reliable-fit LPVs appear to be associated with a shifted fundamental-mode sequence, significantly affected by circumstellar dust. This dust will veil molecular features like CO, known to affect the – relation in Cepheids (Blum et al., 2014; Scowcroft et al., 2011). This shift off of the fundamental mode suggests that it may be more challenging to use this wavelength region for measuring distance using the brightest and dustiest stars.
5.3. Classification of stellar chemistry with the Hubble Space Telescope
Some of our reliable-fit LPV sources were previously observed with the Hubble Space Telescope (HST; Paper IV); Figure C1 in Appendix C shows the footprints of these observations. Medium-band optical photometry in the F127M, F139M, and F153M bands were used to categorize evolved stars by their chemical type (Paper IV). For our sample of reliable-fit LPVs, eight have HST counterparts with chemical types, all of which were found to be carbon-rich (Table 6). We found counterparts for nine sources with insufficient epochs, which include two oxygen-rich sources, and seven carbon-rich sources with unreliable fits. Theoretical models predict that most of these AGB populations will be dominated by carbon stars (Paper IV), with many fewer higher-mass oxygen-rich sources a result of their metal-poor environments (Dell’Agli et al., 2016, 2018, 2019) and star formation histories (Javadi et al., 2017; Hamedani Golshan et al., 2017; Goldman et al., 2018; Hashemi, Javadi & van Loon, 2019). Additionally, they may be too obscured in the near-IR, lack sufficient temporal coverage, or were not covered in the HST observations. The fact that oxygen-rich LPVs have not been detected here is not proof that they do not exist.
| (1) | (2) | (3) | (4) | (5) | (6) | (7) | (8) | (9) | (10) | (11) | (12) | (13) |
|---|---|---|---|---|---|---|---|---|---|---|---|---|
| Galaxy | ID | RA | Dec | Type | Period | [3.6] amp | F127M | F139M | F153M | [3.6] | [4.5] | Flag |
| (d) | (mag) | (mag) | (mag) | (mag) | (mag) | (mag) | ||||||
| NGC 147 | 68407 | 00:33:25.61 | +48:33:15.1 | C | 449 | 0.83 | 20.18 | 19.71 | 19.35 | 14.98 | 14.43 | RF |
| NGC 147 | 112918 | 00:33:05.55 | +48:28:37.2 | C | 385 | 0.54 | 19.45 | 19.09 | 18.80 | 16.24 | 15.94 | RF |
| DDO 216 | 96974 | 23:28:41.54 | +14:44:45.9 | C | 392 | 0.34 | 19.76 | 19.24 | 18.94 | 15.70 | 15.35 | RF |
| DDO 216 | 98916 | 23:28:40.97 | +14:44:01.3 | C | 283 | 0.63 | 20.36 | 19.90 | 19.48 | 16.08 | 15.55 | RF |
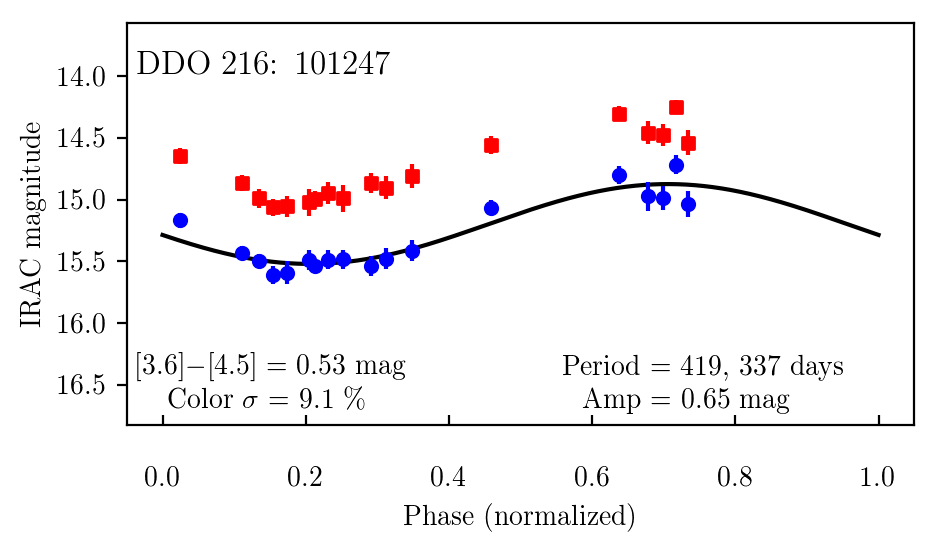
| DDO 216 | 101247 | 23:28:40.29 | +14:44:38.1 | C | 419 | 0.65 | 19.26 | 18.80 | 18.33 | 15.29 | 14.76 | RF |
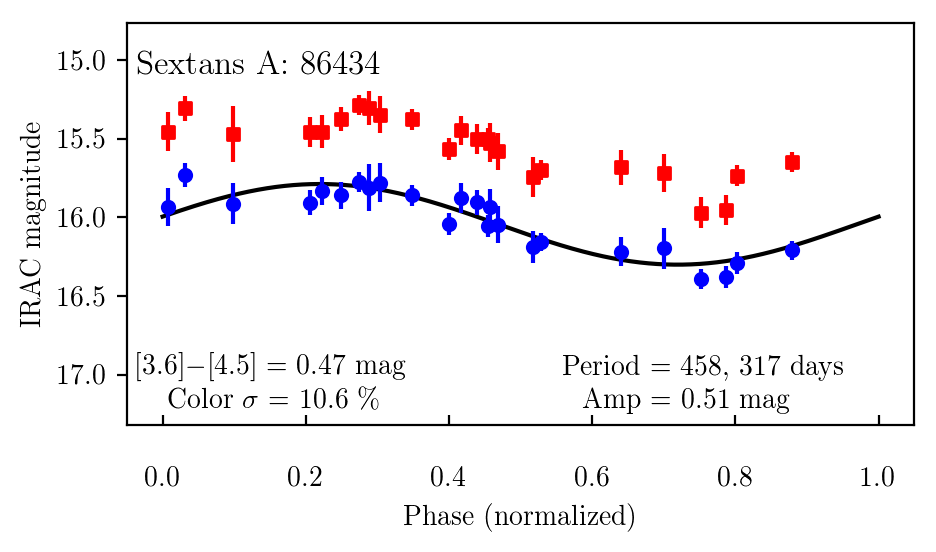
| Sextans A | 86434 | 10:11:00.77 | 04:41:54.0 | C | 458 | 0.51 | 20.18 | 19.71 | 19.54 | 16.01 | 15.54 | RF |
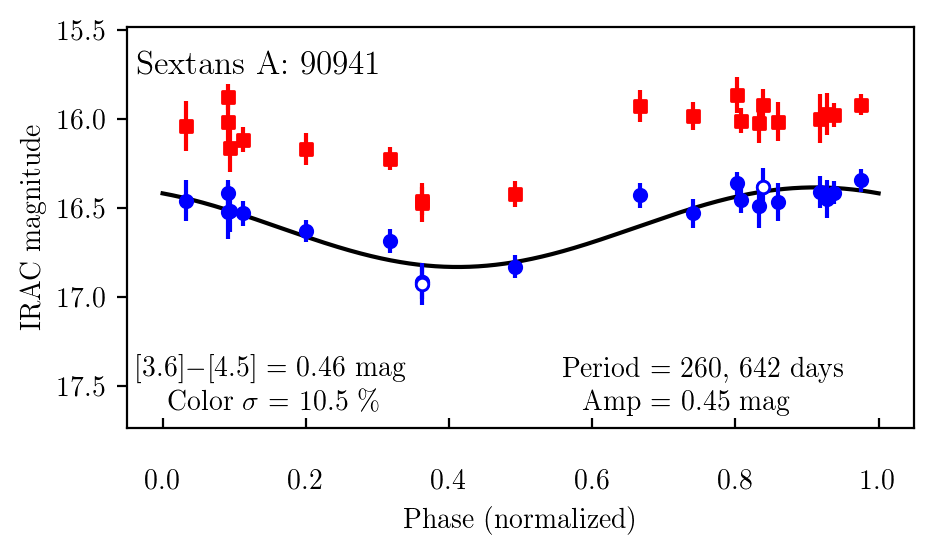
| Sextans A | 90941 | 10:10:59.20 | 04:42:23.0 | C | 260 | 0.45 | 20.27 | 19.82 | 19.67 | 16.53 | 16.07 | RF |
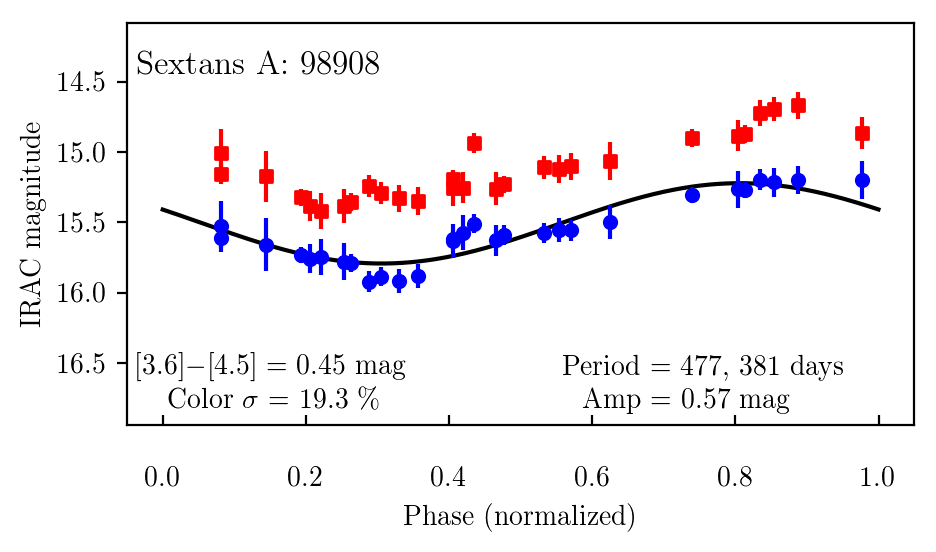
| Sextans A | 98908 | 10:10:56.45 | 04:41:33.0 | C | 477 | 0.57 | 20.27 | 19.79 | 19.41 | 15.57 | 15.12 | RF |
| IC 10 | 101088 | 00:20:15.71 | +59:16:00.9 | C | 215aafootnotemark: | 0.56 | 19.99 | 19.47 | 19.19 | 15.70 | 15.33 | IE |
| IC 10 | 101812 | 00:20:15.24 | +59:15:59.3 | C | 210aafootnotemark: | 0.41 | 18.90 | 18.33 | 18.08 | 14.89 | 14.68 | IE |
| IC 10 | 109003 | 00:20:10.26 | +59:20:10.4 | C | 170aafootnotemark: | 0.32 | 18.07 | 17.65 | 17.46 | 14.65 | 14.27 | IE |
| IC 10 | 109003 | 00:20:10.17 | +59:20:11.6 | M | 170aafootnotemark: | 0.32 | 19.54 | 19.24 | 18.80 | 14.65 | 14.27 | IE |
| IC 10 | 111369 | 00:20:08.84 | +59:16:57.6 | C | 170aafootnotemark: | 0.69 | 19.22 | 18.70 | 18.47 | 15.58 | 15.03 | IE |
| IC 10 | 117441 | 00:20:04.56 | +59:21:11.8 | C | 132aafootnotemark: | 0.44 | 18.54 | 18.15 | 17.98 | 15.92 | 15.74 | IE |
| NGC 147 | 55735 | 00:33:32.28 | +48:32:47.3 | C | 133aafootnotemark: | 0.31 | 18.69 | 18.34 | 18.20 | 15.92 | 15.70 | IE |
| NGC 147 | 113288 | 00:33:05.40 | +48:30:18.1 | C | 317aafootnotemark: | 0.49 | 18.08 | 17.69 | 17.55 | 15.83 | 15.63 | IE |
| Sag DIG | 44334 | 19:29:57.95 | 17:40:17.0 | M | 2000aafootnotemark: | 0.68 | 18.03 | 17.72 | 17.26 | 14.88 | 14.26 | IE |
| IC 10 | 65446 | 00:20:39.81 | +59:16:39.2 | C | 854aafootnotemark: | 0.35 | 19.52 | 19.04 | 18.73 | 15.79 | 15.53 | UF |
| IC 10 | 65548 | 00:20:39.74 | +59:17:25.3 | C | 136aafootnotemark: | 0.43 | 19.84 | 19.37 | 19.03 | 15.73 | 15.33 | UF |
| IC 10 | 73607 | 00:20:34.08 | +59:15:58.1 | C | 695aafootnotemark: | 0.41 | 19.40 | 18.89 | 18.53 | 15.32 | 15.10 | UF |
| IC 10 | 107394 | 00:20:11.34 | +59:21:14.5 | C | 555aafootnotemark: | 0.80 | 20.14 | 19.64 | 19.39 | 16.01 | 15.58 | UF |
| IC 10 | 114178 | 00:20:06.78 | +59:19:57.2 | C | 378aafootnotemark: | 0.40 | 19.46 | 18.99 | 18.66 | 15.70 | 15.37 | UF |
| Sextans A | 91449 | 10:10:59.05 | 04:40:14.0 | C | 524aafootnotemark: | 0.36 | 20.61 | 20.07 | 19.77 | 16.07 | 15.47 | UF |
| IC 10 | 103079 | 00:20:14.25 | +59:19:07.0 | C | 18.93 | 18.41 | 18.20 | 15.14 | 14.98 | LPV |
aafootnotemark: Value unlikely due to the low-confidence of the fit solution
5.4. Individual sources
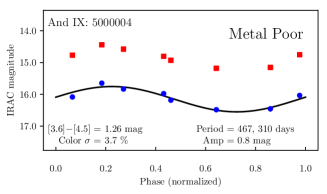
We have discovered several sources with particularly interesting lightcurves (Figure 8). And IX is the most metal-poor galaxy in our sample, and we detected one LPV candidate, And IX 5000004, which has a clear variability and is one of the reddest sources in our sample. It lies near the outer regions of M31’s disk at 37 kpc from the galaxy’s center and, while unlikely, could be a metal-rich M31 interloper. More epochs are needed to constrain the precise period, and spectroscopy is needed to confirm its membership to And IX.
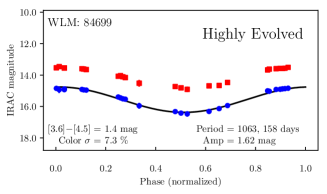
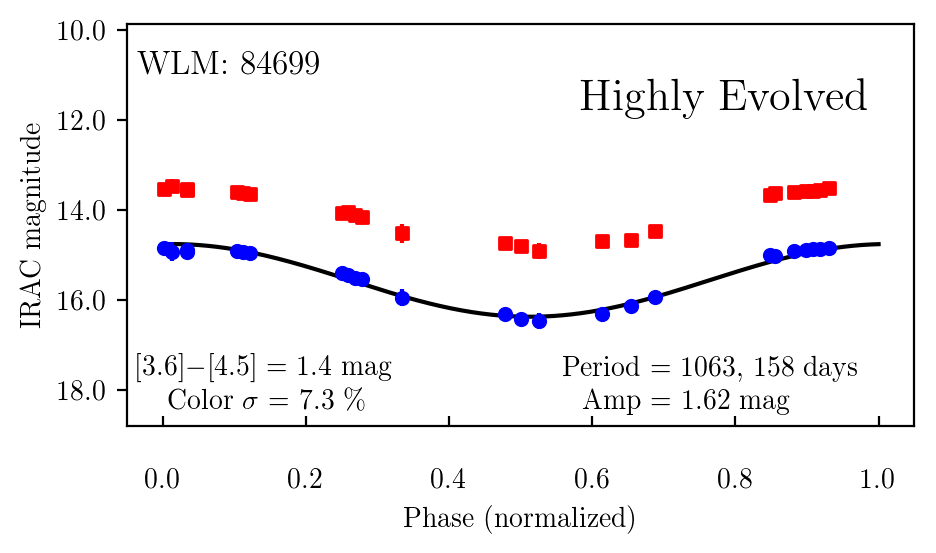
WLM 84699 is our most massive source, with a pulsation period of 1063 days, fitted peak-to-peak pulsation amplitude of 1.62 mag at 3.6 m and a [3.6][4.5] color of 1.6 mag. This is indicative of a very late stage of evolution, a high mass-loss rate, and a high dust-production rate. This source was also analyzed in Karambelkar et al. (2019) and lies between the lower mass population of Mira variables, and what they claim are massive AGB stars, in the – diagram. These massive AGB stars are also in galaxies with younger populations than WLM, making it a particularly interesting target for spectroscopic follow-up and an analysis of the source’s dust composition.
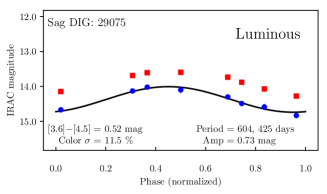
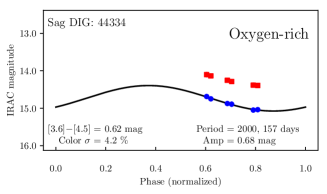
While not as evolved, Sag DIG 29075 is our most luminous source and also quite metal-poor, but more observations are needed to constrain the period. Another source within Sag DIG, 44334, was previously categorized in Paper IV as oxygen-rich, making it one of the most metal-poor and dusty oxygen-rich evolved stars known. This source has a known pulsation period of 950 days from ground-based observations in the near-IR (Whitelock et al., 2018). We lack enough IR data to further constrain the period. However, the clear variable nature of the source together with its red color strongly suggest that it is producing dust.
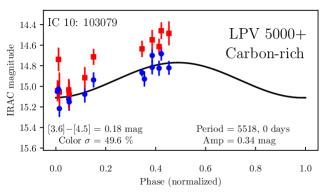
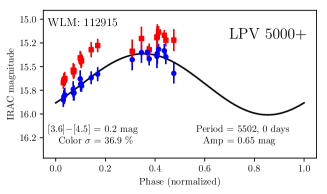
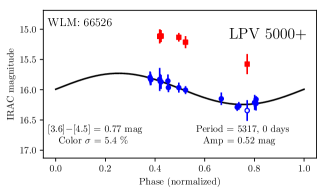
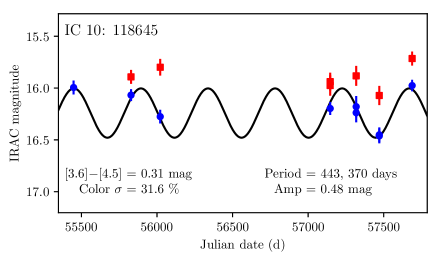
The remaining four sources in Figure 8 have been categorized as LPV , and show a gradual change over the entirety of the lightcurve. While these sources may be shorter-period evolved stars with a coincidental cadence, they may also have dominant pulsation periods that are considerably longer than a typical AGB star (P 2000 d), or may just be growing or diminishing in brightness, with no periodicity. Only one of the LPV sources (IC 10 103079) has been confirmed as carbon-rich and thus an AGB star (Paper IV).
5.5. Long secondary period
Distinct from the LPV are sources with long secondary periods (LSPs). The sequence hosts less-evolved stars as well as TP-AGB stars, with periods between 400–1200 days. Recent work by Wood (2015) and Trabucchi et al. (2017, 2018) has improved our understanding of how stars evolve along these sequences, but the mechanism that drives the LSP is still unclear. It is now known that stars with primary periods associated with the LSP, sequence D, have secondary periods that lie in the middle of the first overtone sequence made up of B and C′. The reason for the appearance of the sequence D period in these stars is unknown, but may arise from convection, binarity or changes in the internal chemistry of the star (Nicholls et al., 2009; Mathias et al., 2018). The pulsation behavior of our LPV sources may be that of an LSP.
5.6. High-redshift dust
Our observations provide further evidence of the evolved nature of the dusty sources found in metal poor galaxies, and for significant AGB dust production in these environments. The lowest metallicities of our LPV sample are characteristic of galaxies 12.3 Gyr ago and redshifts of 5 (Rafelski et al., 2012; Poudel et al., 2017). Paper IV identified both carbon- and oxygen-rich evolved stars at low metallicity. As luminous oxygen-rich sources are more massive than their lower mass carbon-rich counterparts, they are capable of injecting dust into the ISM as early as 30 Myr after forming (for a 10 M⊙ star), while carbon stars are expected to take longer (as soon as 200–300 Myr; Sloan et al., 2009). Most dust evolution models ignore dust produced by metal-poor oxygen-rich stars.
While we expect that AGB stars may produce dust in this regime, it is unclear whether they are the dominant dust producers. Supernovae may produce considerable dust; however, their net contribution is still unclear due to the unknown efficiency of dust destruction (Temim et al., 2015; Lakićević et al., 2015). Another alternative is dust produced by grain growth within the ISM (Zhukovska, Gail & Trieloff, 2008). However, a theory as to how the grains grow and what seeds their nucleation has yet to be identified. While the pulsation properties and 3–5 m observations highlight the important role that AGB stars play in dust production, longer wavelength observations are critical to constraining the amount of cooler dust surrounding these stars. More observations are needed to confirm that AGB stars are capable of producing dust out to 6. The soon-to-launch James Webb Space Telescope (JWST) will allow us to study Local Group AGB samples in much greater detail. In particular, observations with the JWST Mid-InfraRed Instrument (MIRI; Rieke et al., 2015) will be able to obtain photometry for every star in this sample out to 25 m (Jones et al., 2017).
6. Conclusion
This survey has provided the first infrared lightcurves of dusty evolved stars in metal-poor environments. We surveyed ten metal-poor dwarf galaxies within 1.5 Mpc at 3.6 and 4.5 m. By combining our multi-epoch observations with archival observations, we identified the dustiest evolved AGB stars within these galaxies, sources that may have been missed in the near-IR or optical surveys due to dust obscuration. We have identified 88 sources in seven of these galaxies as high-confidence LPV candidates, eight of which have been confirmed as carbon-rich.
We find that metallicity does not seem to have a strong impact on AGB pulsation or dust production. This has implications for the dust seen at high redshift and the origin of dust in the early Universe. We also find that the fundamental mode of the IR – relationship seems unaffected by metallicity, at least between one half and one hundredth solar. This suggests that the – relation can be a useful tool in measuring distance. With IR observations with JWST, the – relation can be used to confirm distances to Type Ia supernovae in distant galaxies, providing additional constraints on the Hubble constant ().
References
- Alcock et al. (1997) Alcock C. et al., 1997, ApJ, 486, 697
- Bellazzini et al. (2014) Bellazzini M. et al., 2014, A&A, 566, A44
- Bladh et al. (2015) Bladh S., Höfner S., Aringer B., Eriksson K., 2015, A&A, 575, A105
- Blum et al. (2006) Blum R. D. et al., 2006, AJ, 132, 2034
- Blum et al. (2014) Blum R. D., Srinivasan S., Kemper F., Ling B., Volk K., 2014, AJ, 148, 86
- Boyer et al. (2015a) Boyer M. L. et al., 2015a, ApJ, 800, 51
- Boyer et al. (2015b) Boyer M. L. et al., 2015b, ApJS, 216, 10
- Boyer et al. (2017) Boyer M. L. et al., 2017, ApJ, 851, 152
- Clement et al. (2001) Clement C. M. et al., 2001, AJ, 122, 2587
- Dell’Agli et al. (2016) Dell’Agli F., Di Criscienzo M., Boyer M. L., García-Hernández D. A., 2016, MNRAS, 460, 4230
- Dell’Agli et al. (2019) Dell’Agli F., Di Criscienzo M., García-Hernández D. A., Ventura P., Limongi M., Marini E., Jones O. C., 2019, MNRAS, 482, 4733
- Dell’Agli et al. (2018) Dell’Agli F., Di Criscienzo M., Ventura P., Limongi M., García-Hernández D. A., Marini E., Rossi C., 2018, MNRAS, 479, 5035
- Doherty et al. (2015) Doherty C. L., Gil-Pons P., Siess L., Lattanzio J. C., Lau H. H. B., 2015, MNRAS, 446, 2599
- Eddington (1913) Eddington A. S., 1913, MNRAS, 73, 359
- Evans & Gehrz (2012) Evans A., Gehrz R. D., 2012, Bulletin of the Astronomical Society of India, 40, 213
- Fazio et al. (2004) Fazio G. G. et al., 2004, ApJS, 154, 10
- Feast, Whitelock & Menzies (2002) Feast M., Whitelock P., Menzies J., 2002, MNRAS, 329, L7
- Feast et al. (1989) Feast M. W., Glass I. S., Whitelock P. A., Catchpole R. M., 1989, MNRAS, 241, 375
- Ferrarotti & Gail (2006) Ferrarotti A. S., Gail H.-P., 2006, A &A, 447, 553
- Freedman et al. (2011) Freedman W. L. et al., 2011, AJ, 142, 192
- Gallart et al. (2004) Gallart C., Aparicio A., Freedman W. L., Madore B. F., Martínez-Delgado D., Stetson P. B., 2004, AJ, 127, 1486
- Galliano (2018) Galliano F., 2018, MNRAS, 476, 1445
- Gehrz et al. (2007) Gehrz R. D. et al., 2007, Review of Scientific Instruments, 78, 011302
- Gerasimovič (1928) Gerasimovič B. P., 1928, PNAS, 14, 963
- Glass et al. (2009) Glass I. S., Schultheis M., Blommaert J. A. D. L., Sahai R., Stute M., Uttenthaler S., 2009, MNRAS, 395, L11
- Goldman et al. (2018) Goldman S. R. et al., 2018, MNRAS, 473, 3835
- Goldman et al. (2017) Goldman S. R. et al., 2017, MNRAS, 465, 403
- Gordon et al. (2011) Gordon K. D. et al., 2011, AJ, 142, 102
- Hamedani Golshan et al. (2017) Hamedani Golshan R., Javadi A., van Loon J. T., Khosroshahi H., Saremi E., 2017, MNRAS, 466, 1764
- Harris (1996) Harris W. E., 1996, AJ, 112, 1487
- Hashemi, Javadi & van Loon (2019) Hashemi S. A., Javadi A., van Loon J. T., 2019, MNRAS, 483, 4751
- Herwig (2005) Herwig F., 2005, ARA&A, 43, 435
- Höfner & Olofsson (2018) Höfner S., Olofsson H., 2018, A&A Rev., 26
- Huang et al. (2018) Huang C. D. et al., 2018, ApJ, 857, 67
- Hughes & Wood (1990) Hughes S. M. G., Wood P. R., 1990, AJ, 99, 784
- Ita & Matsunaga (2011) Ita Y., Matsunaga N., 2011, MNRAS, 412, 2345
- Ita et al. (2004) Ita Y. et al., 2004, MNRAS, 353, 705
- Ita et al. (2004) Ita Y. et al., 2004, MNRAS, 347, 720
- Javadi et al. (2015) Javadi A., Saberi M., van Loon J. T., Khosroshahi H., Golabatooni N., Mirtorabi M. T., 2015, MNRAS, 447, 3973
- Javadi et al. (2013) Javadi A., van Loon J. T., Khosroshahi H., Mirtorabi M. T., 2013, MNRAS, 432, 2824
- Javadi et al. (2017) Javadi A., van Loon J. T., Khosroshahi H. G., Tabatabaei F., Hamedani Golshan R., Rashidi M., 2017, MNRAS, 464, 2103
- Javadi, van Loon & Mirtorabi (2011a) Javadi A., van Loon J. T., Mirtorabi M. T., 2011a, MNRAS, 411, 263
- Javadi, van Loon & Mirtorabi (2011b) Javadi A., van Loon J. T., Mirtorabi M. T., 2011b, MNRAS, 414, 3394
- Jones et al. (2017) Jones O. C., Meixner M., Justtanont K., Glasse A., 2017, ApJ, 841, 15
- Karakas & Lattanzio (2014) Karakas A. I., Lattanzio J. C., 2014, PASA, 31, e030
- Karambelkar et al. (2019) Karambelkar V. R. et al., 2019, arXiv:1901.07179
- Kasliwal et al. (2017) Kasliwal M. M. et al., 2017, ApJ, 839, 88
- Kirby et al. (2017) Kirby E. N., Rizzi L., Held E. V., Cohen J. G., Cole A. A., Manning E. M., Skillman E. D., Weisz D. R., 2017, ApJ, 834, 9
- Kovács (2000) Kovács G., 2000, A&A, 363, 1
- Lagadec & Zijlstra (2008) Lagadec E., Zijlstra A. A., 2008, MNRAS, 390, L59
- Lakićević et al. (2015) Lakićević M. et al., 2015, ApJ, 799, 50
- Lebzelter & Wood (2005) Lebzelter T., Wood P. R., 2005, A&A, 441, 1117
- Lee et al. (2006) Lee H., Skillman E. D., Cannon J. M., Jackson D. C., Gehrz R. D., Polomski E. F., Woodward C. E., 2006, ApJ, 647, 970
- Liljegren et al. (2018) Liljegren S., ofner S. H., Freytag B., Bladh S., 2018, A&A, 619, A47
- Lomb (1976) Lomb N. R., 1976, Astrophysics and Space Science, 39, 447
- Lorenz et al. (2011) Lorenz D., Lebzelter T., Nowotny W., Telting J., Kerschbaum F., Olofsson H., Schwarz H. E., 2011, A&A, 532, 78
- Marigo et al. (2008) Marigo P., Girardi L., Bressan A., Groenewegen M. A. T., Silva L., Granato G. L., 2008, A&A, 482, 883
- Marigo et al. (2017) Marigo P. et al., 2017, ApJ, 835, 77
- Mateo (1998) Mateo M., 1998, ARA&A, 36, 435
- Mathias et al. (2018) Mathias P. et al., 2018, A&A, 615, A116
- McConnachie (2012) McConnachie A. W., 2012, AJ, 144, 4
- McDonald et al. (2019) McDonald I., Boyer M. L., Groenewegen M. A. T., Lagadec E., Richards A. M. S., Sloan G. C., Zijlstra A. A., 2019, MNRAS, 484, L85
- McDonald et al. (2011) McDonald I. et al., 2011, ApJS, 193, 23
- McDonald et al. (2018) McDonald I., De Beck E., Zijlstra A. A., Lagadec E., 2018, MNRAS, 481, 4984
- McDonald & Trabucchi (2019) McDonald I., Trabucchi M., 2019, arXiv:1901.06325
- McDonald et al. (2010) McDonald I., van Loon J. T., Dupree A. K., Boyer M. L., 2010, MNRAS, 405, 1711
- McDonald et al. (2014) McDonald I., Zijlstra A. A., Sloan G. C., Kerins E., Lagadec E., Minniti D., 2014, MNRAS, 439, 2618
- McQuinn et al. (2013) McQuinn K. B. W. et al., 2013, AJ, 146, 145
- McQuinn et al. (2007) McQuinn K. B. W. et al., 2007, ApJ, 664, 850
- Meixner et al. (2006) Meixner M. et al., 2006, AJ, 132, 2268
- Menzies et al. (2008) Menzies J., Feast M., Whitelock P., Olivier E., Matsunaga N., da Costa G., 2008, MNRAS, 385, 1045
- Menzies et al. (2011) Menzies J. W., Feast M. W., Whitelock P. A., Matsunaga N., 2011, MNRAS, 414, 3492
- Menzies, Whitelock & Feast (2015) Menzies J. W., Whitelock P. A., Feast M. W., 2015, MNRAS, 452, 910
- Menzies et al. (2010) Menzies J. W., Whitelock P. A., Feast M. W., Matsunaga N., 2010, MNRAS, 406, 86
- Momany et al. (2002) Momany Y., Held E. V., Saviane I., Rizzi L., 2002, A&A, 384, 393
- Nanni et al. (2013) Nanni A., Bressan A., Marigo P., Girardi L., 2013, MNRAS, 434, 2390
- Nanni et al. (2014) Nanni A., Bressan A., Marigo P., Girardi L., 2014, MNRAS, 438, 2328
- Nicholls et al. (2009) Nicholls C. P., Wood P. R., Cioni M. R. L., Soszyński I., 2009, MNRAS, 399, 2063
- Poudel et al. (2017) Poudel S., Kulkarni V. P., Morrison S., Péroux C., Som D., Rahmani H., Quiret S., 2017, MNRAS, 473, 3559
- Rafelski et al. (2012) Rafelski M., Wolfe A. M., Prochaska J. X., Neeleman M., Mendez A. J., 2012, ApJ, 755, 89
- Riebel et al. (2015) Riebel D. et al., 2015, ApJ, 807, 1
- Riebel et al. (2010) Riebel D., Meixner M., Fraser O., Srinivasan S., Cook K., Vijh U., 2010, ApJ, 723, 1195
- Rieke et al. (2015) Rieke G. H. et al., 2015, PASP, 127, 584
- Salvatier, Wieckiâ & Fonnesbeck (2016) Salvatier J., Wieckiâ T. V., Fonnesbeck C., 2016, Pymc3: Python probabilistic programming framework. Astrophysics Source Code Library
- Saviane et al. (2002) Saviane I., Rizzi L., Held E. V., Bresolin F., Momany Y., 2002, A&A, 390, 59
- Scargle (1982) Scargle J. D., 1982, ApJ, 263, 835
- Scowcroft et al. (2011) Scowcroft V., Freedman W. L., Madore B. F., Monson A. J., Persson S. E., Seibert M., Rigby J. R., Sturch L., 2011, ApJ, 743, 76
- Skillman, Terlevich & Melnick (1989) Skillman E. D., Terlevich R., Melnick J., 1989, MNRAS, 240, 563
- Sloan et al. (2016) Sloan G. C. et al., 2016, ApJ, 826, 44
- Sloan et al. (2010) Sloan G. C. et al., 2010, ApJ, 719, 1274
- Sloan et al. (2012) Sloan G. C. et al., 2012, ApJ, 752, 140
- Sloan et al. (2009) Sloan G. C. et al., 2009, Science, 323, 353
- Soszyński et al. (2009) Soszyński I. et al., 2009, AcA, 59, 239
- Stetson (1987) Stetson P. B., 1987, PASP, 99, 191
- Temim et al. (2015) Temim T., Dwek E., Tchernyshyov K., Boyer M. L., Meixner M., Gall C., Roman-Duval J., 2015, ApJ, 799, 158
- Trabucchi et al. (2017) Trabucchi M., Wood P. R., Montalbán J., Marigo P., Pastorelli G., Girardi L., 2017, ApJ, 847, 139
- Trabucchi et al. (2018) Trabucchi M., Wood P. R., Montalbán J., Marigo P., Pastorelli G., Girardi L., 2018, MNRAS, 482, 929
- Udalski, Kubiak & Szymański (1997) Udalski A., Kubiak M., Szymański M., 1997, AcA, 47, 319
- van Loon (2000) van Loon J. T., 2000, A&A, 354, 125
- van Loon (2006) van Loon J. T., 2006, in Astronomical Society of the Pacific Conference Series, Vol. 353, Stellar Evolution at Low Metallicity: Mass Loss, Explosions, Cosmology, Lamers H. J. G. L. M., Langer N., Nugis T., Annuk K., eds., p. 211
- van Loon, Marshall & Zijlstra (2005) van Loon J. T., Marshall J. R., Zijlstra A. A., 2005, A&A, 442, 597
- VanderPlas (2018) VanderPlas J. T., 2018, ApJS, 236, 16
- Weisz et al. (2014) Weisz D. R., Dolphin A. E., Skillman E. D., Holtzman J., Gilbert K. M., Dalcanton J. J., Williams B. F., 2014, ApJ, 789, 147
- Werner et al. (2004) Werner M. W. et al., 2004, ApJS, 154, 1
- Whitelock (2012) Whitelock P. A., 2012, Ap&SS, 341, 123
- Whitelock et al. (2006) Whitelock P. A., Feast M. W., Marang F., Groenewegen M. A. T., 2006, MNRAS, 369, 751
- Whitelock, Kasliwal & Boyer (2017) Whitelock P. A., Kasliwal M., Boyer M., 2017, in Catalan M., Gieren W., eds, European Physical Journal Web of Conferences Vol. 152, Wide-Field Variability Surveys: A 21st Century Perspective, 1009 (arXiv:1702.06797), Vol. 152
- Whitelock et al. (2018) Whitelock P. A., Menzies J. W., Feast M. W., Marigo P., 2018, MNRAS, 473, 173
- Whitelock et al. (2009) Whitelock P. A., Menzies J. W., Feast M. W., Matsunaga N., Tanabé T., Ita Y., 2009, MNRAS, 394, 795
- Wood (2015) Wood P. R., 2015, MNRAS, 448, 3829
- Wood et al. (1999) Wood P. R. et al., 1999, in Asymptotic Giant Branch Stars, IAU Symposium 191, Edited by T. Le Bertre, A. Lèbre, and C. Waelkens. ISBN: 1-886733-90-2 LOC: 99-62044., Vol. 191, p. 151
- Yuan et al. (2018) Yuan W., Macri L. M., Javadi A., Lin Z., Huang J. Z., 2018, AJ, 156, 112
- Zhukovska, Gail & Trieloff (2008) Zhukovska S., Gail H. P., Trieloff M., 2008, A&A, 479, 453
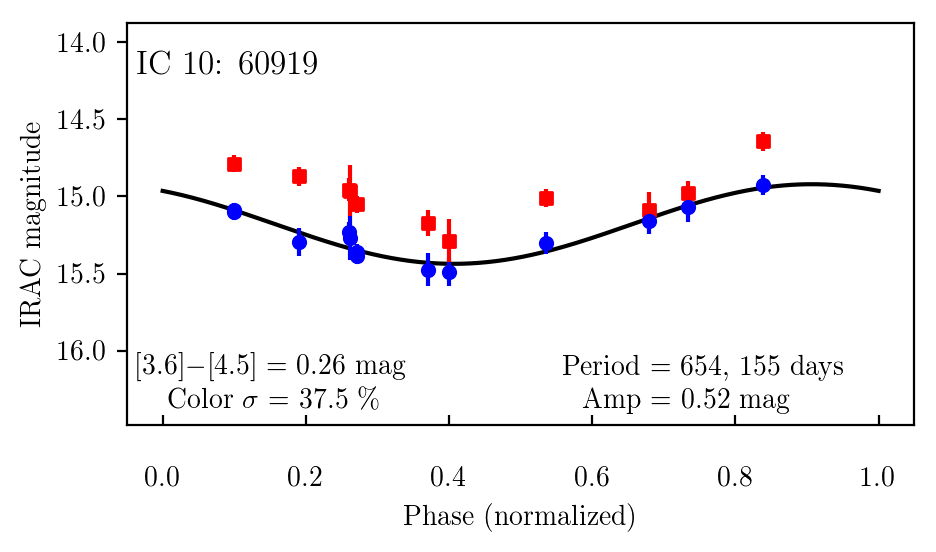
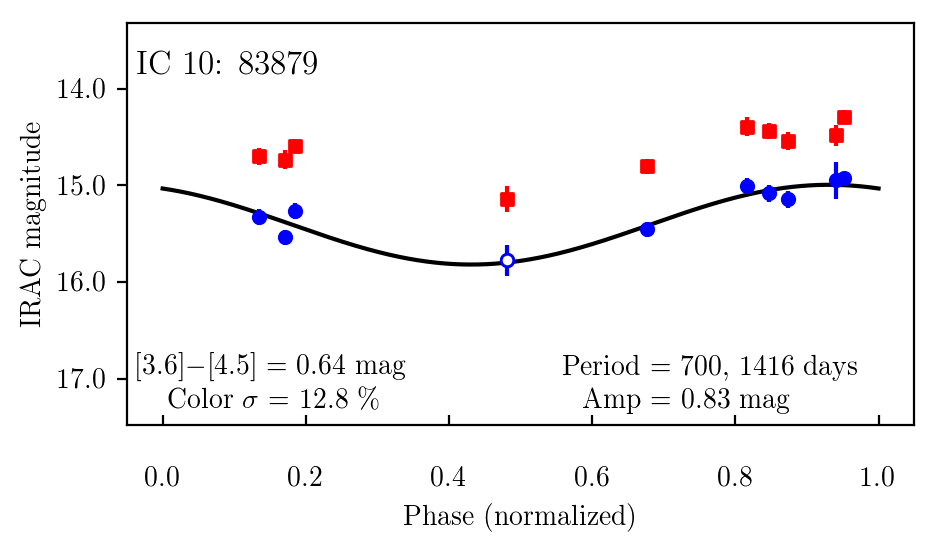
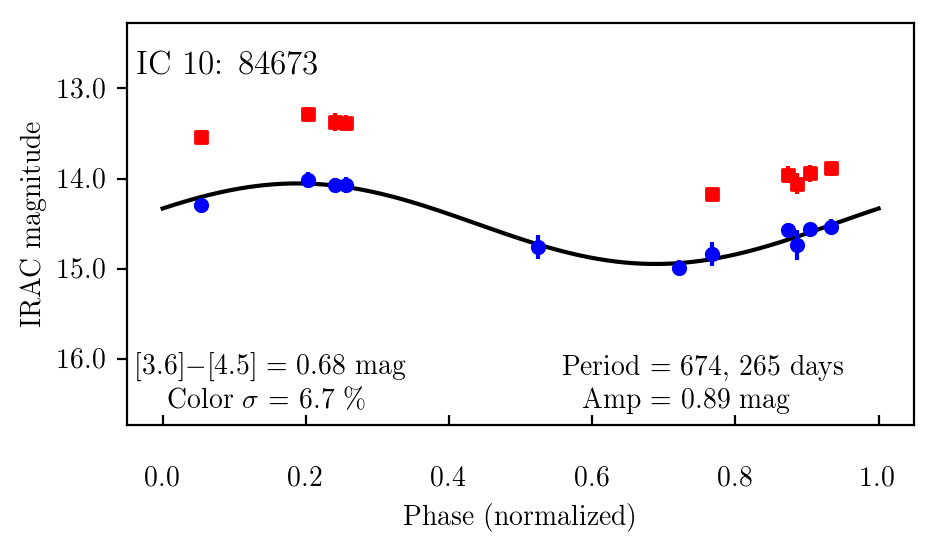
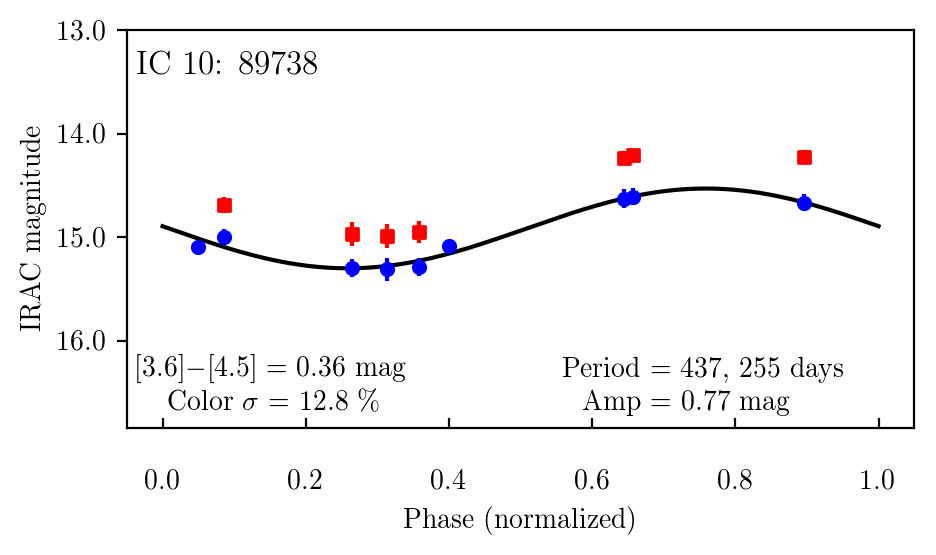
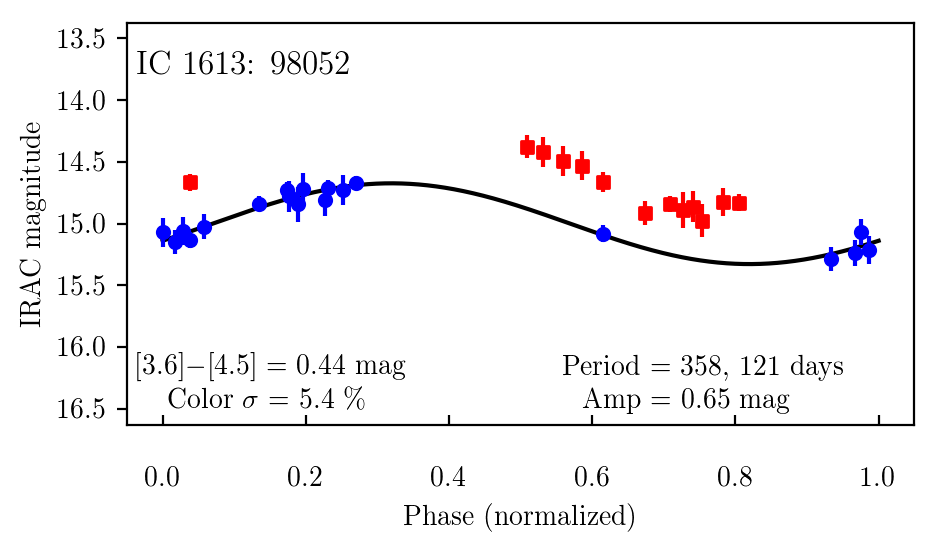
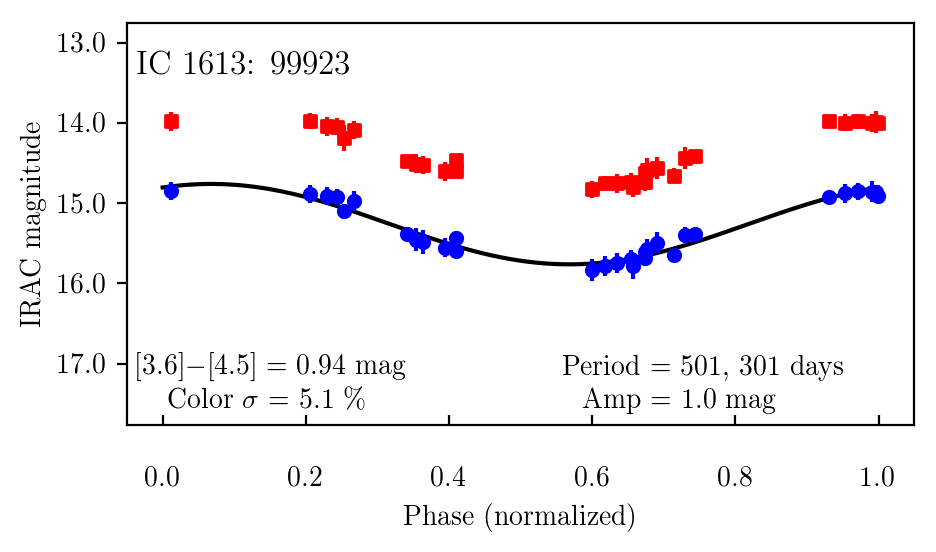
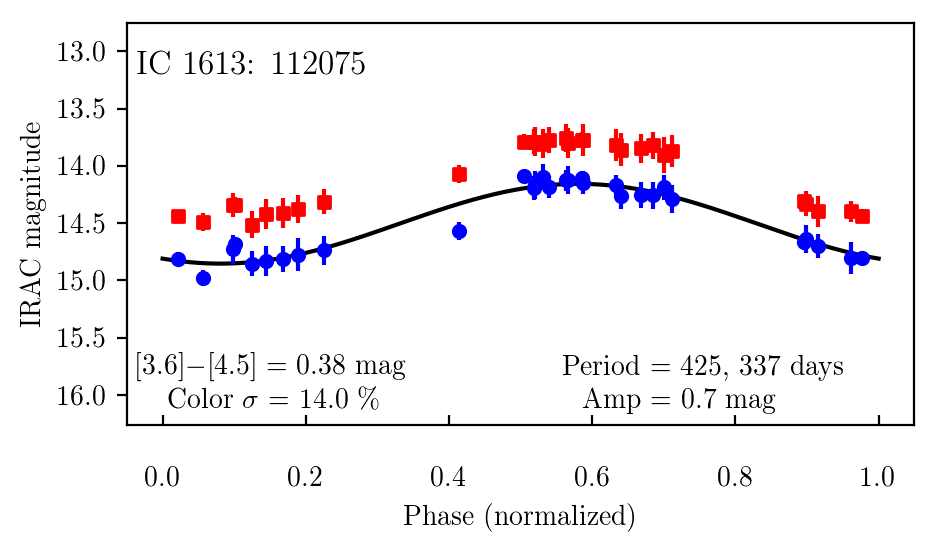
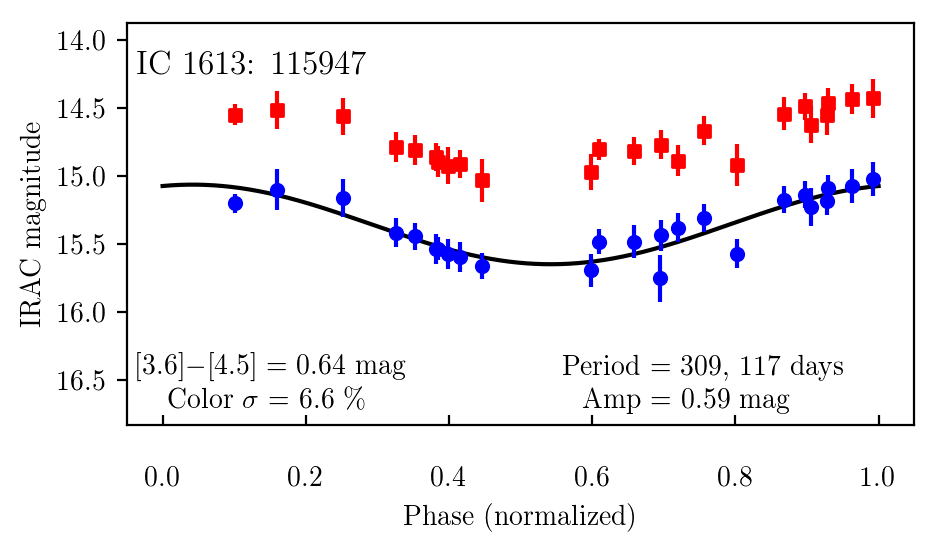
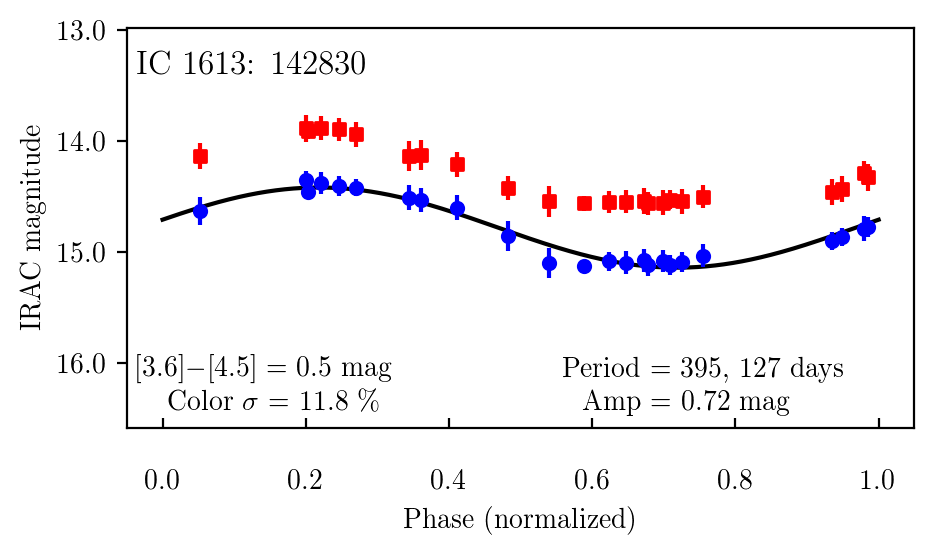
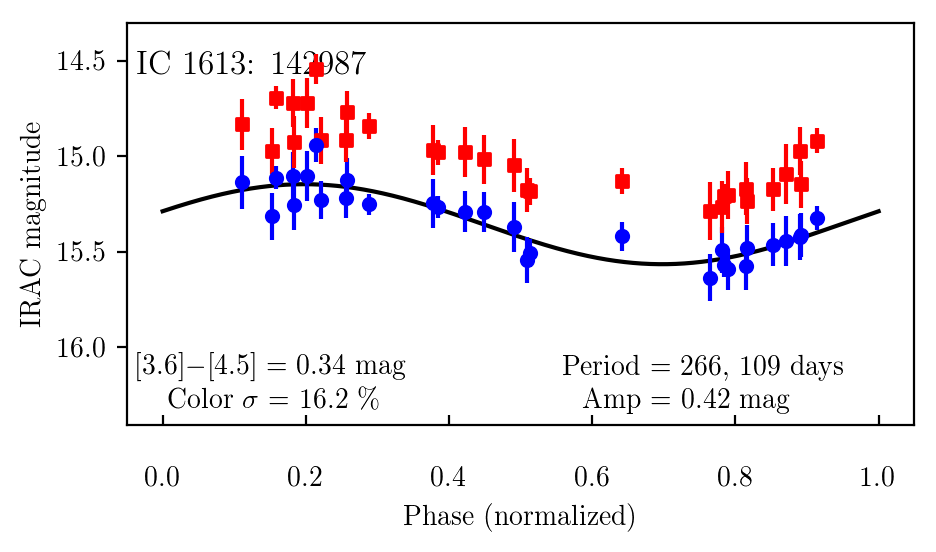
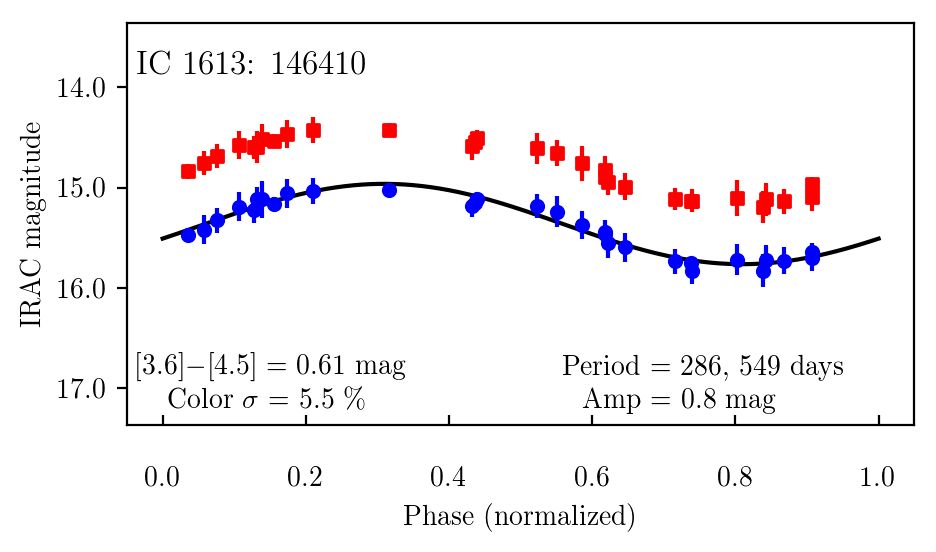
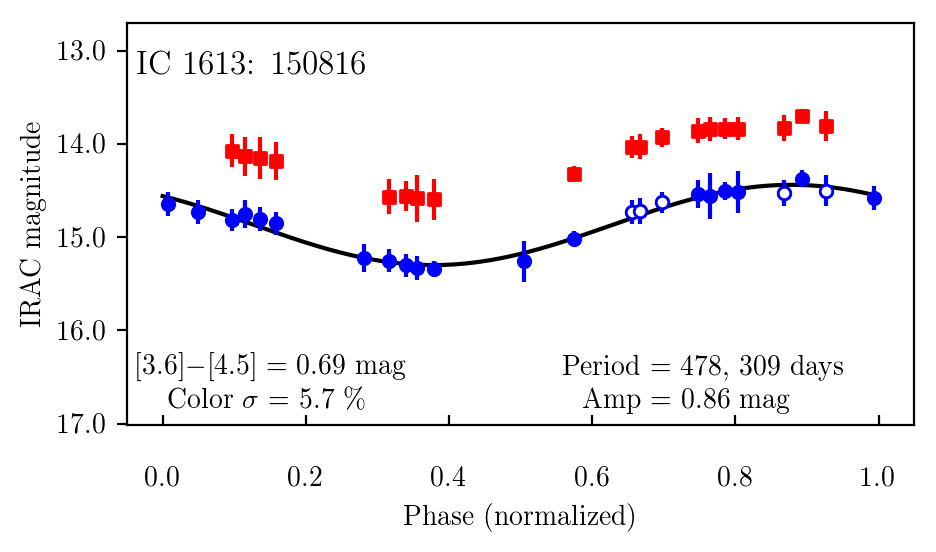
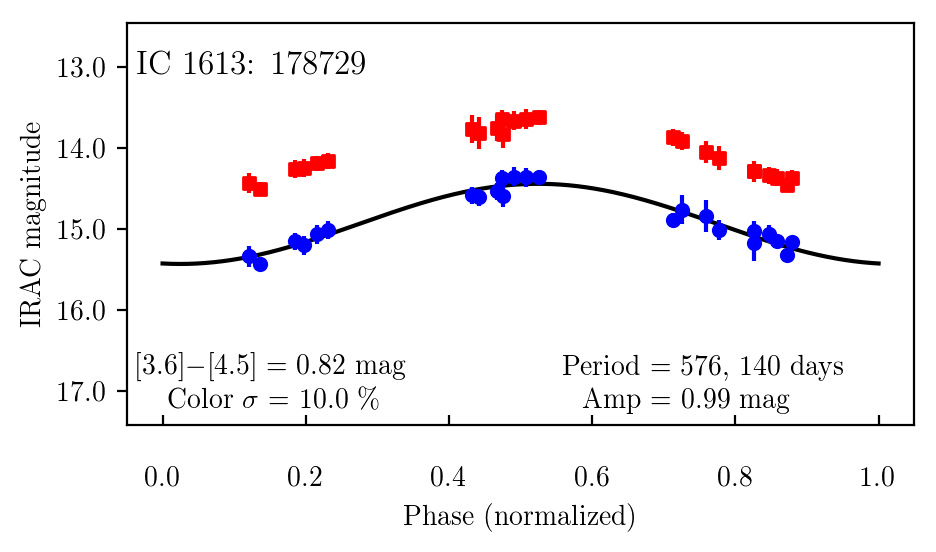
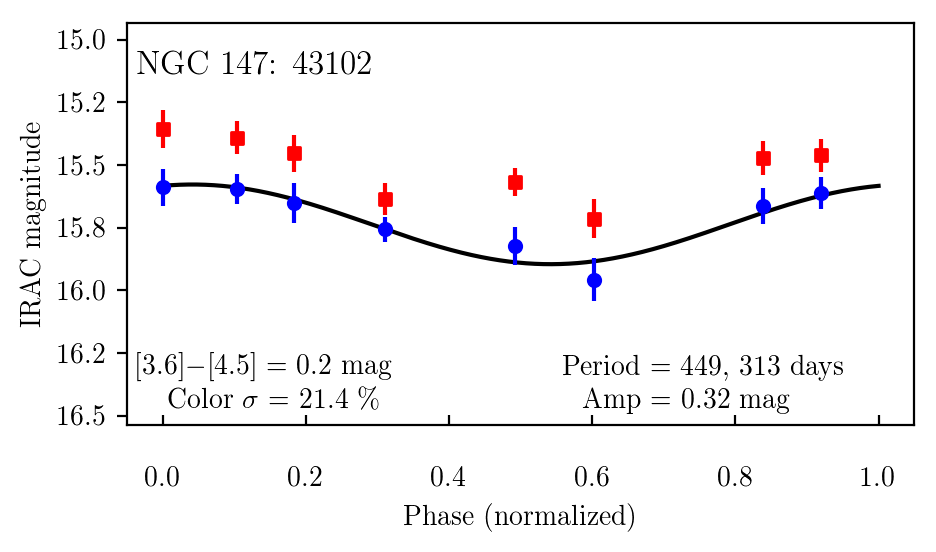
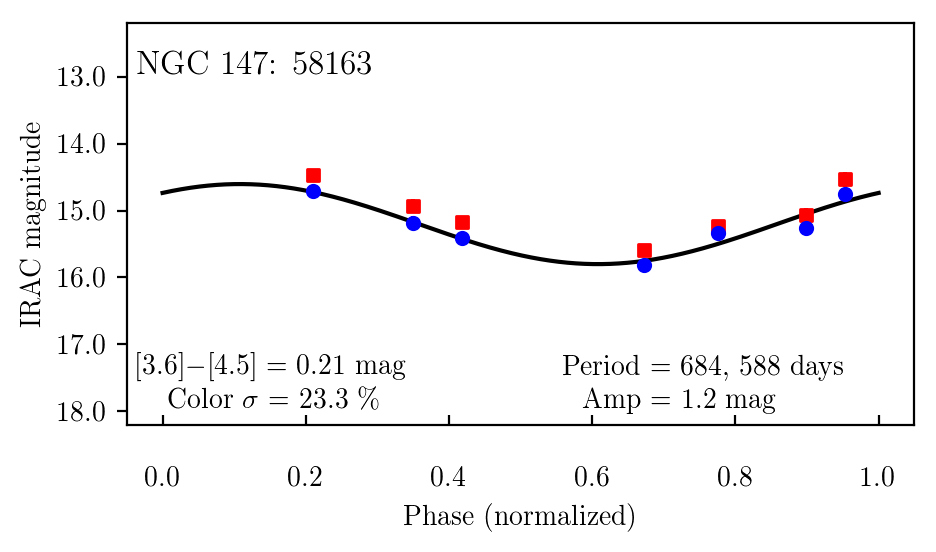
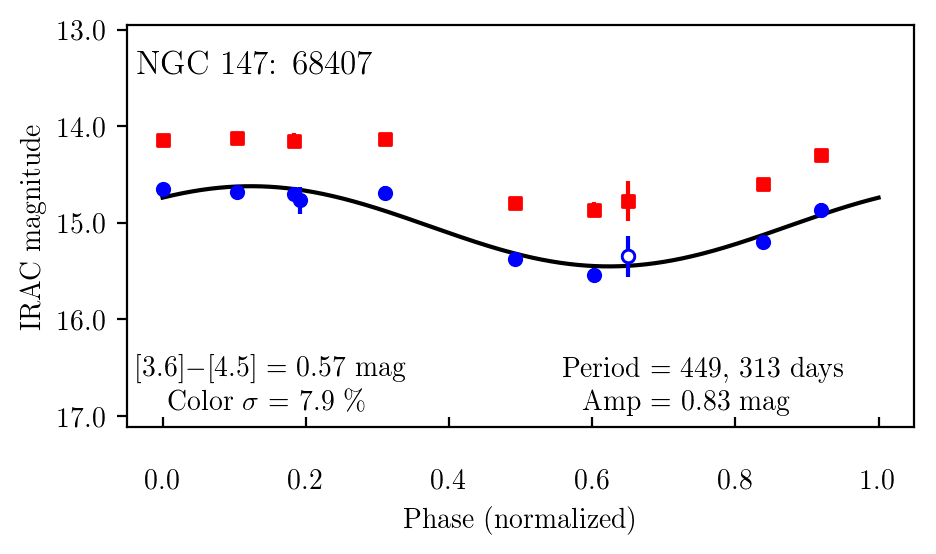
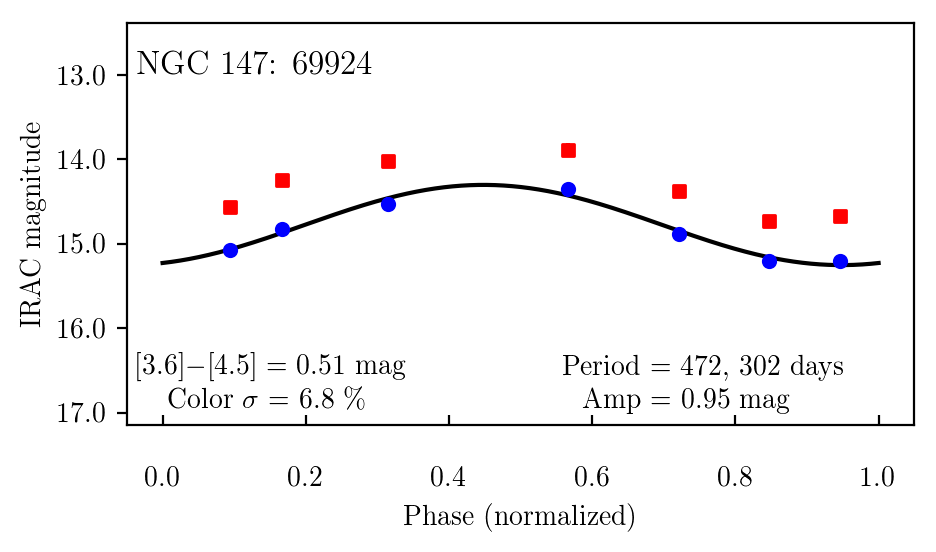
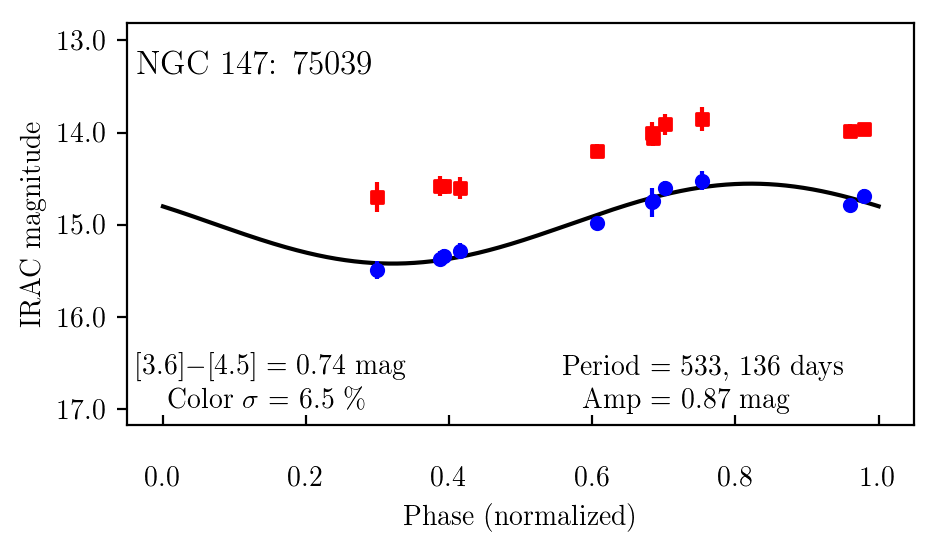
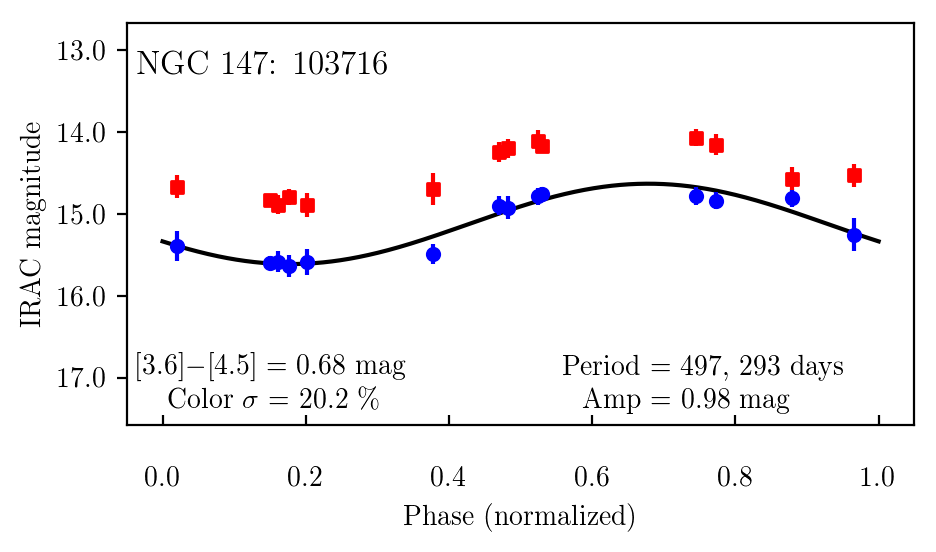
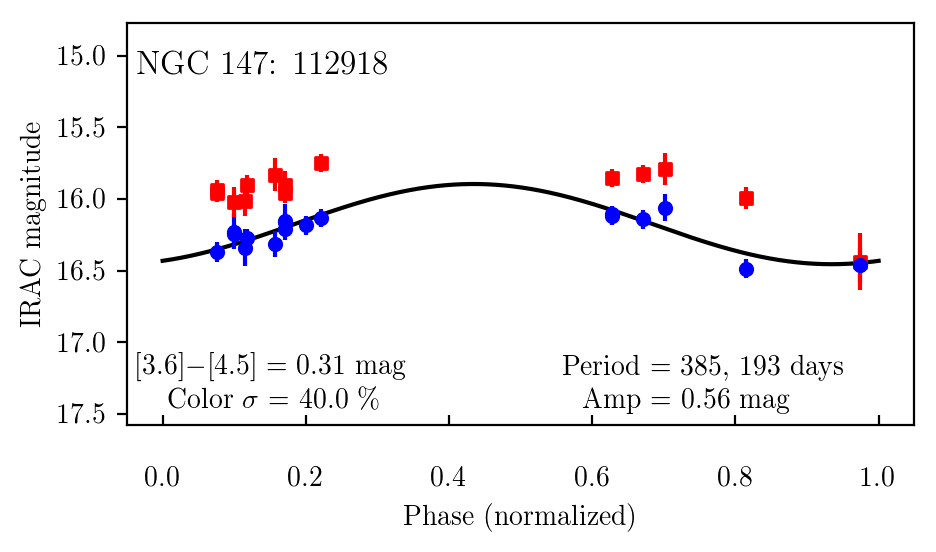
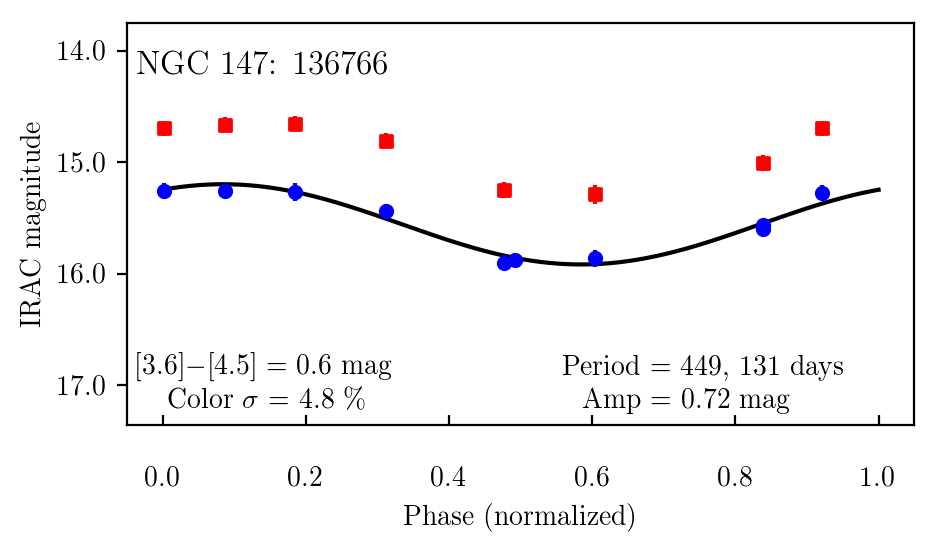
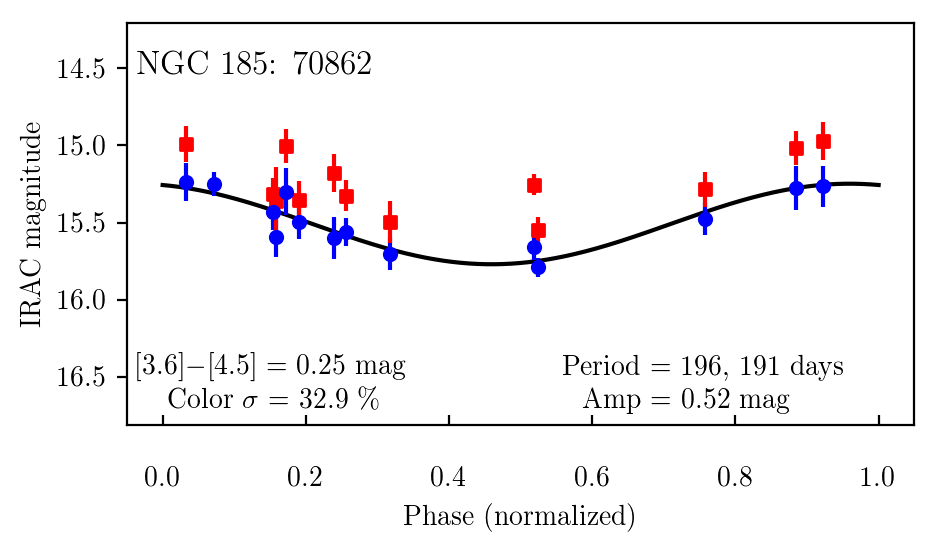
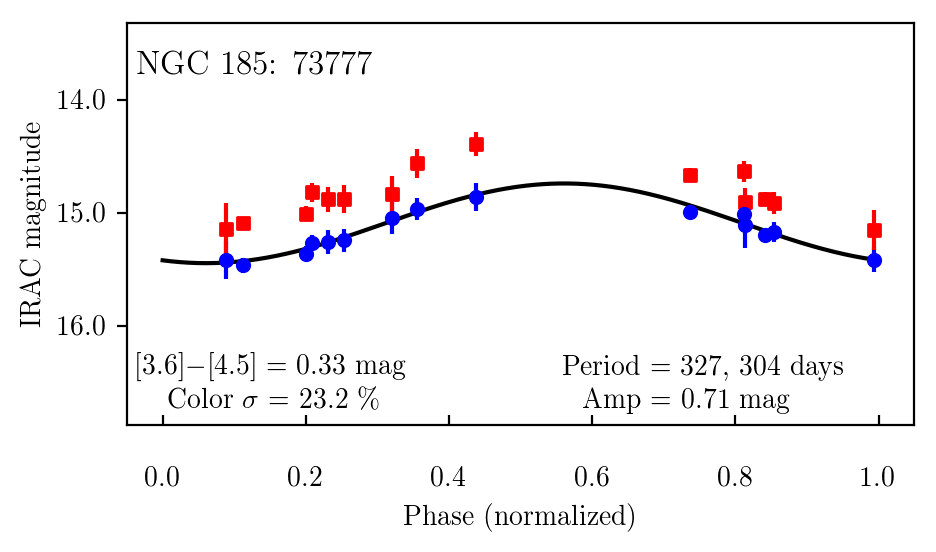
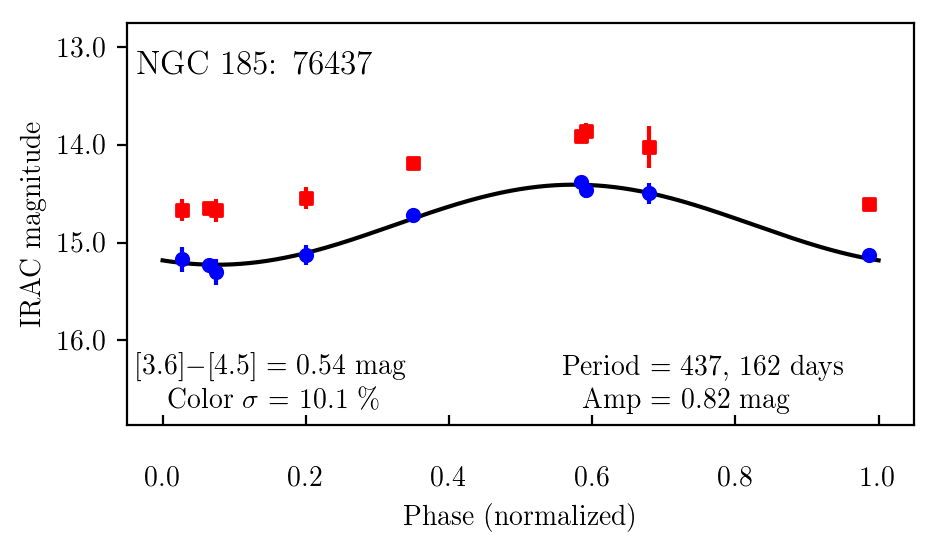
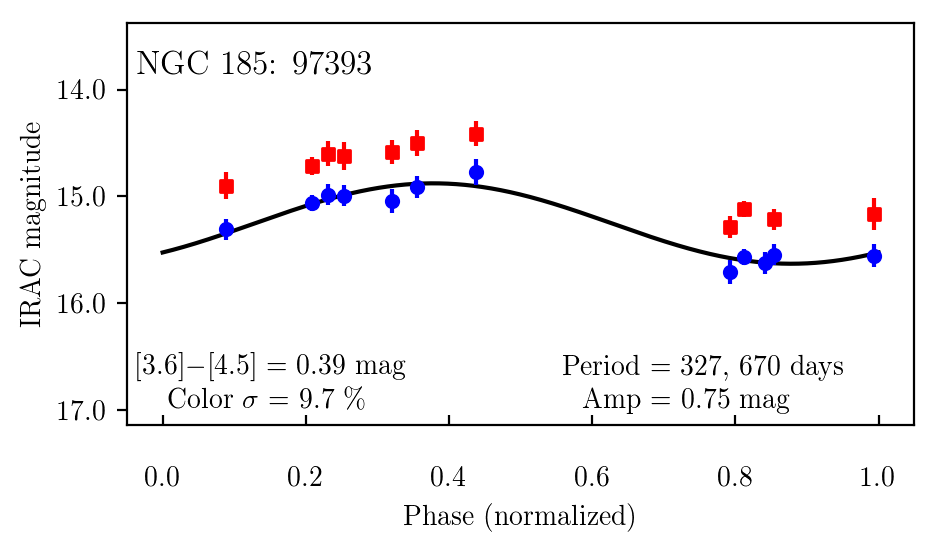
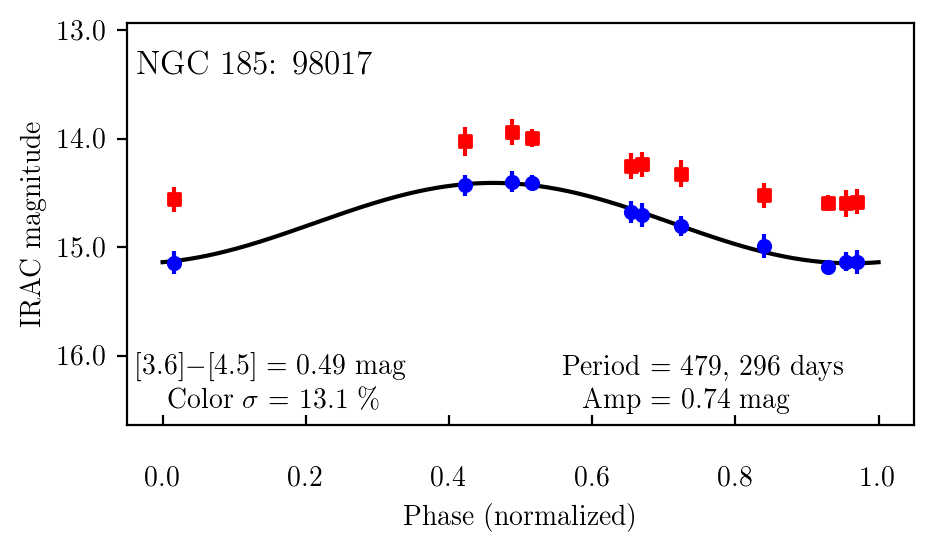
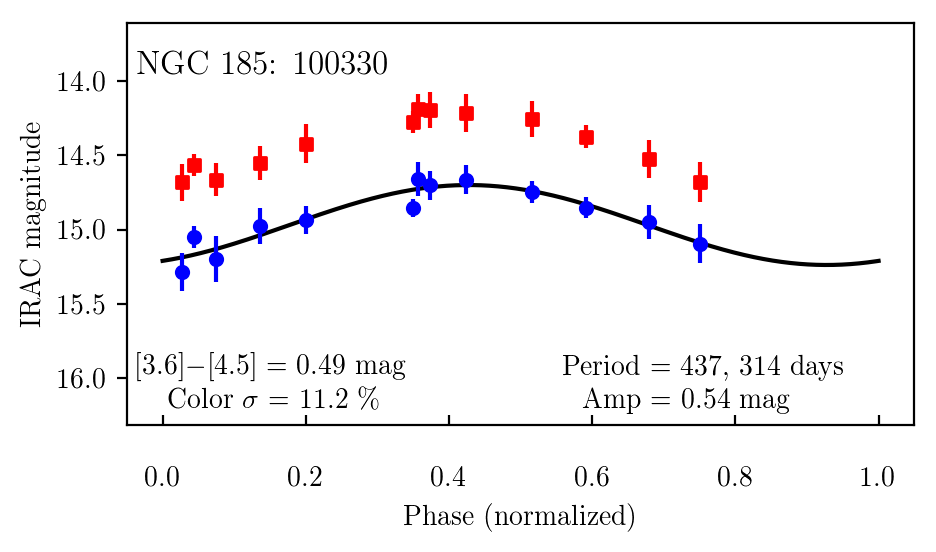
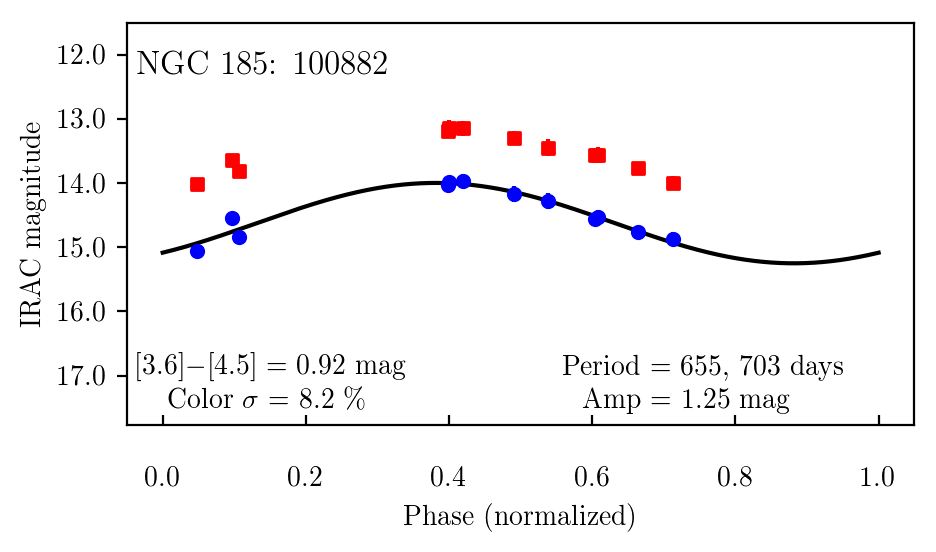
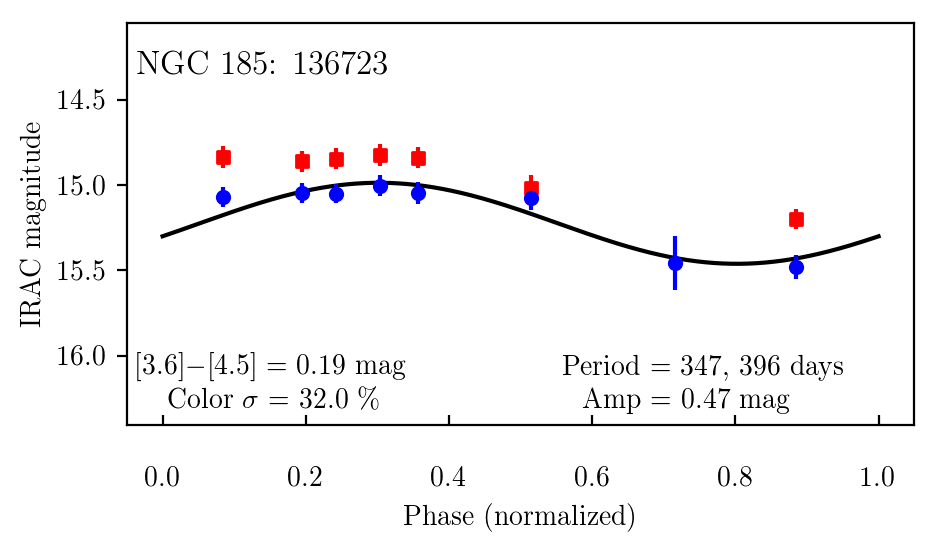
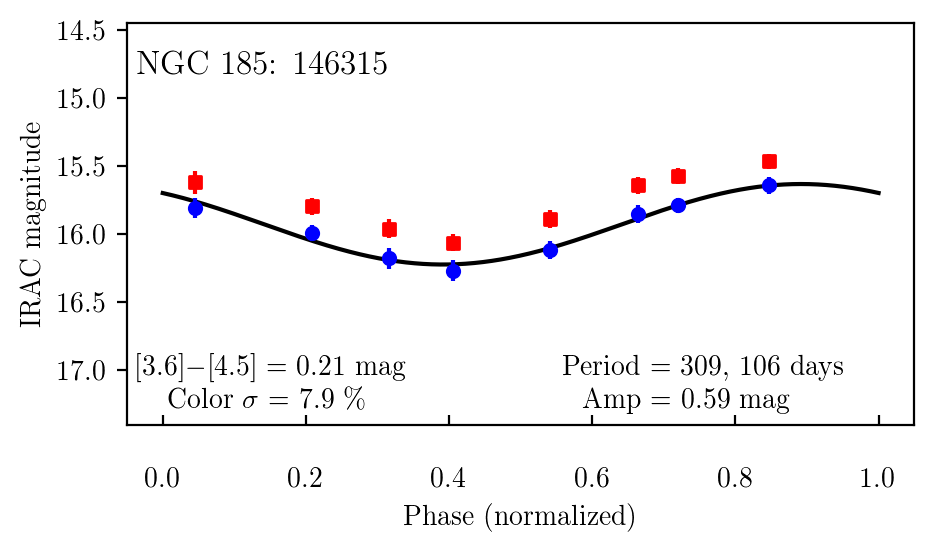
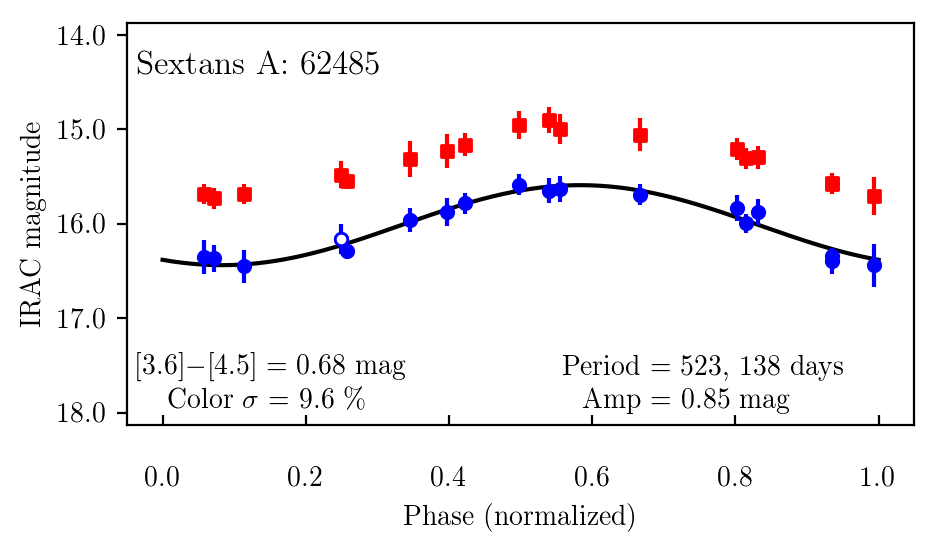
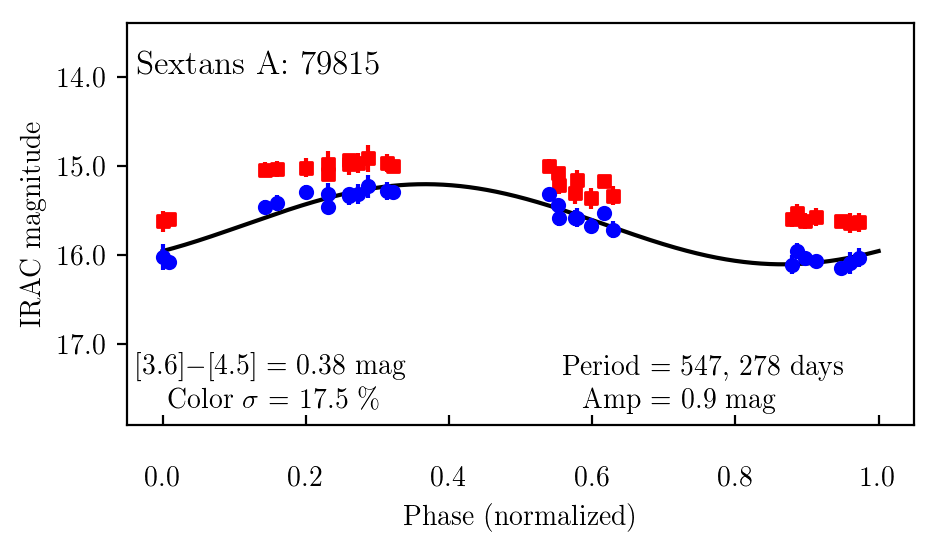
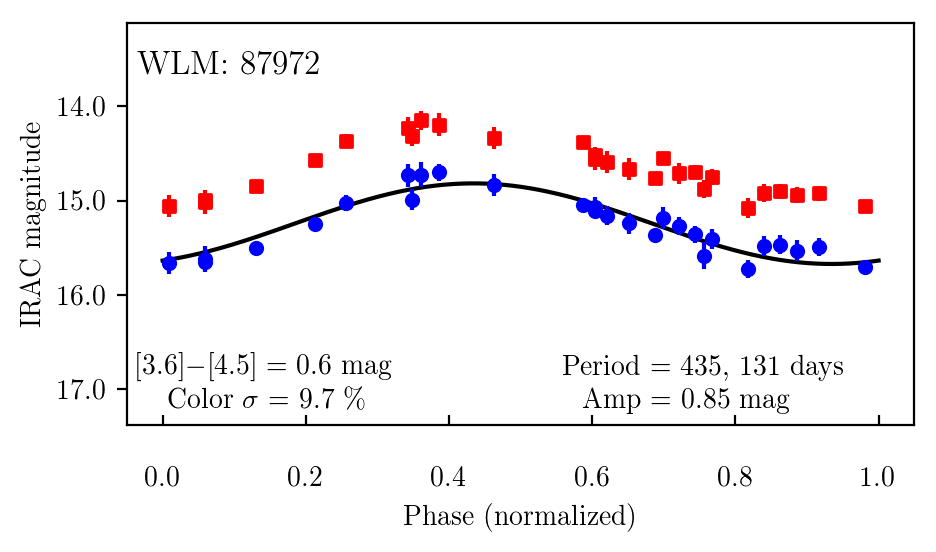
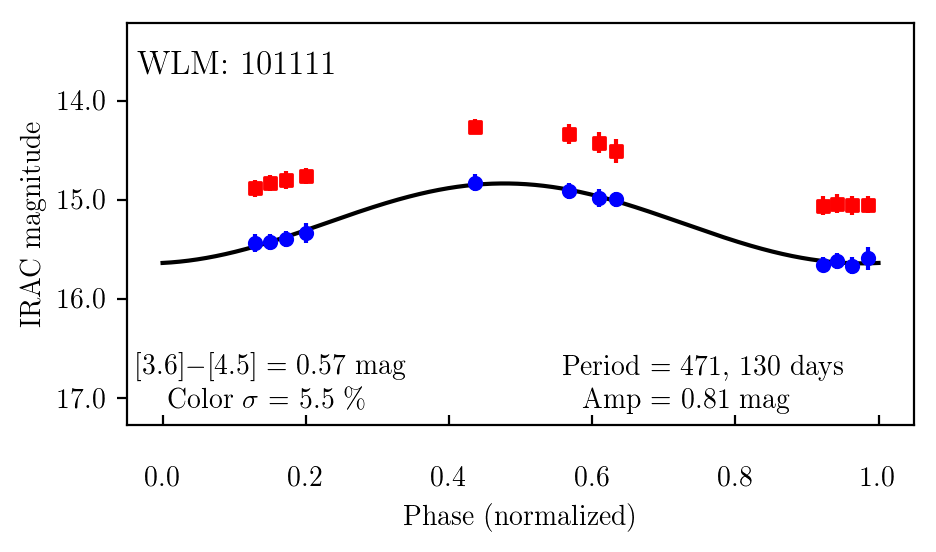
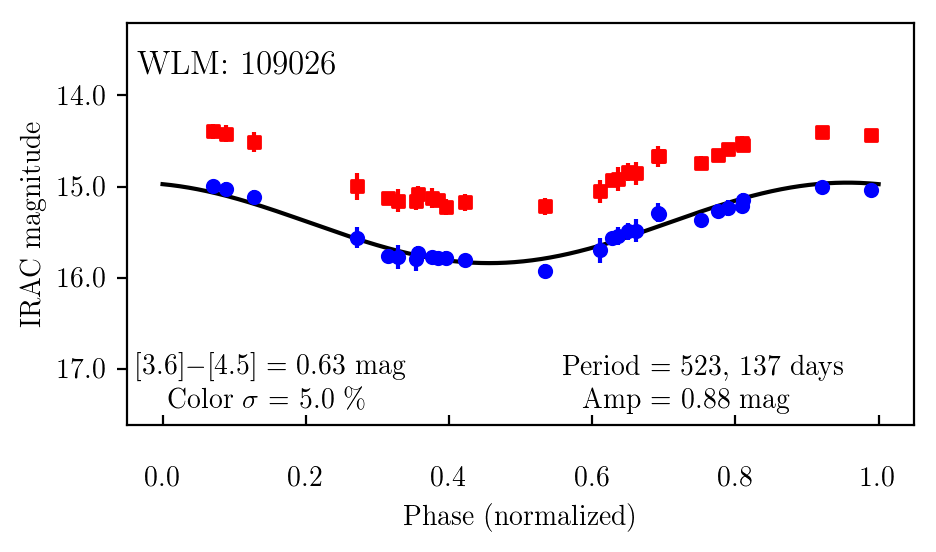
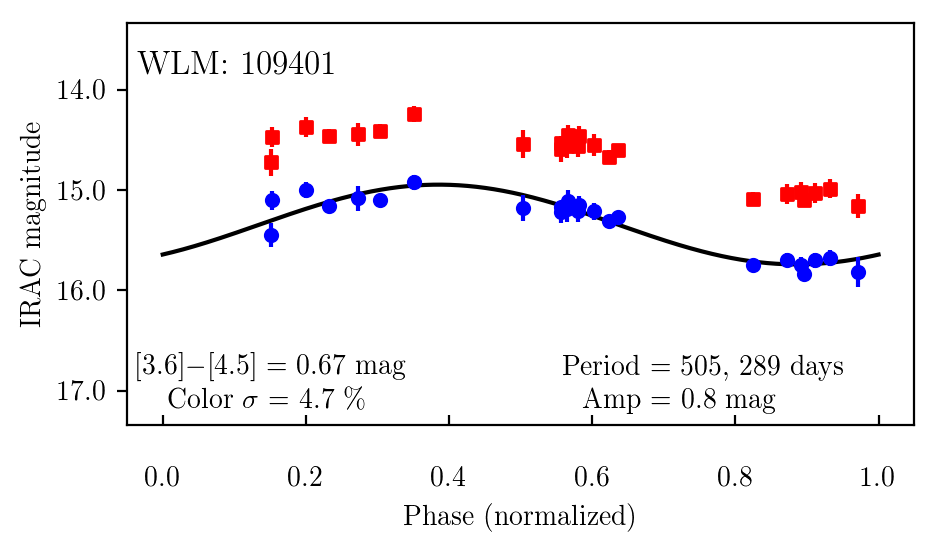
Appendix A: Infrared lightcurves
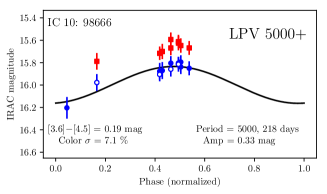
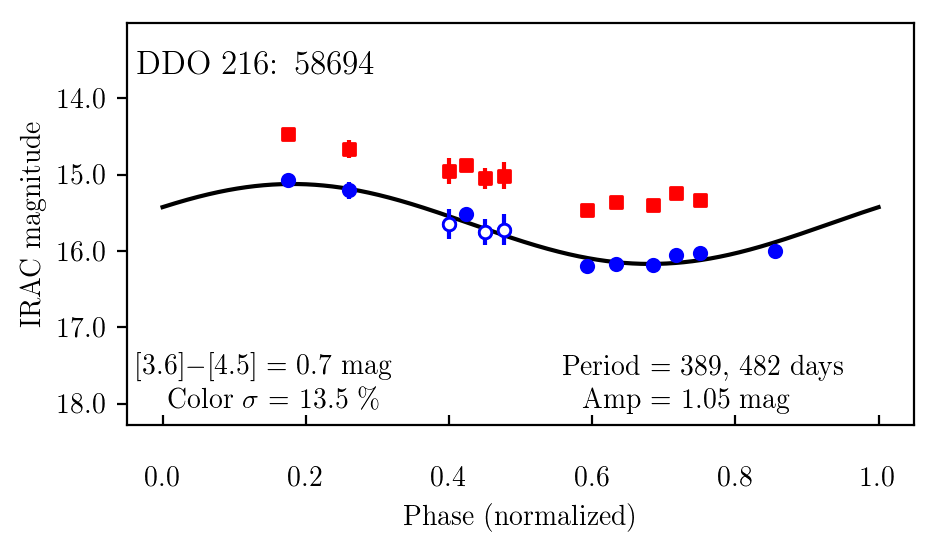
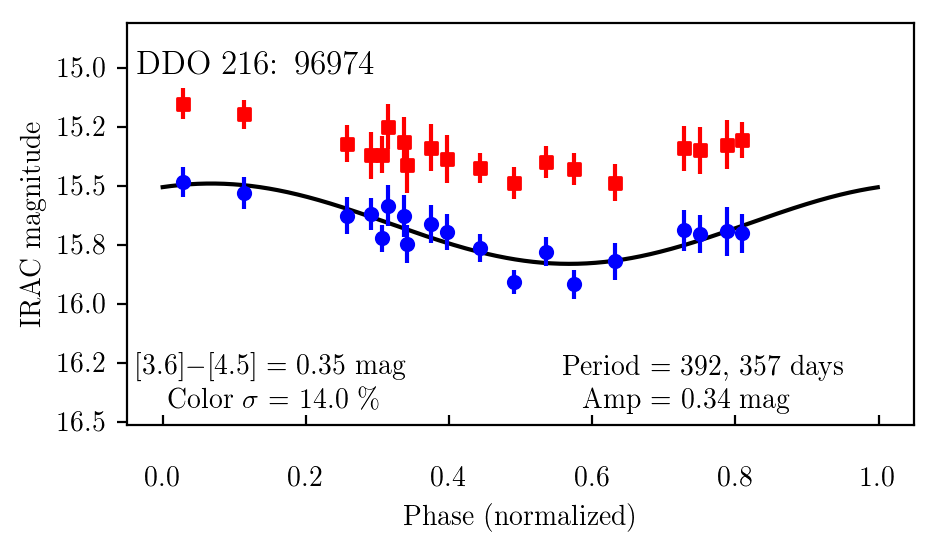
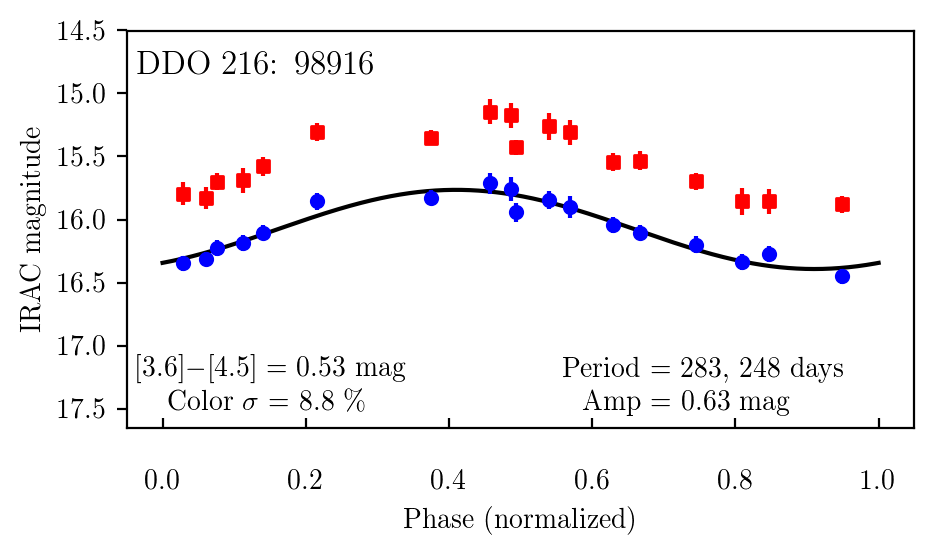
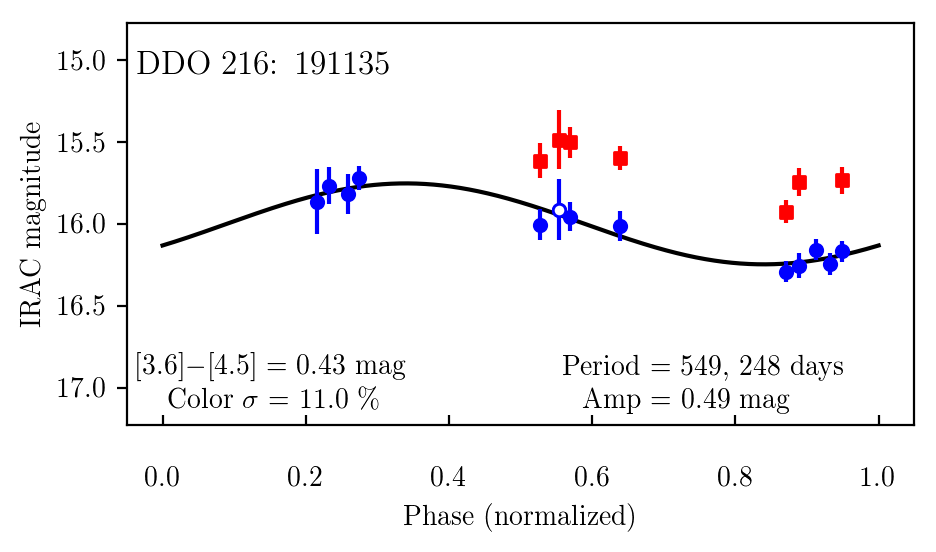
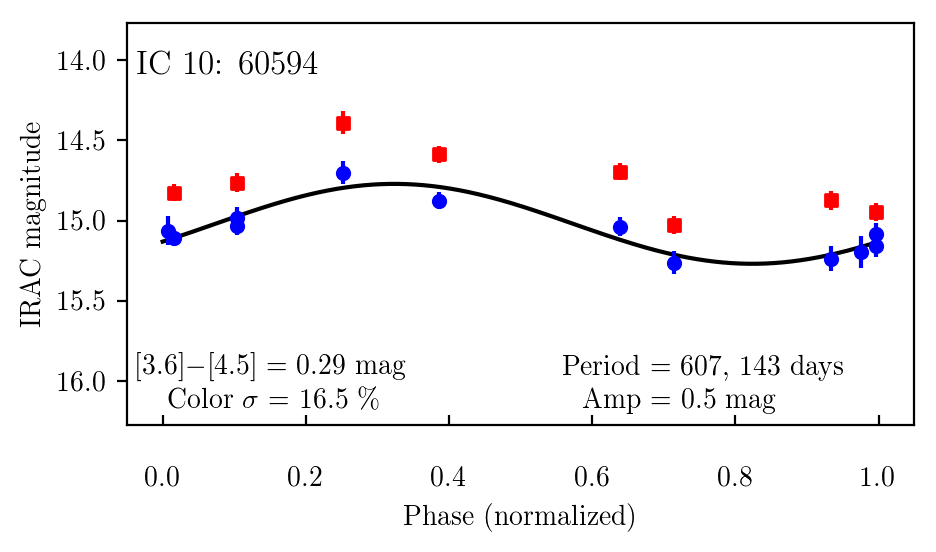
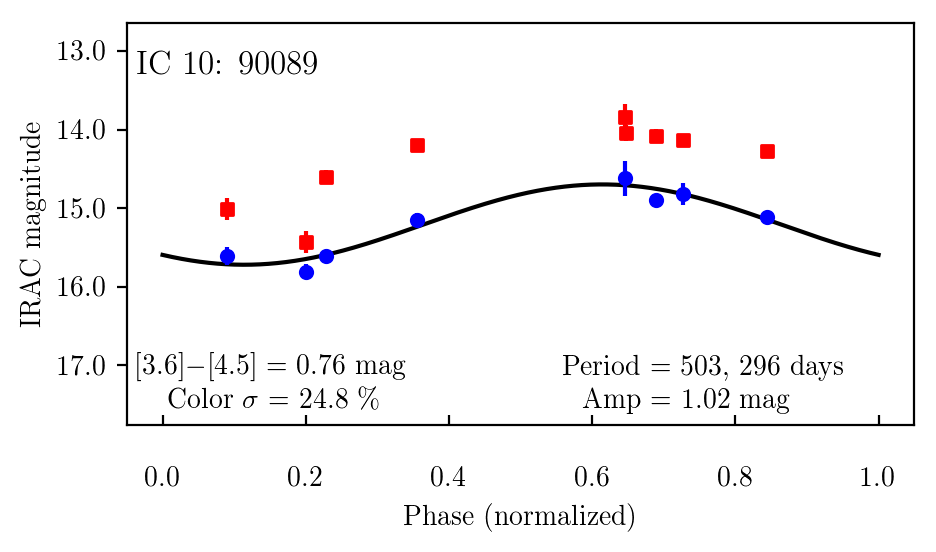
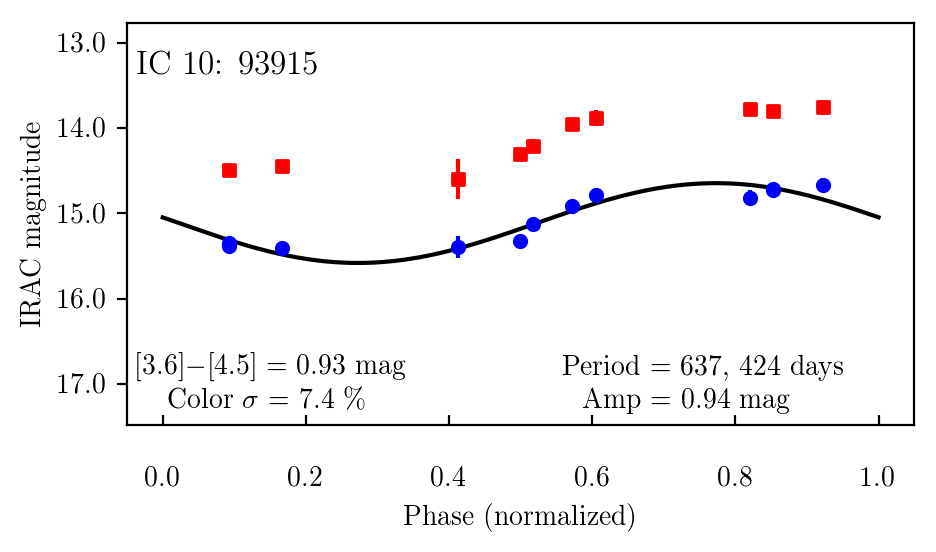
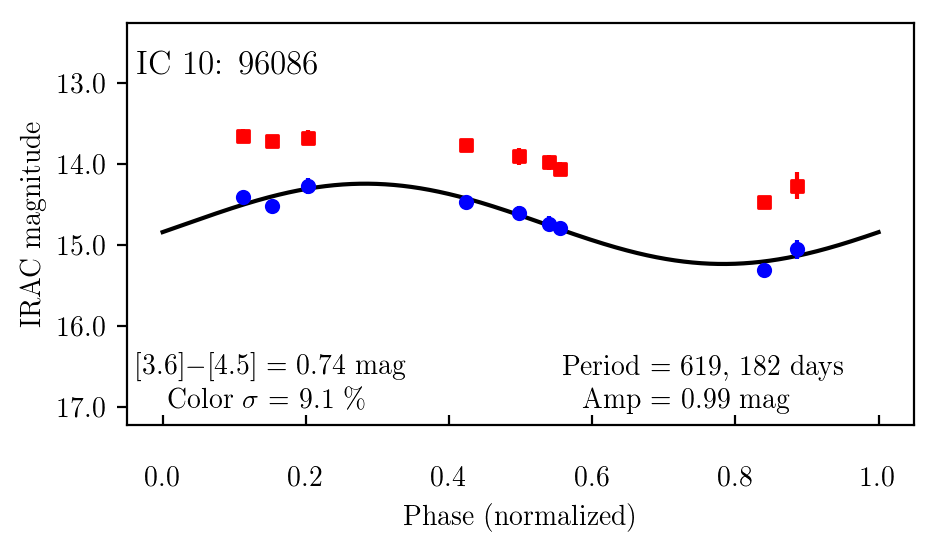
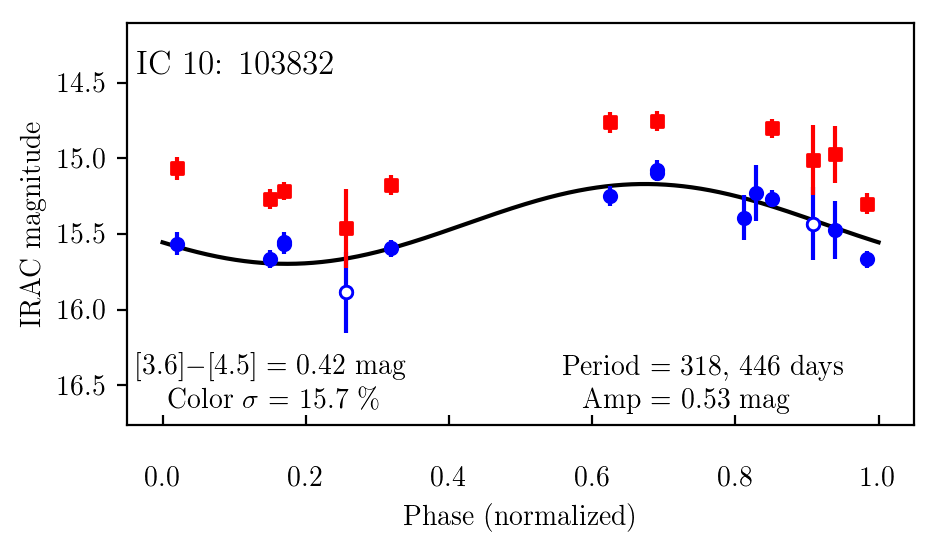
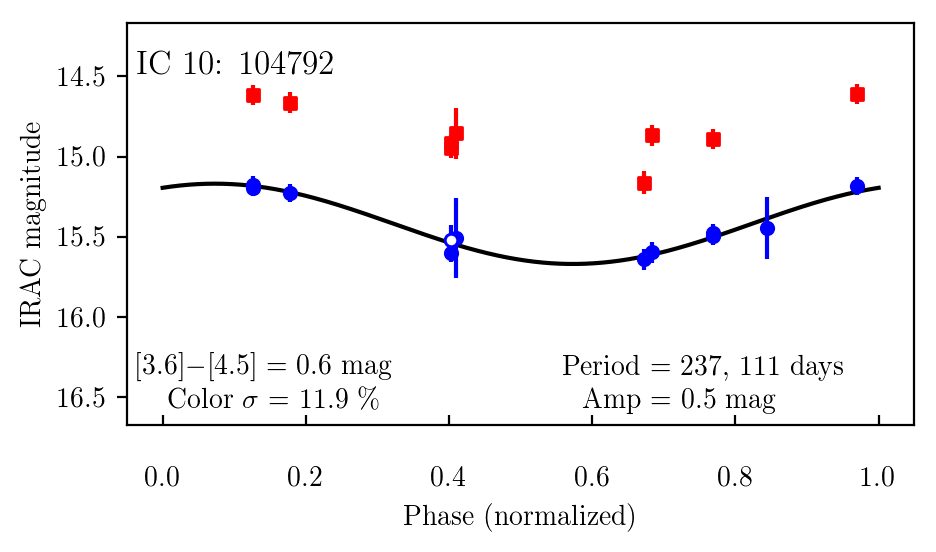
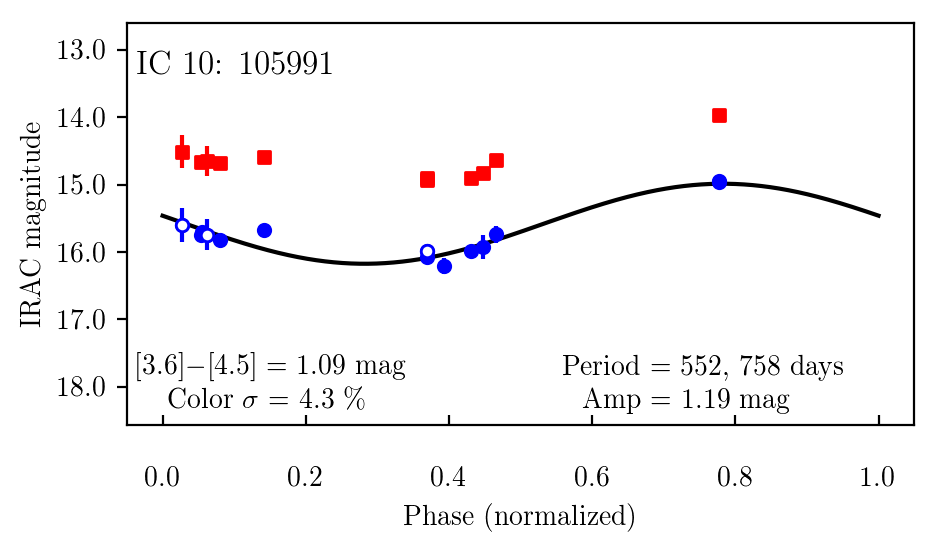
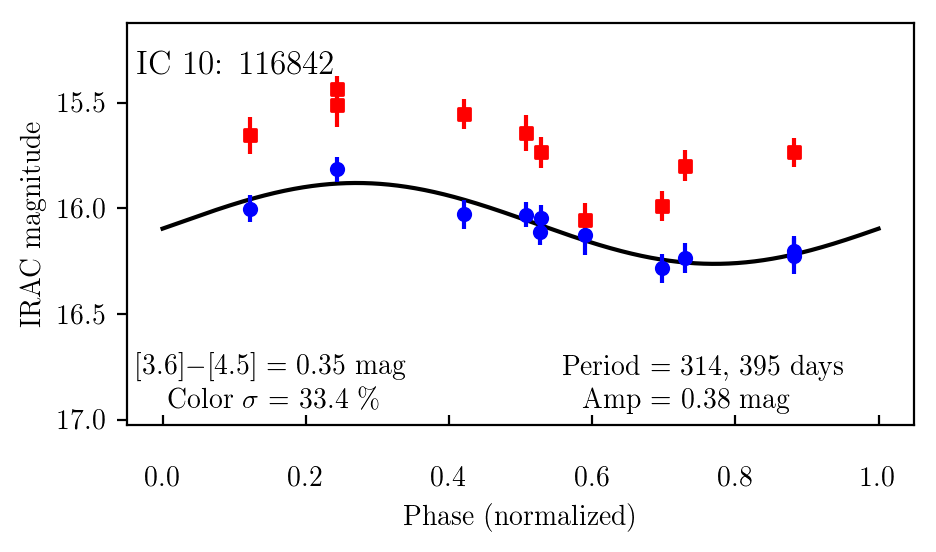
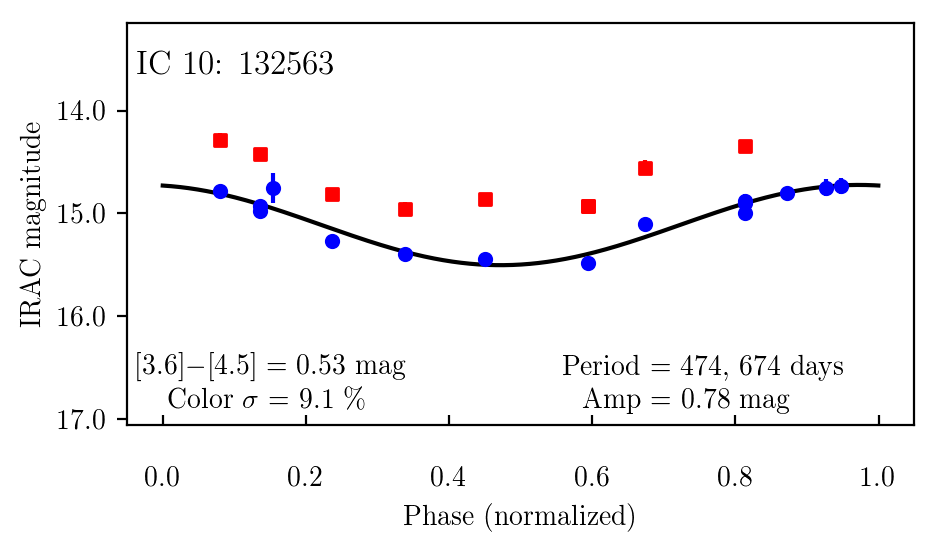
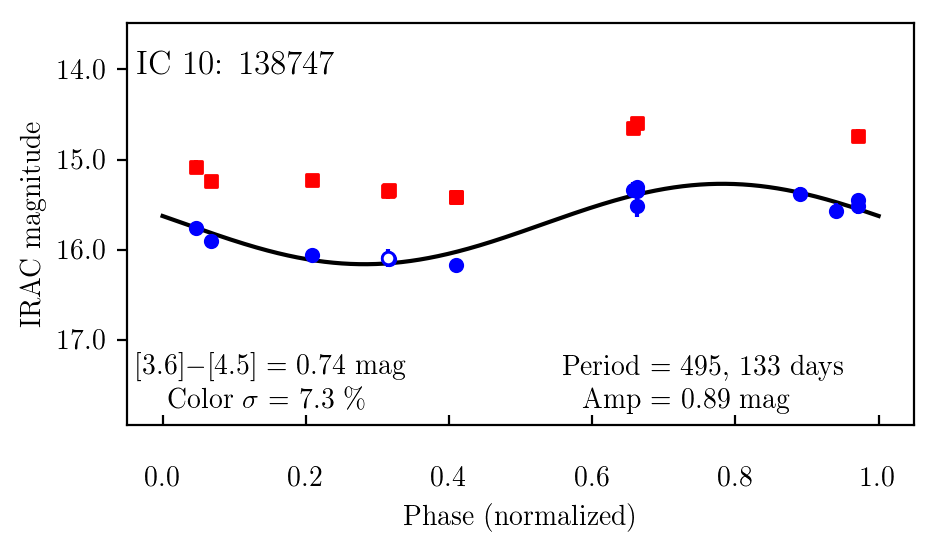
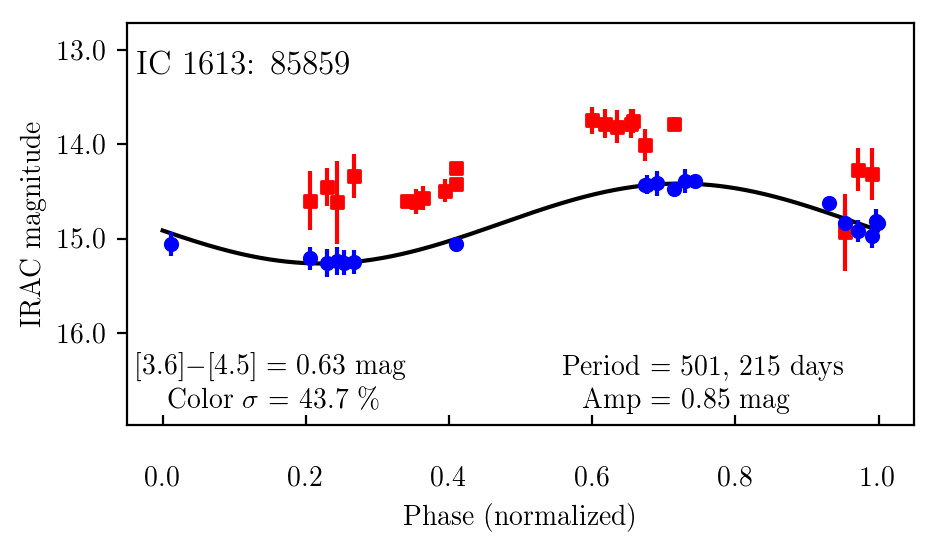
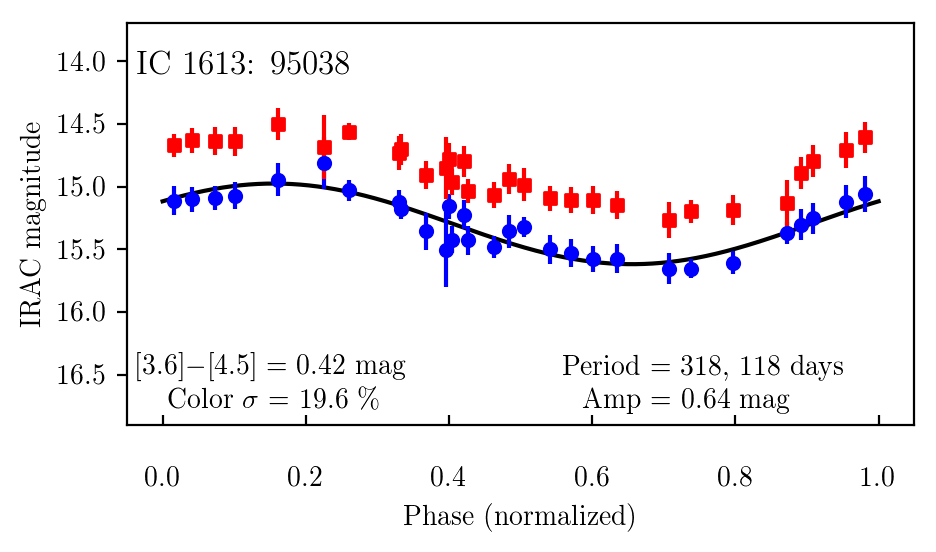
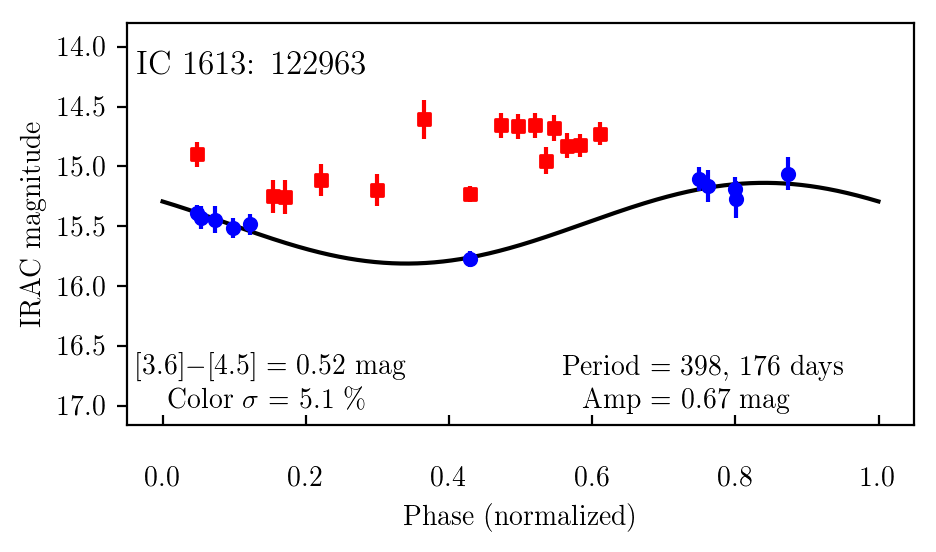
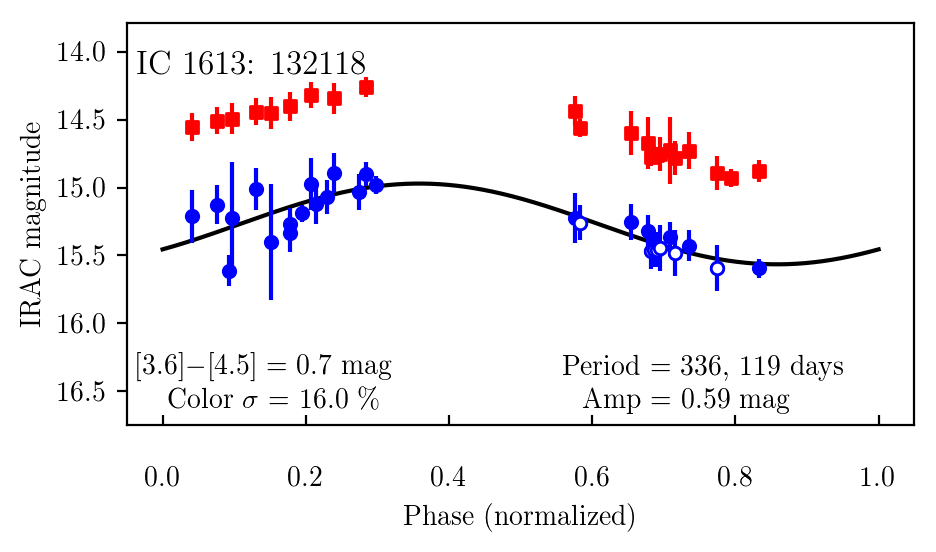
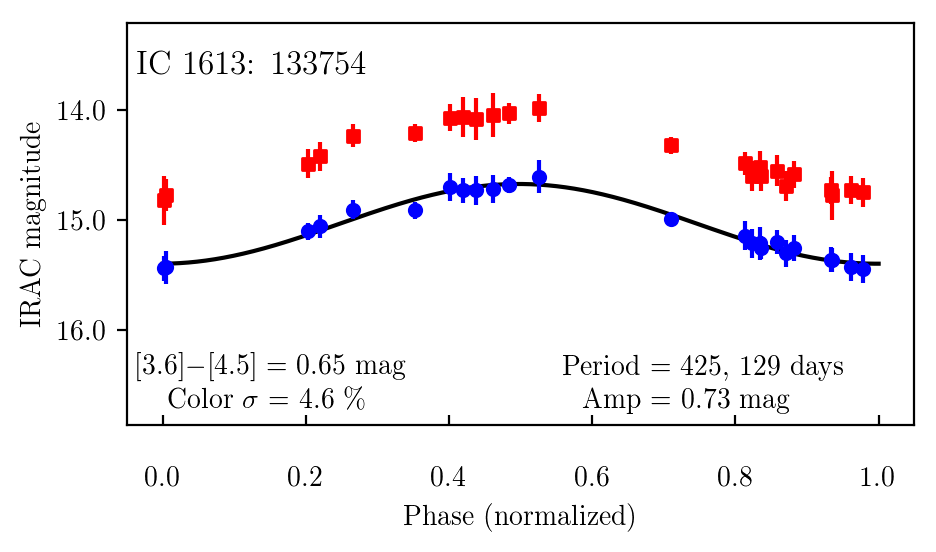
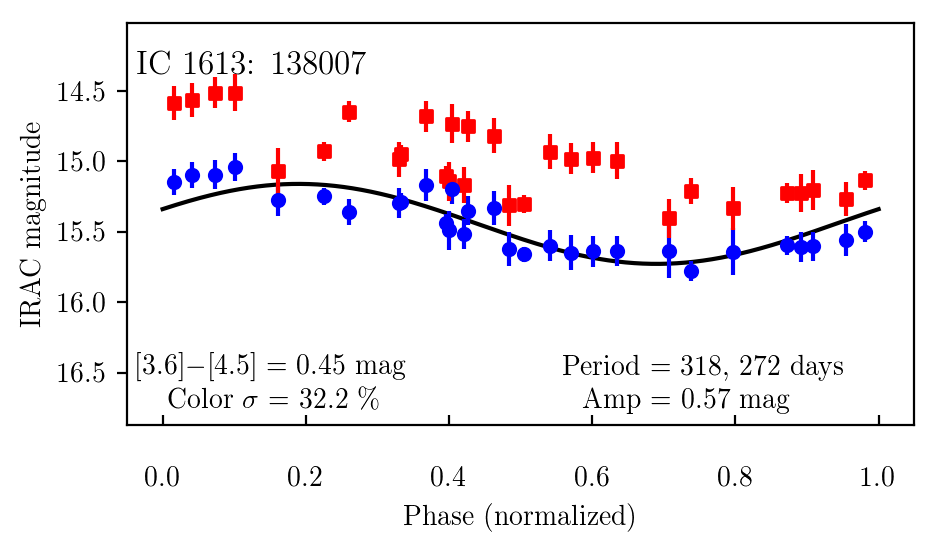
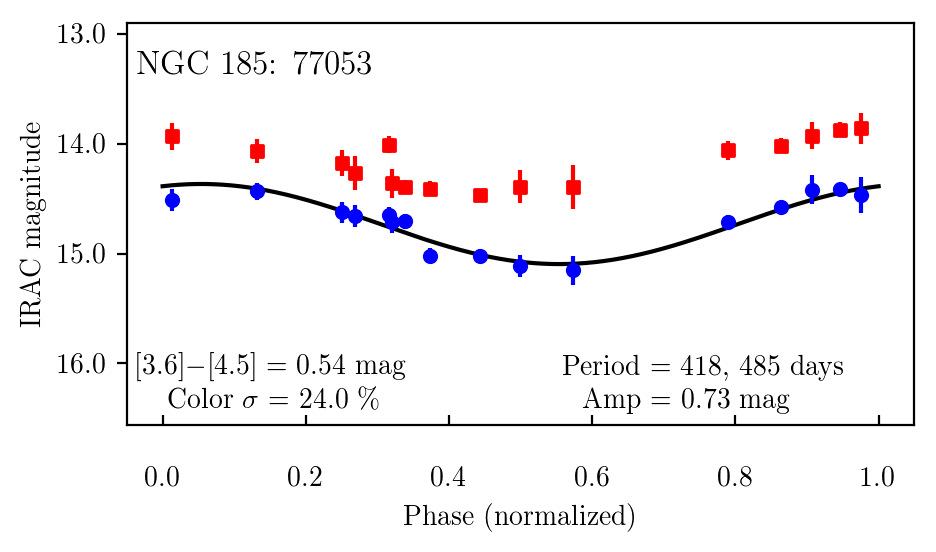
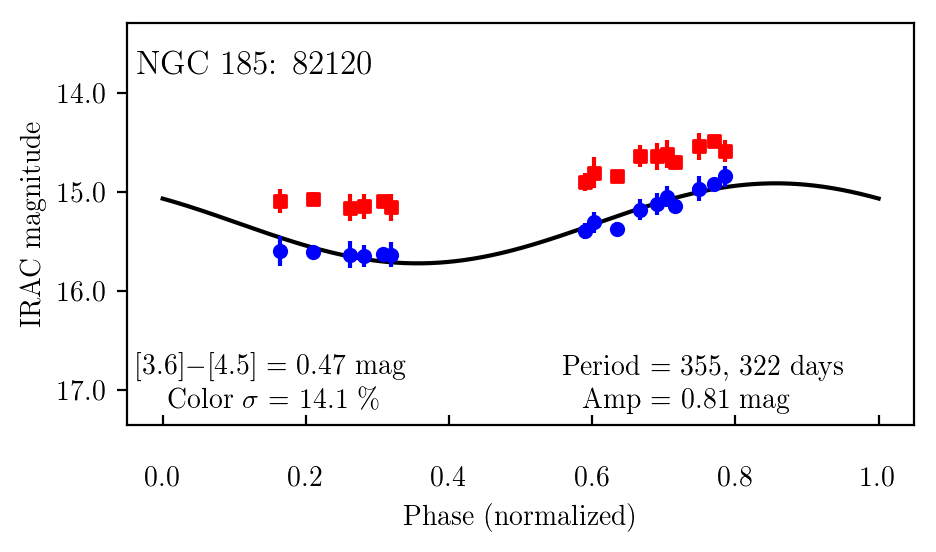
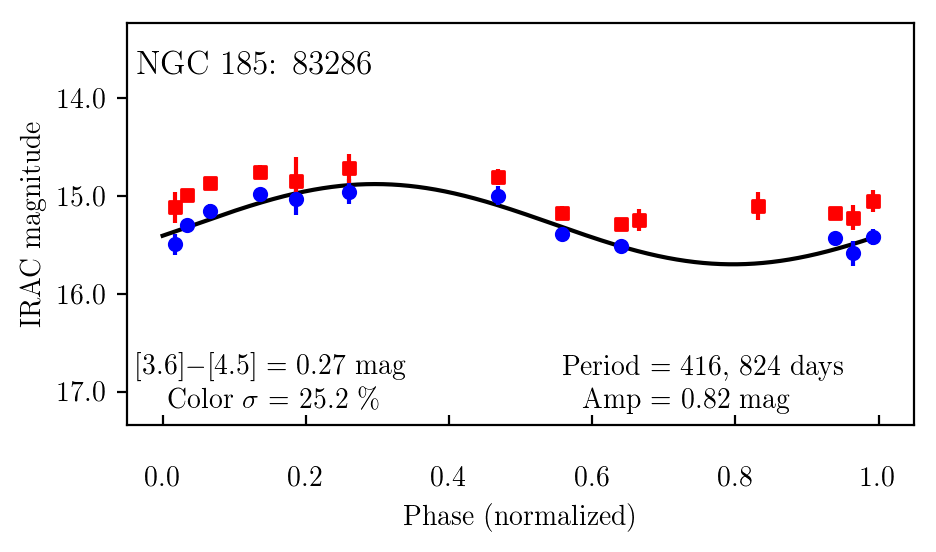
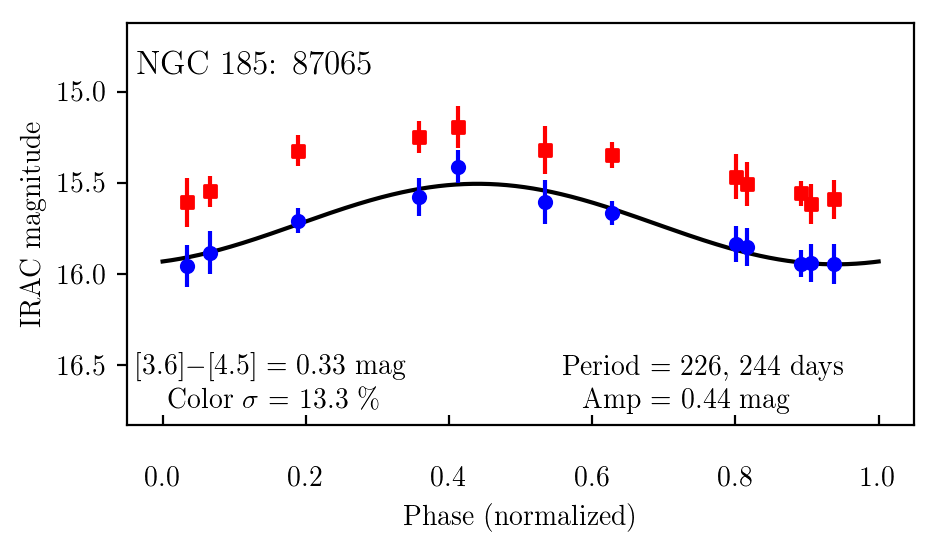
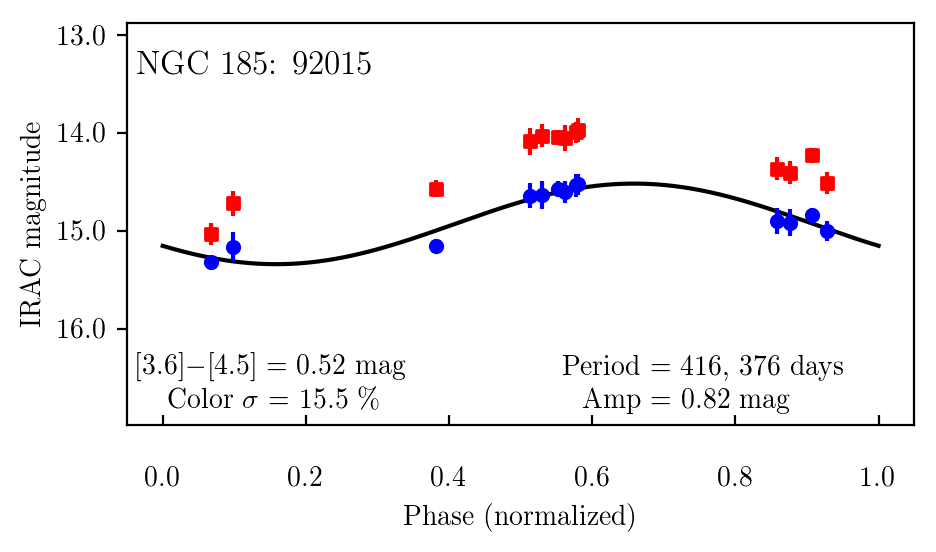
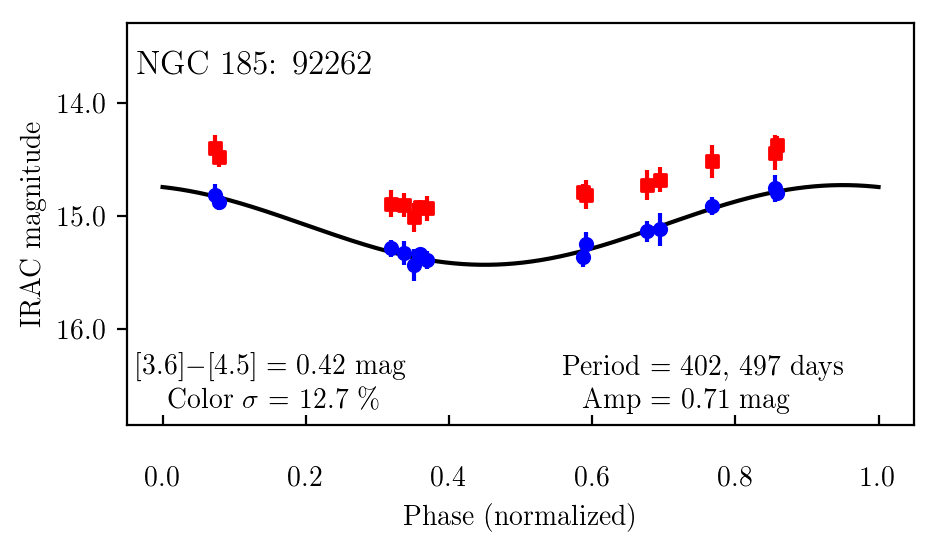
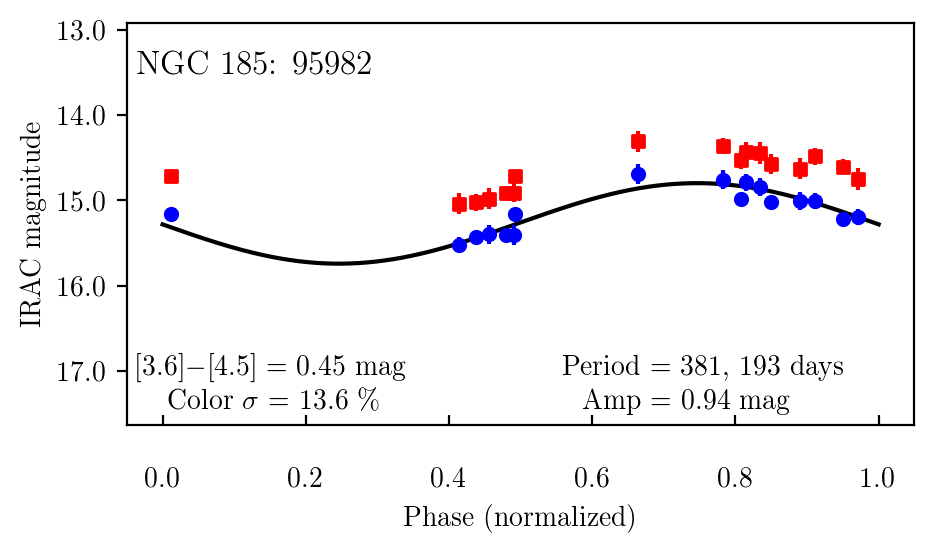
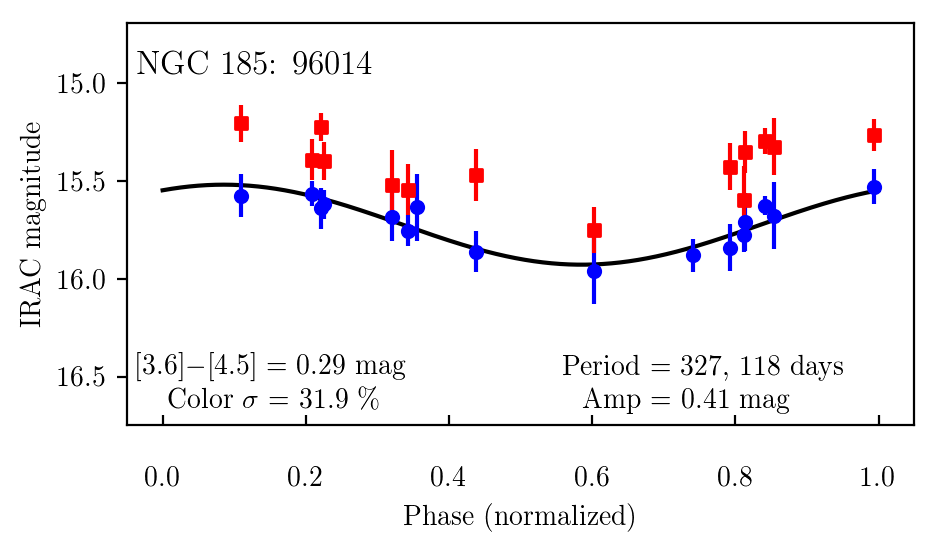
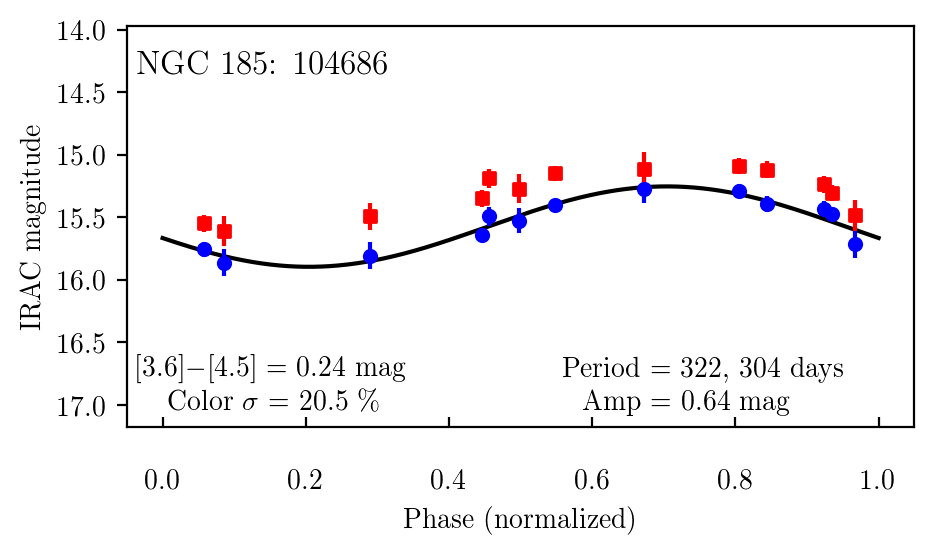
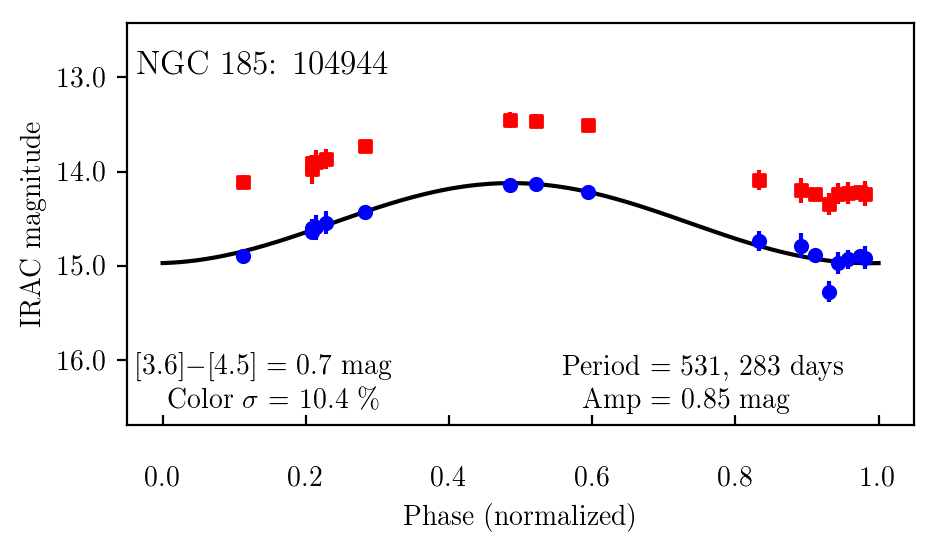
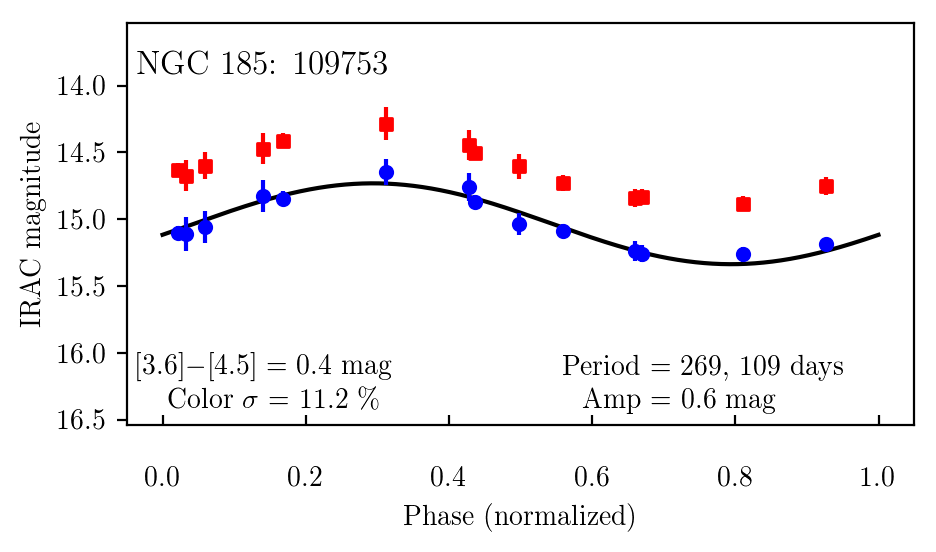
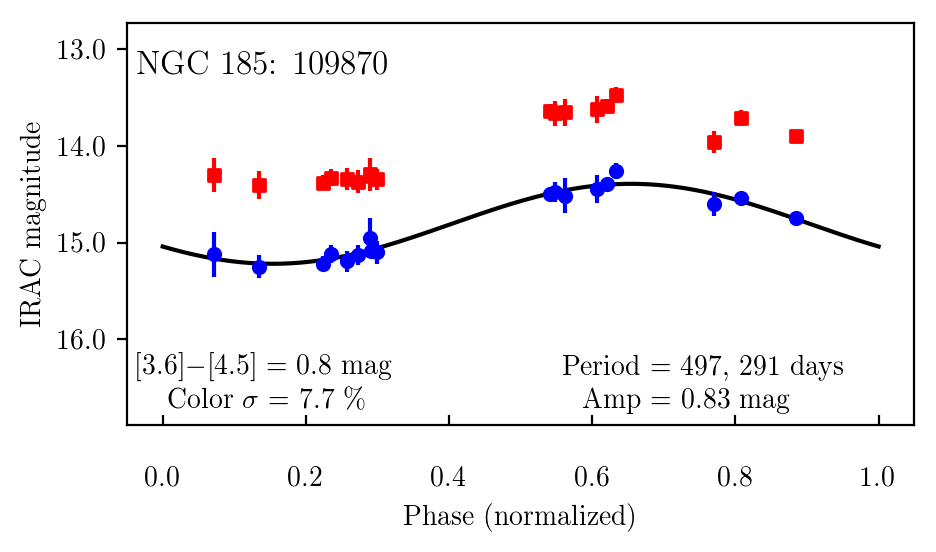
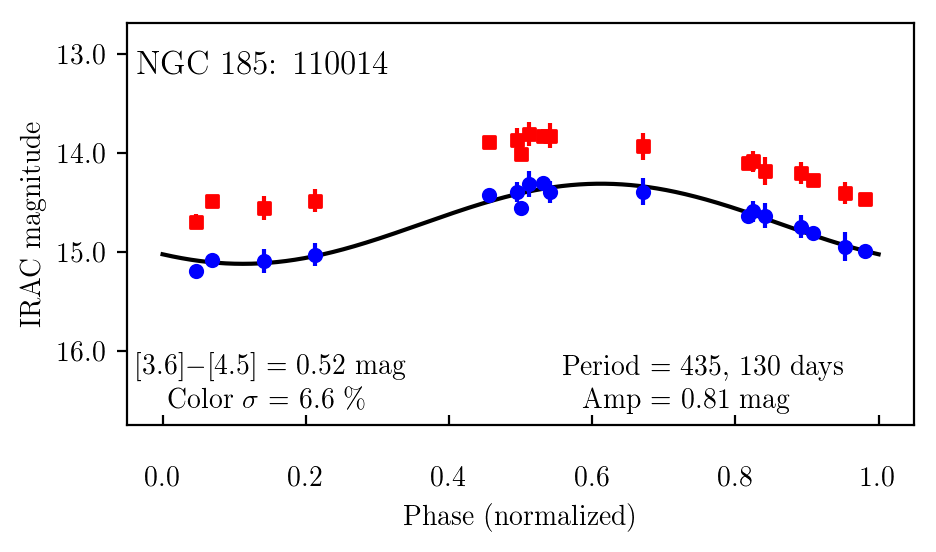
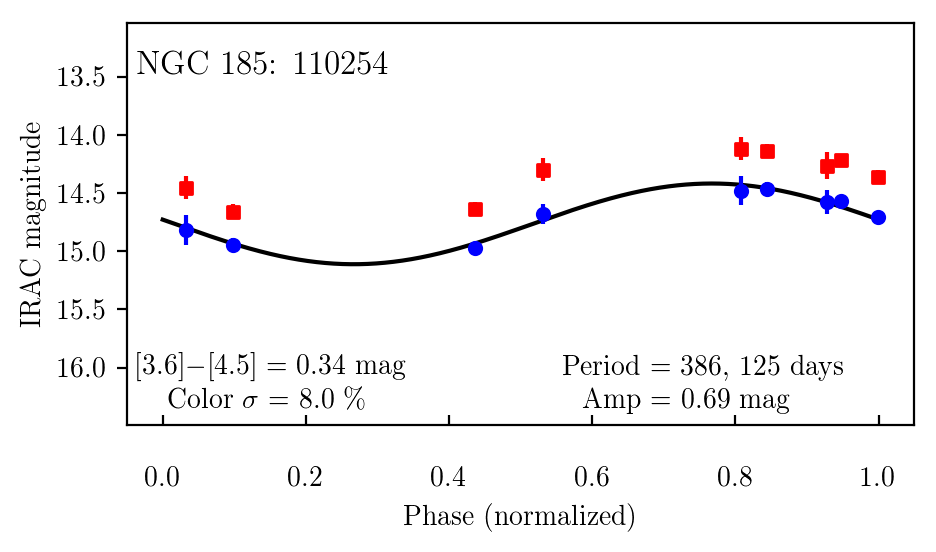
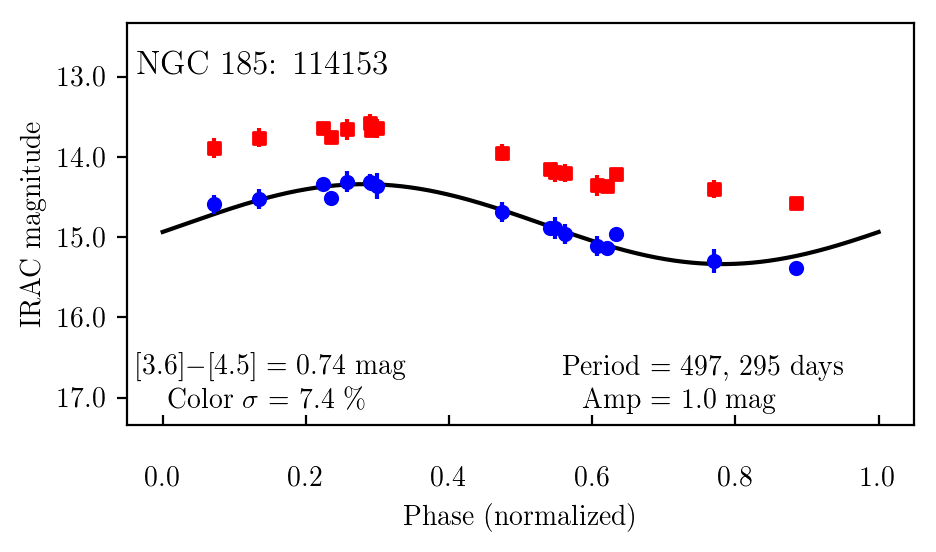
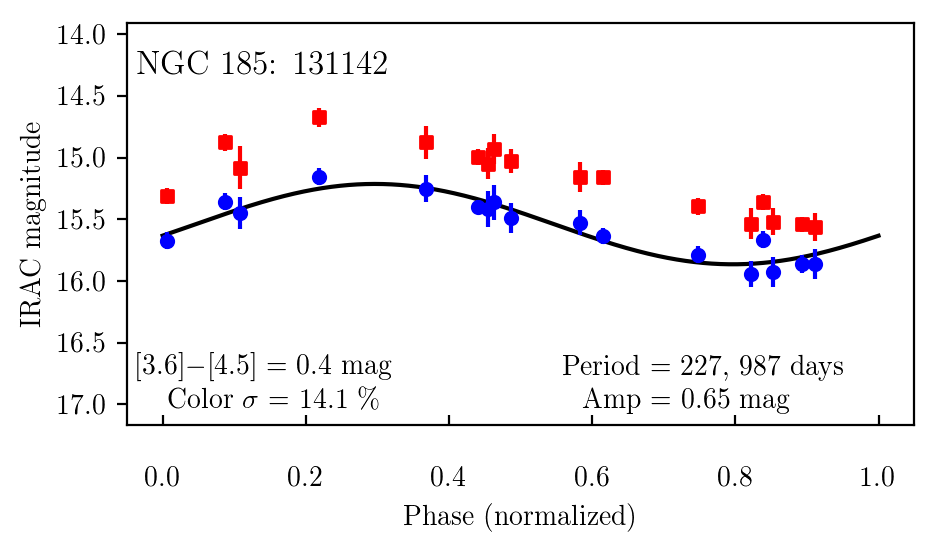
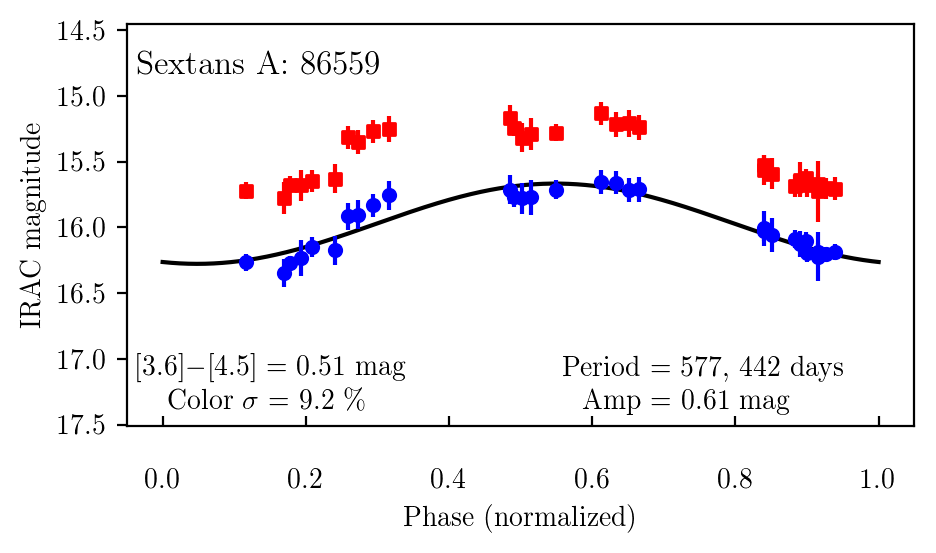
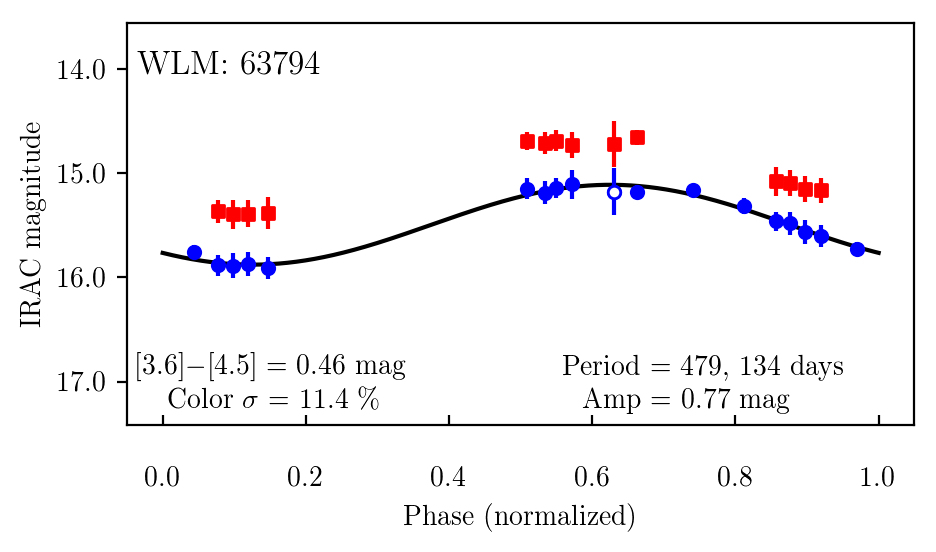
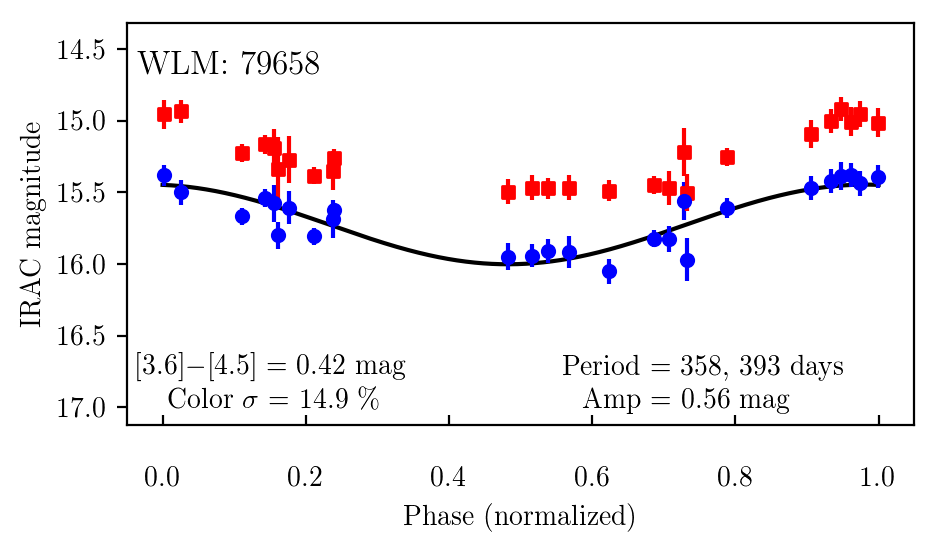
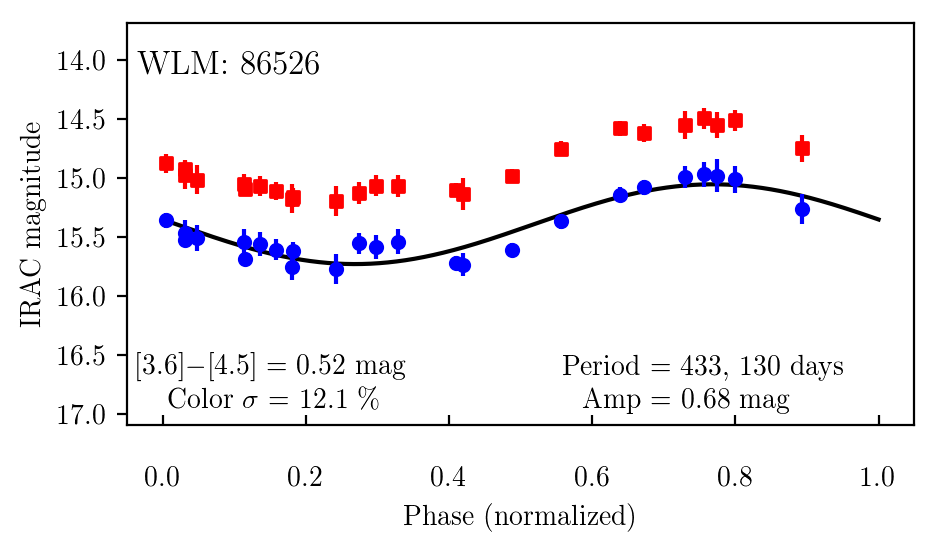
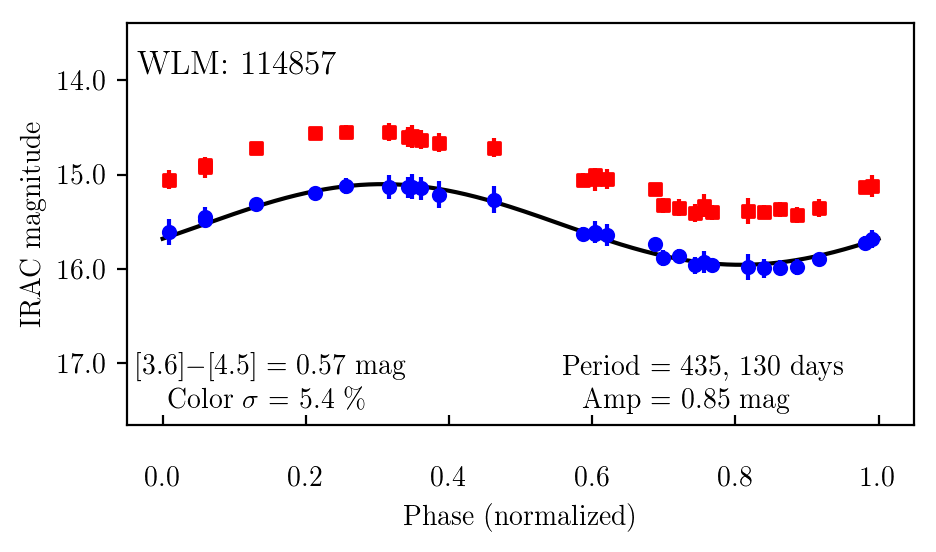
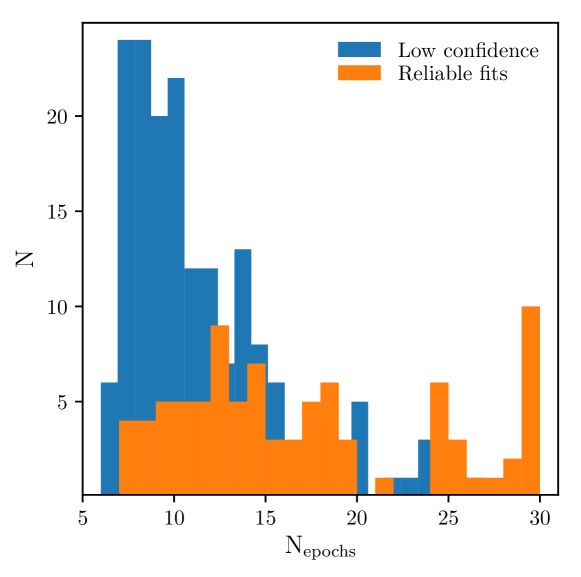
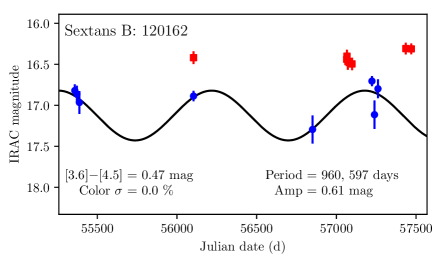
This appendix shows the phased lightcurves of the reliable-fit LPVs. IRAC 3.6 m (blue circles) lightcurves were fit with simple single-term sinusoidal functions using the Lomb-Scargle algorithm. Also shown are the corresponding 4.5 m magnitudes (red squares). Simulated 3.6 m photometry (see §3.2) are shown as open circles. Figure A2 shows the number of epochs for our reliable-fit and low-confidence LPVs.


Appendix B: Low-confidence DUSTiNGS variables
From our visual examination of our sources we have categorized them into two groups: high- and low-confidence LPVs (described in 3.3). The low-confidence variables are those with insufficient epochs to constrain the lightcurve or a poor fit of the model to the data. For the low-confidence variables we show the – relation and how the pulsation behavior is affected by the [3.6][4.5] color in Figures B1, B3, and B4. Examples of low-confidence lightcurves are shown in Figure B2; high-confidence variables are shown in Figure 6.
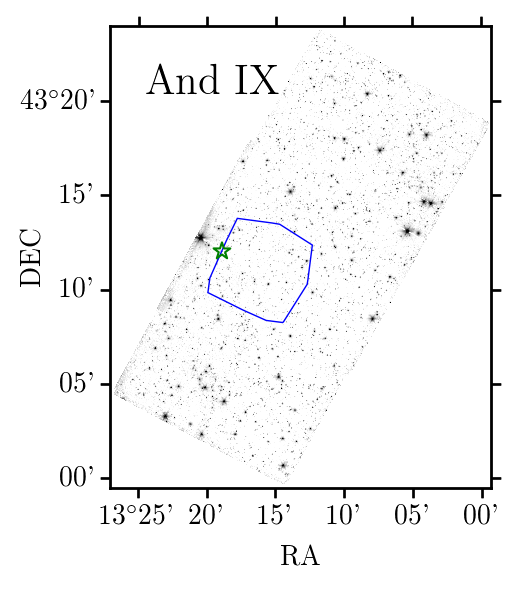
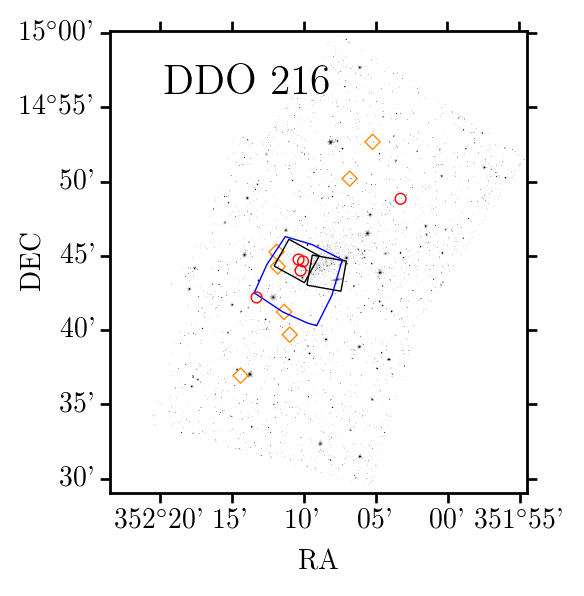
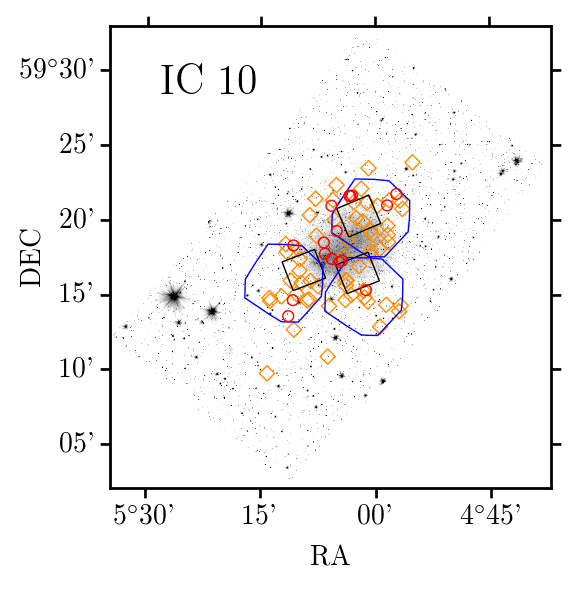
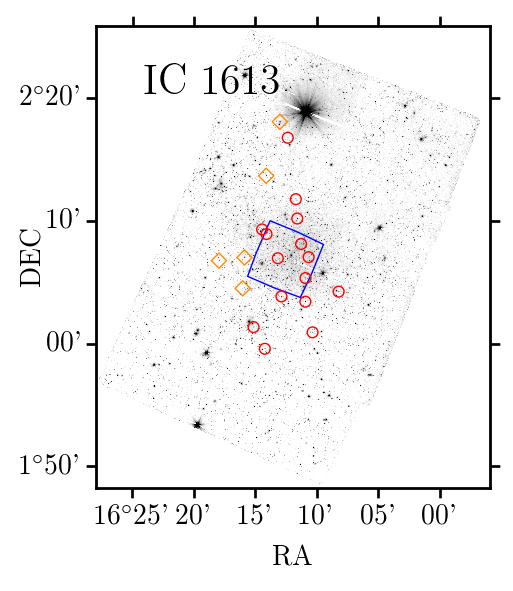
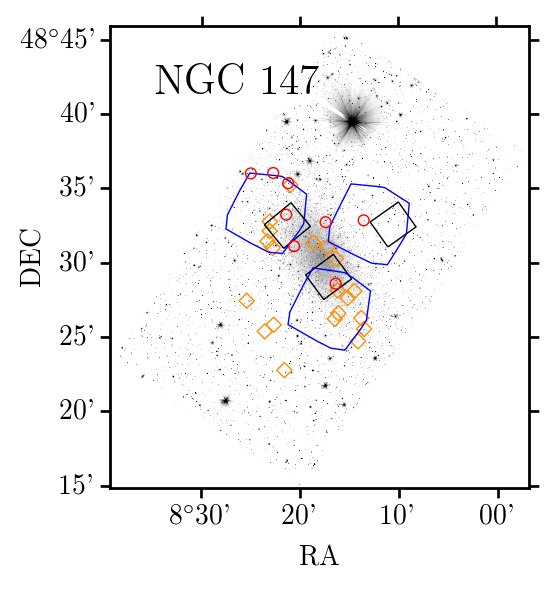
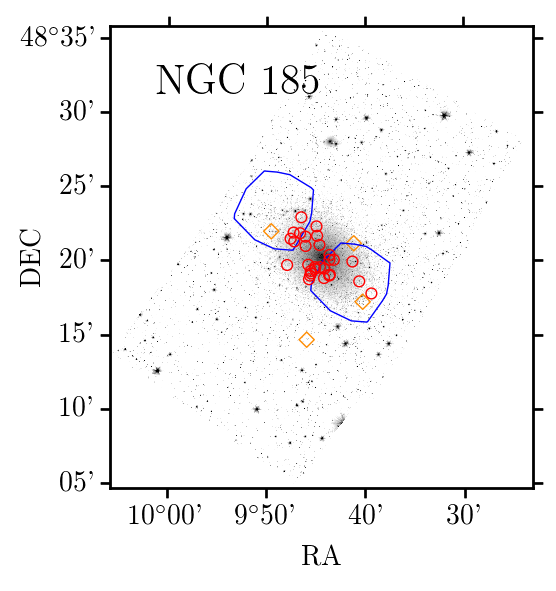
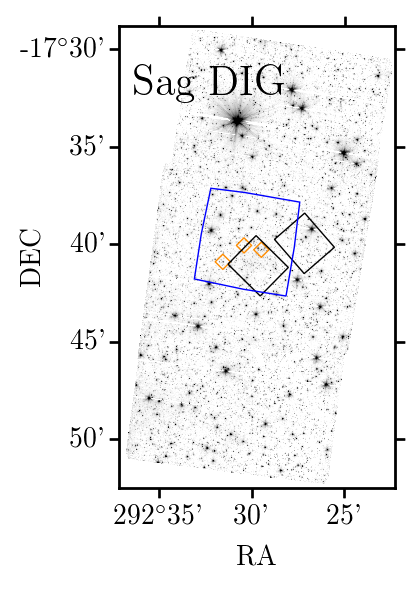
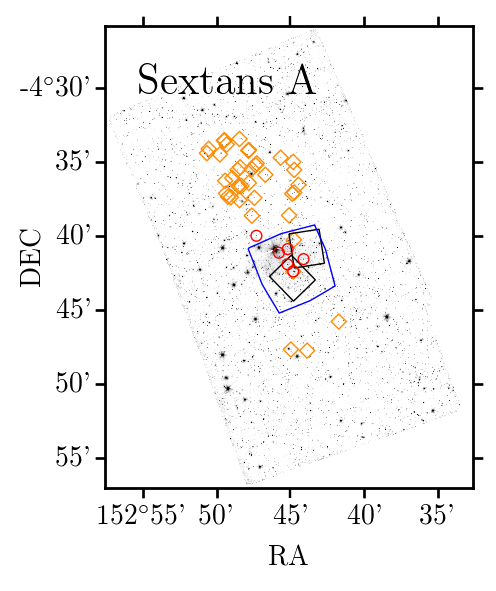
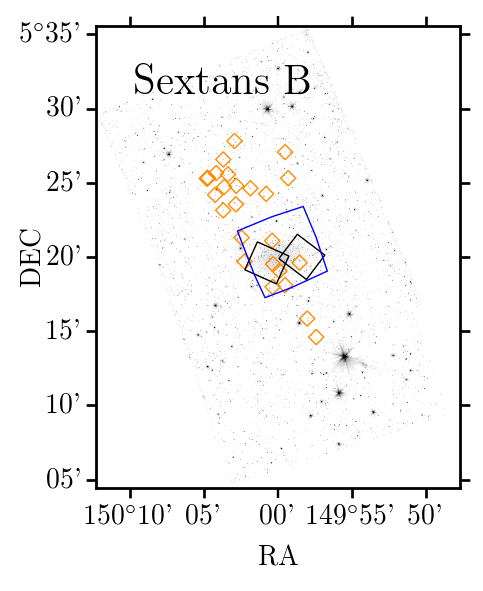
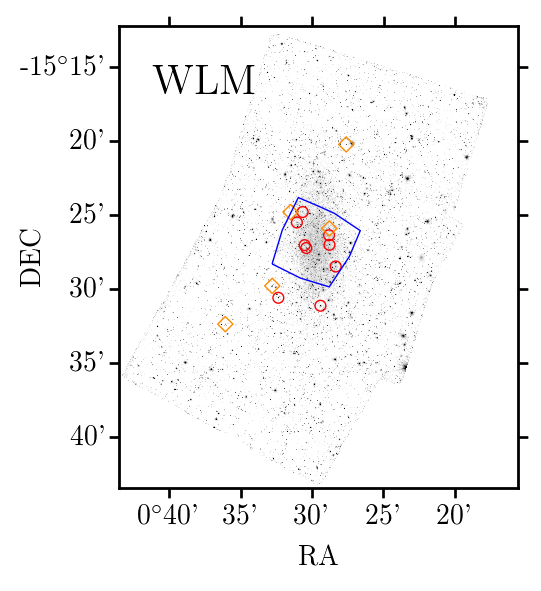
Appendix C: DUSTiNGS spatial distribution
We have mapped the spatial distribution of the high- and low-confidence DUSTiNGS LPVs on the Spitzer mosaics from Paper I (Figure C1). Also shown are the footprints of the HST observations used in Paper IV to disentangle the oxygen- and carbon-rich evolved AGB stars, and the intersecting region that covers all six of the Cycle 11 observations. We have compared the LPVs detected in these intersection regions to the results of Paper II (Table C1) to understand how additional epochs have identified high-confidence variables. Paper II identified 2- and 3-sigma variables using two epochs of data. This survey confirmed a subset of those variables (Table C1). Varying spatial coverage between epochs prevented all of the Paper II variables from being confirmed. However, the increase in the number of epochs in some regions resulted in the discovery of new variables (from 2 to 46 per galaxy) that were not identified in Paper II. Given our spatially and temporally uneven coverage, the variable stars we confirm here are likely a small subset of the total variable population in each galaxy.
LPVs detected outside of these regions have sporadic temporal coverage and poorly constrained lightcurves, with the exception of a few sources with additional archival data. There is also a high number of low-confidence variables in Sextans A and Sextans B above the intersection region. This is due to a higher number of epochs covering these regions as opposed to in the South.
| Galaxy | Reliable fit | Insufficient | Unreliable fit | LPV | Paper II | Paper II | 3 x-AGBS detected |
|---|---|---|---|---|---|---|---|
| epochs | 2 x-AGBs | 3 x-AGBs | in this work | ||||
| And IX | 0 | 0 | 0 | 0 | 0 | 2 | |
| DDO 216 | 3 | 1 | 2 | 0 | 0 | 5 | 60 % |
| IC 10 | 10 | 31 | 16 | 2 | 11 | 122 | 8 % |
| IC 1613 | 5 | 0 | 0 | 0 | 1 | 10 | 50 % |
| NGC 147 | 5 | 10 | 1 | 0 | 2 | 36 | 13 % |
| NGC 185 | 16 | 2 | 0 | 0 | 2 | 28 | 57 % |
| Sag DIG | 0 | 3 | 0 | 0 | 0 | 5 | |
| Sextans A | 5 | 1 | 1 | 0 | 0 | 21 | 23 % |
| Sextans B | 0 | 3 | 4 | 0 | 2 | 19 | |
| WLM | 7 | 0 | 1 | 1 | 1 | 18 | 38 % |
| Total | 51 | 266 | 19 % |