present address: ]Synchrotron SOLEIL, L’Orme des Merisiers, Saint-Aubin, BP 48, 91192 Gif-sur-Yvette Cedex, France
Direct imaging of orbitals in quantum materials
Abstract
The spectacular physical properties of quantum materials based on transition metal, rare earth, and actinide elements continue to challenge our comprehension of solid state physics and chemistry. The electronic states of these materials are dominated by the and wave functions intertwined with the strong band formation of the solid. In order to estimate which wave functions contribute to the ground state formation, we have had to rely, until now, on theoretical calculations combined with spectroscopy. Here we show that -core-level non-resonant inelastic x-ray scattering (-NIXS) can directly image the active orbital in real space, without the necessity of any modeling. The power and accuracy of this new technique is shown using the text-book example, x2-y2/3-r2 orbital of the Ni2+ ion in NiO single crystal.
The search for new materials with novel properties is commonly focused on materials containing transition metal, rare-earth, and/or actinide elements. The presence of the atomic-like or wave functions provide a fruitful playground to generate novel phenomena Cava (2008); Khomskii (2014); Keimer et al. (2015); Wirth and Steglich (2016); Pfleiderer (2009). The intricate interplay of band formation with the local electron correlation and atomic multiplet effects leads to phases that are nearly isoenergetic, making materials’ properties highly tunable by doping, temperature, pressure, or magnetic field. Understanding the behavior of the and electrons is essential for designing and controlling novel quantum materials. Therefore, identifying the or wave functions that actively participate in the formation of the ground state is crucial. So far, these wave functions have been mostly deduced from optical, x-ray and neutron spectroscopy methods in which spectra must be analyzed and interpreted using theory or modeling. This, however, is also a challenge in and of itself since ab-initio calculations hit their limits due to the many-body nature of the problem. Here, we have established an experimental method that circumvents the need for involved analysis, and instead, provides the information as measured. With this technique, we can make a direct image of the active orbital and determine what the atomic-like object looks like in a real solid.
The spectral intensity of the dipole-allowed transition depends on the orientation of the electric field polarization vector of the photon relative to the orientation of the orbital Fowles (1968). Since the orbital is spherically symmetric, sweeping the polarization vector over all angles yields an angular intensity distribution that directly maps the shape and orientation of the orbital hole. Yet, material research requires knowledge of and/or orbital shapes. As the or transitions are dipole forbidden, it has been challenging to develop an experimental method that has non vanishing matrix elements beyond the dipole limit. However, the relatively new experimental method of non-resonant inelastic x-ray scattering (NIXS), available due to modern synchrotron facilities with high brilliance, has offered new potential.
The interaction of light with matter is given by two terms: a term proportional to the scalar product of the electron momentum operator and the photon vector potential , and a term proportional to the vector potential squared. When photon energy matches an atomic resonance, the term dominates; off-resonance, the interaction is governed by the 2 term. Focusing on this last term using NIXS, the double differential cross-section becomes proportional to the dynamical structure factor S(,) Schülke (2008) which contains the material-specific information we are seeking:
where and denote the (many-body) initial and final states, = - the transferred momentum, = - the transferred energy, and i,f and the momentum and energy of the incoming and scattered photons, respectively.
Beyond-dipole matrix elements appear in the scattering cross-section when expanding the transition operator e to the order, whereby denotes the multipole order of the scattering cross-section Schülke (2008); Haverkort et al. (2007); Gordon et al. (2008, 2009); Bradley et al. (2010); Caciuffo et al. (2010); Bradley et al. (2011); van der Laan (2012a, b); Willers et al. (2012). The so-called triangular condition and parity rule restrict the number of multipoles to and + + = even for a transition (respective orbital momenta of initial and final state). This implies that for a transition, only dipole ( = 1), octopole ( = 3), and triakontadipole ( = 5) scattering orders occur, and for -a dipole-forbidden transition- only the quadrupole transition with = 2 contributes to S(). For small momentum transfers , the NIXS spectra very much resemble dipole-allowed x-ray absorption spectroscopy (XAS). In other words, the NIXS excitations in transition metal compounds Haverkort et al. (2007); Gordon et al. (2009) or the and excitations in rare earth and actinide materials Gordon et al. (2008, 2009) exhibit line shapes that are very similar to the ones obtained from XAS Chen et al. (1992); de Groot (1994); Tanaka and Jo (1994); Csiszar et al. (2005); Hansmann et al. (2008). The only difference is that in NIXS, the direction of the momentum transfer (/) provides the information that is obtained from the electrical vector polarization in XAS. However, for large , for the same metal ion, the or transitions yield a different spectral distribution with additional features that cannot be seen in a dipole-based XAS experiment Schülke (2008); Haverkort et al. (2007); Gordon et al. (2008, 2009); Bradley et al. (2010); Caciuffo et al. (2010); Bradley et al. (2011); van der Laan (2012a, b); Willers et al. (2012); Sundermann et al. (2016, 2018). Moreover, the dipole-forbidden or transitions (quadrupolar or octopolar, respectively) now have non-vanishing matrix elements, and consequently are allowed and become visible.
The novelty of our approach is to exploit these -core-level transitions involving our search for a new method to determine - quantitatively and model free - the local valence orbitals that make up the electronic structure of and containing quantum materials. We investigated the transition in an inelastic x-ray scattering experiment (-NIXS) at large momentum transfers and map the quadrupolar scattering intensity as a function of the direction of the momentum transfer relative to the crystal lattice. We used a single crystal of NiO, an antiferromagnetic insulator Sawatzky and Allen (1984), with a Ni configuration as a model system; and the large momentum transfers were guaranteed by high scattering angles and hard x-rays.
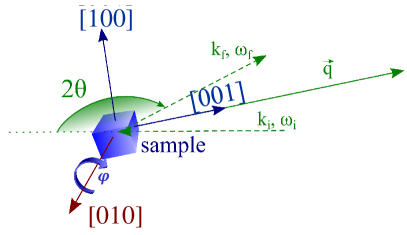
In our experimental setup as illustrated in Fig. 1, S(,) of the NiO sample was
recorded as a function of the sample angle , here defined as the angle between the fixed momentum
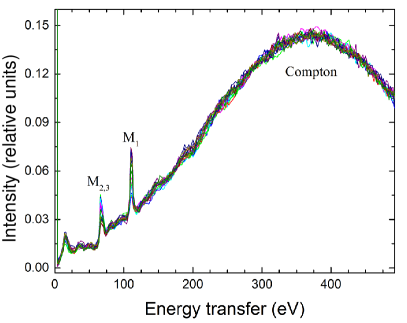
transfer vector and the NiO surface normal (see Methods). Fig. 2 shows a compilation
of NIXS spectra measured for many different sample angles. The spectra show the M2,3 edge
( ) of nickel at around 70 eV and, most importantly, the dipole-forbidden
M1 ( ) excitations at around 110 eV, overlaid on the broad Compton profile.
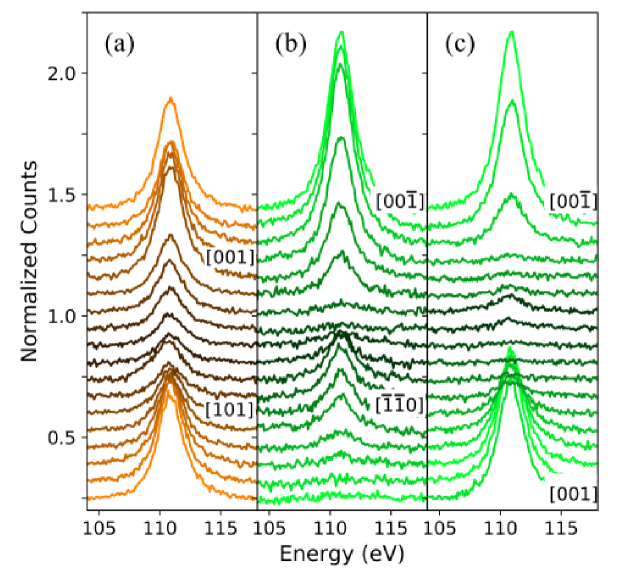
The signal to background ratio is excellent in the energy range of the M1 edge. A close-up of this
edge and its directional dependence on along [001] and [100]
are displayed in Fig. 3 a, and for along [001] and [110]
in Fig. 3 b and c. In the close-up plots, the Compton profile has been subtracted using a simple linear
background (see Methods).
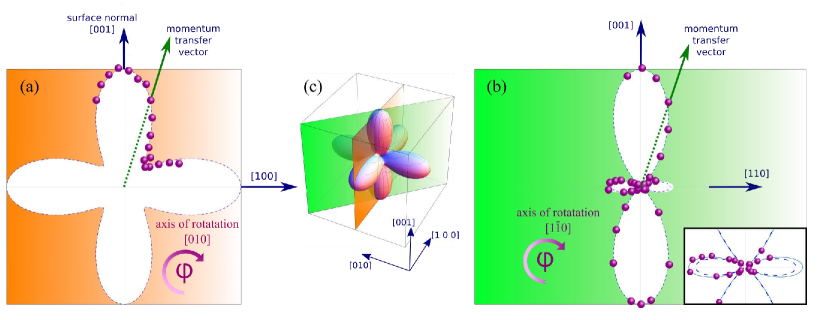
To quantitatively analyze the transition’s directional dependence,
we determined the integrated intensity of each spectrum in Fig. 3 and placed it on a polar plot
as displayed in (Fig. 4). Panel (a) shows the data points for sweeping in the
[001]–[100] plane (orange), and panel (b) for in the [001]–[110] plane (green). They fall
accurately on top of the orbital shapes which denote ’cuts’ through the [001]–[100] (orange) and [001]–[110]
(green) planes of the three-dimensional orbital hole state of the Ni high-spin configuration in
octahedral coordination, namely the ( - )( - ) as
shown in Fig. 4 (c). This means that, for the first time, we have generated a purely experimental method that can directly visualize the fundamental atomic-like quantum mechanical objects in solids. The information that we have obtained is extremely detailed; for example, we can see nicely and clearly see the small lobes of the ( - . Here we note that we have used two orbital shapes in Fig. 4 (b):
the blue dashed line is the ( - )( - ) function and the solid
line is the same function convoluted with the angular acceptance of the 3x4 analyzers we used in our
experiment (see Methods in Section Supplementary). The near perfect agreement further demonstrates the accuracy of the method.
The directional dependence of the integrated -NIXS intensity at the Ni edge ( ) directly maps the local orbital hole of the ion in the ground state. There is no need to carry out multiplet analysis of the spectral line shape to extract this information, in contrast to, for example, the non- edges (e.g. (), (), (), (), and ()) in both NIXS Gordon et al. (2008, 2009); Bradley et al. (2010); Caciuffo et al. (2010); Bradley et al. (2011); Willers et al. (2012); Schülke (2008); Haverkort et al. (2007); Sundermann et al. (2016, 2018) and XAS experiments Chen et al. (1992); de Groot (1994); Tanaka and Jo (1994); Csiszar et al. (2005); Hansmann et al. (2008). The reason is fundamental: The ( ) quadrupolar excitation process involves a spherically symmetric orbital, so the angular distribution of intensity is solely determined by the hole charge distribution in the initial state with respect to the momentum transfer . This is similar to the dipole-allowed transition in XAS, where an angular sweep of the polarization dependence maps out the orientation of the hole directly. We would like to emphasize that details of the -NIXS final states do not matter because the information is extracted from the integrated intensity of the spectra (i.e. from the sum of the intensities of all final states). As a result, only the properties of the initial state are probed. This is analogous to using spectral sum rules to extract expectation values of the relevant quantum numbers of the system in the ground state Csiszar et al. (2005); Thole et al. (1992); Carra et al. (1993). The power of -NIXS, as compared to XAS, is that it allows transitions not only from -to-, but also from -to- and -to- due to the possibility of going beyond the dipole limit when using large momentum transfers .
The -NIXS process involves a core hole, meaning that both the electronic structure of the system and consequently the measured valence hole are projected locally. The intensity distribution is not what would be measured in an x-ray diffraction (XRD) experiment, even if such an experiment could be carried out with sufficient accuracy. In fact, it would be extremely difficult for transition metal, rare earth, and actinide compounds to be measured with the desired accuracy in XRD due to their relatively small number of valence electrons with respect to core electrons. -NIXS provides information complementary to that from an XRD experiment by elucidating which local orbital or atomic wave function is active.
The -NIXS method presented here is not limited to ionic materials. In cases where configuration interaction effects play an important role due to covalency or itineracy, the image of the probed local orbital will reflect these effects directly. The strength of -core-level NIXS is that the information is extracted from the -directional dependence of the integrated intensity and not from the line shape of the spectra. Thus, the details of the final states are no longer important, rendering complex configuration interaction calculations unnecessary. The sole -directional dependence is rooted in the spherical symmetry of the -core hole.
To conclude, we have directly imaged one of the fundamental quantum mechanical objects in crystals, namely, a -orbital, which is derived purely mathematically from first principles. We have revealed that non-resonant inelastic x-ray scattering involving an -core level is an extremely powerful and accurate experimental method to determine the local orbital in the ground state. Albeit low cross-section, the excellent signal to background ratio allows for highly reliable results. The procedure relies on the integrated intensity of the signal, which tremendously simplifies the interpretation as there is no need to carry out multiplet analysis of the spectral line shape to extract the desired information. The method is element specific, which is invaluable for unraveling the different origins for electron correlation effects in complex materials. Since the probing photons have high penetrating power, the measurements are bulk sensitive, and can be performed with complex sample environments (e.g. small samples, high pressures, high/low temperatures). We believe that this method opens up new opportunities for the study of a wide range of and electron containing materials, where knowledge of their local wave function is of central importance to reveal their underlying physics and thus provide guidance for the design of new quantum materials.
I Acknowledgment
M. S., K. C., A. A. and A. S. gratefully acknowledge support from the German funding agency DFG under Grant No SE1441-4-1.
II Appendix
II.1 Experiment:
Non-resonant inelastic x-ray scattering (NIXS) measurements were performed at the High-Resolution Dynamics Beamline P01 of PETRA-III synchrotron in Hamburg, Germany. Fig. 1 illustrates the experimental setup, showing the incoming beam (), sample, scattered beam (), and the corresponding momentum transfer vector (). The energy of the x-ray photon beam incident on the sample was tuned with a Si(311) double-reflection crystal monochromator (DCM). The photons scattered from the sample were collected and energy-analyzed by an array of twelve spherically bent Si(660) crystal analyzers. The analyzers are arranged in a 3x4 configuration. The energy of the analyzers () was fixed at 9690 eV; the energy loss spectra were measured by scanning the energy of the DCM (). Each analyzer signal was individually recorded by a position-sensitive custom-made LAMBDA detector. The energy calibration was regularly checked by measuring the zero-energy-loss position of each spectrum. The best possible energy resolution was guaranteed by pixel-wise analysis of the detector recordings and measured as 0.7 eV (FWHM).
The positioning of the analyzer array determines the momentum transfer vector and the corresponding scattering triangle, which is defined by the incident and scattered photon momentum vectors, i and f, respectively. The large scattering angle (2 155∘) chosen for the current study assured a large momentum transfer of = (9.6 0.1) Å-1 when averaged over all analyzers. f and 2 were kept constant by fixing the energy and the position of the analyzer array. Since the energy transfer range of interest (100 to 120 eV) was small with respect to the incident and final energies (9700 eV), variation of i during energy scanning was insignificant. This guaranteed that the scattering triangle was virtually unchanged throughout the course of the experiment with constant.
II.2 Sample
NiO single crystal (SurfaceNet, Germany) was kept at T = 20K throughout the experiment.
It was aligned as in Fig. 1 and rotated by angle around an axis perpendicular
the [010] lattice direction; [001] ( = 0) corresponds to specular geometry.
Energy scans were taken for many values of so that the directional dependence of
S(,) could be measured for sweeping between [001] and [100]. For the second set of measurements, the crystal was reoriented to evaluate
S(,) on the [001]-. This time, the axis
of rotation was along .
II.3 Data Treatment
The data were normalized to the Compton peak at about 350 eV energy transfer (see Fig. 2). Subsequently, a linear background was subtracted from each spectrum in order to account for the Compton scattering in the energy range of the Ni M1 edge.
Since the analyzer array (3x4) is spread over a finite solid angle, each measured spectrum S(,) includes an array of momentum transfer vectors corresponding to individual analyzers. In this case, taking an average does not work for directions where the orbital wave function varies significantly for small angular changes (i.e. small lobes of the ( - ). The theoretical orbital wave function should be convoluted with the angular spread of the analyzer array to reflect this effect. The inlet on Fig. 4 (b) demonstrates the theoretical function (blue dashed line) and the convoluted function (solid line), which agrees well with the data points.
References
- Cava (2008) R. J. Cava, Journal of the American Ceramic Society 83, 5 (2008).
- Khomskii (2014) D. I. Khomskii, Transition Metal Compounds (Cambridge University Press, 2014).
- Keimer et al. (2015) B. Keimer, S. A. Kivelson, M. R. Norman, S. Uchida, and J. Zaanen, Nature 518, 179 (2015).
- Wirth and Steglich (2016) S. Wirth and F. Steglich, Nature Reviews Materials 1, 16066 (2016).
- Pfleiderer (2009) C. Pfleiderer, Rev. Mod. Phys. 81, 1551 (2009).
- Fowles (1968) G. R. Fowles, Introduction to Modern Optics (Holt, Rinehart and Winston, Inc., 1968).
- Schülke (2008) W. Schülke, Electron dynamics by Inelastic x-ray scattering (Oxford University Press, 2008).
- Haverkort et al. (2007) M. W. Haverkort, A. Tanaka, L. H. Tjeng, and G. A. Sawatzky, Phys. Rev. Lett. 99, 257401 (2007).
- Gordon et al. (2008) R. A. Gordon, G. T. Seidler, T. T. Fister, M. W. Haverkort, G. A. Sawatzky, A. Tanaka, and T. K. Sham, EPL (Europhysics Letters) 81, 26004 (2008).
- Gordon et al. (2009) R. A. Gordon, M. W. Haverkort, S. SenGupta, and G. A. Sawatzky, J. Phys. Conf. Ser. 190, 012047 (2009).
- Bradley et al. (2010) J. A. Bradley, S. Sen Gupta, G. T. Seidler, K. T. Moore, M. W. Haverkort, G. A. Sawatzky, S. D. Conradson, D. L. Clark, S. A. Kozimor, and K. S. Boland, Phys. Rev. B 81, 193104 (2010).
- Caciuffo et al. (2010) R. Caciuffo, G. van der Laan, L. Simonelli, T. Vitova, C. Mazzoli, M. A. Denecke, and G. H. Lander, Phys. Rev. B 81, 195104 (2010).
- Bradley et al. (2011) J. A. Bradley, K. T. Moore, G. van der Laan, J. P. Bradley, and R. A. Gordon, Phys. Rev. B 84, 205105 (2011).
- van der Laan (2012a) G. van der Laan, Phys. Rev. Lett. 108, 077401 (2012a).
- van der Laan (2012b) G. van der Laan, Phys. Rev. B 86, 035138 (2012b).
- Willers et al. (2012) T. Willers, F. Strigari, N. Hiraoka, Y. Q. Cai, M. W. Haverkort, K.-D. Tsuei, Y. F. Liao, S. Seiro, C. Geibel, F. Steglich, et al., Phys. Rev. Lett. 109, 046401 (2012).
- Chen et al. (1992) C. T. Chen, L. H. Tjeng, J. Kwo, H. L. Kao, P. Rudolf, F. Sette, and R. M. Fleming, Phys. Rev. Lett. 68, 2543 (1992).
- de Groot (1994) F. de Groot, J. Electron Spectros. 67, 529 (1994), ISSN 0368-2048.
- Tanaka and Jo (1994) A. Tanaka and T. Jo, J. Phys. Soc. Jpn. 63, 2788 (1994).
- Csiszar et al. (2005) S. I. Csiszar, M. W. Haverkort, Z. Hu, A. Tanaka, H. H. Hsieh, H.-J. Lin, C. T. Chen, T. Hibma, and L. H. Tjeng, Phys. Rev. Lett. 95, 187205 (2005).
- Hansmann et al. (2008) P. Hansmann, A. Severing, Z. Hu, M. W. Haverkort, C. F. Chang, S. Klein, A. Tanaka, H. H. Hsieh, H.-J. Lin, C. T. Chen, et al., Phys. Rev. Lett. 100, 066405 (2008).
- Sundermann et al. (2016) M. Sundermann, M. W. Haverkort, S. Agrestini, A. Al-Zein, M. M. Sala, Y. Huang, M. Golden, A. de Visser, P. Thalmeier, L. H. Tjeng, et al., Proc. Nat. Acad. Science. U.S.A. 113, 13989 (2016).
- Sundermann et al. (2018) M. Sundermann, H. Yavaş, K. Chen, D. J. Kim, Z. Fisk, D. Kasinathan, M. W. Haverkort, P. Thalmeier, A. Severing, and L. H. Tjeng, Phys. Rev. Lett. 120, 016402 (2018).
- Sawatzky and Allen (1984) G. A. Sawatzky and J. W. Allen, Phys. Rev. Lett. 53, 2339 (1984).
- Thole et al. (1992) B. T. Thole, P. Carra, F. Sette, and G. van der Laan, Phys. Rev. Lett. 68, 1943 (1992).
- Carra et al. (1993) P. Carra, B. T. Thole, M. Altarelli, and X. Wang, Phys. Rev. Lett. 70, 694 (1993).