Abstract
The ever-increasing number of genome sequencing and resequencing projects is a central source of insights into the ecology and evolution of non-model organisms. An important aspect of genomics is the elucidation of sex determination systems and identifying genes on sex chromosomes. This not only helps reveal mechanisms behind sex determination in the species under study, but their characteristics make sex chromosomes a unique tool for studying the mechanisms and effects of recombination and genomic rearrangements and how they affect adaption and selection. Despite this, many sequencing projects omit such investigations. Here, we apply a simple method using sequencing coverage statistics to identify scaffolds belonging to the sex chromosomes of minke whale, and show how the sex chromosome system can be determined using coverage statistics alone.
Using publicly available data, we identify the previously unknown sex of an Antarctic minke whale as female. We further investigate public sequence data from the different species and sub-species of minke whale, and classify genomic scaffolds from a published minke whale assembly as X or Y chromosomal sequences. Our findings are consistent with previous results that identified a handful of scaffolds as sex chromosomal, but we are able to identify a much larger set of scaffolds, likely to represent close to the complete sex chromosomal sequences for the minke whale.
Sequence coverage statistics provides a readily available tool for investigating the sex determination system and locate genes on sex chromosomes. This analysis is straightforward and can often be performed with existing resources.
Using sequencing coverage statistics to identify sex
chromosomes in minke whales
Ketil Malde1,2*, Rasmus Skern1, Kevin A. Glover1,3,
1 Institute of Marine Research, Bergen, Norway
2 Deparment of Informatics, University of Bergen, Norway
3 Department of Biology, University of Bergen, Norway
* ketil.malde@imr.no
1 Background
Complete genome sequences are among the most important tools for understanding the molecular inner workings and evolutionary history of a species and its interactions with the ecosystem. Genome sequencing projects are therefore central for broadening our knowledge and the wealth of data they provide has become crucial to modern biology research.
Often, a genome assembly for a novel organism is published along with an analysis of various aspects and characteristics of the genome. Even for ambitious projects, resources are limited, and many potentially interesting topics will by necessity only receive a superficial treatment. For instance, the recent study which published the common minke whale (Balaenoptera acutorostrata) genome only performed a brief investigation of sex chromosomes based on sequence similarity to the bovine genome [1]. Inexpensive analytical methods that can produce useful information without highly specialized know-how or complicated interpretation are therefore highly desirable.
Here we examine how the sex chromosome system of a species can be identified from sequencing data alone, and how a straightforward analysis based on sequencing coverage can reveal the individual scaffolds that constitute the sex chromosomes. We target the minke whale genome and use published data from several sequencing projects to demonstrate how this method can be applied in practice. The minke whale consists of two species, the Antarctic Balaenoptera bonarensis, and the common minke whale Balaenoptera acutorostrata, with two major subspecies, the Atlantic B. a. acutorostrata and Pacific minke whale B. a. scammoni [2].
1.1 Sex chromosomes
Sexually reproducing eukaryotic organisms are normally diploid, with most of the chromosomes (the autosomes) occurring in somatic cells in two copies, one copy inherited from each parent. Sex chromosomes (the allosomes) constitute the major exception to this rule. In most cases, one sex is homogametic, having two copies of one sex chromosome, while the other sex is heterogametic, having one copy of each of the sex chromosomes. In the latter case, the sex chromosomes may be homomorphic or heteromorphic in variable degree depending on the divergence between the sex chromosomes [3]. In mammals, for instance, the male is heterogametic, and the chromosomes are referred to as X and Y, while for many birds and reptiles, the female is heterogametic, and the sex chromosomes are referred to as Z and W. Although the typical case is that heterogametes have a single chromosome of each type, some species lack a Y or W chromosome (then referred to as X0 or Z0 systems), and several examples of species with multiple sex chromosomes exist [4, 5].
Often, the sex chromosomes which are present only in the heterogametic sex (i.e. the Y or W chromosomes) are smaller and have eroded to contain few genes compared to the corresponding sex chromosome which is found in both sexes [6]. An obvious consequence of hemizygosity is a difference in gene dosage which is often, but not always, compensated for in terms of gene expression levels [6].
Local mutations can modify genes and thus affect the fitness of an individual, but the evolution of chromosomes is also governed by local or genome-wide rearrangements like insertions, duplications, deletions, inversions, and translocations. Recombination and these genomic rearrangements can accelerate adaptation by breaking up linkage between advantageous and disadvantageous alleles. Correspondingly, genetic linkage of sites under selection can hamper adaptation by a combination of background selection (loss of non deleterious variation at a locus due to negative selection against a linked locus), Müllers ratchet (incremental accumulation of deleterious mutations) or selective sweeps (loss of genetic variation and accumulation of mutations in a region linked to a locus under positive selection) collectively referred to as the Robertson-Hill effect [6, 7, 8, 9, 10, 11].
Sex chromosomes play an important role in studying the above since the adaptive responsiveness of sex chromosomes is different to that of autosomes due to their haploid state in the heterogametic sex and the inherent smaller chromosome population size. As adaptability of a trait varies with chromosomal location(s) of the underlying gene(s) it is not surprising that the limited empirical data available appear to indicate a non-random distribution of genes in the genome in general and on sex chromosomes in particular [6, 12, 13]. Deciphering the relative importance of the selective mechanisms, corroborating existing knowledge on the evolution of sex chromosomes, and also deciphering mechanisms compensating for gene dosage differences between sexes all depend on increased numbers of sex chromosome datasets available. With the assumption that sequence coverage is proportional to the amount of material used to construct the sequencing libraries, the strategy used here can increase the number of sex chromosome datasets by identifying heteromorphic regions of sex chromosomes directly from the sequencing coverage.
1.2 Sequencing technology challenges
While the goal of genome sequencing often is to reconstruct the complete chromosomes, current sequencing technology only gives us shorter fragments. Illumina HiSeq instruments, for instance, typically produces reads of 100 to 250 base pairs. In the ideal case, each location in the chromosome would be equally likely to produce a sequence fragment. This would give the sequencing coverage a Poisson distribution. For example, with 100 bp reads and 50x coverage, a 10 Kbp contig would then be expected to have about 5000 reads covering it, with a standard deviation of about 70. A similar haploid contig should then have an expected number of reads of about 2500 and a standard deviation of 50. Thus from theory, these distributions are separated by more than 40 standard deviations, and we can classify contigs into one or the other with high accuracy. In practice, the standard deviation is much larger, and in the following, we will briefly look at some of the reasons for this.
The sequencing process itself has inherent coverage biases. One well known bias is tied to the AT/CG ratio of the sequences, with different technologies responding differently to this ratio (e.g., [14, 15]). Another well-known if poorly understood cause for coverage bias is artificial duplicates, where the same DNA fragment results in many identical reads or read pairs (e.g., [16]). Less relevant for genomic sequencing, the use of random hexamer primers in RNA sequencing brings a marked bias in starting points for sequences [17].
Coverage analysis relies on a good reference genome sequence, but this quality is often hampered by the characteristics of the specific genome. One common obstacle is the repeat structure of the genome, where various kinds of repeats (e.g., ALU LINE and SINE repeats and transposable elements, ribosomal genes, and low complexity regions like di- and tri-nucleotide repeats or microsatellites) mean that many genomic regions can be difficult to distinguish from each other. This can be addressed by using long range information, for instance from mate-pair sequencing, to bridge such regions, but the result is often scaffolds with large regions of unknown sequence (by convention represented by Ns). The result is twofold, repeats are often collapsed in the genome reference sequence, and these regions tend to see extremely high coverage of sequencing data, and conversely, regions of Ns will fail to map any reads, giving an apparent coverage of zero. In addition, some species exhibit larger genomic variation than others, and many fish, including the zebrafish (Danio rerio) model organism, have proved challenging [18]. This means that even when a high quality genomic reference can be produced, it may not take into account genomic variation between individuals, and as such, not be representative for the species.
In order to analyze coverage, we need to align (or map) sequencing reads back to the reference genome. Genomic features like repeats can cause difficulties in the mapping, even when the reference sequence is of high quality and correctly resolves these structures, and different short read aligners (e.g. bwa [19] and bowtie [20]) can have different strategies for dealing with ambiguously aligned reads and short indels and other variations.
1.3 Coverage based analysis
Despite the difficulties outlined above, sequence coverage statistics convey important information, and is used to aid many types of analysis; e.g., sequencing error correction [21, 22], genome assembly [23], masking transcriptomic repeats [24], and analyzing metagenomic data [25], and is used directly to aid statistical analysis (e.g., [26]).
With sufficiently long genomic scaffolds and sequencing data with a sufficiently high coverage, it is possible to classify the ploidy of each scaffold in an individual from the sequencing coverage. This approach was used to successfully identify Y- and W-chromosomal genes in chicken [27] and mosquito [28], and to classify scaffolds in fruit fly [29]. Similar methods have since been applied to other cases (see [30] for a review). Coverage analysis has also been used to reveal important information about the evolution and origin of chromosomes [31, 32, 33] In practice, it is possible to both identify the type of sex chromosome arrangement, and to classify each individual scaffold by the type of chromosome it belongs to. The overall expected diploid coverage (2n) is estimated for each sequencing library, and it is then compared to the coverage for individual scaffolds using Table 1.
| System | Male | Female | Class |
| 2n | 2n | autosomal | |
| XY or X0 | 1n | 2n | X |
| XY | 1n | 0 | Y |
| ZW or Z0 | 2n | 1n | Z |
| ZW | 0 | 1n | W |
Recently, a high quality genome assembly of a male Pacific (B. a. scammoni) minke whale that was published by Yim et al [1]. The assembly consists of 104’326 scaffolds, but many are quite short, and only 1003 scaffolds are over 10’000 bp long. Shortly after the publication, the genome and (associated sequencing data) of the Antarctic minke (B. bonaerensis) was published [34]. In addition, we had available full-genome sequencing data of an Atlantic male minke whale (B. a. acutorostrata) [35]. Here, we apply coverage statistics to the analysis of these data, and contrast our findings to previous knowledge about the minke whale sex chromosomes. We show that the method also works across species as long as they are sufficiently closely related. Using this as an example, we argue that this procedure, with little cost and effort, reveals more complete and detailed information than what is typically reported in current sequencing projects.
2 Materials and methods
The minke whale reference genome was downloaded from the bioftp.org website. Sequencing data for the two previously published genome projects [1, 34], listed in Table 2 were downloaded as FASTQ-formatted text files from the EBI FTP site.
| Species | Sex | Type | Cov | Comment |
|---|---|---|---|---|
| B.a.scammoni | M | ind, several libs | 1.26 | Yim et al. [1] |
| B.a.scammoni | F | 3x ind runs | 1.1 | Yim et al. [1] |
| B.a.acutorostrata | M | ind, 2 runs | 0.28 | Malde et al. [35] |
| B.bonaerensis | ? | ind, 1 run | 0.98 | Kishida et al. [34] |
Sequences were mapped to the reference genome using bwa version 0.7.10-r789 [19] using the mem alignment method. The resulting SAM files were then compressed and sorted, and mapping statistics extracted with samtools version 0.1.19-96b5f2294 [36]. The list of files is given in Table 3.
| SRA ID | Specimen | Size | Mapped |
|---|---|---|---|
| SRR4011108 | Atlantic (B.a.acutorostrata) male [35] | 42G | 91.3% |
| SRR4011112 | 42G | 90.5% | |
| DRR014695 | Antarctic (B.bonaerensis) [34] | 315G | 89.5% |
| SRR893003 | Pacific (B.a.scammoni) male [1] | 73G | 92.1% |
| SRR896642 | 27G | 90.6% | |
| SRR901891 | 67G | 92.0% | |
| SRR908213 | 50G | 96.8% | |
| SRR914419 | 30G | 96.9% | |
| SRR915980 | 24G | 93.6% | |
| SRR917970 | 9G | 96.3% | |
| SRR924087 | Pacific (B.a.scammoni) female 1 [1] | 103G | 99.3% |
| SRR924103 | Pacific (B.a.scammoni) female 2 [1] | 93G | 99.4% |
| SRR926179 | Pacific (B.a.scammoni) female 3 [1] | 85G | 99.3% |
We wrote a small program to count the number of N characters in each scaffold, and the mapping statistics reported by samtools were then normalized to the scaffold length subtracted the number of Ns.
Bérubé and Palsboll [37] identified PCR primers (replicated here in Table 4) that provided an effective sex assay for minke whales. These primers give two different PCR products in males (212 and 245 bp in size), but only a single (245 bp) product in females, and therefore distinguish between the two sexes. The sex marker primer sequences were matched against the minke genome scaffolds using blastn with an E-value threshold of 0.1, and otherwise using default parameters.
| Name | Sequence |
|---|---|
| ZFYX-1 | ATAGGTCTGCAGACTCTTCTA |
| ZFYX-2 | ATTACATGTCGTTTCAAATCA |
| ZFYX-3 | CACTTATGGGGGTAGTCCTTT |
3 Results and discussion
3.1 PCR-based sex markers
The PCR primers identified by Bérubé and Palsboll [37] were matched against the genome assembly using BLAST, resulting in the matches given in Table 5. We see that scaffold351 matches ZFYX-3 in the forward direction, and ZFYX-1 in the reverse direction, 243 bp further downstream. Similarly scaffold380 matches ZFYX-2 and ZFYX-3 in the forward direction, and ZFYX-1 in the reverse direction, with distances of 243 bp and 210 bp. These matches are consistent with the products described by Bérubé and Palsboll, and we conclude that scaffold351 (of length 468 Kbp) originates from the X chromosome, while scaffold380 (274 Kbp) is from the Y chromosome.
| Query | Target | Id | len | subst | gaps | QStart | QEnd | TStart | TEnd | Eval | Score |
|---|---|---|---|---|---|---|---|---|---|---|---|
| ZFYX-1 | scaffold3112.1 | 100.00 | 21 | 0 | 0 | 1 | 21 | 61 | 41 | 0.002 | 42.1 |
| ZFYX-3 | scaffold351 | 100.00 | 21 | 0 | 0 | 1 | 21 | 86228 | 86248 | 0.002 | 42.1 |
| ZFYX-1 | scaffold351 | 100.00 | 21 | 0 | 0 | 1 | 21 | 86471 | 86451 | 0.002 | 42.1 |
| ZFYX-3 | scaffold380 | 100.00 | 20 | 0 | 0 | 1 | 20 | 44203 | 44222 | 0.008 | 40.1 |
| ZFYX-2 | scaffold380 | 100.00 | 21 | 0 | 0 | 1 | 21 | 44236 | 44256 | 0.002 | 42.1 |
| ZFYX-1 | scaffold380 | 100.00 | 21 | 0 | 0 | 1 | 21 | 44446 | 44426 | 0.002 | 42.1 |
| ZFYX-3 | scaffold8069.1 | 100.00 | 20 | 0 | 0 | 1 | 20 | 20 | 1 | 0.008 | 40.1 |
3.2 Alignment-based identification of sex chromosomes
As part of the Pacific minke genome sequencing project, Yim et al [1] identified eight putative scaffolds as sex chromosomes by using LASTZ [38] to match them against bovine sex chromosomes. According to their Supplementary Table 16, the matches covered from 56% to 72% of the contigs. The length of these contigs totaled 807 Kbp, and contained 11 identified genes.
These pre-existing resources identify ten scaffolds of a total length of 1549 Kbp of scaffolds classified as putative sex chromosomes. In contrast, the human genome is similar in size to the minke whale, and has an X chromosome size of 155 Mbp, almost precisely a hundred times larger than these scaffolds. The human X chromosome is estimated to contain 1098 genes [39]. Chromosome sizes vary between species, but for mammals where the genome assemblies have sufficient quality for NCBI Genomes to list individual chromosome sizes (Table 6), X chromosomes range from 127 (cat) to 171 (mouse) Mbp. The Y chromosomes vary more in size, and the size estimates are less reliable due to repeats, low complexity, and heterochromatic sequence, but they are normally much smaller than X chromosomes. Unless the minke whale is very atypical, these earlier works have only identified a small fraction of the sex chromosomes, perhaps as little as one percent.
| Scientific name | Vernacular | X | Y |
|---|---|---|---|
| Homo sapiens | Human | 156 | 57 |
| Bos taurus | Cow | 148 | - |
| Equus caballus | Horse | 124 | - |
| Felis catus | Cat | 127 | - |
| Mus musculus | Mouse | 171 | 91 |
| Rattus norwegicus | Rat | 159 | 3 |
3.3 Sequence coverage for the Pacific minke whale
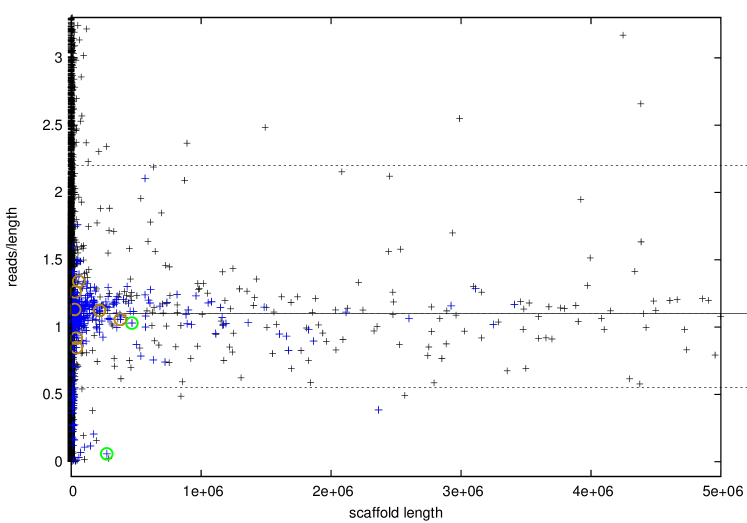
Examining how the sequencing data maps back to the genome assembly by plotting the number of mapped sequences from the male specimen on each contig (or scaffold) against the contig length (Fig 1), it is clear that most of the data points cluster along one of two horizontal axes: one centered around y=1.2 and one at y=0.6. The obvious hypothesis is that these correspond to autosomal chromosomes and allosomal (sex chromosomes) respectively, and we will investigate this further below.

In Fig 1, as well as in the following diagrams, contigs with coverage between 0.28 and 0.88 in the Pacific male have been marked in blue. In addition, the eight putative sex chromosome contigs identified by Yim et al [1] have been circled in orange, and the two contigs matching the PCR primers of [37] have been circled in green.
From Fig 1, it is apparent that not all of the putative sex chromosome scaffolds (i.e., orange circles) appear to have a coverage consistent with allosomal scaffolds. We will return to this point below. We see that for short contigs, the data become quite noisy. It is clear from the theoretical Poisson distribution that variance is a function of length, so short contigs (with correspondingly few mapped reads) will tend to have a high variance. But more importantly, short contigs are often a result of problems in the assembly process. For instance, repeats or low complexity regions are difficult for the assembler software to resolve, leading to ambiguities in the sequence that forces it to terminate contigs early.
In addition to the reference individual, Yim et al [1] sequenced three female specimens. In order to corroborate our hypothesis, we can contrast the results from the male with a similar plot of the data from three female specimens, from the same project.
Here (Fig 2) we see that the data is centered along a single axis, corresponding to a coverage of approximately 1.1. Although there are many quite short contigs with highly variable coverage, there appears to be a small cluster of slightly longer contigs with low coverage in the bottom left corner. No such cluster is apparent in the data from the male, and it is tempting to classify these as belonging to the Y-chromosome, with the apparent coverage resulting from sequence similarity between the X and Y chromosomes. This conjecture is supported by the Y-marker scaffold being placed clearly in this group, while the X-marker scaffold has coverage consistent with the autosomal scaffolds.
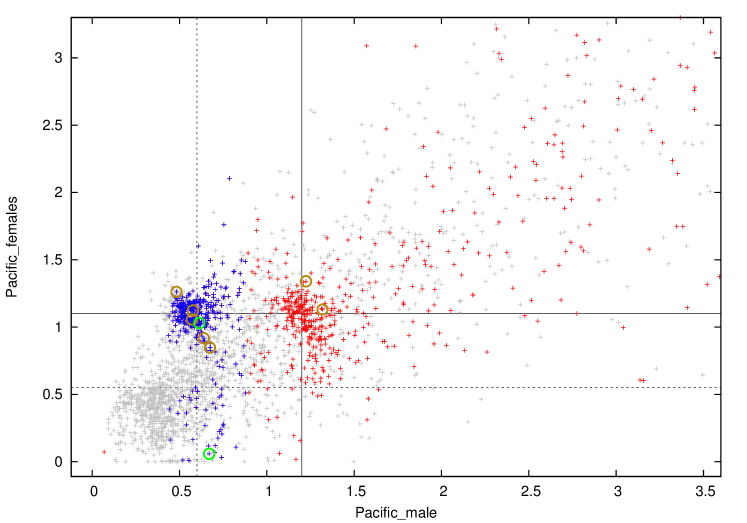
If we examine the correlation between coverage in the Pacific male with the coverage in the Pacific female (Fig 3), we see that the coverage data forms two clear clusters, one representing sex chromosomes with half the normal coverage in the male (as before, blue color indicates coverage between 0.28 and 0.88 in the Pacific male data), and another representing autosomes in red. For clarity, only contigs longer than 10 Kbp are highlighted in color, shorter contigs are shown in gray. Short contigs often arise from sequencing errors, and therefore tend to be noisier and have more variable coverage. We observe that most of the putative sex chromosome scaffolds are placed as expected. Also, the Y-marker scaffold is placed with close to zero coverage in the female. However, there isn’t a clear cluster surrounding this scaffold, but rather a set of scaffolds with haploid coverage in male, but a range of coverages stretching from zero to diploid coverage in females. This is likely due to similarity between homologous regions between the X and Y chromosomes, causing some X chromosomal reads to map to Y chromosomal scaffolds.
3.4 The Atlantic subspecies
The Atlantic minke whale (B. acutorostrata acutorostrata) is, like the Pacific minke (B. acutorostrata scammoni), considered a subspecies of the common minke whale (B. acutorostrata). Although there are clear genetic differences between them [40], we can expect the two subspecies to be sufficiently closely related that sequences from the Atlantic minke can be mapped to the Pacific reference assembly with little error.
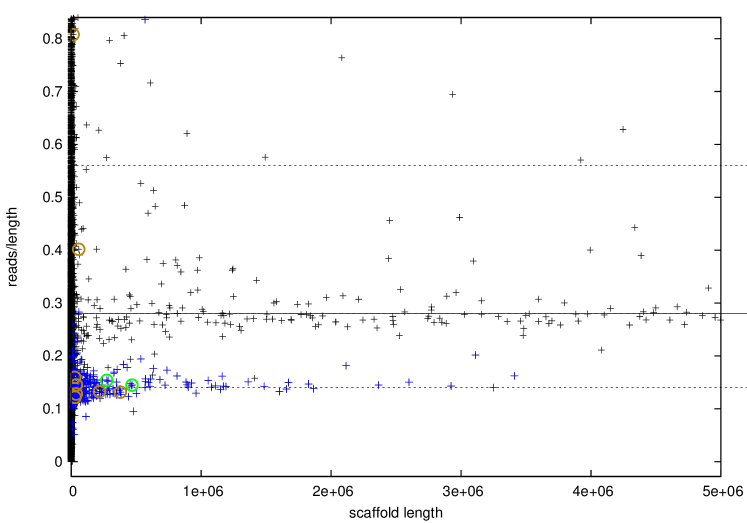
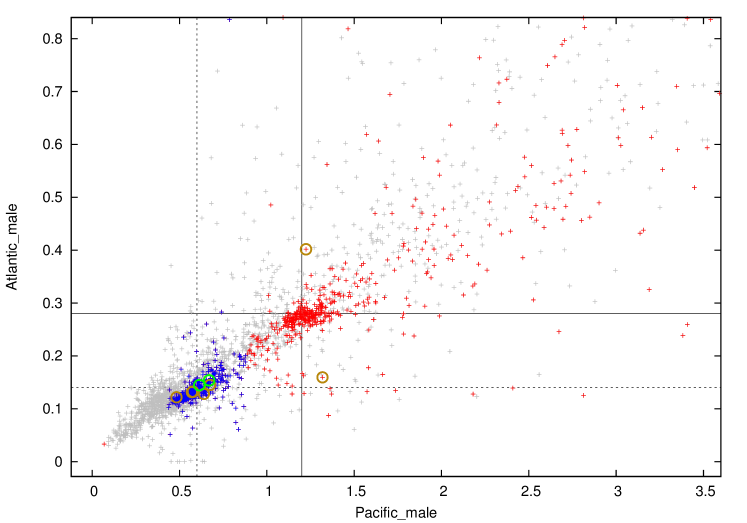
In Fig 4, we see that this indeed seems to be the case. Here, we have taken sequences from a male Atlantic specimen, and mapped them to the (B. a. scammoni) reference genome. We see that the emerging picture is consistent with the data from the Pacific male, clearly identifying the specimen as a male. One exception is the two putative sex chromosomal scaffolds which exhibited autosomal coverage in the Pacific specimen. In the Atlantic male, one of them has coverage consistent with sex chromosomes, while the other has in fact increased coverage. This is perhaps even clearer from Fig 5, which displays the correlation between coverage in the Pacific male and the Atlantic male specimens. Most likely, these scaffolds are repeats that vary in copy number between individuals. Apart from these scaffolds, the data groups clearly into two clusters consistent with autosomal and allosomal chromosomes.
3.5 The Antarctic minke whale
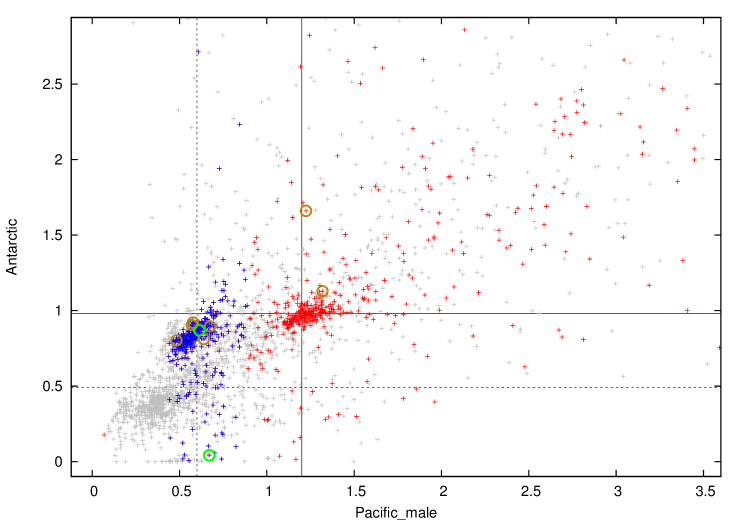
In a recent study, Kishida et al [34] used DNA sequencing of an Antarctic minke whale (B. bonaerensis) to study the genetic effects of aquatic adaption of mammals. The Antarctic minke is more distantly related, and it is considered a separate species [41]. The individual studied by Kishida et al. [34], was of undetermined sex, but by mapping the data and comparing Fig 6 to the figures above, it becomes clear that this is a female specimen.

From comparing coverage of Pacific male to the Antarctic female (Fig 7) we see a similar picture, but note that coverage for the X cluster in the female is lower than for the autosomal cluster. We speculate that this could be an artifact of rapid evolution of haploid chromosomes, leading to somewhat fewer sequences matching it.
3.6 Sorting out contigs
In Table 7 we look in more detail at the coverage scaffolds identified as sex chromosomes by [1], and the two scaffolds matching the sex markers from [37]. Of the eight scaffolds classified as X chromosomal by Yim et al, five have coverage consistent with X-chromosomal scaffolds both in males and females. The scaffolds identified by the markers fit the expected coverage from X and Y almost perfectly.
| NCBI Accession | Scaffold | PM | PF | AM | Ant |
|---|---|---|---|---|---|
| NW_006732179.1 | scaffold725 | 0.403 | 1.147 | 0.435 | 0.819 |
| NW_006728548.1 | scaffold398 | 0.481 | 1.022 | 0.473 | 0.940 |
| NW_006733712.1 | scaffold863 | 4.161 | 7.436 | 2.890 | 5.457 |
| NW_006731312.1 | scaffold647 | 0.567 | 0.770 | 0.519 | 0.914 |
| NW_006730490.1 | scaffold573 | 1.020 | 1.218 | 1.435 | 1.694 |
| NW_006728042.1 | scaffold352 | 0.476 | 0.961 | 0.469 | 0.923 |
| NW_006732401.1 | scaffold745 | 1.099 | 1.029 | 0.570 | 1.152 |
| NW_006731168.1 | scaffold634 | 0.533 | 0.834 | 0.458 | 0.829 |
| NW_006728031.1 | scaffold351 | 0.511 | 0.937 | 0.518 | 0.888 |
| NW_006728349.1 | scaffold380 | 0.558 | 0.054 | 0.550 | 0.044 |
Of the remaining three scaffolds, we see that scaffold573 appears to have roughly normal diploid coverage, the slightly higher coverages for Atlantic and Antarctic minke may be indicative of repeat structures. Scaffold745 is interesting, as it appears diploid in Pacific minke, but is close to haploid in Atlantic minke. That the observed coverage deviates from the expected coverage for an allosome does not disprove the claim of their X-chromosomal origin, but suggests that a closer investigation should be performed before their classification can be finally determined. Scaffold863 has about 4x the expected (diploid) coverage in Pacific male, and close to twice that in the Pacific females. Coverage is lower in Atlantic and Antarctic, but viewed independently, this is consistent with an X-chromosomal scaffold. It seems likely this scaffold is (or contains) a repeat, and that copy number variation is responsible for the variation between the groups.
From coverage we estimate 18’907 scaffolds belong to the allosomes, representing a total length of 97’232’273, or 85’666’973 not counting Ns. Most of these scaffolds are short, and only 357 of them are longer than 10 Kbp, totaling 91’066’100, or 79’974’798 bp not counting Ns. Thus, despite the large number of short scaffolds, they constitute only 6.3% of the putative allosomal sequences.
For reasons outlined above, segregating Y from XY is more difficult, but if we take a coverage of 0.6 in the Pacific female data as a threshold, we identify a subset of 5’318 scaffolds representing 5’973’998 bp (5’410’860 bp without Ns), or 37 scaffolds longer than 10 Kb representing 3’955’760 bp (3’602’523 bp without Ns).
3.7 Genes on the sex chromosomes
Yim et al [1] identify 27109 genes in the complete genome (including 13 on the mitochondrial genome, and 4084 pseudogenes). Matching this list against the 357 scaffolds longer than 10 Kbp that were identified as sex chromosomes from the coverage data, we identified a set of 1007 genes. This is summarized in Table 8. The sets are highly redundant, and only two genes identified as X chromosomal by Yim et al., FAM123B and ASB12, both from scaffold573, were not corroborated by the coverage analysis.
| Method | scaffolds | genes |
|---|---|---|
| Markers | 2 | 18 |
| Alignment | 8 | 13 |
| Coverage | 357 | 1007 |
4 Conclusions
Classifying scaffolds by coverage is straightforward and works well. Although multiple high-coverage libraries are desirable (and often available), a single sequencing library from each sex can, when mapped to a high quality genome assembly, be sufficient to separate sex chromosomal sequences from autosomes. Here we use an Illumina HiSeq genomic shotgun library, but other technologies like RADseq [42] and transcriptome sequencing [43] can also be used to good effect. In contrast, commonly used methods based on homology tend to fail to correctly identify much of the sex chromosomal sequences. With some care in planning of experiments and sequencing, any genome project should be able to integrate this analysis, and thereby identify a large fraction of scaffolds representing sex chromosomes. The sizes of the minke whale allosomes are not known, but if they are close to the mammalian average, the 90 Mbp of large scaffolds we have identified in this study would represent approximately 60% of the total. More importantly, repeats, pseudoautosomal regions, and low complexity sequence which confounds this analyis are often found in the intergenic regions. This number is therefore a conservative estimate for sex chromosomal genes, and the number of discovered genes is reasonable when compared to the number of sex chromosomal genes in mammals.
Although we have here only applied this method to the minke whale, we expect the method would work well for other species with XY or ZW sex chromosome systems. There are, however, some important limitations. In particular, a high quality reference genome sequence is necessary, where contigs are long enough to even out local variations in the sequencing coverage. In our analysis, we found that scaffolds longer than 10 Kbp were sufficient. We further found that adjusting for Ns in the scaffolds improved the results. The presence of repeats did not appear to cause similar problems here, it is possible that for genome assemblies where many repeat sequences are collapsed, this can skew coverage statistics. One should also be aware of other causes of coverage variation. Many species have small haploid chromosomes called B-chromosomes whose presence may vary between individuals [44]. For species with a high degree of genomic variation between individuals, more care may need to be taken in sampling and sequencing for coverage analysis to be effective. Sex chromosomes in particular often have heterochromatic sequence, repeats, and homologous regions that may not be possible to resolve using mapping coverage alone. Sequence coverage, like many computational methods, thus serves as a starting point, and results should be verified by independent, experimental methods like PCR, qPCR or FISH.
4.1 Estimation of expected coverage
We do not here provide a rigorous statistical analysis for estimating the average coverage. Although it is common to discuss this in analytical (typically assuming reads are Poisson distributed) or empirical terms, in our experience (and as discussed above) sequencing data are fraught with errors and biases. To get a good fit in practice, some amount of judgement must be applied. In any case, we find the clustering is apparent from the data, and thus we focus on the biological implications. For readers interested in pursuing a rigorous approach, we here provide some pointers.
Starting with the assumption of coverage approximately following a Poisson distribution, we run into the complication of heteroskedasticity - specifically, that the variance in coverage over a long scaffold will be lower than the variance over short scaffolds. This variation is evident from the trumpet shape of the plots. To deal with this, it is common to adjust the Poisson model with an exposure variable, using the log size of the exposure (i.e., scaffold length) as a parameter with a fixed coefficient of 1.
In reality, coverage is not Poisson distributed, and repeats, assembly errors and sequencing errors and biases are likely to cause overdispersion. In this case, a negative binomial distribution is likely to be a better approximation.
In the case of comparing a male to a female specimen, we would like to model the data as coming from a mixture of distributions (see Table 1) with different coefficients (corresponding to the relative sizes of the autosome and sex chromosomes). This is a good application of the Expectation Maximization algorithm, which could be used with either a Poisson distribution with exposure, or negative binomials.
4.2 Availability
All data used is publicly available as described in the relevant publications [1, 34, 35]. The scripts used in the analysis are released in the public domain and available from GitHub (https://github.com/ketil-malde/sexchrcov).
References
- [1] Yim HS, Cho YS, Guang X, Kang SG, Jeong JY, Cha SS, et al. Minke whale genome and aquatic adaptation in cetaceans. Nature genetics. 2014;46(1):88–92.
- [2] Rice DW Marine mammals of the world. Systematics and distribution. 1998.
- [3] Wright AE, Dean R, Zimmer F, Mank JE. How to make a sex chromosome. Nature communications. 2016;7:12087.
- [4] White MJ. The origin and evolution of multiple sex-chromosome mechanisms. Journal of Genetics. 1940;40(1):303–336.
- [5] Rens W, O’Brien P, Grutzner F, Clarke O, Graphodatskaya D, Tsend-Ayush E, et al. The multiple sex chromosomes of platypus and echidna are not completely identical and several share homology with the avian Z. Genome Biol. 2007;8(11):R243.
- [6] Kaiser VB, Bachtrog D. Evolution of sex chromosomes in insects. Annual review of genetics. 2010;44:91.
- [7] Hill WG, Robertson A. The effect of linkage on limits to artificial selection. Genetical research. 1966;8(03):269–294.
- [8] Eichler EE, Sankoff D. Structural dynamics of eukaryotic chromosome evolution. Science. 2003;301(5634):793–797.
- [9] Comeron JM, Williford A, Kliman R. The Hill–Robertson effect: evolutionary consequences of weak selection and linkage in finite populations. Heredity. 2008;100(1):19–31.
- [10] Presgraves DC. Recombination enhances protein adaptation in Drosophila melanogaster. Current Biology. 2005;15(18):1651–1656.
- [11] Barton N. Genetic linkage and natural selection. Philosophical Transactions of the Royal Society of London B: Biological Sciences. 2010;365(1552):2559–2569.
- [12] Magnusson K, Lycett GJ, Mendes AM, Lynd A, Papathanos PA, Crisanti A, et al. Demasculinization of the Anopheles gambiae X chromosome. BMC evolutionary biology. 2012;12(1):69.
- [13] Jaquiéry J, Rispe C, Roze D, Legeai F, Le Trionnaire G, Stoeckel S, et al. Masculinization of the X chromosome in the pea aphid. Plos Genet. 2013;9(8):e1003690.
- [14] Quail MA, Smith M, Coupland P, Otto TD, Harris SR, Connor TR, et al. A tale of three next generation sequencing platforms: comparison of Ion Torrent, Pacific Biosciences and Illumina MiSeq sequencers. BMC genomics. 2012;13(1):341.
- [15] Dohm JC, Lottaz C, Borodina T, Himmelbauer H. Substantial biases in ultra-short read data sets from high-throughput DNA sequencing. Nucleic acids research. 2008;36(16):e105–e105.
- [16] Balzer S, Malde K, Grohme MA, Jonassen I. Filtering duplicate reads from 454 pyrosequencing data. Bioinformatics. 2013;29(7):830–836.
- [17] Hansen KD, Brenner SE, Dudoit S. Biases in Illumina transcriptome sequencing caused by random hexamer priming. Nucleic acids research. 2010;38(12):e131–e131.
- [18] Brown KH, Dobrinski KP, Lee AS, Gokcumen O, Mills RE, Shi X, et al. Extensive genetic diversity and substructuring among zebrafish strains revealed through copy number variant analysis. Proceedings of the National Academy of Sciences. 2012;109(2):529–534.
- [19] Li H, Durbin R. Fast and accurate short read alignment with Burrows–Wheeler transform. Bioinformatics. 2009;25(14):1754–1760.
- [20] Langmead B, Salzberg SL. Fast gapped-read alignment with Bowtie 2. Nature methods. 2012;9(4):357–359.
- [21] Simpson JT, Durbin R. Efficient de novo assembly of large genomes using compressed data structures. Genome research. 2012;22(3):549–556.
- [22] Liu Y, Schröder J, Schmidt B. Musket: a multistage k-mer spectrum-based error corrector for Illumina sequence data. Bioinformatics. 2013;29(3):308–315.
- [23] Chen K, Chen L, Fan X, Wallis J, Ding L, Weinstock G. TIGRA: a targeted iterative graph routing assembler for breakpoint assembly. Genome research. 2014;24(2):310–317.
- [24] Malde K, Schneeberger K, Coward E, Jonassen I. RBR: library-less repeat detection for ESTs. Bioinformatics. 2006;22(18):2232–2236.
- [25] Brown CT, Howe A, Zhang Q, Pyrkosz AB, Brom TH. A reference-free algorithm for computational normalization of shotgun sequencing data. arXiv preprint arXiv:12034802. 2012;.
- [26] Malde K. Estimating the information value of polymorphic sites using pooled sequences. BMC genomics. 2014;15(Suppl 6):S20.
- [27] Chen N, Bellott DW, Page DC, Clark AG. Identification of avian W-linked contigs by short-read sequencing. BMC genomics. 2012;13(1):183.
- [28] Hall AB, Qi Y, Timoshevskiy V, Sharakhova MV, Sharakhov IV, Tu Z. Six novel Y chromosome genes in Anopheles mosquitoes discovered by independently sequencing males and females. Bmc Genomics. 2013;14(1):273.
- [29] Carvalho AB, Clark AG. Efficient identification of Y chromosome sequences in the human and Drosophila genomes. Genome research. 2013;23(11):1894–1907.
- [30] Tomaszkiewicz M, Medvedev P, Makova KD. Y and W chromosome assemblies: approaches and discoveries. Trends in Genetics. 2017;.
- [31] Fraïsse C, Picard MA, Vicoso B. The deep conservation of the Lepidoptera Z chromosome suggests a non-canonical origin of the W. Nature communications. 2017;8(1):1486.
- [32] Vicoso B, Emerson J, Zektser Y, Mahajan S, Bachtrog D. Comparative sex chromosome genomics in snakes: differentiation, evolutionary strata, and lack of global dosage compensation. PLoS Biology. 2013;11(8):e1001643.
- [33] Vicoso B, Bachtrog D. Reversal of an ancient sex chromosome to an autosome in Drosophila. Nature. 2013;499(7458):332.
- [34] Kishida T, Thewissen J, Hayakawa T, Imai H, Agata K. Aquatic adaptation and the evolution of smell and taste in whales. Zoological Letters. 2015;1(1):1–10.
- [35] Malde K, Seliussen BB, Quintela M, Dahle G, Besnier F, Skaug HJ, et al. Whole genome resequencing reveals diagnostic markers for investigating global migration and hybridization between minke whale species. BMC genomics. 2017;18(1):76.
- [36] Li H, Handsaker B, Wysoker A, Fennell T, Ruan J, Homer N, et al. The sequence alignment/map format and SAMtools. Bioinformatics. 2009;25(16):2078–2079.
- [37] Bérubé M, Palsboll P. Identification of sex in cetaceans by multiplexing with three ZFX and ZFY specific primers. Molecular Ecology. 1996;5(2):283–287.
- [38] Harris RS. Improved pairwise alignment of genomic DNA. ProQuest; 2007.
- [39] Ross MT, Grafham DV, Coffey AJ, Scherer S, McLay K, Muzny D, et al. The DNA sequence of the human X chromosome. Nature. 2005;434(7031):325–337.
- [40] Pastene LA, Goto M, Kanda N, Zerbini AN, Kerem D, Watanabe K, et al. Radiation and speciation of pelagic organisms during periods of global warming: the case of the common minke whale, Balaenoptera acutorostrata. Molecular Ecology. 2007;16(7):1481–1495.
- [41] Arnason U, Gullberg A, Widegren B. Cetacean mitochondrial DNA control region: sequences of all extant baleen whales and two sperm whale species. Molecular Biology and Evolution. 1993;10(5):960–970.
- [42] Gamble T, Coryell J, Ezaz T, Lynch J, Scantlebury DP, Zarkower D. Restriction site-associated DNA sequencing (RAD-seq) reveals an extraordinary number of transitions among gecko sex-determining systems. Molecular Biology and Evolution. 2015;32(5):1296–1309.
- [43] Rovatsos M, Vukić J, Kratochvíl L. Mammalian X homolog acts as sex chromosome in lacertid lizards. Heredity. 2016;117(1):8.
- [44] White MJD. The chromosomes [by] M. J. D. White. 6th ed. Chapman and Hall, distributed by Halsted Press, New York London; 1973.