STUDY OF THE PROCESS IN THE C.M. ENERGY RANGE 1.6–2.0 GEV WITH THE CMD-3 DETECTOR
Abstract
The cross section of the process has been measured for the first time using a data sample of 56.7 pb-1 collected with the CMD-3 detector at the VEPP-2000 collider. 63232 signal events have been selected in the center-of-mass energy range 1.6 – 2.0 GeV. A study of dynamics of seven-pion production allows one to extract contributions of the dominated and intermediate states.
1 Introduction
Production of seven pions in annihilation has not been studied before. A partial estimate of the cross section is possible from the BaBar measurement of the cross section of the [1] reaction, based on the Initial-State Radiation (ISR) method. Using the well-known decay rate, a contribution to the seven-pion cross section can be calculated. As a part of the total hadronic cross section, the cross section of is interesting for the calculations of the hadronic contribution to the muon anomalous magnetic moment [2, 3, 4]. The detailed study of the production dynamics can further improve the accuracy of these calculations and can help explain energy dependence of the cross section.
In this paper we report the analysis of the data sample based on 56.7 pb-1 of the integrated luminosity collected at the CMD-3 detector in the 1.6-2.0 GeV center-of-mass (c.m.) energy range. These data were collected in four energy scans, about 50 c.m. energy points each, performed at the VEPP-2000 collider [5, 6, 7, 8] in the 2011, 2012 and 2017 experimental runs. In the 2017 experimental run the beam energy has been monitored by the back-scattering-laser-light system [9, 10], providing an absolute energy measurement with better than 0.1 MeV uncertainty in every single measurement. In earlier runs beam energy has been determined using charge track momenta in detector magnetic field with about 1 MeV uncertainty. Since the cross section of the process is small, we combine our scanned points into eight energy intervals as shown in Table 1.
The general-purpose detector CMD-3 has been described in detail elsewhere [11]. Its tracking system consists of a cylindrical drift chamber (DC) [12] and double-layer multiwire proportional Z-chamber, both also used for a trigger, and both inside a thin (0.2 X0) superconducting solenoid with a field of 1.3 T. The liquid xenon (LXe) barrel calorimeter with a 5.4 X0 thickness has fine electrode structure, providing 1-2 mm spatial resolution [13], and shares the cryostat vacuum volume with the superconducting solenoid. The barrel CsI crystal calorimeter with a thickness of 8.1 X0 is placed outside the LXe calorimeter, and the end-cap BGO calorimeter with a thickness of 13.4 X0 is placed inside the solenoid [14]. The luminosity is measured using events of Bhabha scattering at large angles with about 1% systematic uncertainty [15].
2 Selection of events
The analysis procedure is based on our study of the six-charged-pion reaction described in Ref. [18]. Candidate events are required to have six charged-particle tracks, each one having:
-
1.
more than five hits in the DC.
-
2.
a momentum is larger than 40 MeV/c.
-
3.
a minimum distance from a track to the beam axis in the transverse plane is less than 0.5 cm.
-
4.
a minimum distance from a track to the center of the interaction region along the beam axis Z is less than 10 cm.
-
5.
a polar angle large enough to cross half of the DC radius.
Reconstructed momenta and angles of the tracks for six-track events were used for further selection.
The analysis strategy is based on the reconstruction of the six-charged-pion system, assuming a missing particle. The total energy of the seven pion final state is calculated from the total momentum of charged tracks:
We do not use calorimeter responce for the photons from the decay due to large number of extra soft clusters from the charge pion nuclear interactions. These clusters are not properly reproduced in simulation.
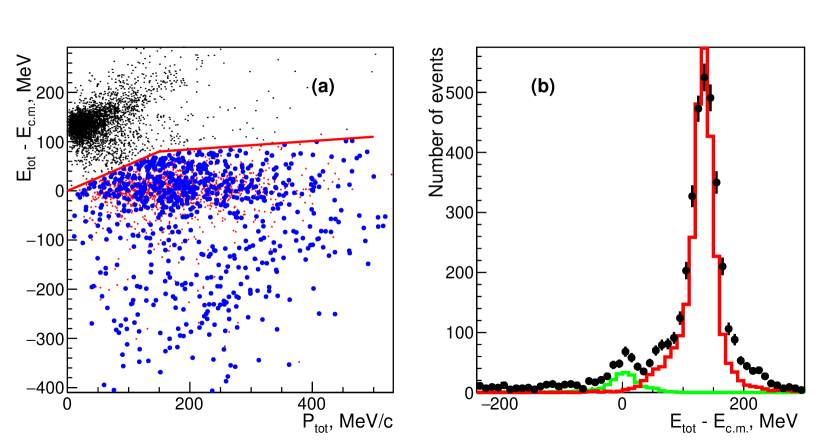
Figure 1(a) shows a scatter plot of the difference between the total energy and c.m. energy, , vs the total momentum for the six-track candidates. A clear signal of the reaction is seen in data as a cluster of dots at MeV and the total momentum near zero. The expected seven-pion signal has the value near zero, and the value is distributed up to 400 MeV/c, as shown by the (red) crosses from the Monte Carlo (MC) signal simulation. The enlarged (blue) circles show data in the region where we search for signal events. Figure 1(b) shows the projection plot of (a): circles are for the data and the histograms show the normalized to data MC-simulated distributions for the seven-pion signal and six-pion background.
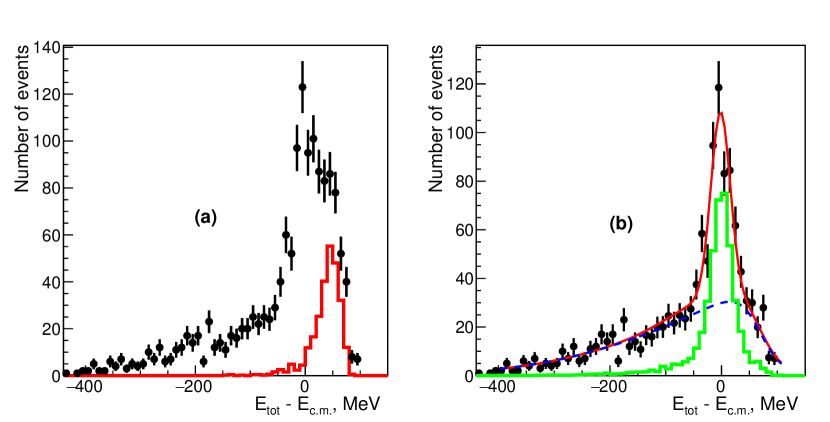
To reduce a contribution from six-pion events, we select events below the line shown in Fig. 1(a). The distribution of the event candidates after selection is shown in Fig. 2(a) by circles, while the histogram shows the remaining contribution of the six-pion events. The observed signal of six-pion events at each energy interval is used to normalize the MC simulation. We subtract this contribution from the experimental distribution of Fig. 2(a), and show the result in Fig. 2(b) together with the fit functions used to determine the number of seven-pion events and remaining background. The signal line shape is taken from the MC simulation of the seven-pion process, shown by the histogram, and is well described by the double-Gaussian function. All parameters of the signal function are fixed according to MC simulation at each energy interval except for the number of events and the main Gaussian resolution. A third-order polynomial is used to describe the remaining background distribution shown by the dashed line in Fig. 2(b).
A variation of the polynomial parameters for the experimental and MC-simulated signal distributions as well as variation of applied selections lead to an about 10% uncertainty on the number of signal events, which is taken as an estimate of the systematic uncertainty. The background contribution increases with energy, and for the highest energy interval we estimate this uncertainty as 15%.
We apply this procedure to the event sample in each energy interval, and in total find 63232 signal events, corresponding to the process in the studied energy range. The numbers of selected events determined in each energy interval are listed in Table 1.
3 First study of the production dynamics
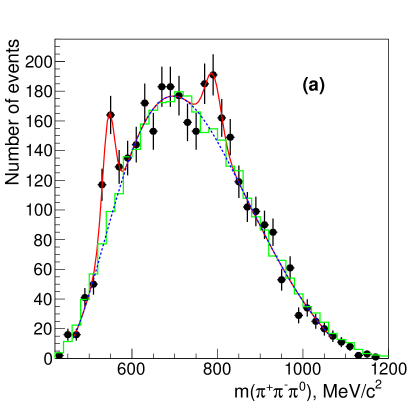
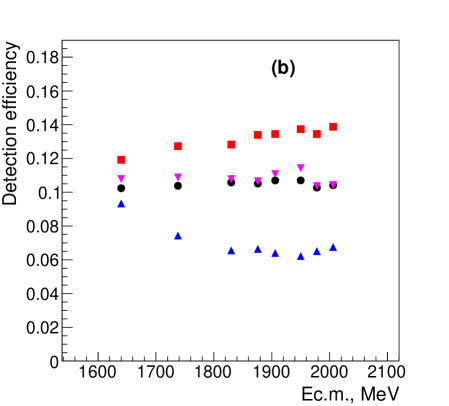
The dynamics of the process has not been studied previously. The BaBar Collaboration [1] reported the observation of the process, which contributes to seven final-state pions if the decays to . We investigate the production mechanisms using the events in the signal region of Fig. 2(b) using the requirement 60 MeV. Figure 3(a) shows an invariant mass distribution for all combinations (nine entries per event) for selected events. The signal from the meson is clearly seen, as well as presence of the resonance in the intermediate state with the decay. To obtain the number of events with and in the intermediate states, we fit this distribution with the sum of functions describing combinatorial background and the peaks from the and the signals as shown by the solid curve in Fig. 3(a). Our resolution is significantly larger than the resonance widths (about 20 MeV), and we use the Gaussian function for the peaks, while the polynomial function is used for the combinatorial background (the dashed line in Fig. 3(a)). The combinatorial background is well described by the MC-simulated distribution in the phase-space model without any intermediate resonances, shown by the histogram in Fig. 3(a). In total, we obtain events for the process and events for . Note that the total number of the events () exceeds the sum of the events from the and peaks () by about 32%: this is discussed below.
We apply this fit to every energy interval and list the obtained number of events in Table 1.
We calculate the invariant masses for the combinations of the two (total charge or zero), the four (total charge zero), and the five (total charge zero) pions from the selected events, and find no signal from the resonance or from any other resonances in our range of the c.m. energies. In general, all these distributions are well described by the phase-space model.
4 Detection efficiency
In our experiment, the acceptance of the DC for charged tracks is not 100%, and the detection efficiency depends on the production dynamics of seven pions. We have developed the primary generators for the seven-pion final-state production in the collision for the phase-space model, and for the models with the intermediate and states. In our model the intermediate state is described as the production with the decay either to four pions in the P-wave or to the state. The state is modeled as production of the state, followed by four pions from the decay in the S-wave.
To obtain the detection efficiency, we simulate seven-pion production in the primary generators, pass simulated events through the CMD-3 detector using the GEANT4 [16] package, and reconstruct them with the same reconstruction software as experimental data. We calculate the detection efficiency from the MC-simulated events as a ratio of events after the selections described in Secs. 2,3 to the total number of generated events.
Figure 3(b) shows the detection efficiency obtained for the (squares) and for the (circles) intermediate states when the number of signal events is obtained from the fit of the peak of Fig. 2(b). Due to the difference in the angular and momentum distributions of the pions, the efficiency for the intermediate state is lower compared to the model: about 10% and 13%, respectively. Variations of the dynamics or resonance parameters inside the initial “vector-pseudo-scalar” state for the production, and inside the “scalar-vector” state for the production do not change the obtained detection efficiency by more than 3–5%.
If we determine the number of the MC-simulated events using the and peaks from the histogram similarly to that in Fig. 3(a), the detection efficiency decreases additionally by 20–40% due to the 60 MeV requirement. These efficiencies are shown in Fig. 3(b) by triangles and up-down triangles for the and states, respectively.
5 Cross section calculation
In each energy interval the cross section is calculated as
where is the number of signal events, is the integrated luminosity for this energy interval, is the detection efficiency, and is the radiative correction calculated according to Ref. [19, 20]. To calculate the radiative correction, we use BaBar data for the reaction [1] as a first approximation, and obtain with very weak energy dependence.
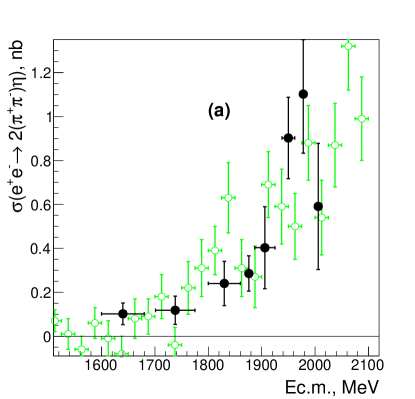
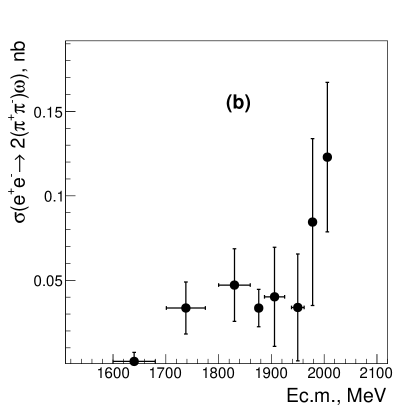
We calculate the cross sections for the and reactions using the efficiencies shown by triangles and up-down triangles in Fig. 3(b), respectively. These cross sections are shown in Fig. 4(a,b): the branching fractions of the and decays are taken into account using values from Ref. [21]. We observe relatively good agreement with the BaBar measurement of the reaction, while no other measurements exist for the cross section.
As mentioned in Secs. 2,3, the total number of events is about 32% larger than the sum of the individual channels with the and intermediate states. This difference is almost eliminated after taking into account the difference in the efficiency obtained by the fit of or by the fit of the and signals where cut MeV is applied: the average ratios are about 1.35–1.37 for both channels. The obtained number is consistent with the total number of the events () within the statistical uncertainty. We come to the conclusion that the inclusive cross section is completely dominated by the sum of the two intermediate states within the measured accuracy.
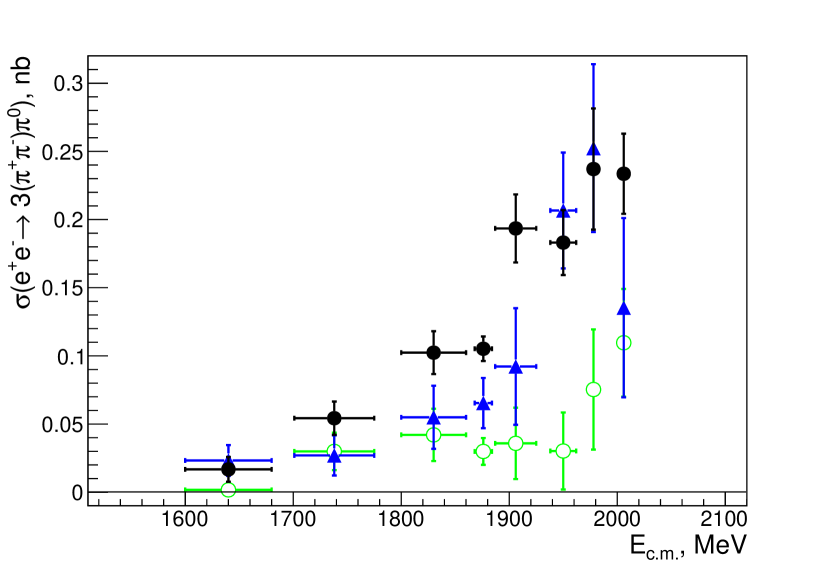
To calculate the inclusive cross section for the reaction, we average the efficiencies in Fig. 3(b) for the and intermediate states with the weight corresponding to the ratio of the corrected number of the events: the efficiency is taken with the 1.18 weight value. The resulting cross section is shown in Fig. 5 by circles. We assign an additional 15% uncertainty due to statistical fluctuations of the ratio.
For comparison, we show in Fig. 5 the contribution from the and reactions by triangles and open circles, respectively: only decays of and to three pions are taken. The reaction, reported in Ref. [1], contributes about 0.1 nb to the total cross section at GeV, but the decay rate of to the studied final state reduces the visible cross section to 0.01 nb, what is less than a sensitivity of our experiment.
The integrated luminosity, the number of the seven-pion events, the number of events for the and intermediate states, and obtained cross sections for each energy interval are listed in Table 1.
6 Systematic uncertainties
The following sources of systematic uncertainties are considered.
-
1.
The tracking efficiency was studied in detail in our previous papers [17, 18], and the correction for the track reconstruction efficiency compared to the MC simulation is about 1.51.0% per track: the MC-simulated detection efficiency is corrected by -6% while 3% is taken as the corresponding systematic uncertainty.
-
2.
The model dependence of the acceptance is determined using the comparison of efficiencies calculated for the different production dynamics for and the reactions. It is estimated as 3-5%.
-
3.
Since only one charged track is sufficient for a trigger (98-99% efficiency), we assume that for the multitrack events considered in this analysis the trigger inefficiency gives a negligible contribution to the systematic uncertainty.
-
4.
A systematic uncertainty due to the selection criteria is studied by varying the requirements described above and doesn’t exceed 5%.
-
5.
The uncertainty on the determination of the integrated luminosity comes from the selection criteria of Bhabha events, radiative corrections and calibrations of DC and CsI and does not exceed 1% [15].
-
6.
The uncertainty in the background subtraction is studied by the variation of the functions used for the background description in the fit, shown in Fig. 2(b) and is estimated as 10% (15% for GeV).
-
7.
The radiative correction uncertainty is estimated as about 2%, mainly due to the uncertainty on the maximum allowed energy of the emitted photon, as well as from the uncertainty on the cross section.
-
8.
For the inclusive cross section we introduce an additional 15% systematic uncertainty due to the difference in the efficiency for the and intermediate states.
The above systematic uncertainties summed in quadrature give an overall systematic error of about 13%, increasing to 20% for the inclusive cross section.
| Ec.m., MeV | L, nb-1 | , nb | , nb | , nb | |||
|---|---|---|---|---|---|---|---|
| 2007.00.5 | 4259 | 9512 | 3617 | 4516 | 0.230.03 | 0.590.29 | 0.120.04 |
| 19801 | 2368 | 5310 | 369 | 1710 | 0.240.04 | 1.100.27 | 0.080.05 |
| 1940–1962 | 4631 | 8411 | 5511 | 1514 | 0.180.02 | 0.900.19 | 0.0330.032 |
| 1890–1925 | 5497 | 10514 | 3014 | 2015 | 0.190.02 | 0.400.19 | 0.0400.029 |
| 1870–1884 | 16803 | 17115 | 6719 | 4916 | 0.1050.009 | 0.290.08 | 0.0330.011 |
| 1800–1860 | 8287 | 8313 | 2712 | 3516 | 0.1020.016 | 0.240.10 | 0.0470.021 |
| 1700–1775 | 7589 | 399 | 148 | 2310 | 0.0540.012 | 0.110.06 | 0.0330.015 |
| 1600–1680 | 7299 | 126 | 157 | 13 | 0.0170.008 | 0.100.05 | 0.0020.005 |
Conclusion
The total cross section of the process has been measured for the first time using 56.7 pb-1 of integrated luminosity collected by the CMD-3 detector at the VEPP-2000 collider in the 1.6-2.0 GeV c.m. energy range. From our study we can conclude that the observed cross section can be described by the and the reactions. The measured cross section for the reaction is in good agreement with the only available measurement by BaBar [1].
Acknowledgements
The authors are grateful to A.I. Milstein for his help with theoretical interpretation and development of the models. We thank the VEPP-2000 team for excellent machine operation. The work is partially supported by the Russian Foundation for Basic Research grants 18-32-01020, 17-52-50064.
References
- [1] B. Aubert et al. (BaBar Collaboration), Phys. Rev. D 76, 092005 (2007).
- [2] M. Davier, A. Hoecker, B. Malaescu, and Z. Zhang, Eur. Phys. J. C 77, 827 (2017).
- [3] F. Jegerlehner, Acta Phys. Polon. B49, 1157 (2018).
- [4] A. Keshavarzi, D. Nomura, T. Teubner, Phys. Rev. D 97, 114025 (2018).
- [5] V. V. Danilov et al., Proceedings EPAC96, Barcelona, p.1593 (1996).
- [6] I. A. Koop, Nucl. Phys. B (Proc. Suppl.) 181-182, 371 (2008).
- [7] P. Yu. Shatunov et al., Phys.Part.Nucl.Lett. 13, 995 (2016).
- [8] D. Shwartz et al., PoS ICHEP2016, 054 (2016).
- [9] E. V. Abakumova et al., Phys. Rev. Lett. 110, 140402 (2013).
- [10] E. V. Abakumova et al., JINST 10, T09001 (2015).
- [11] B. I. Khazin, Nucl. Phys. B (Proc. Suppl.) 181-182, 376 (2008).
- [12] F. Grancagnolo et al., Nucl. Instr. Meth. A623, 114 (2010).
- [13] A. V. Anisyonkov et al., Nucl. Instr. Meth. A598, 266 (2009).
- [14] D. Epifanov (CMD-3 Collaboration), J. Phys. Conf. Ser. 293, 012009 (2011).
- [15] R. R. Akhmetshin et al., Nucl. Phys. B (Proc. Suppl.) 225-227, 69 (2012).
- [16] S. Agostinelli et al. (GEANT4 Collaboration), Nucl. Instr. Meth. A506, 250 (2003).
- [17] R. R. Akhmetshin et al. (CMD-3 Collaboration), Phys. Lett. B768, 345 (2017).
- [18] R. R. Akhmetshin et al. (CMD-3 Collaboration), Phys. Lett. B723, 82 (2013).
- [19] E. A. Kuraev and V. S. Fadin, Sov. J. Nucl. Phys. 41, 466 (1985).
- [20] S. Actis et al., Eur. Phys. J. C66, 585 (2010).
- [21] M. Tanabashi et al. (Particle Data Group), Phys. Rev. D98, 030001 (2018).