Characterisation of different stages of hadronic showers using the CALICE Si-W ECAL physics prototype
The CALICE Collaboration
Abstract
A detailed investigation of hadronic interactions is performed using -mesons with energies in the range 2–10 GeV incident on a high granularity silicon-tungsten electromagnetic calorimeter. The data were recorded at FNAL in 2008. The region in which the -mesons interact with the detector material and the produced secondary particles are characterised using a novel track-finding algorithm that reconstructs tracks within hadronic showers in a calorimeter in the absence of a magnetic field. The principle of carrying out detector monitoring and calibration using secondary tracks is also demonstrated.
1 Introduction
The design of particle detectors at future high-energy physics experiments and, in particular, at linear colliders is oriented towards the usage of Particle Flow Algorithms (PFA) for the event reconstruction. These algorithms aim to achieve good jet energy resolution by reconstructing individual particles and hence require high granularity calorimeters [1, 2, 3].
The primary objective of the CALICE (Calorimeter for the Linear Collider Experiment) collaboration is the development, construction and testing of highly granular hadronic and electromagnetic calorimeters for future particle physics experiments.
A detailed study of the calorimeter response to particle interactions is necessary to verify existing Monte Carlo simulation models and to build reliable PFA. This implies the precise simulation and reconstruction of the interaction of neutral and charged hadrons using the subsequent particle cascade.
This article presents a detailed study of -meson interactions in the CALICE Silicon-Tungsten Electromagnetic Calorimeter (Si-W ECAL) physics prototype [4]. The Si-W ECAL was tested at Fermi National Accelerator Laboratory (FNAL) in 2008 using a beam of -mesons in the energy range from 2 to 10 GeV. The highly granular structure of the Si-W ECAL enables both a detailed measurement of hadronic showers in terms of integral observables [5, 6] as well as deeper studies of the interactions between hadrons and the absorber material, such as the characterisation of the interaction region and the analysis of secondaries emerging from the interaction. The tracks produced by these secondaries are reconstructed using a new simple track-finding algorithm. The resulting observables are used to compare data with predictions from several geant4 simulation models [7, 8]. The analysis complements studies presented in [9] and [10] for tracking in CALICE prototypes of hadronic calorimeters.
2 The Si-W ECAL physics prototype
The Si-W ECAL physics prototype has a sandwich-like structure comprising 30 layers of silicon as the active material, alternating with tungsten as the absorber material. The active layers are made of Si wafers segmented in 1 1 cm2 pads. As shown in Fig. 1, each wafer consists of a square of 6 6 pads and each layer is a matrix of 3 3 of these wafers resulting in an active zone of 18 18 cm2.
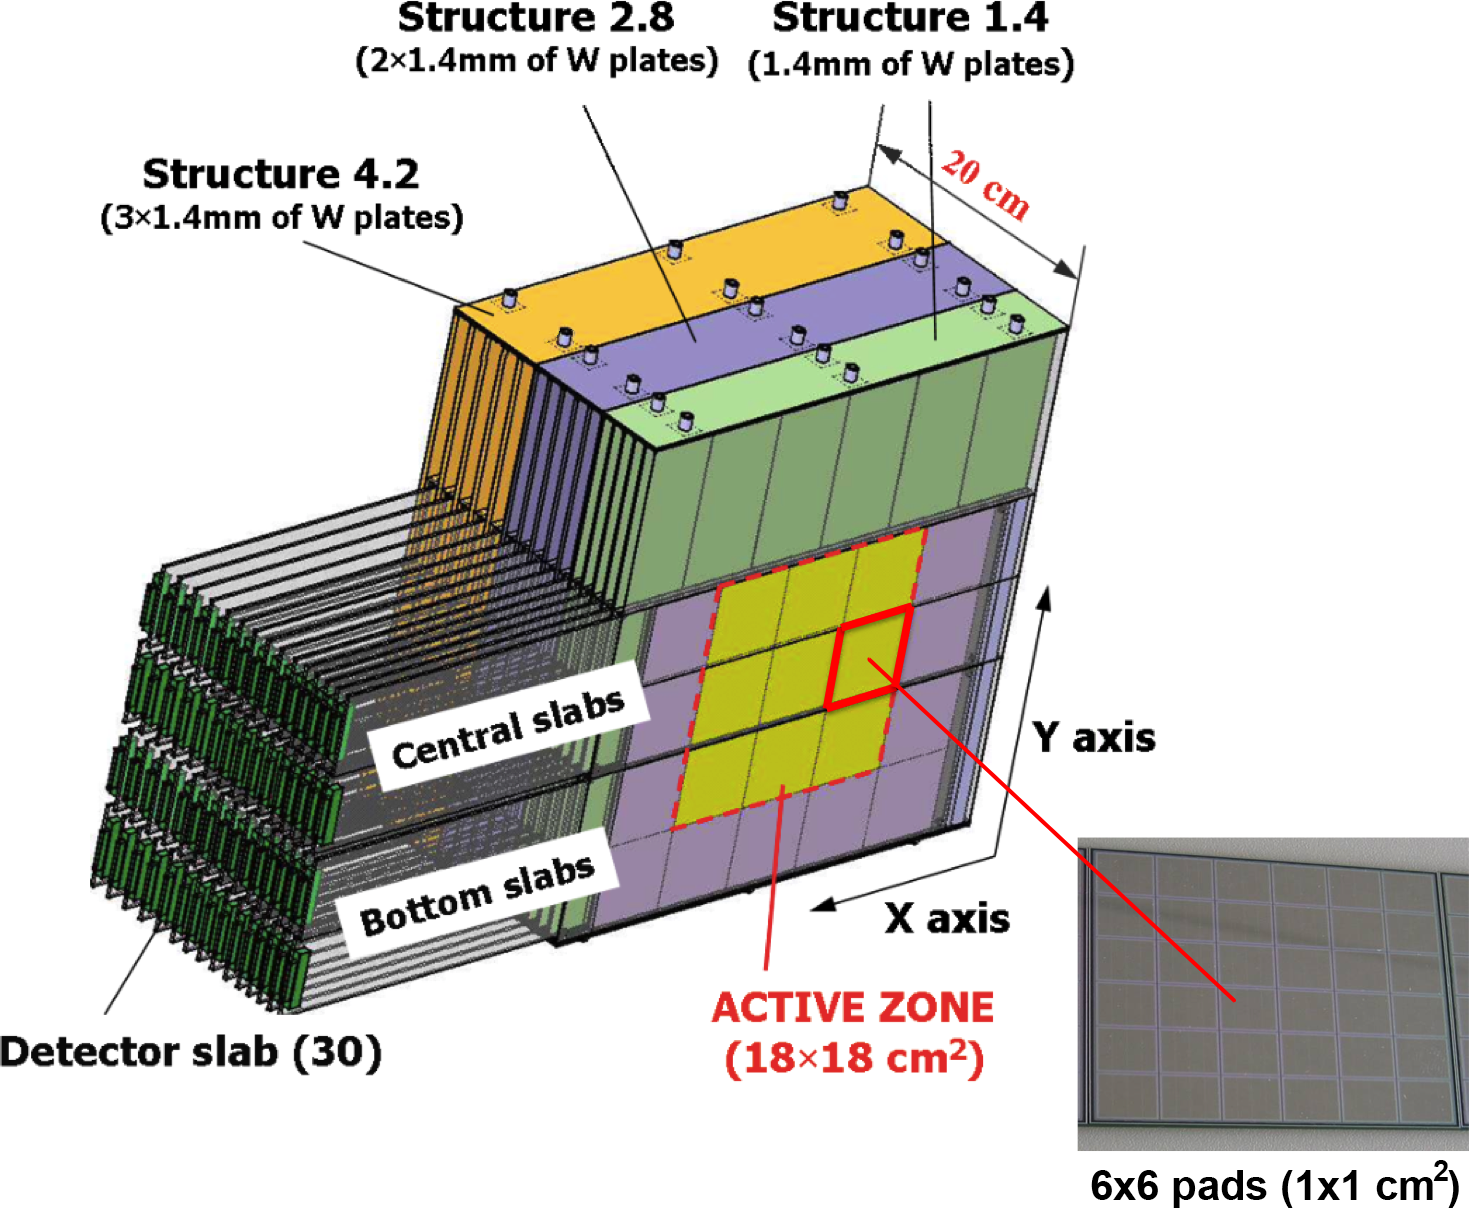
The Si-W ECAL is subdivided into three modules of ten layers. The tungsten depth per layer is 1.4 mm (0.4 radiation lengths, ) in the first module, 2.8 mm in the second and 4.2 mm in the third. The total thickness corresponds to 24 and about one nuclear interaction length . Therefore more than half of the hadrons are expected have a primary interaction within the detector volume. A more detailed description of the prototype can be found in Ref. [4].
For the analysis presented in this article it is convenient to introduce a unit grid based on the Si-W ECAL pad identifiers according to
| (1) |
where pad counting starts in the bottom right pad, see Fig. 1. Distances in this grid are measured in grid units,
3 Data and Monte Carlo samples
3.1 Experimental setup at FNAL
The test beam measurements were carried out at the Fermilab Test Beam Facility777Fermilab Test Beam Facility web page: http://www-ppd.fnal.gov/MTBF-w, FTBF, at FNAL in May and July 2008. A schematic overview of the beam line is given in Fig. 2. The Si-W ECAL was placed in front of two other CALICE physics prototypes, the analogue hadronic calorimeter (HCAL) [11] and a TailCatcher [12]. In both steel is used as absorber. Sensors are scintillator tiles (HCAL) or scintillator strips read out by silicon-photomultipliers. The beam-line also included wire chambers (WC1-3), drift chambers (DC1-4) and scintillator counters of different sizes, named T100(A,B), VETO, T20x20 and T10x10(A,B). The latter two cover an area of 10 10 cm2 each and are used for triggering on beam particles analysed for this article. Finally, two Cherenkov detectors for particle identification are located upstream of the Wire Chamber 1.
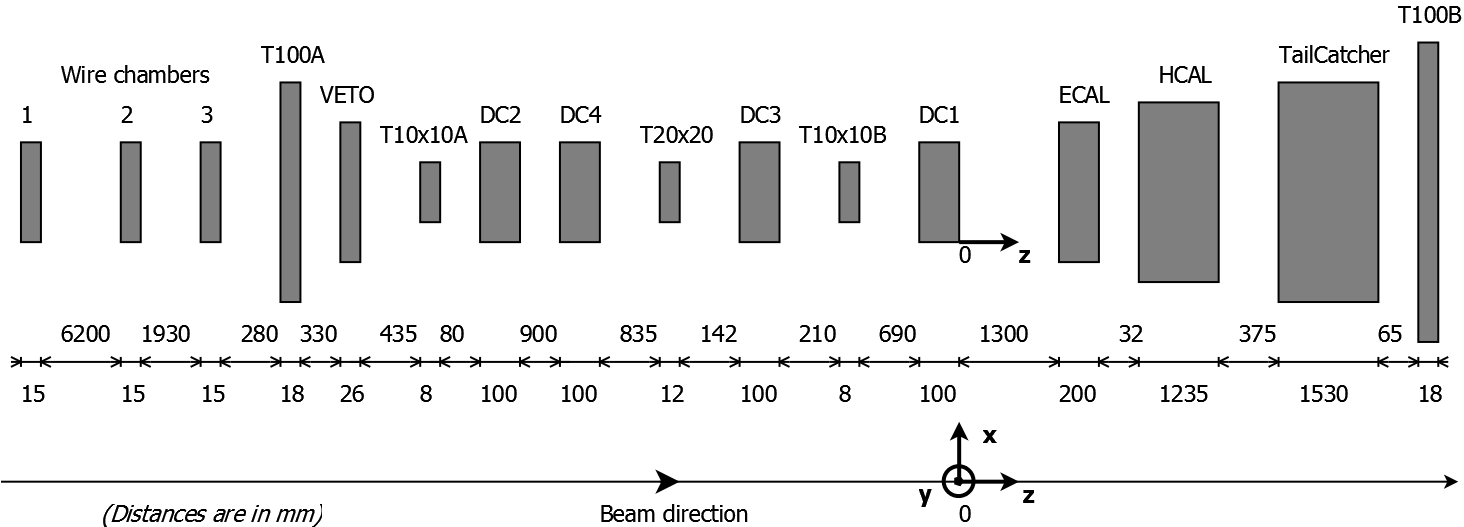
The chosen coordinate system is right-handed with the -axis pointing along the beam direction and the -axis being vertical. The data analysed in this article comprise runs with -mesons with energies of 2, 4, 6, 8 and 10 GeV.
3.2 Monte Carlo simulations
Monte Carlo simulations were carried out within the Mokka framework [13], which provides the geometry interface to geant4. There are several models of hadronic interactions available within geant4 that are combined into simulation models. Each hadronic interaction model has its own theoretical basis valid mainly in a specific energy range of hadrons. In this analysis, three simulation models contained in geant4 Version 10.1 are compared with the data:
- 1.
-
2.
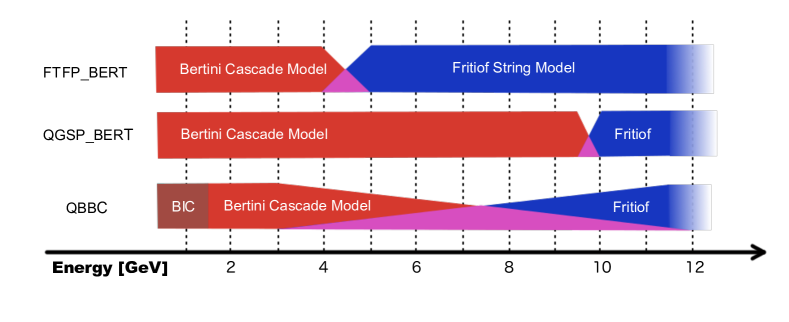
qgsp_bert uses the Bertini Cascade Model at energies below, and the Fritiof String Model for energies above 9.9 GeV. The Fritiof String Model replaces the LHEP parametrisation that was employed until Version 9.6 of geant4;
-
3.
qbbc uses also the Bertini Cascade Model for energies below and the Fritiof String Model for energies above 9.9 GeV but interpolates in a larger transition region (for protons and neutrons below 1.5 GeV the Binary Cascade Model [17] is used).
The validity ranges of hadronic interaction models in the three simulation models are illustrated in Fig. 3. More information about these and other simulation models can be found in Ref. [18].
3.3 Event selection and preprocessing
The FNAL test beam is contaminated with and , in particular at lower energies. At 2 GeV the beam contains about 5% -mesons and 70% electrons. Events are triggered using the signals from the two scintillator counters T10x10A and T10x10B upstream of the Si-W ECAL and -mesons are identified by using Cherenkov counters. The response of the Si-W ECAL to charged particles was calibrated with a 32 GeV beam [19] and the deposited energy is converted into units of most probable energy depositions, called MIP hereafter, by particles with behaviour that is approximately minimally ionising. The deposited energy measured in a pad is called hit.
To select -meson showers, data and simulation samples are required to satisfy similar criteria to those of Refs. [6, 20], as below:
-
1.
Selection criteria are applied to reject multi-particle events caused by beam impurities or products of decays or upstream interactions of beam particles;
-
2.
A lower threshold of 0.6 MIP is chosen to remove noise hits in the Si-W ECAL;
-
3.
A hit is classified as being isolated if all the 26 pads in the surrounding cube (in g.u.) have no signal above the noise threshold. The analysis presented in this article uses the non-isolated hits that remain after this removal. The term ‘hits‘ will continue to be used to indicate only non-isolated hits in the following.
-
4.
A total of at least 25 hits in the Si-W ECAL is required to remove particles with large incident angle;
-
5.
For the event selection the hit coordinates and are defined in the coordinate frame according to Fig. 2. The barycentres of the transverse coordinates and of the hits are calculated as:
(2) where is the energy of a hit in MIP units, and the sums run over all hits in the calorimeter. The event is accepted if and to reduce lateral shower leakage;
-
6.
Initially, the interaction layer is identified as the first of three consecutive layers for which
(3) with being the total energy of layer ;
This simple condition is inefficient at low energies and is extended by the following relative energy increase
(4) The variables and are free parameters with empirical values of eight MIP and six, respectively. It is argued in [6] and references therein that these values optimise the selection efficiency in the energy range relevant for the present study. The event is selected if to suppress electron contamination and to ensure secondaries that extend over several layers after the interaction.
4 The track-finding algorithm
The track-finding algorithm reconstructs forward-scattered tracks from the interaction between the -meson and the absorber material in the absence of a magnetic field.
The algorithm consists of three stages:
-
1.
identification and removal of interaction region;
-
2.
clusterisation of energy deposits;
-
3.
formation of track-like clusters;
The entire algorithm is carried out in the grid units introduced in Sec. 2.
4.1 Identification and removal of the interaction region
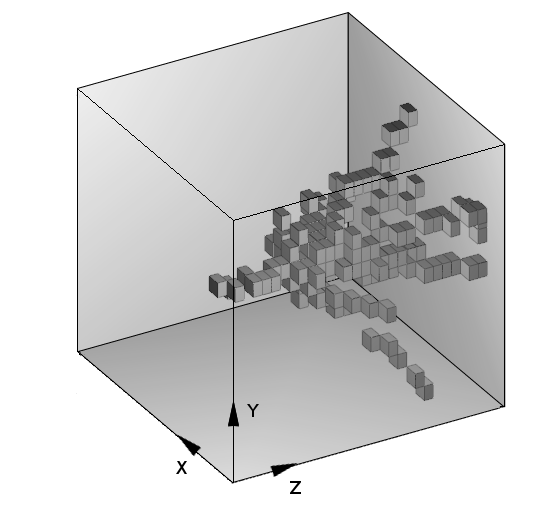
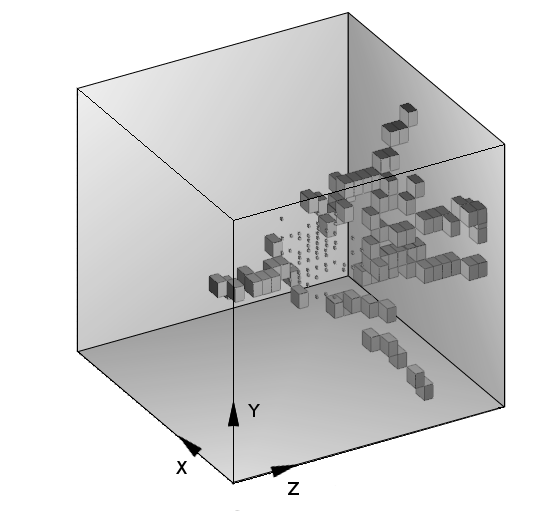
A typical inelastic hadronic interaction in the Si-W ECAL creates a shower with an interaction region and tracks of long-lived particles emerging from it. The interaction region is created by particles such as electrons, photons and low-momentum hadrons that have a short distance of flight in the absorber material of the Si-W ECAL.
In the present analysis the interaction region is defined by all hits that have at least six neighbouring pads with a signal above the noise threshold. For the minimal value of six pads a interaction region is wrongly identified in only 1% of single muon events. Muon events are used to estimate the fraction of events in which this procedure incorrectly identifies an interaction region. For the minimal value of six (five) pads, an interaction region is found in 1% (10%) of muon events. Increasing the minimal value to seven neighbouring pads with hits further reduces the fraction of events with a fake interaction region but does not alter the results presented below in Sec. 5.
4.2 Clusterisation of energy deposits
During the clusterisation step the energy deposits that are not assigned to the interaction region are grouped into clusters according to topological criteria.
The steps of the clusterisation algorithm are described below, with reference to Fig. 5.
-
1.
The separation of tracks improves with increasing distance from the interaction layer. Therefore, the search for hits to seed a cluster begins in the layers that have largest and continues in the direction of decreasing . Typically, seeding hits are found in the last layer of the detector;
-
2.
A hit can only be attributed to one cluster. This condition excludes double counting of hits. A random choice of seeding hits shows that effects arising from ambiguities in the assignment of hits to clusters such as the order in which clusters are created, are negligible;
-
3.
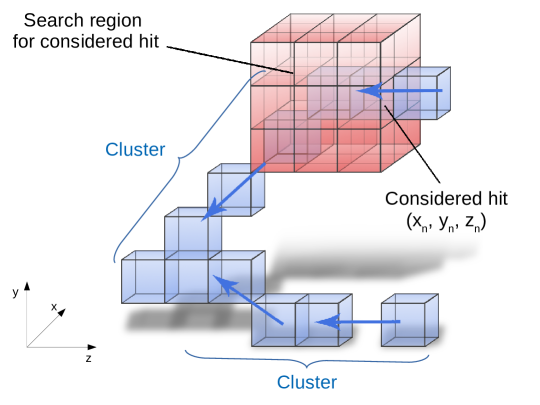
For the clusterisation a nearest-neighbour clustering scheme is applied where for each newly associated hit with coordinates , the algorithm finds nearby hits with the following conditions:
-
(a)
a neighbour hit should have a coordinate within g. u. ;
-
(b)
the transverse coordinates of neighbouring hits is searched within ranges and .
The search region for nearby hits is visualised in Fig. 5 as a ‘red cube’ with 3 3 3 pads;
-
(a)
-
4.
For each newly associated hit the steps 2 and 3 are repeated until the process reaches the first layer of the calorimeter or until no more neighbour hits are found.
The algorithm is motivated by a maximum correspondence between the number of clusters and the number of detected tracks after classification and merging.
4.3 Formation of tracks
Secondary long-lived charged particles from hadronic interactions can leave straight, MIP-like tracks in the detector. The goal of the classification of the clusters obtained in the previous step is thus to select track-like clusters.
The classification algorithm executes the following steps:
-
1.
Calculate the number of hits, , in a cluster and reject all clusters with only two hits as residual noise clusters
-
2.
Calculate the length of the considered cluster as the maximal distance between any pair of hits that are in the cluster. For example the lower cluster in Fig. 5 has a length of ;
-
3.
Reject a cluster with a length of less than . This corresponds to the minimal length of a track-like cluster with 3 hits;
-
4.
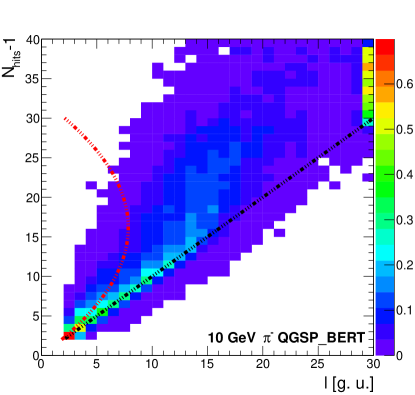
Compute the following observable
(5) as a measure for the eccentricity of the cluster. The first term of Eq. 5 is motivated by the linear dependence of on the cluster length , illustrated in Fig. 6. The second term introduces a free parameter as an ad hoc correction to increase the efficiency for selecting clusters that do not match the nominal ‘pencil-like‘ topology, as explained below. The value was chosen after visual inspection of a few tens of events for pion energies of 10 GeV in an event display. The chosen value is a compromise between a too small value at which also muon tracks would get assigned more than one track and too large values at which even for electrons the algorithm would result in one single track. The choice made for 10 GeV is also adequate for the other energies relevant for this analysis. For a detailed discussion see Refs. [21] and [22] ;
-
5.
If , a cluster is considered as track-like. Otherwise, the cluster is classified as two inseparable tracks.
Due to effects such as multiple scattering, residual detector-noise, -rays or the residual arbitrariness in the assignment of hits to clusters, the reconstructed tracks are in general not exactly pencil-like. The correction term in the definition of serves to keep a cluster as track-like even if it has large and its form is not strictly pencil-shaped, i.e. .
A cluster is classified as being produced by the incoming -meson if it starts in the first module of the Si-W ECAL and if it has a small polar angle with respect to the -axis. An example of a cluster produced by an incoming -meson is visible in Fig. 4(b). Clusters assigned to the incoming -meson are discarded in the following analysis. The remaining track-like clusters are merged into tracks if the relative angle between these clusters fulfils the condition , optimised using the polar angle distribution of secondary particles in simulated -meson interactions.
For a sample of single, isolated 6 GeV muons, the track-finding algorithm finds a single track with a 99.7% efficiency.
5 Results
Observables characterising the interaction region and secondary particles are measured in data and are compared with predictions of the three geant4 simulation models introduced in Sec. 3.2. The average values of observables are also used to make quantitative comparisons. After pre-selection the data have a residual contamination of 8.8% (1.5%) double -meson events at 2 GeV (10 GeV) beam energy [6]. Therefore, for comparison with data all simulation samples were produced with an admixture of double events. For average values of observables, correction factors are extracted for each Monte Carlo sample by comparing the results of contaminated samples with those from pure samples. To account for residual contamination, the averages of the data are multiplied by final correction factors. This final correction factors are given by the arithmetic mean of correction factors of the three considered simulation models. The final correction factors are between 0.99 and 1.01 and their uncertainties are much less than one percent. The total systematic error never exceeds two percent and is dominated by two other sources of systematic uncertainties that have been studied. These are the lowering of the MIP threshold from the nominal 0.6 to 0.4 and the uncertainty on the absolute MIP energy scale [9] that has been varied by .
5.1 Energy fraction of the interaction region
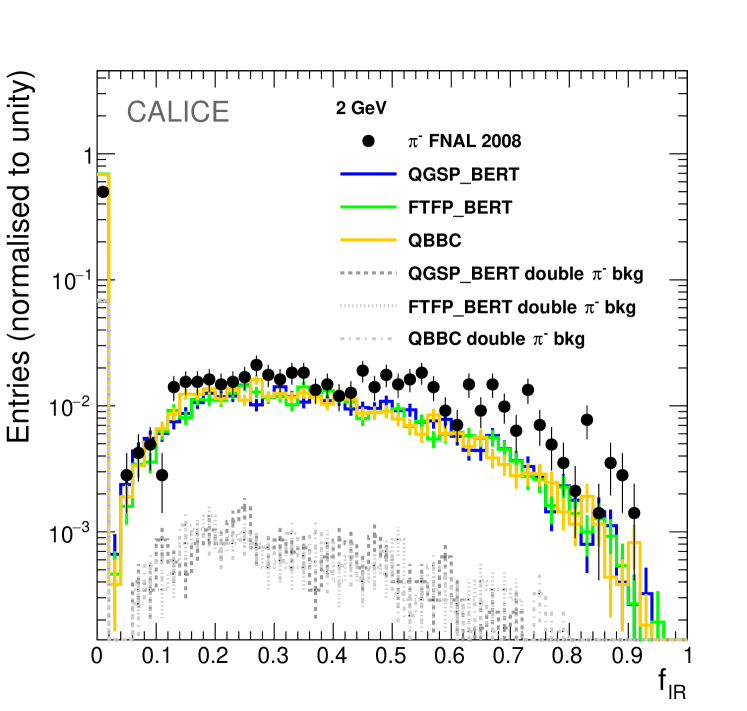
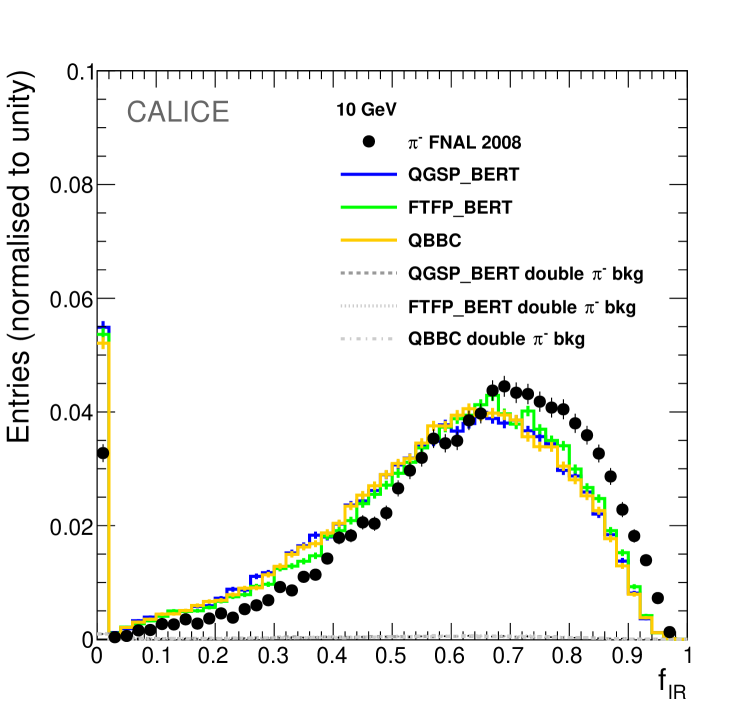
The first estimator to characterise the interaction of -mesons with the absorber material is the fraction
| (6) |
where is the energy deposited in the interaction region and is the total energy deposited in the Si-W ECAL .
Figure 7 compares the distribution of in data with the three simulation models. The lowest bin of these histograms corresponds to the fraction of events for which no interaction region is found by the algorithm. The rest of the distribution can be approximately described by a skewed normal distribution. The mean value of is shifted towards larger values in data with respect to simulation. Qualitatively, this observation suggests a different repartition of the deposited energy between the dense interaction region and the sparser parts of the shower in data and the simulation models.
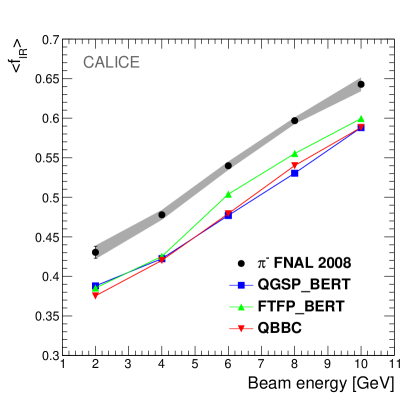
Figure 8 shows the average value of , , as a function of beam energy for beam energies of 2, 4, 6, 8 and 10 GeV. Only events in which an interaction region has been detected are included in . An increase of with increasing beam energy from 43% to around 64% is observed. Qualitatively, this is expected as number of particles increases with increasing energy but also the electromagnetic component of the hadronic shower becomes increasingly important for higher energies of the interacting -meson. All three simulation models underestimate the energy fraction by about 10–15% while the slope is reproduced to a much better level.
5.2 Lateral radius of interaction region
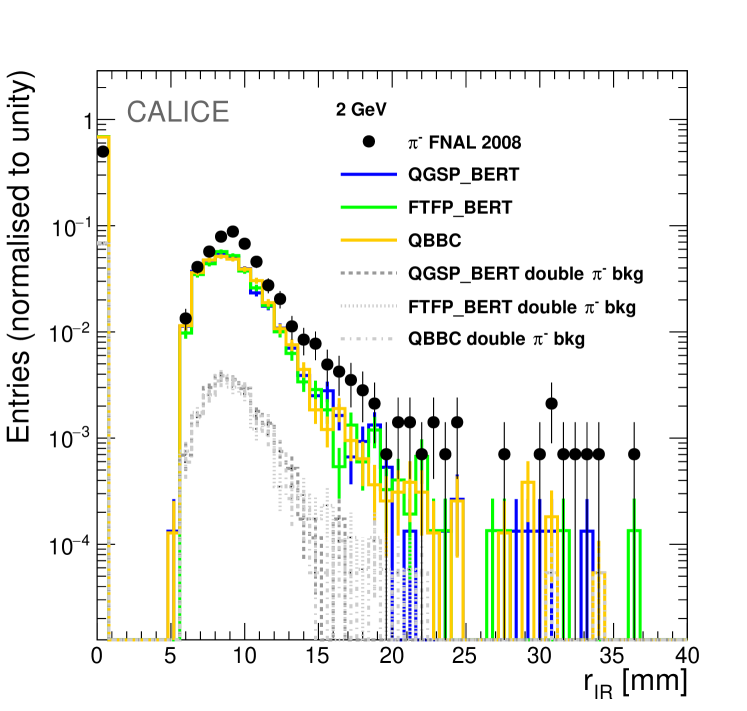
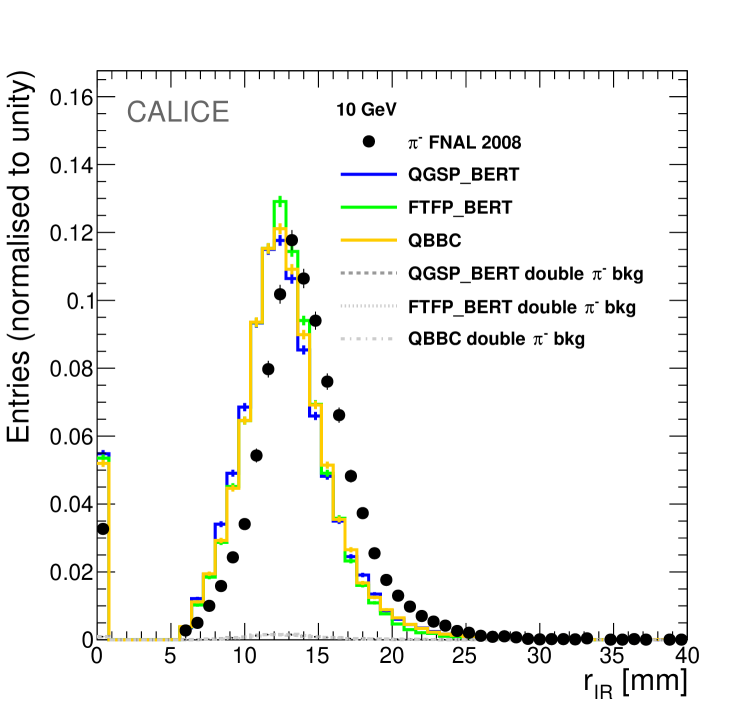
The lateral radius of the detected interaction region is a measure of the spatial extension of the interaction region. It is defined as:
| (7) |
where the sum runs over the hits in the interaction region, here labelled by , and is the number of hits in the interaction region. In Eq. 7 and are the transverse coordinates of the barycentre of the interaction region, which in analogy with Eq. 2, are defined as:
| (8) |
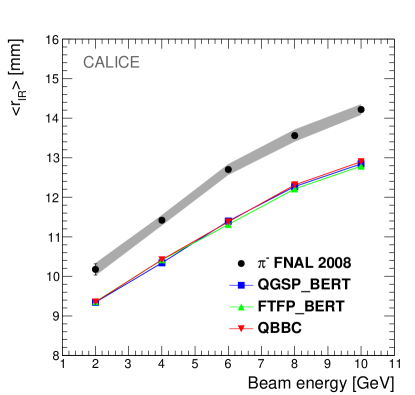
Distributions of for data and the predictions of the three simulation models are displayed in Fig. 9 for -meson energies of 2 and 10 GeV. In both cases, the measured interaction region is wider than the predictions by the simulation models. Figure 10 displays the dependence of the average , , on the beam energy for the data and the three simulation models. Again, only events in which an interaction region has been detected are included in . The lateral size of the interaction region increases with increasing beam energy. This trend is the same for data and for the simulation models. The interaction region measured in data is about 10% wider than those predicted by the three simulation models, all of which yield similar distributions.
5.3 Number of clusters
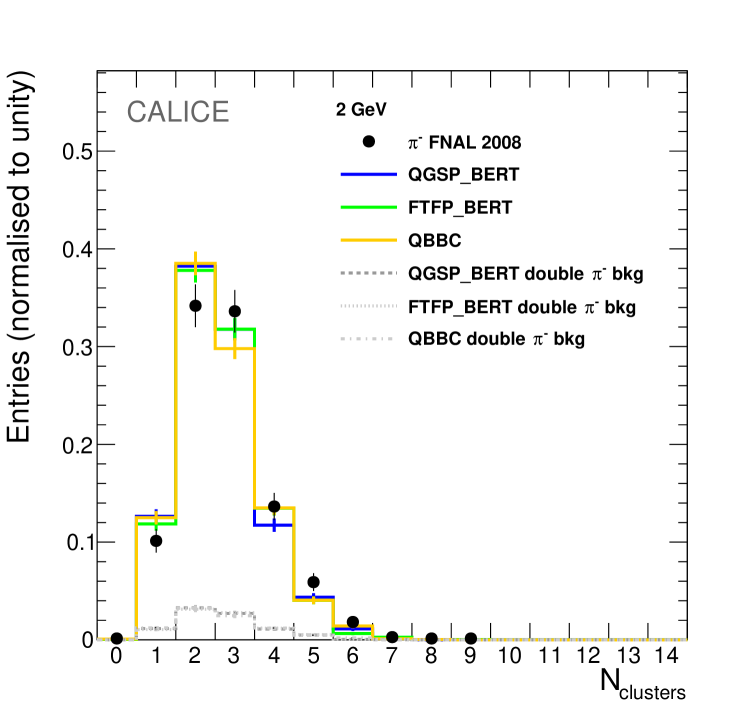
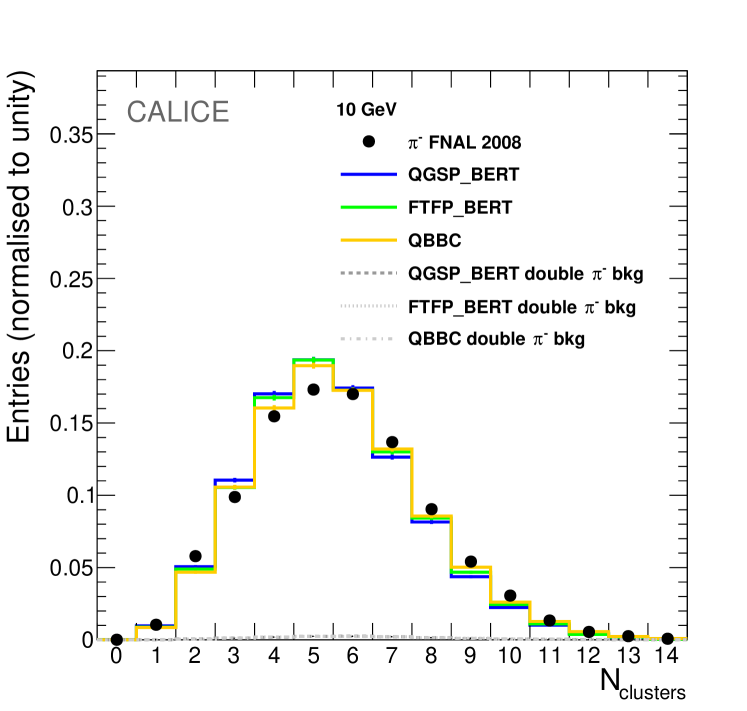
The final tracks are composed from segments that are given by clusters, as described in Sec. 4.2. This motivates studying the total number of clusters, , reconstructed in each event by the track-finding algorithm. This observable is independent of details of the track-finding algorithm since it depends neither on the parameter value nor on other free parameters of the classification algorithm. Note that in all following discussion, only events in which an interaction region has been detected are considered. Figure 11 compares the distribution of in data with the predictions of the three geant4 simulation models for incoming -mesons with energies of 2 and 10 GeV. The data are described well by the simulation albeit being slightly shifted towards higher values.
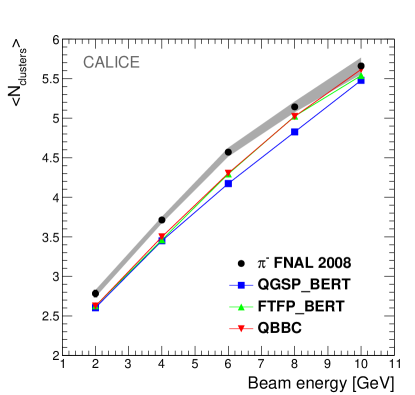
Figure 12 shows the dependence of the average number of clusters, , on the beam energy for data and the simulation models. The predictions of the models are systematically below data at all energies. The largest deviation is about 7%. The agreement tends to improve with increasing beam energy and is best at 10 GeV.
5.4 Number of tracks
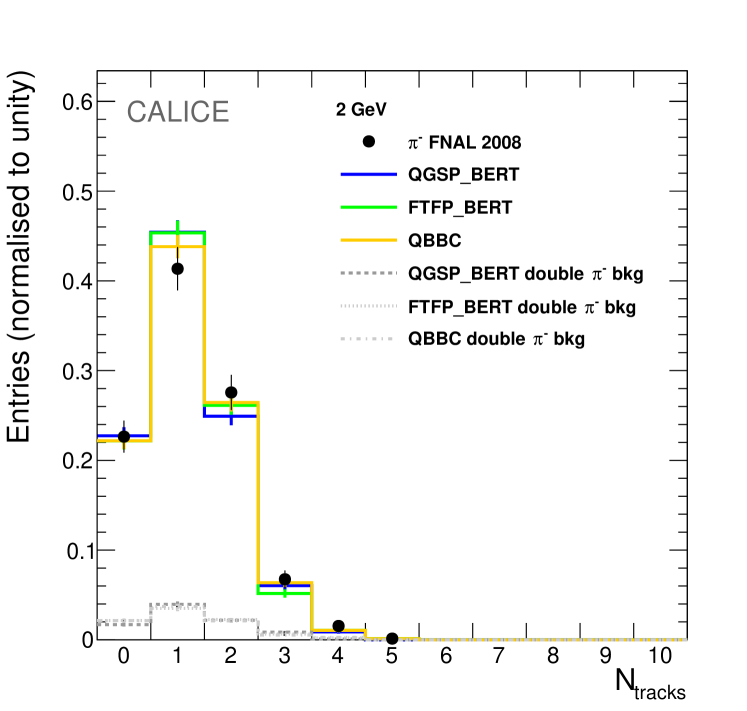
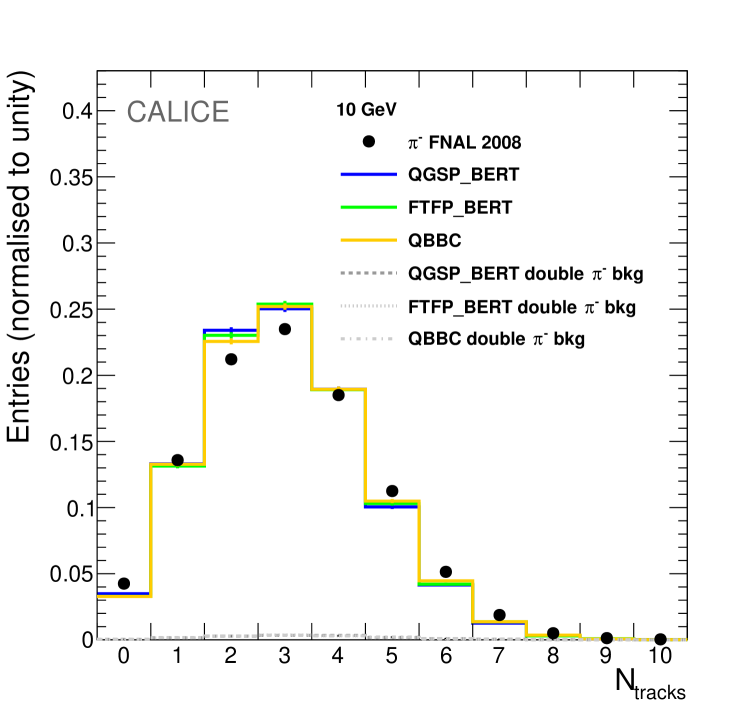
The distributions are given in Fig. 13 for data and the three simulation models for energies of 2 and 10 GeV of the incoming -mesons, respectively. Data and simulation are in good agreement, although at 10 GeV the simulation predicts a narrower spread in than data.
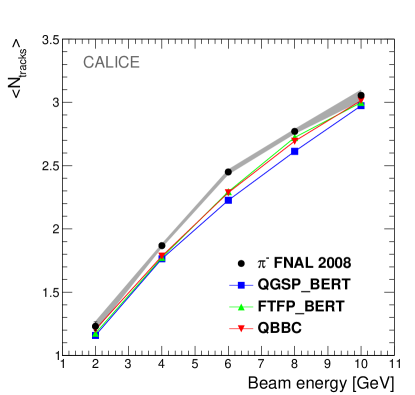
Figure 14 shows the dependence of on the beam energy for data and the simulation models. With increasing beam energy the centre-of-mass energy available for the -tungsten scattering increases with the square-root of the beam energy according to fixed target kinematics. It is therefore expected that the number of outgoing tracks increases correspondingly. This is indeed observed in data and simulation. The approximately linear increase at smallest energies flattens out towards higher beam energies. The extension of the interaction zone also increases with energy, see for example Sec. 5.2. This makes it more and more difficult to reconstruct clean tracks in the finite volume of the Si-W ECAL. The simulation models are in agreement with the data at beam energies of 2 GeV and 10 GeV and underestimate the number of secondary tracks by up to 7% at intervening energies.
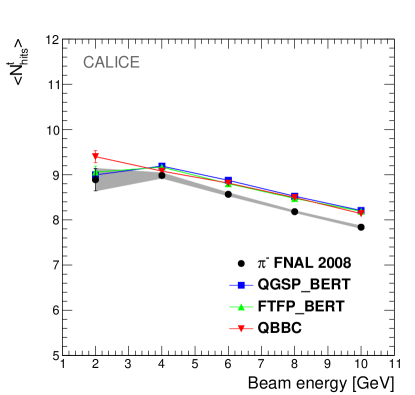
5.5 Number of hits per track
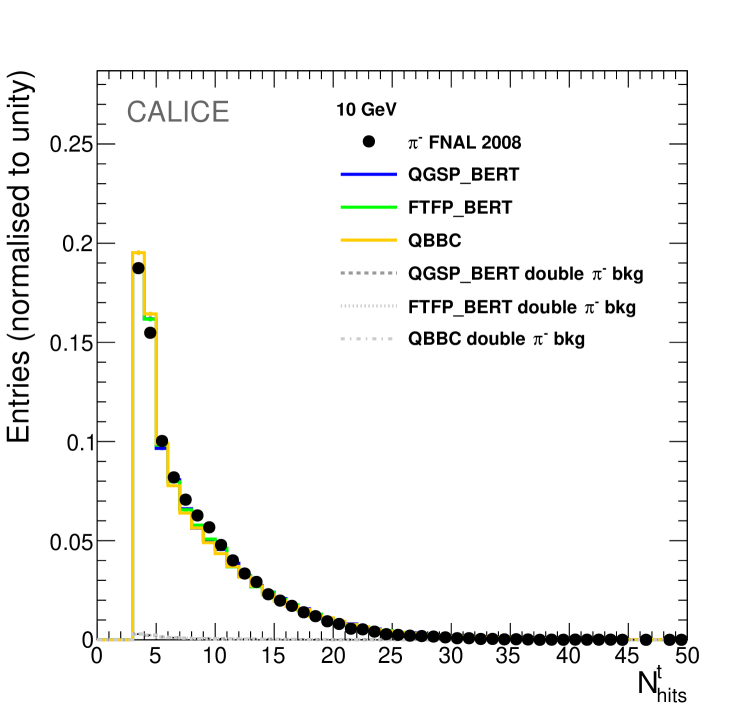
The number of hits per track is an essential characteristic of the reconstructed tracks. The histograms of for 2 and 10 GeV beam energy are shown in Fig. 15. The distributions obtained for data and Monte Carlo are in good agreement with each other.
Figure 16 shows the dependence of on the beam energy for data and the simulation models. Data and simulation agree within 5%. For energies greater than 4 GeV all simulation models are, however, systematically above the data. Note that the average number of hits slightly decreases with increasing energy. The increasing size of the interaction zone limits the space available for track reconstruction. This observation is, therefore, consistent with the flattening of the number of tracks observed in Sec. 5.4.

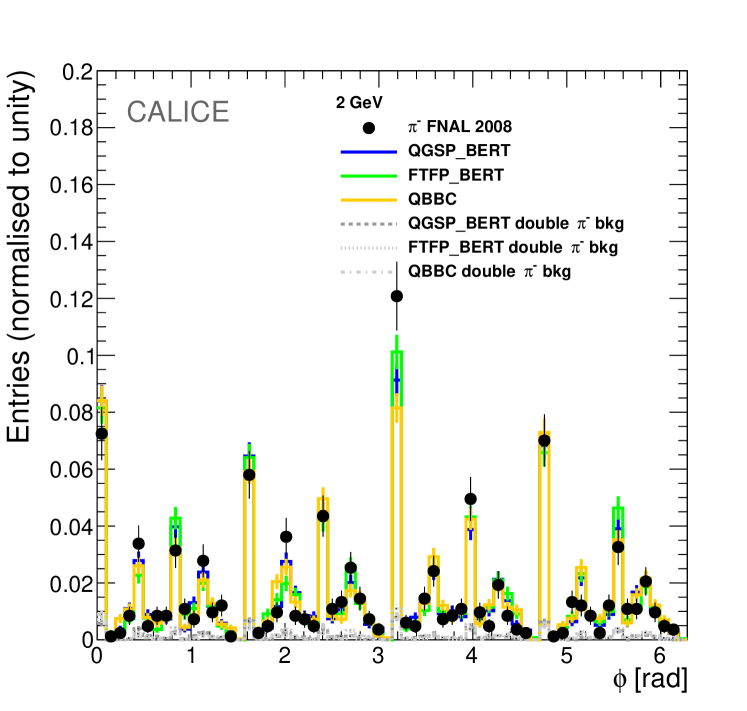
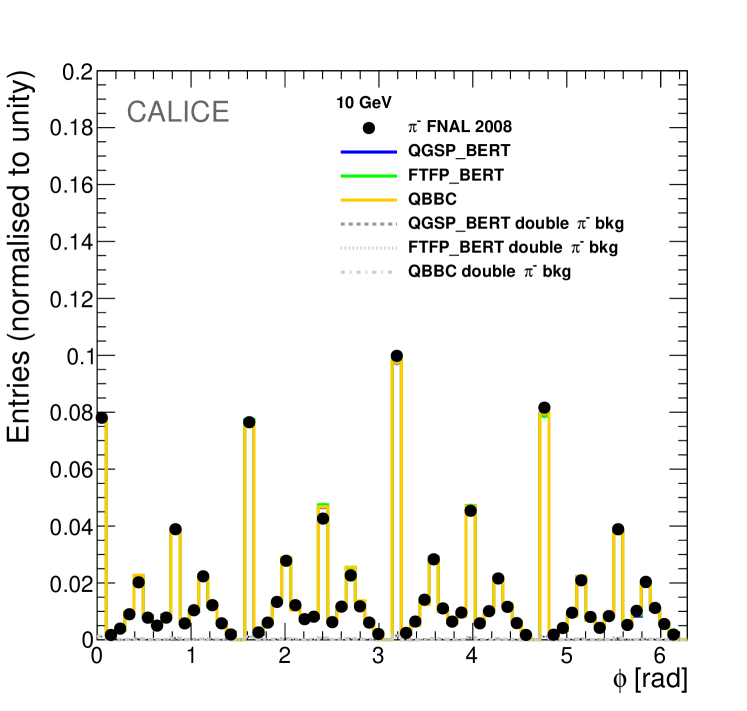
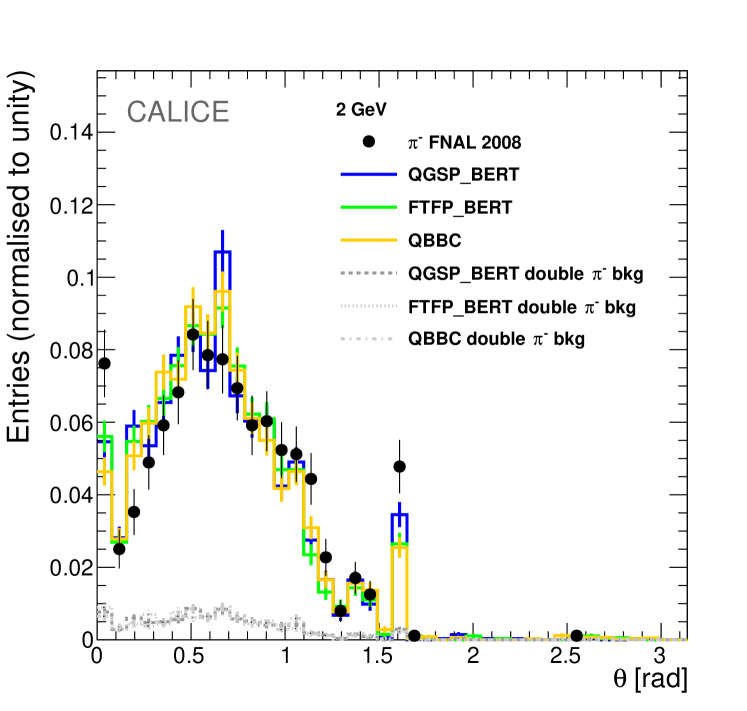
5.6 Angular distributions
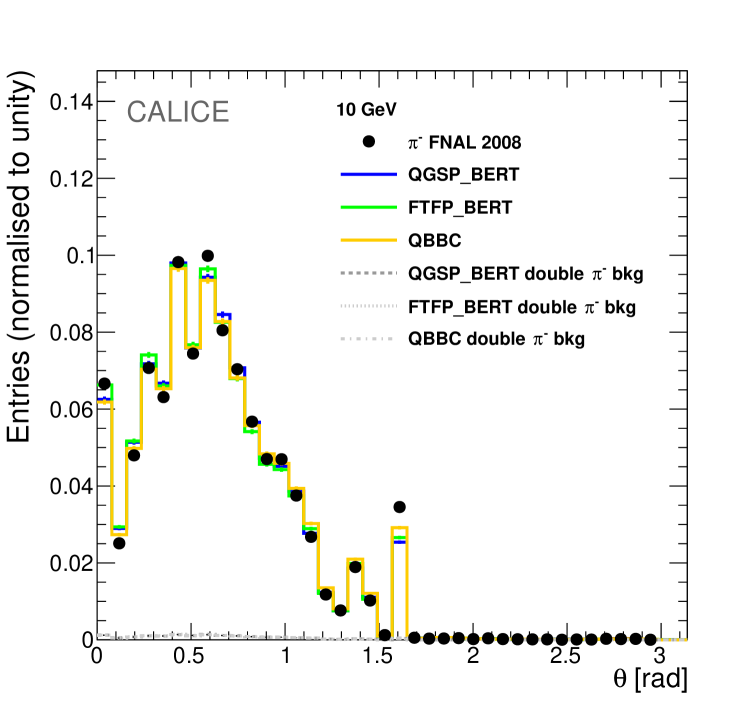
Due to the high granularity of the Si-W ECAL further tracking observables such as the polar () and azimuthal () angles of secondary tracks become available. Both angles are measured in the right-handed coordinate frame defined in Sec. 3.1 with measured relative to the -axis. The track direction is calculated from the position of the first and the last hit of the track along the -axis.
Figures 17 and 18 display histograms of the and angles, respectively, for 2 and 10 GeV data together with corresponding corresponding results from simulation models. When corrected for the staggering of the detector layers in [4], the pad coordinates of the Si-W ECAL define a grid with a step width of about 1 cm in the lateral direction. This leads to a discretisation of the measured track direction. In particular, in the case of the azimuthal angle , values that are a multiple of are favoured. Beyond that the distribution in is isotropic as expected. The bulk of the tracks are scattered in polar angles less than as expected for a fixed target scattering. On the other hand the polar angle spectrum develops a long tail created by backward scattered particles. The simulation models reproduce the data adequately, largely within the experimental uncertainties.
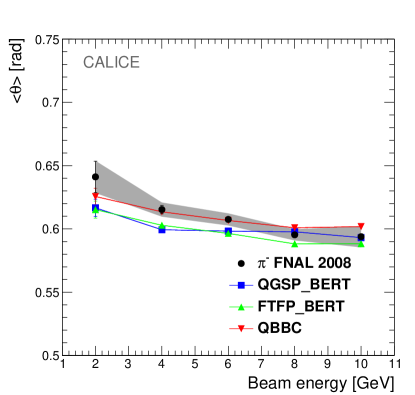
The truncated mean of the angle, , which can be interpreted as a measure of the collimation of the secondary particles, is shown in Fig. 19 as a function of the beam energy. Here tracks with polar angles smaller than have been selected. The observable has only a weak dependence on the beam energy but shows the tendency to decrease with increasing energy as expected due to the increase of the boost transferred to the secondary particles. The simulation models reproduce the data within a few percent, albeit the boost is less visible.
5.7 Energy deposition by secondary tracks
At energies relevant for this study, the secondaries that create sizeable tracks cross the detector volume behaving in a similar manner to minimally ionising particles. This fact may be exploited as an in situ calibration of the detector, or at least to monitor the response of individual detector regions. For this specific study the selection criteria of events and tracks are modified as follows:
-
1.
events are required to have more than one track and an interaction region to suppress soft inelastic scattering interactions at lower energies;
-
2.
reconstructed tracks must have a length g. u. and g. u. to select long ‘pencil-like’ tracks;
-
3.
Reconstructed tracks must have a polar angle rad to reduce the angular dependence of the energy deposits.
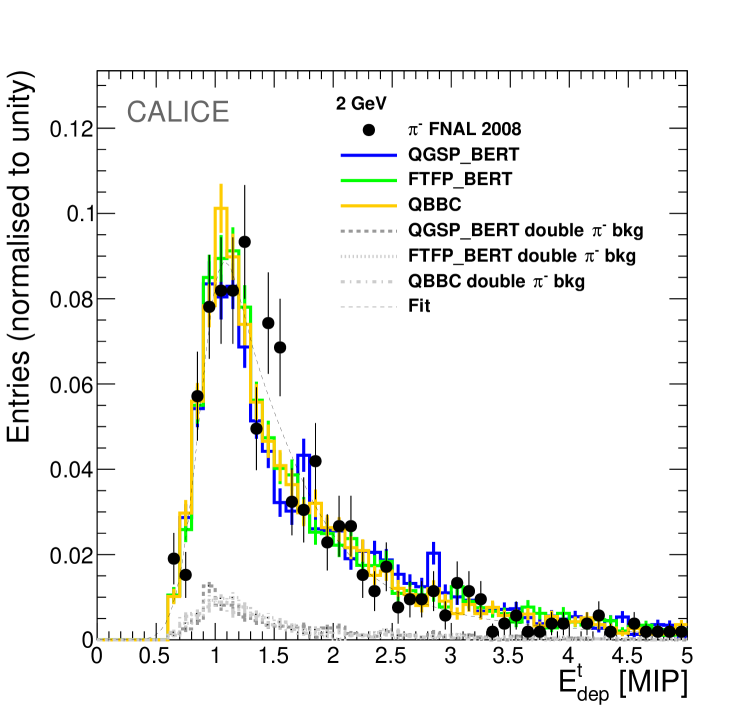
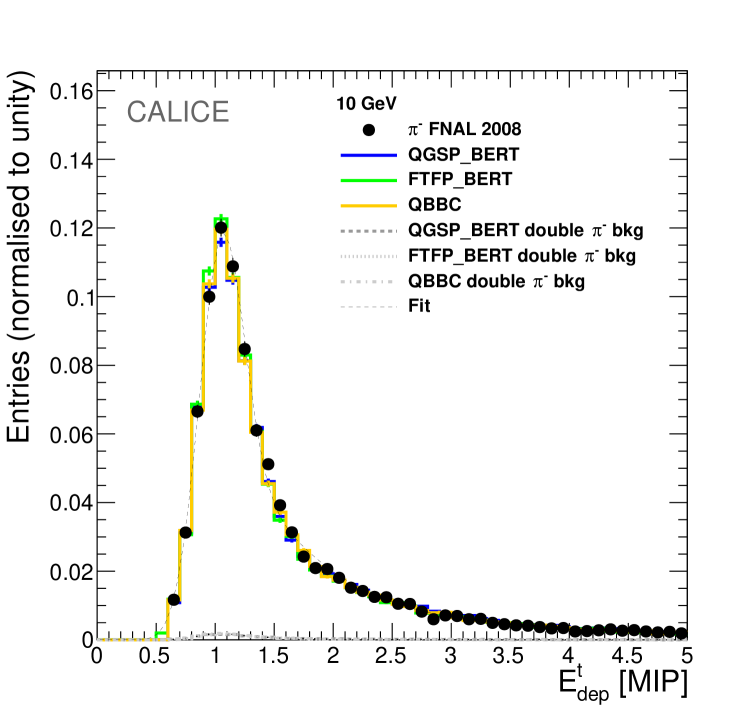
Figure 20 displays the energy deposition per hit by secondary tracks for beam energies of 2 and 10 GeV. Both distributions peak at around 1 MIP as expected for straight MIP-like tracks. The overlaid fit is a Landau distribution convolved with a Gaussian resolution function, describing the data well. The tighter selection criteria reduce considerably the event sample at 2 GeV. As a consequence, the statistical uncertainty of the fit is large for the 2 GeV sample.
Figure 21 presents the dependence of the most probable value (MPV) of the energy deposition in secondary tracks on beam energy. The MPV is about 1.05, which is compatible with the fact that the selected tracks cross the detector pads at a small angle. It can be seen that the detector response is both uniform within 1–2% for the analysed energy range in data and reproduced by the simulation models within 1–2%.
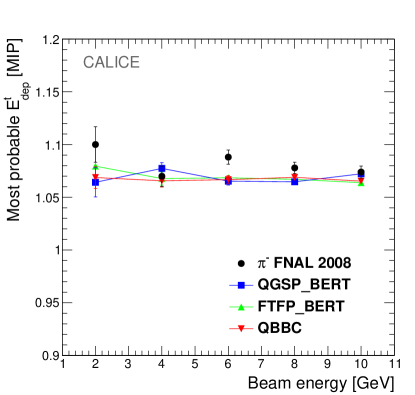
The algorithm has selected particles with approximately minimally ionising behaviour. The uniform response supports the idea that the secondary tracks can be used for the in situ monitoring of the calibration.
6 Summary and outlook
This study reveals the large potential of the CALICE Si-W ECAL physics prototype to obtain a detailed picture of the interactions of hadrons with matter. The article describes basic ideas and the application of a new simple track-finding algorithm for the Si-W ECAL. This algorithm allows for the reconstruction of tracks produced by secondary particles created in the interaction of hadrons with the absorber material, and hence to study the interaction region of hadron showers in the Si-W ECAL. The track-finding algorithm produces a new set of observables, based on reconstructed tracks of secondary particles and the interaction region of the hadronic cascades.
Data recorded in test beams at FNAL in 2008 using -mesons with energies between 2 and 10 GeV are compared with predictions from the simulation models qgsp_bert, ftfp_bert and qbbc as implemented in geant4 Version 10.1. The agreement between data and simulation varies with beam energy and the chosen physics observable. In most cases data and simulation models agree within 10% without revealing a clear preference for one of the chosen simulation models.
The largest discrepancy between data and the simulation models is observed for the deposited energy in and the radius of the interaction region. The measured energy deposition in the interaction region is up to 15% higher than predicted by the Monte Carlo simulation. The distributions of the number of secondary tracks and the number of hits per track for data are described well by the simulation models. The distribution of the polar angle of the reconstructed tracks in the simulation agrees with data within 3–4 % and the distribution of azimuthal angles is reproduced well by the simulation models in spite of the non-trivial detector geometry.
Future work should aim at transferring the insights about the interaction region and the secondaries emerging from it to the optimisation of Particle Flow Algorithms.
A tighter track selection leads to long tracks by particles that show approximately minimally ionising behaviour. The detector response determined using these tracks is stable to about 1–2% over the tested energy range and shows good agreement with simulation. This observation can be exploited as a starting point for a feasibility study of an in situ calibration (or at least a regular monitoring of the detector) by means of the selected tracks.
Acknowledgements
We gratefully acknowledge the DESY, CERN and FNAL managements for their support and hospitality, and their accelerator staff for the reliable and efficient beam operation. This work was supported by the FWO, Belgium; by the Natural Sciences and Engineering Research Council of Canada; by the Ministry of Education, Youth and Sports of the Czech Republic; by the P2IO LabEx in the framework ’Investissements d’Avenir’ managed by the French National Research Agency (ANR) under Grant Agreements ANR-10-LABX-0038 and ANR-11-IDEX-0003-01; by the ’Quarks and Leptons’ Programme of CNRS/IN2P3 France; by the Alexander von Humboldt Stiftung (AvH), Germany; by the Bundesministerium für Bildung und Forschung (BMBF), Germany; by the Deutsche Forschungsgemeinschaft (DFG), Germany; by the Helmholtz-Gemeinschaft (HGF), Germany; by the I-CORE Program of the Planning and Budgeting Committee, Israel; by the Nella and Leon Benoziyo Center for High Energy Physics, Israel; by the Israeli Science Foundation, Israel; by the National Research Foundation of Korea; by the Korea-EU cooperation programme of National Research Foundation of Korea, Grant Agreement 2014K1A3A7A03075053; by the Netherlands Organisation for Scientific Research (NWO); by the Science and Technology Facilities Council, UK; by the Nuclear Physics, Particle Physics, Astrophysics and Cosmology Initiative, a Laboratory Directed Research and Development program at the Pacific Northwest National Laboratory, USA.
References
References
- [1] J.-C. Brient and H. Videau, “The Calorimetry at the future e+ e- linear collider”, eConf C010630 (2001) E3047, SNOWMASS-2001-E3047, arXiv:hep-ex/0202004 [hep-ex].
- [2] V. L. Morgunov, “Calorimetry design with energy-flow concept (imaging detector for high-energy physics)”, in Calorimetry in particle physics. Proceedings, 10th International Conference, CALOR 2002, Pasadena, USA, March 25-29, 2002, pp. 70–84. 2002.
- [3] M. Thomson, “Particle Flow Calorimetry and the PandoraPFA Algorithm”, Nucl.Instrum.Meth. A611 (2009) 25–40, CU-HEP-09-11, arXiv:0907.3577 [physics.ins-det].
- [4] CALICE Collaboration, J. Repond et al., “Design and Electronics Commissioning of the Physics Prototype of a Si-W Electromagnetic Calorimeter for the International Linear Collider”, JINST 3 (2008) P08001, arXiv:0805.4833 [physics.ins-det].
- [5] CALICE Collaboration Collaboration, C. Adloff, Y. Karyotakis, J. Repond, J. Yu, G. Eigen, et al., “Study of the interactions of pions in the CALICE silicon-tungsten calorimeter prototype”, JINST 5 (2010) P05007, arXiv:1004.4996 [physics.ins-det].
- [6] CALICE Collaboration, B. Bilki et al., “Testing hadronic interaction models using a highly granular silicon–tungsten calorimeter”, Nucl. Instrum. Meth. A794 (2015) 240–254, arXiv:1411.7215 [physics.ins-det].
- [7] J. Allison et al., “Geant4 developments and applications”, IEEE Trans. Nucl. Sci. 53 (2006) 270, SLAC-PUB-11870. http://geant4.web.cern.ch/geant4.
- [8] J. Allison et al., “Recent developments in Geant4”, Nucl. Instrum. Meth. A835 (2016) 186–225, FERMILAB-PUB-16-447-CD.
- [9] CALICE Collaboration, C. Adloff et al., “Track segments in hadronic showers in a highly granular scintillator-steel hadron calorimeter”, JINST 8 (2013) P09001, MPP-2013-143, arXiv:1305.7027 [physics.ins-det].
- [10] CALICE Collaboration, Z. Deng et al., “Tracking within Hadronic Showers in the CALICE SDHCAL prototype using a Hough Transform Technique”, JINST 12 (2017) no. 05, P05009, CALICE-PUB-2017-001, arXiv:1702.08082 [physics.ins-det].
- [11] CALICE Collaboration, C. Adloff et al., “Construction and Commissioning of the CALICE Analog Hadron Calorimeter Prototype”, JINST 5 (2010) P05004, DESY-10-032, arXiv:1003.2662 [physics.ins-det].
- [12] CALICE Collaboration, “Construction and performance of a silicon photomultiplier/extruded scintillator tail-catcher and muon-tracker”, JINST 7 (2012) P04015, arXiv:1201.1653 [physics.ins-det].
- [13] P. Mora de Freitas and H. Videau, “Detector simulation with MOKKA / GEANT4: Present and future”, in Linear colliders. Proceedings, International Workshop on physics and experiments with future electron-positron linear colliders, LCWS 2002, Seogwipo, Jeju Island, Korea, August 26-30, 2002, pp. 623–627. 2002. http://flc.desy.de/lcnotes/noteslist/localfsExplorer_read?currentPath=/afs/desy.de/group/flc/lcnotes/LC-TOOL-2003-010.ps.gz.
- [14] D. H. Wright and M. H. Kelsey, “The Geant4 Bertini Cascade”, Nucl. Instrum. Meth. A804 (2015) 175–188.
- [15] B. Andersson, G. Gustafson, and B. Nilsson-Almqvist, “A Model for Low p(t) Hadronic Reactions, with Generalizations to Hadron - Nucleus and Nucleus-Nucleus Collisions”, Nucl. Phys. B281 (1987) 289–309, LU-TP-86-3.
- [16] B. Nilsson-Almqvist and E. Stenlund, “Interactions Between Hadrons and Nuclei: The Lund Monte Carlo, Fritiof Version 1.6”, Comput. Phys. Commun. 43 (1987) 387, LU TP-86-14, LUIP-8604.
- [17] G. Folger and J. Wellisch, “The Binary Cascade”. https://cds.cern.ch/record/865824.
- [18] GEANT4 Collaboration, “Reference Physics Lists”. http://geant4.cern.ch/support/proc_mod_catalog/physics_lists/referencePL.shtml.
- [19] H. Li, Higgs Recoil Mass and Cross-Section Analysis at ILC AND Calibration of the CALICE SiW ECAL Prototype. Theses, Université Paris Sud - Paris XI, Oct., 2009. https://tel.archives-ouvertes.fr/tel-00430432.
- [20] P. Doublet, Hadrons in a highly granular SiW ECAL – Top quark production at the ILC. Theses, Université Paris Sud - Paris XI, Oct., 2011. https://tel.archives-ouvertes.fr/tel-00657967.
- [21] CALICE Collaboration, “Tracks of hadronic showers in the Si-W ECAL physics prototype”, Tech. Rep. CALICE Analysis Note CAN-055. CALICE-CAN-2016-001, 2016. http://cds.cern.ch/record/2669486.
- [22] S. Bilokin, Hadronic showers in a highly granular silicon-tungsten calorimeter and production of bottom and top quarks at the ILC. Theses, Paris Saclay, July, 2017. https://tel.archives-ouvertes.fr/tel-01826535.