Electrodynamics of granular aluminum from superconductor to insulator:
observation of collective superconducting modes
Abstract
We report on a detailed study of the optical response and phase diagram ( being the superconducting critical temperature and the normal state resistivity of the film) of granular aluminum, combining transport measurements and a high resolution optical spectroscopy technique. The phase diagram is discussed as resulting from an interplay between the phase stiffness, the Coulomb repulsion and the superconducting gap . We provide a direct evidence for two different types of well resolved sub-gap absorptions, at and at (decreasing with increasing resistivity).
To cite:
F. Levy-Bertrand et al, Phys. Rev. B 99, 094506 (2019).
DOI: 10.1103/PhysRevB.99.094506
I Introduction
In principle, superconductors are perfect mirrors and no optical absorptions are expected to be observed below twice the superconducting gap, Varma_intro (for a fully gapped s-wave symmetry). Indeed, amplitude fluctuations of the superconducting order parameter are expected to give rise to a (scalar) mode at 2, decoupled from electromagnetic waves and the dispersive phase fluctuation (Goldstone) mode Nambu ; Goldstone transforms into a non-dispersive plasma mode, well above the superconducting gap, in presence of unscreened long range Coulomb interactions Anderson1 ; Anderson2 . However, an excess of optical absorption below 2 has been observed in various disordered superconductors. In NbN and InO, this excess has been attributed to the existence of an amplitude (Higgs) mode Higg_InO which could turn into a sub-gap excitation in the vicinity of a quantum critical point (while approaching a superconductor-to-insulator transition). Alternatively, in granular aluminum, this effect has been discussed as an evidence for Goldstone modes Goldstone__Pracht turned into a sub-gap excitation due to the coupling of the linear dispersion with a characteristic finite momentum set in by disorder.
We present here a detailed study of the electrodynamic properties of a series of granular aluminum thin films, combining transport measurements and sub-THz optical spectroscopy. Granular aluminum is formed of superconducting nanometric grains of pure aluminum coupled by Josephson barriers through aluminum oxide, and can be tuned from a superconductor to an insulator by varying the Josephson coupling. The superconducting-insulator transition is reached when the aluminum oxide barriers are too large, preventing a phase coherence to develop throughout all grains Efetov . The superconducting critical temperature then presents a dome shape Abeles ; Cohen ; Deutscher_1973 ; these_Bachar ; Mott_Bachar ; Dome_Pracht , whose origin is still debated, with a critical temperature, reaching 2-3 K (depending on grain size morphology) at the maximum of the dome, which is significantly higher than the K of pure aluminum.
Our optical spectroscopy technique, combining an optical dilution fridge (with a base temperature of 100 mK) with a Martin-Puplett spectrometer of high resolution (1 GHz) from 0 GHz to 300 GHz enabled us to observe two different types of sub-gap optical absorptions. We observe a first series of well defined absorption peaks at a frequency of the order of and a second larger peak at a frequency which decreases progressively from towards as the superconductor-insulator transition is approached. The onset of those sub-gap absorptions occurs in the vicinity of the maximum of the superconducting dome, for 100-1000 .cm room temperature resistivity. In the same resistivity range we observed (i) a change from a positive to negative temperature dependence of the normal state resistivity, (ii) an increase of the coupling strength ratio from to , and, (iii) we estimate that the phase stiffness falls below the geometrical Coulomb repulsion energy. Finally we show that the insulating regime is reached when .
II Experimental
We performed optical spectroscopy and transport measurements on ten samples from low (sample #A) to high (sample #J) room-temperature resistivity, spanning the phase diagram of granular aluminum from superconductor to insulator. The partial oxygen pressure was increased from samples #A to #J while e-beam evaporating aluminum at 0.3 nm/second on sapphire substrates held at room temperature. A study of the films structure prepared in similar conditions allows us to estimate that the grain size is of the order of 3-4 nm in our films Deutscher_1973 . The films are 20 nm thick except sample #H that is 30 nm thick and sample #J that is 50 nm thick. On each film, a 3 mm0.4 mm rectangle has been lithographied in order to perform resistivity measurements. Table 1 lists the different samples.
| (.cm) | d(nm) | (K) | (K) | (pH/sq) | |
|---|---|---|---|---|---|
| #A | 40 | 20 | 1.900.02 | 3.40.3 | 20 |
| #B | 80 | 20 | 2.040.03 | 3.60.1 | 33 |
| #C | 160 | 20 | 2.170.02 | 3.80.1 | 80 |
| #D | 220 | 20 | 2.170.02 | 3.90.1 | 110 |
| #E | 900 | 20 | 2.080.02 | 4.30.3 | 325 |
| #F | 1600 | 20 | 2.030.06 | 4.40.4 | 430 |
| #G | 2000 | 20 | 1.990.06 | 4.30.3 | 535 |
| #H | 3000 | 30 | 1.910.04 | 3.90.1 | 620 |
| #I | 11400 | 20 | |||
| #J | 20500 | 50 |
The optical spectroscopy technique used here is inspired by millimeter astrophysics observation techniques Day ; NIKA2 . For each granular aluminum composition, from sample #A to #H, superconducting microwave resonators were lithographied and cooled down to 100 mK in an optical dilution fridge (those measurements could not be performed in sample #I and #J for which the resistivity remains finite down to the lowest temperatures). The optical spectroscopy measurements consisted in monitoring the resonators resonance frequencies while varying the optical incident photon energy. The energy of the incident photon was spanned from 0 to 3 THz with a resolution of 1 GHz thanks to a Fourier-Transform spectrometer with a 300 K black body radiation source. An optical low pass filter in the dilution fridge limits the incident photon range to 300 GHz. Figure 1 presents the resonators design and a schematic view of the experimental set-up employed to perform the optical spectroscopy measurements.
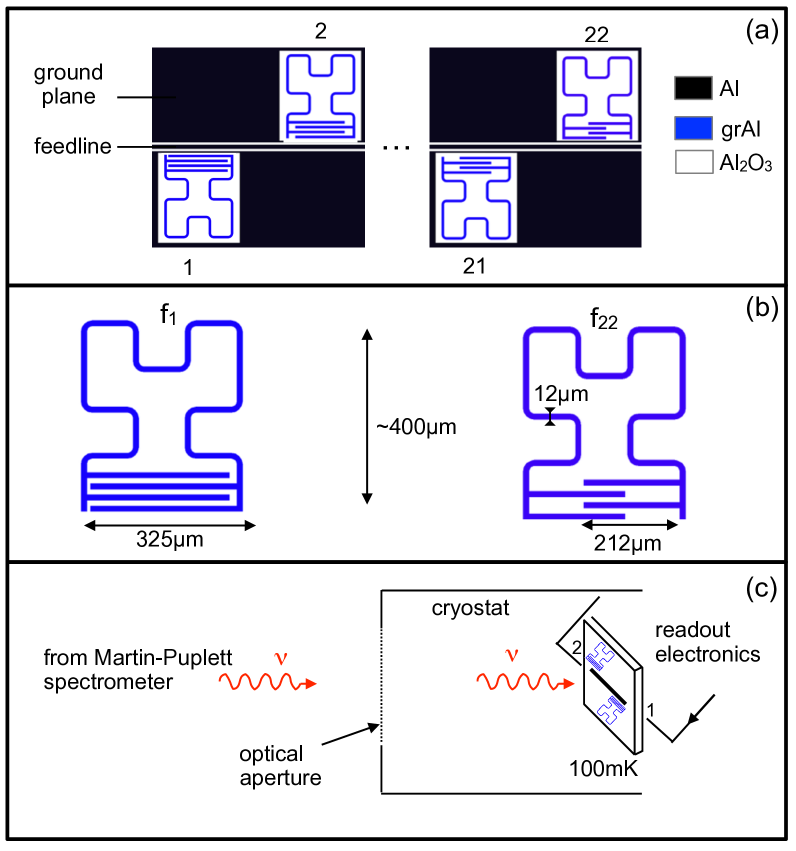
The resonance frequency is of the order of few GHz (from 2 to 6 GHz) and is varied from one resonator to another by varying the capacitor fingers length (see panel (b) of figure 1). The inductance is identical for all the resonators and can be decomposed in a geometric and a kinetic part: . The shift of the resonance frequency is due to the change of the kinetic inductance that is inversely proportional to the superfluid density Day ; Diener :
| (1) |
where is the kinetic inductance ratio. The superfluid density may be affected through two different mechanisms by an incident photon . First, when , the incident photon may break Cooper pairs Day . Second, for , superconductors are usually considered as perfect mirrors. One key point of this latter mechanism is the photon absorption. To be absorbed, the energy of an incident photon has to match the energy of a superconducting collective mode. When the photon is absorbed, the superfluid current density increases, decreasing the superfluid density De Gennes ; Tinkham , leading to an increase of the kinetic inductance , which can be written as De Gennes ; Tinkham ; Lorentz :
| (2) |
where is proportional to the critical current ( in thin films). sets the incident power scale for which this second mechanism may be observed. This value lowers with the superfluid density (while approaching the superconductor-to-insulator transition for example). Some of us observed this second mechanism in amorphous indium oxide resonators where the collective modes at play were higher-order resonance (surface plasma) modes Dupre_SKIDs . For each granular aluminum film from #A to #H the optical response displayed is an average over all the functional resonators and corresponds to a Fourier-Transform of the measurements (the individual resonators’ responses are displayed in the appendix). The amplitude of the frequency shift is uncorrected from the incoming source energy distribution and thus is given in arbitrary units.
III Results and discussion
III.1 Transport measurements
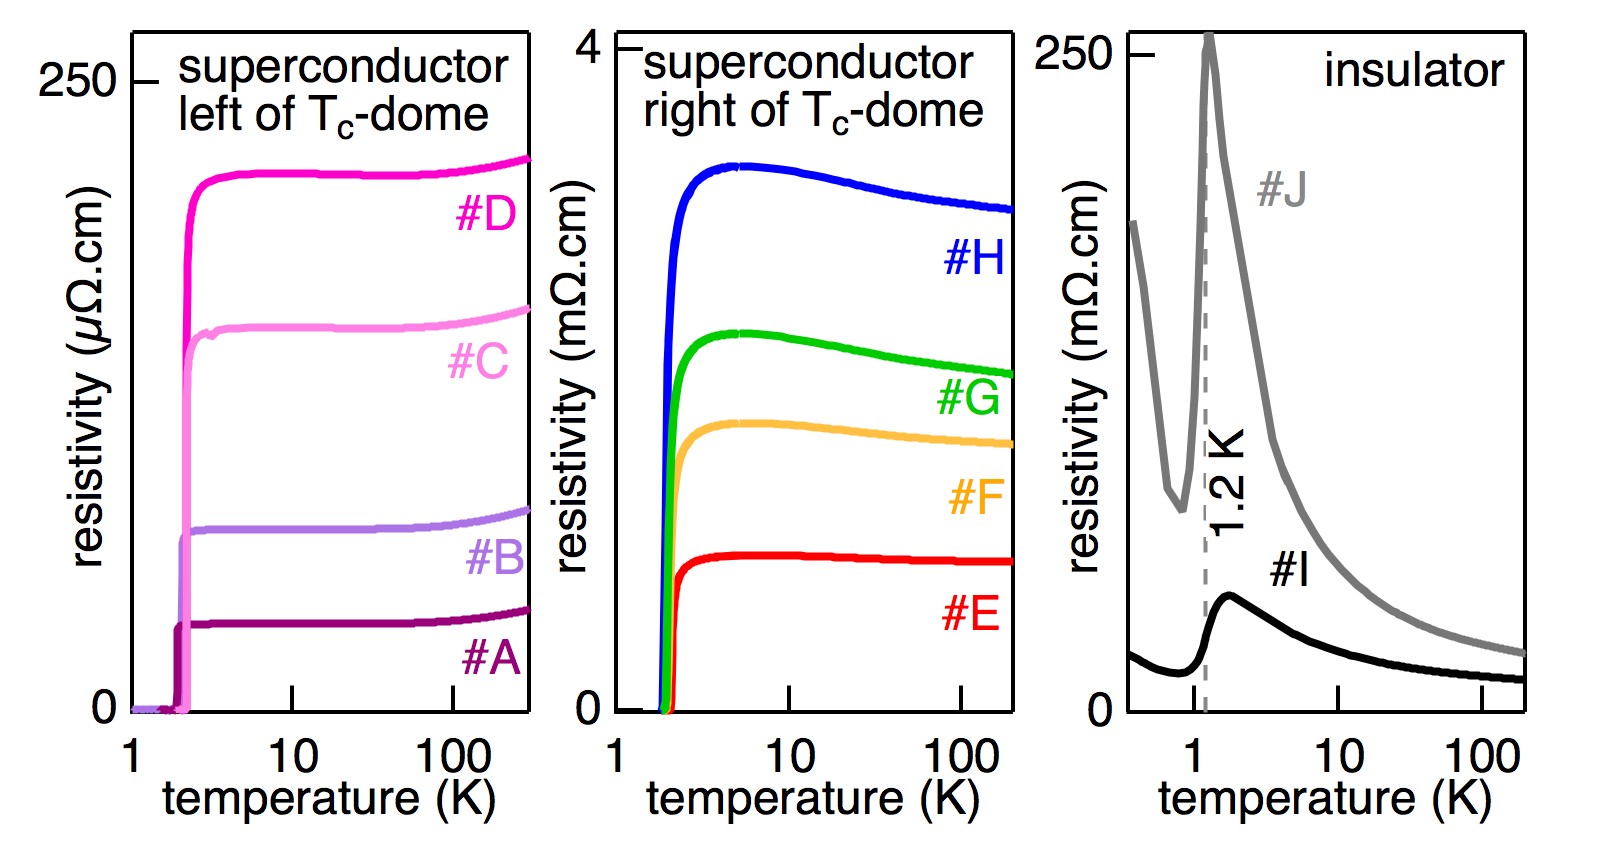
As shown in Figure 2, a superconductor to insulator transition is visible on the resistivity measurements. The room temperature resistivity increases from sample #A to sample #J. From samples #A to #D, situated on the left side of the critical superconducting temperature dome, a (mainly) positive slope of the resistivity with temperature is observed and superconductivity develops at low temperature with progressively rising up to K (see Figure 3). As previously reportedDeutscher_1973 ; Kondolike_Bachar ; Mui ; Kunchur , a change to a negative slope of the resistivity with temperature is observed in samples #E to #J (right side of the critical superconducting temperature dome) but superconductivity (null resistance) still develops at low temperature in samples #E to #H. This change in may be due either to weak localisation effects Altshuler or to an interplay between electron-phonon coupling and disorder Jonson ; Imry ; Fratini .
Finally, the temperature dependence of the resistivity in sample #I and #J can be well described by a law (with ) both below and above the dip at 1.2K, clearly indicating that those films are insulating, at least down to 400mK. As theoretically foreseen Efetov and previously observed reentranceAl_Wu ; reentranceAl_Jaeger , this dip is a probable reminiscence of local superconductivity in the grains and occurs at the critical temperature of pure aluminum K (inflection point of the resistive transitions, preliminary resistivity measurements - not presented here - show that the dip disappears for increasing magnetic field, supporting this interpretation). This observation is puzzling as it is often believed that small aluminum grains may have a critical temperature larger than the bulk value Perenboom . The dip occurring at 1.2K could hence be the signature of the presence of big clusters of well coupled grains but it may also indicate that the enhanced critical temperature in granular aluminum requires an alternative explanation than shell effects (note that measurements on individual nanometer-scale aluminum particules indicated a constant superconducting gap value, uncorrelated with the radius of the particules Black ).
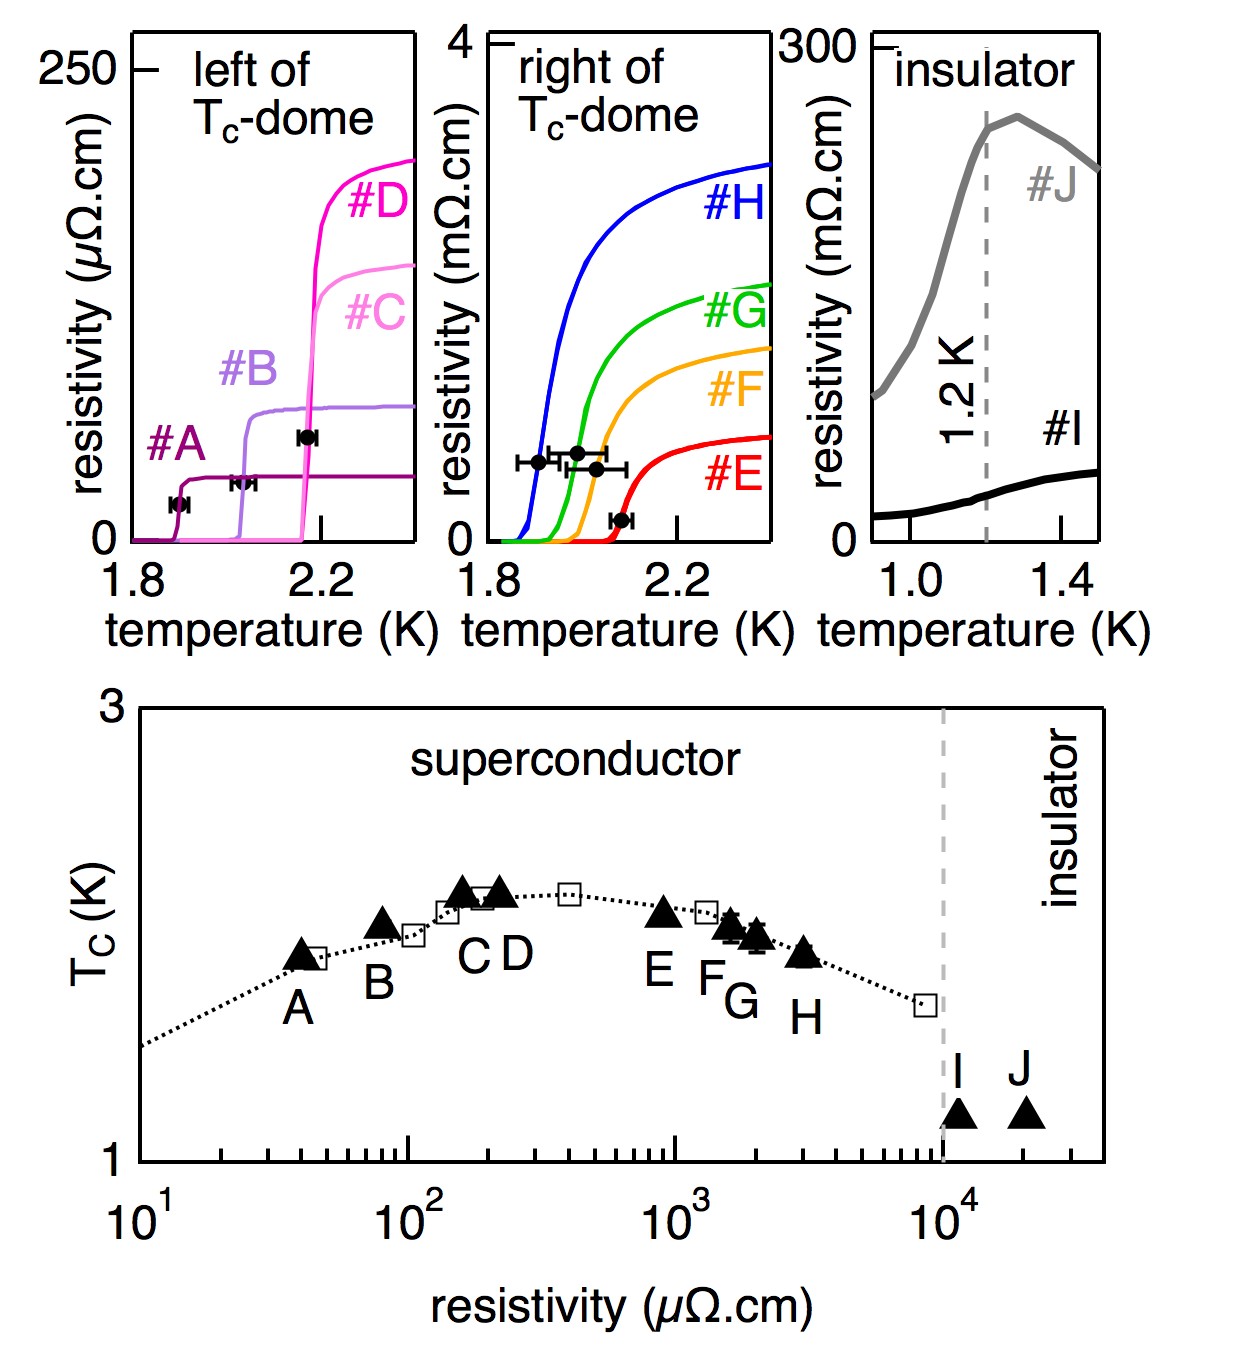
As shown in Figure 3, the superconducting transitions are pretty stiff for the samples situated on the left side of the -dome, i.e. displaying a (mainly) positive slope of the temperature dependence of the resitivity, and broaden in the samples situated on the right side of the -dome (with a negative slope of the temperature dependence of the resistivity). The critical temperatures have then been defined as the inflection point of the resistive transitions (black disks in Fig.3). The bottom part of the figure displays the critical temperatures versus room temperature resistivity.
III.2 Phase diagram
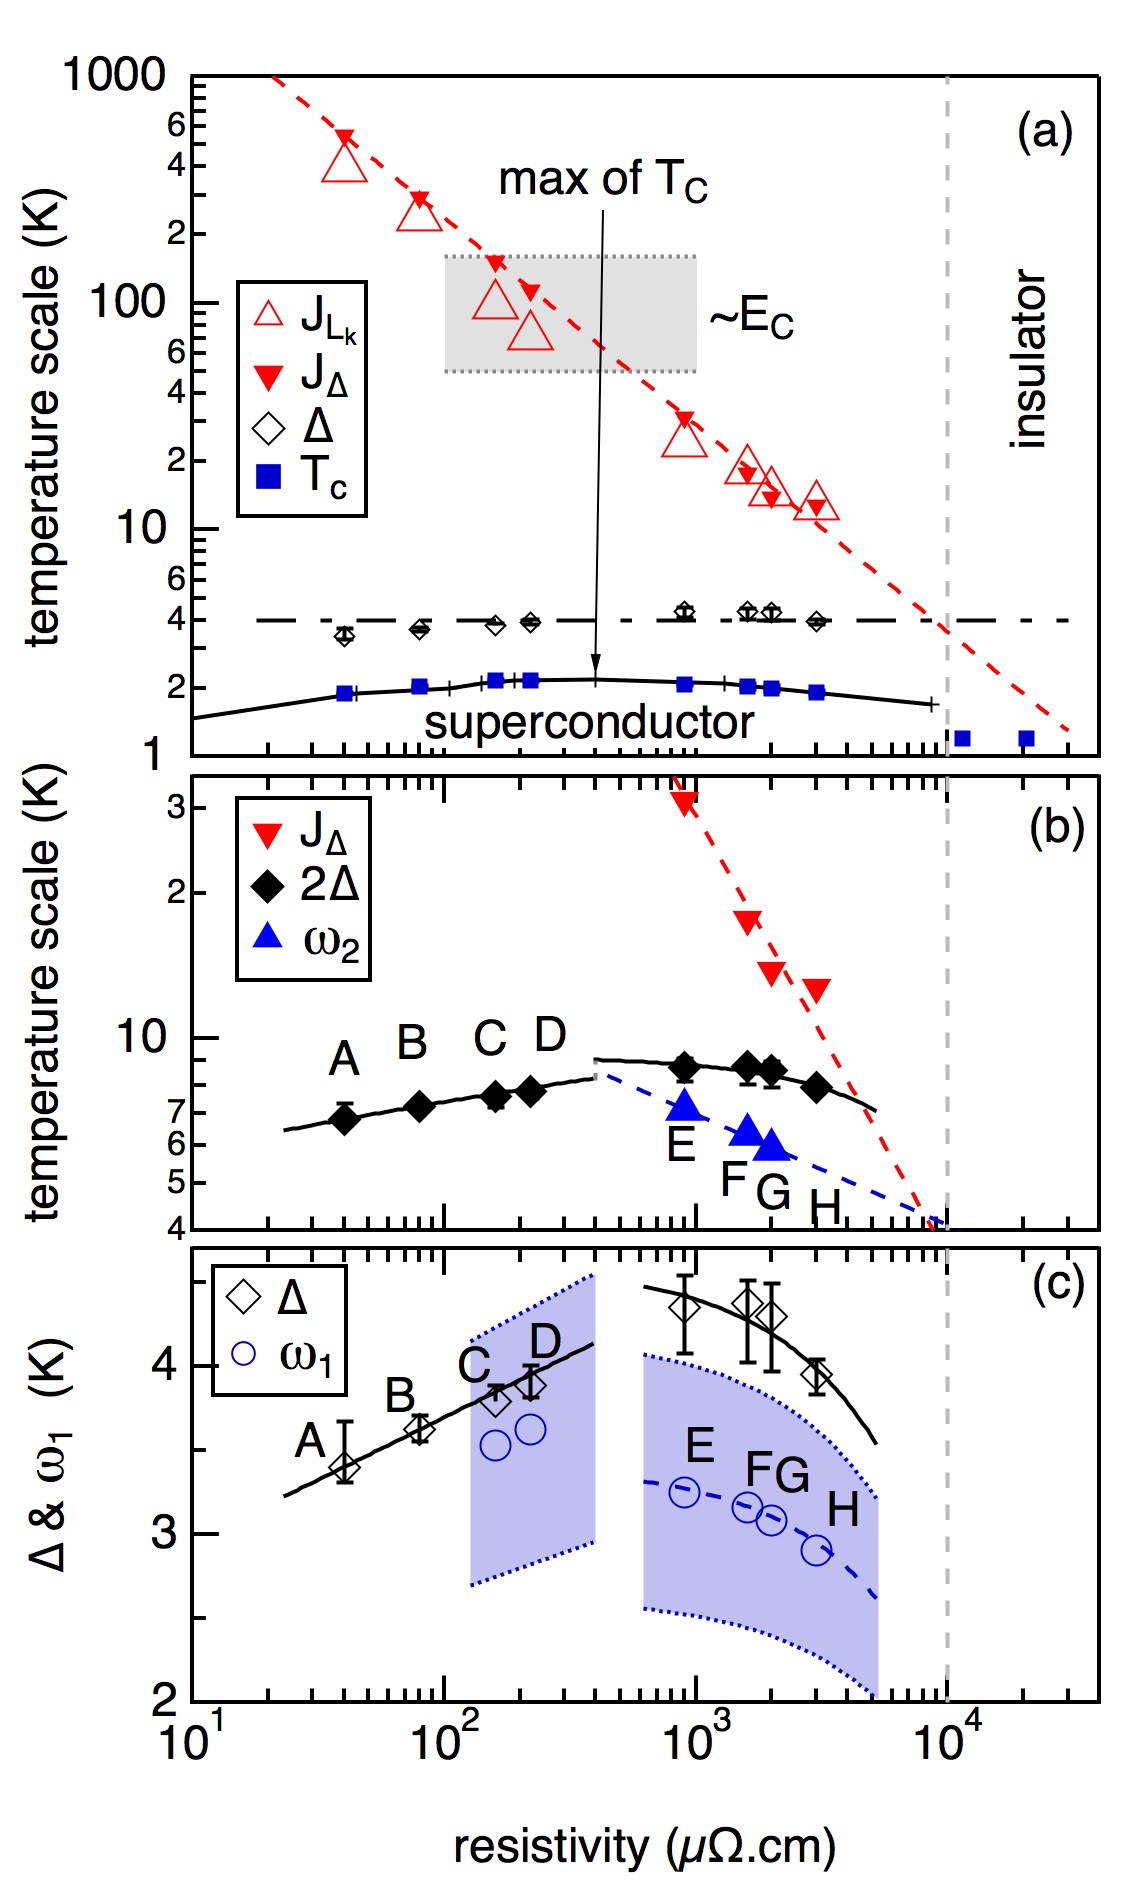
Figure 4 displays the phase diagram of granular aluminum, presenting the evolution with resistivity of the different energies at play. Following reference Dome_Pracht , panel (a) displays the critical temperature, the superconducting gap (deduced from our optical measurements, see below), the phase stiffness, and the Coulomb repulsion energy. The phase stiffness of the superconducting condensate determines the phase coherence of the condensate and corresponds to the Josephson energy in the case of a network of Josephson Junctions. At zero temperature, can first be evaluated through Efetov ; these_Bachar ; Dome_Pracht ; Goldstone__Pracht where is the thin film surface resistance per square (labelled in Figure 4). is also related to the kinetic inductance of the superconducting resonators though Rotzinger . By comparing their resonance frequencies, , to frequencies obtained by radio-frequency electromagnetic simulations we determined Dupre_SKIDs and thus the phase stiffness labeled . Those two values agree with each other very well. The measured data show that superconductivity is suppressed at the superconducting-insulating transition, when the phase stiffness becomes smaller than the superconducting gap.
The Coulomb repulsion energy , i.e the bare geometrical charging energy, that is the energy cost to transfer an electron from grain to grain, increases with the resistivity these_Bachar . This charging energy can be estimated for a resistivity corresponding to grains just decoupled through one unit cell of the aluminum oxide barrier by these_Bachar : where 8.5 is the relative dielectric constant of aluminum oxide, 0.5 nm correspond to one atomic layer of the insulating barrier and is the grain size. Taking 3-6 nm for one to two merging grains Deutscher_1973 , one obtains K, which is close to the phase stiffness at the dome maximum.
Granular aluminum films may be described as disordered arrays of Josephson junctions connecting the grains. The phase diagram of granular aluminum can be interpreted as resulting from an interplay between the different energy scales that are the phase stiffness, the Coulomb repulsion and the superconducting gap Beloborodov . In the metallic regime, for room temperature resistivity 100 .cm, when superconductivity establishes, all electrons condensate and form one wave function with a unique phase. The phase is rigid with a phase stiffness that is orders of magnitude higher than both the Coulomb repulsion energy and the superconducting gap (see Fig. 4a). In the vicinity of the superconducting dome maximum, for .cm, the phase stiffness falls below the Coulomb repulsion energy. Note that the Coulomb repulsion energy is not a relevant energy on a microscopic scale as electron tunneling between the grains leads to a renormalization of down to a smaller effective Coulomb energy Larkin ; Beloborodov . However, experimentally seems to coincide with the onset of sub-gap absorptions, a change from a positive to negative temperature dependence of the normal state resistivity, and an increase of the coupling strength ratio from to . In line with reference Emery we suggest that for phase fluctuations develop leading to a decrease of . Eventually, when , Coulomb blockade localises the Cooper pairs within the grains, turning the system into an insulator Efetov ; Beloborodov . The superconductor-insulator transition is theoretically expected to be reached for i.e. for , which corresponds to a surface resistance per square equals to the quantum of resistance k. Indeed, the sheet resistance of the first insulating sample is 5.7 k.
III.3 Optical response and Sub-gap optical absorptions
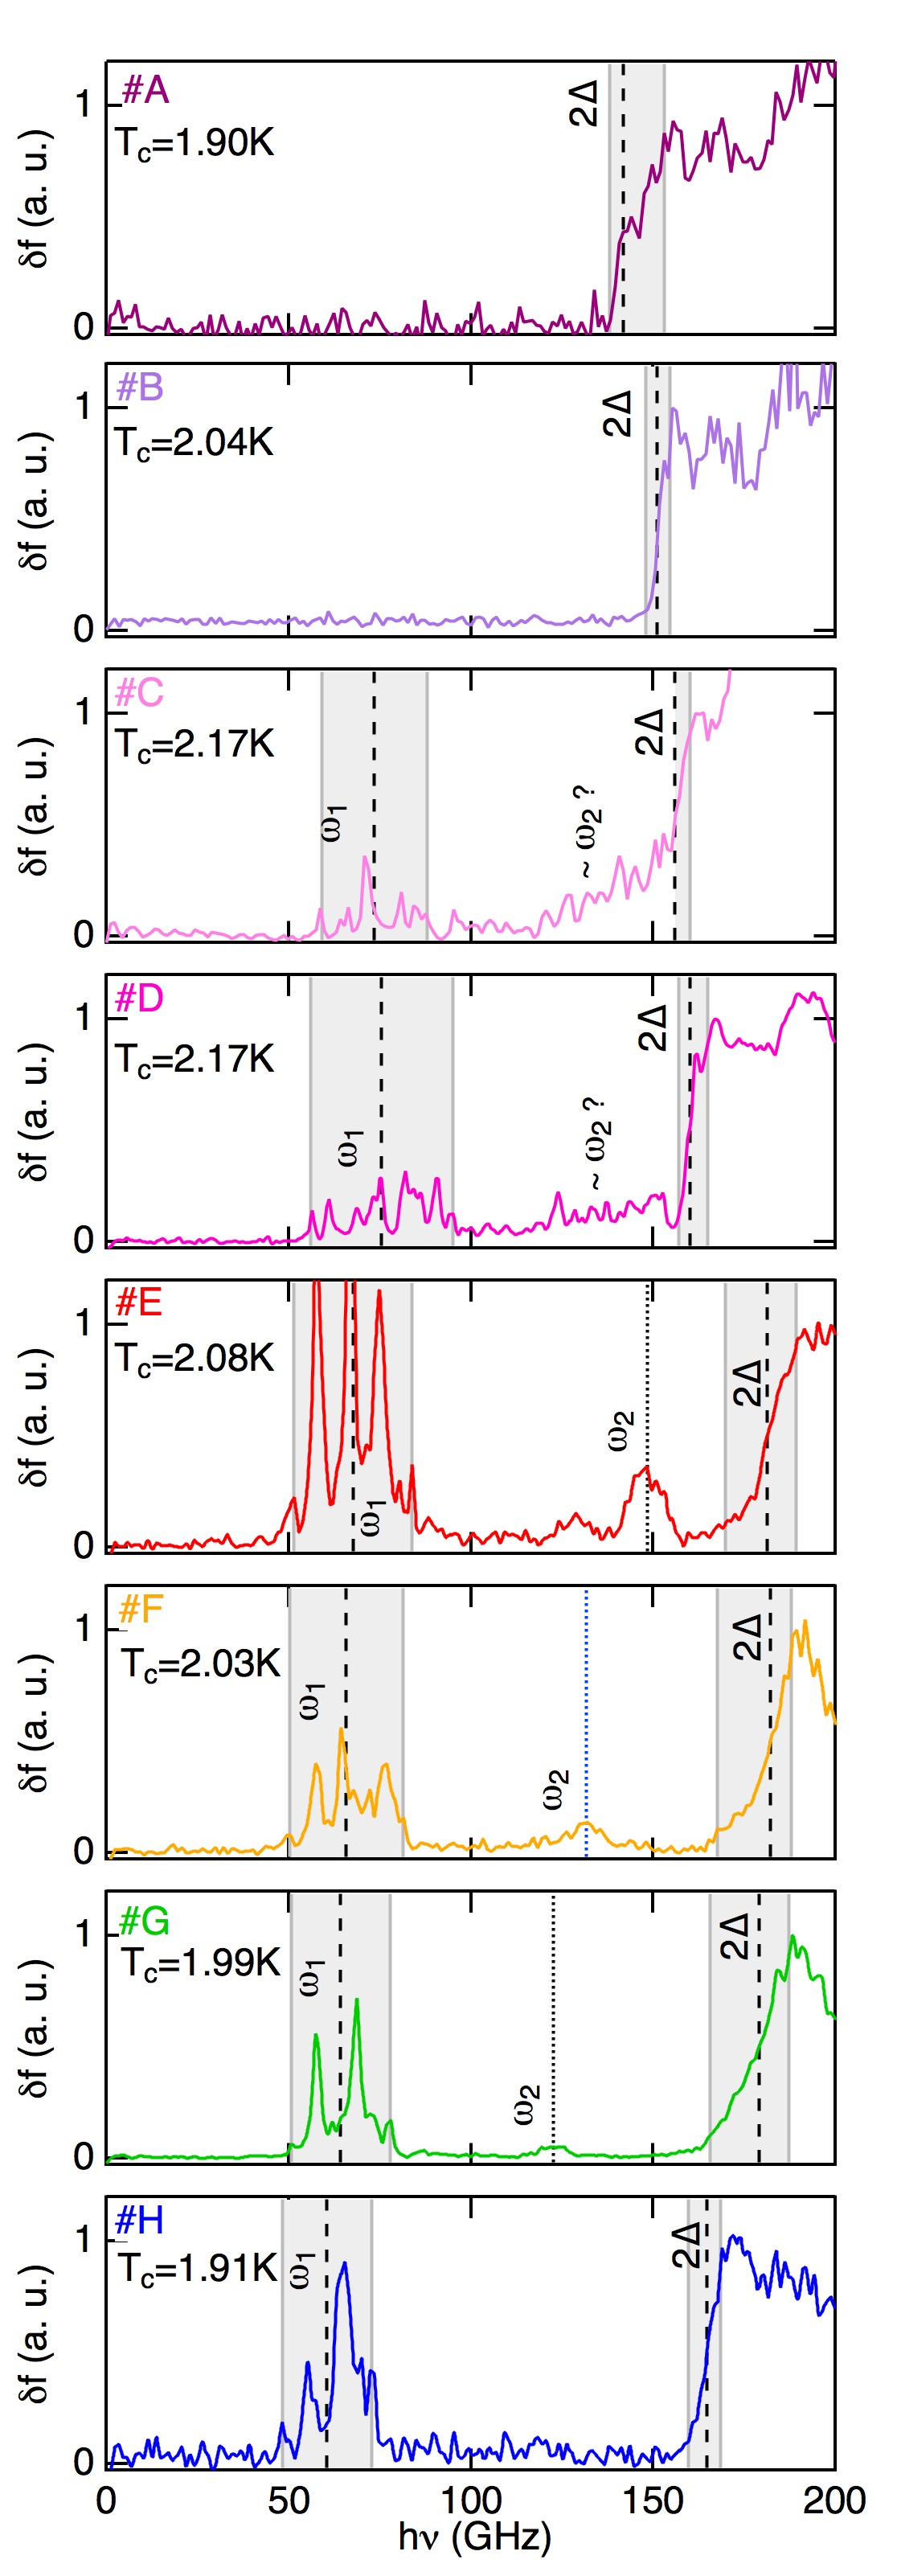
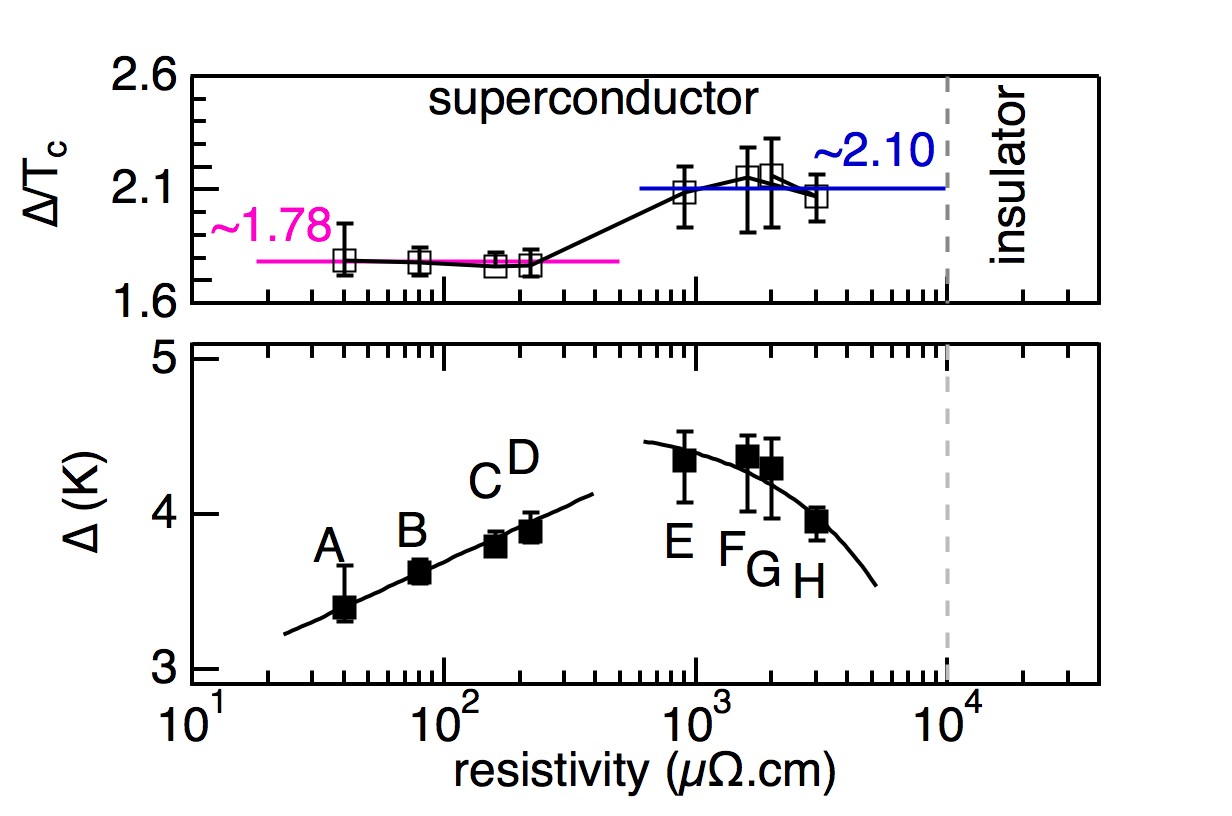
In Figure 5 we show the optical response of superconducting granular aluminum films. Twice the superconducting gap value is directly determined from the abrupt increases of the frequency shift as the photon energy reaches (pair breaking). Figure 6 displays the evolution of the superconducting gap and gap over critical temperature ratio as a function of the room-temperature resistivity. The top panel shows that there is a modification of the superconducting coupling parameter which increases from to . The direct comparaison of the optical response of sample #D ( = 2.17 K, left side of the -dome) to that of sample #E ( = 2.08 K, right side of the -dome) underlines that although their critical temperature are almost identical their gap are different (see figure 5). Note that the ratio of sample #H, = 1.91 K, is clearly larger than including the error bars. The lines of the bottom panel intend to underline the change of the gap value.
Below the superfluid response evolves from a feature-less response for samples #A and #B to a response with strong sub-gap features for samples #E to #H. Samples #C and #D show an intermediate response. Our results are consistent with the excess of optical absorption observed previously below twice the superconducting gap in granular aluminum Goldstone__Pracht (and other disordered superconductors Higg_InO ). This excess of optical absorption as been interpreted as a Goldstone mode Goldstone__Pracht of the superconducting order parameter. As we do show here that those sub-gap absorptions onset for and strengthen for , we confirm that they are probably related to phase fluctuations of the superconducting order parameter.
However, it is important to note that - thanks to a higher energy resolution of our spectrometer and lower working temperature - we can resolve the existence of two different types of features, occurring at and (see figure 5). Both the energy position and the shape of those absorption peaks are clearly different. As shown in panel (c) of figure 4, remains on the order of (slightly lower) in all measured samples. This -feature is rather an assembly of more-or-less distinguishable sharp features spread over few tens of GHz (the dash line indicates the mid-position of the features, and the distribution is underlined by the shaded area). In reference Natasha this absorption has been attributed to a two dimensional plasma phase mode. In two dimensional superconducting films plasma oscillations are expected to occur for discrete momentum values and energy where n is an integer and L is the length of the thin film/resonator (predicted Mishonov ; Mirhashem and observed Buisson ). Those surface plasma modes correspond to the higher order resonance modes of a superconducting resonator and saturate at the two dimensional plasma frequency where the number of resonances then diverges Natasha . In reference Natasha an analytical plasma dispersion established from a network of Josephson Jonction model estimates a plasma frequency of 68 GHz from the and resonances mode measured on a granular aluminium film with , in very good agreement with our observation. However, note that the multiple peak structure of remains unexplained within this scenario.
On the other hand, the -feature is a broad response the maximum of which is indicated by a dash-line in figure 5. This feature is only clearly distinguishable in three samples: #E, #F and #G (the excess of optical response just below in samples #C and #D may be attributed to this -feature), and clearly decreases from down to almost as the sample resistivity increases, tending towards at the superconductor-to-insulator transition (see panel (b) of figure 4). The origin of this feature remains to be explained.
IV Conclusion
In conclusion, we explored the superconducting critical temperature dome shape of granular aluminum by combined state-of-the art optical spectroscopy and resistivity measurements. In the vicinity of the dome maximum, we evidenced a superconducting coupling modification from to . Within the same region, we observe the occurrence of sub-gap features in the optical response, the change from a positive to negative temperature slope of the resistivity, and we estimate that the phase stiffness falls below the Coulomb energy. We evidenced two types of sub-gap excitations below twice the superconducting gap and studied their evolution with resistivity.
Acknowledgments
We are in debts to Lara Benfatto, Régis Mélin, Benoît Douçot and Olivier Buisson for discussions on the superconducting collective modes. We are very grateful to Pierre Lachkar for his help during the resistivity measurements on the Physical Property Measurement System. We acknowledge the contributions of the Cryogenics and Electronics groups at Institut Néel and LPSC. This work is supported by the French National Research Agency through Grant No. ANR-16-CE30-0019 ELODIS2 and by the LabEx FOCUS through Grant No. ANR-11-LABX-0013. F.L-B acknowledges financial support from the CNRS through a grant Défi Instrumentation aux limites 2018. LG, UvL, NM, FV, and IMP acknowledge funding from the Alexander von Humboldt foundation in the framework of a Sofja Kovalevskaja award endowed by the German Federal Ministry of Education and Research. A.G acknowledges the financial support from project ESP2015-65597-C4-1-R.
V Appendix
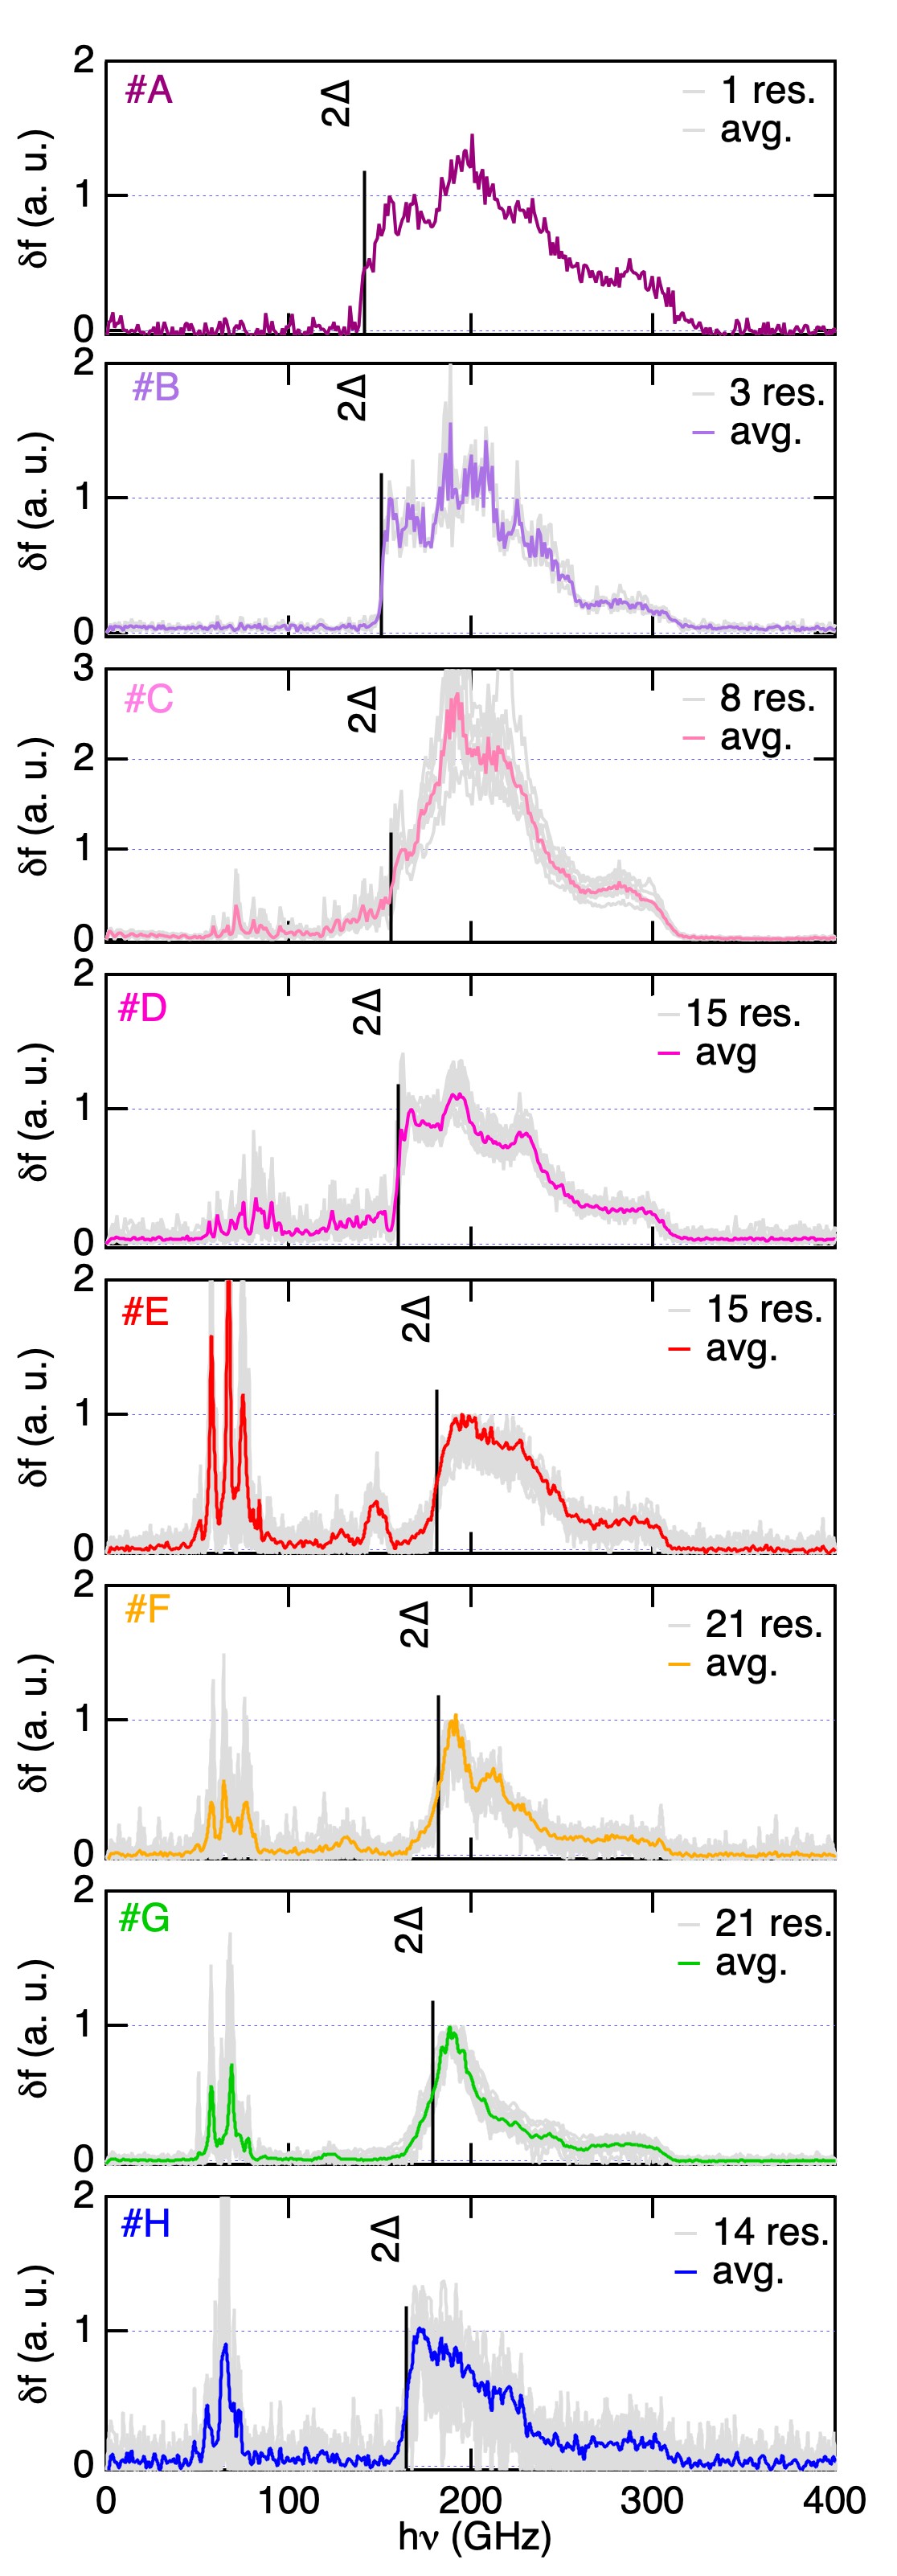
In Figure 7 we show, for each granular aluminum film from #A to #H, the average optical response and the optical response of each functional resonator. The -threshold and the -absorption are, within the noise, identical for every functional resonator of a given film. The -features are different from resonator to resonator. An optical low pass filter in the dilution fridge limits the incident photon range to 300 GHz.
References
- [1] C.M. Varma, J. Low Temp. Phys, 126, 901 (2002).
- [2] Y. Nambu, Phys. Rev. Lett. 4, 380 (1960).
- [3] J. Goldstone, Nuovo Cimento 19, 154 (1961).
- [4] P. W. Anderson, Phys. Rev. 112, 1900 (1958).
- [5] P. W. Anderson, Phys. Rev. 130, 439 (1963).
- [6] D. Sherman et al, Nat. Phys. 11, 188 (2015).
- [7] U.S. Pracht et al, Phys. Rev. B 96, 094514 (2017).
- [8] K. B. Efetov, Sov. Phys. JETP 51, 1015 (1980).
- [9] B. Abeles et al, Phys. Rev. Lett. 17, 632 (1966).
- [10] R. W. Cohen and B. Abeles, Phys. Rev. 168, 444 (1968).
- [11] G. Deutscher et al, J. Low Temp. Phys. 10, 231 (1973).
- [12] N. Bachar, Ph.D. thesis, Tel-Aviv University, Tel-Aviv, Israel, 2014.
- [13] N. Bachar et al ,Phys. Rev. B 91, 041123(R) (2015).
- [14] U.S. Pracht et al, Phys. Rev. B 93, 100503(R) (2016).
- [15] P. K. Day and al, Nature (London) 425, 817 (2003).
- [16] M Calvo and al, J. Low Temp. Phys. 184, 816 (2016).
- [17] P. Diener and al, Appl. Phys. Lett. 101, 252601 (2012).
- [18] P. G. De Gennes, Superconductivity Of Metals And Alloys (Westview, Boulder, CO, 1999), Chap 6.5.
- [19] M. Tinkham, Introduction to Superconductivity, (McGraw-Hill, New York, 1996), Chap. 4.4.
- [20] L. J. Swenson et al., J. Appl. Phys. 113, 104501 (2013).
- [21] O. Dupré et al, Supercond. Sci. Technol. 30, 045007 (2017).
- [22] N. Bachar et al, Phys. Rev. B 87, 214512 (2013).
- [23] Mui et al. Phys. Rev. B 30, 2951 (1984).
- [24] Kunchur et al, Phys. Rev. Lett. 59, 1232 (1987).
- [25] B. L. Altshuler and A. G. Aronov, Electron-Electron Interaction in Disordered Conductors, edited by A. L. Efros and M. Pollak (Elsevier, Amsterdam, 1985).
- [26] Y. Imry, Phys. Rev. Lett. 44, 469 (1980).
- [27] M Jonson, SM Girvin Physical Review Letters 43, 1447 (1979).
- [28] D. Di Sante et al, Phys. Rev. Lett. 118, 036602 (2017).
- [29] H. M. Jaeger et al, Phys. Rev. B 40, 182 (1989).
- [30] W. Wu and P. W. Adams, Phys. Rev. B 50, 13065(R) (1994).
- [31] J. A. A. J. Perenboom et al, Phys. Rep. 78, 174 (1981).
- [32] C. T. Black et al, Phys. Rev. Lett. 76, 688 (1996).
- [33] H. Rotzinger et al, Supercond. Sci. Technol. 30, 025002 (2017).
- [34] I. S. Beloborodov et al, Rev. Mod. Phys. 79, 469 (2007).
- [35] V. J. Emery and S. A. Kivelson, Nature (London) 374, 434 (1995).
- [36] A. I. Larkin and Yu. N. Ovchinnikov, Phys. Rev. B 28, 6281 (1983).
- [37] N. Maleeva et al, Nat. Commun. 9, 3889 (2018).
- [38] T. Mishonov and A. Groshev, Phys. Rev. Lett. 64, 2199 (1990).
- [39] B. Mirhashem and R. Ferrell, Physica C 161, 354 (1989).
- [40] O. Buisson, P. Xavier, and J. Richard, Phys. Rev. Lett. 73, 3153 (1994). Erratum Phys. Rev. Lett. 74, 1493 (1995).