pnasresearcharticle \leadauthorGröhl \correspondingauthorCorrespondence: j.groehl@dkfz-heidelberg.de
Estimation of blood oxygenation with learned spectral decoloring for quantitative photoacoustic imaging (LSD-qPAI)
Abstract
One of the main applications of photoacoustic (PA) imaging is the recovery of functional tissue properties, such as blood oxygenation (sO2). This is typically achieved by linear spectral unmixing of relevant chromophores from multispectral photoacoustic images. Despite the progress that has been made towards quantitative PA imaging (qPAI), most sO2 estimation methods yield poor results in realistic settings. In this work, we tackle the challenge by employing learned spectral decoloring for quantitative photoacoustic imaging (LSD-qPAI) to obtain quantitative estimates for blood oxygenation. LSD-qPAI computes sO2 directly from pixel-wise initial pressure spectra , which are vectors comprised of the initial pressure at the same spatial location over all recorded wavelengths. Initial results suggest that LSD-qPAI is able to obtain accurate sO2 estimates directly from multispectral photoacoustic measurements in silico and plausible estimates in vivo.
keywords:
Deep learning, multispectral imaging, photoacoustics1 Introduction
Photoacoustic (PA) imaging is a medical imaging modality that offers an optical signal contrast up to several centimeters deep inside tissue. In the last two decades, a lot of progress has been made towards its translation into clinical routine. However, the accurate and robust quantification of optical tissue properties or derived functional tissue properties still remains a major challenge (1, 2). In order to obtain functional tissue properties such as blood oxygen saturation (sO2), spectral unmixing algorithms are used to decompose a multispectral signal and to determine the quantity of specific chromophores that contributed to the signal spectrum over the wavelengths. For this process, the core assumption is that the acquired PA signal image - which is ideally an approximate reconstruction from the initial pressure distribution - is proportional to the optical absorption coefficient () (3). However, this assumption does not always hold because is mainly proportional to the product of optical absorption and the light fluence (). Hence, the fluence has an influence on the recorded spectra and potentially leads to large errors in sO2 quantification.
To overcome this issue, part of the research in the field of quantitative PA imaging (qPAI) aims at compensating for these fluence effects (cf. e.g. (4, 5, 6, 7)). For a long time, the field has focused on model-based approaches to extract quantitative information on optical tissue properties (8, 9) which typically suffer from long computation times. More recently, also machine learning-based approaches to qPAI have been published (10, 11, 12). These methods are often substantially faster than model-based algorithms but have not yet been demonstrated to work accurately and robustly in realistic in vitro settings or in vivo. Due to the lack of fast and accurate fluence compensation algorithms, most researchers and applications default to the simple linear unmixing algorithms in order to provide qualitative rather than quantitative values for relevant functional tissue parameters.
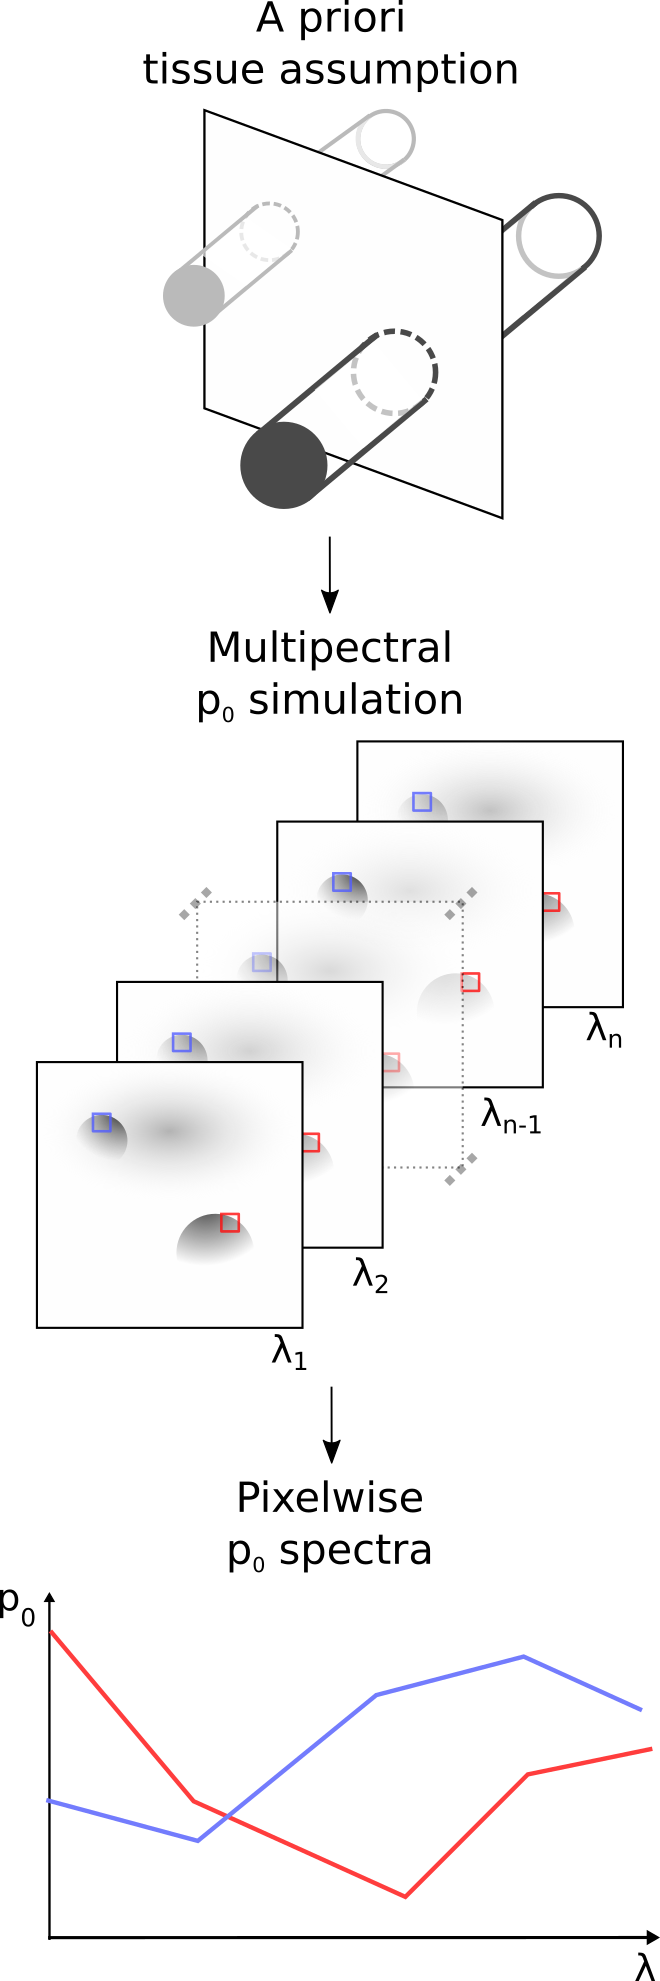
This work tackles quantification of the functional tissue property sO2 by introducing learned spectral decoloring for quantitative photoacoustic imaging (LSD-qPAI). LSD-qPAI is based on the assumption that there is a substantial benefit in considering fluence effects when quantifying sO2 (7, 13, 14), compared to spectrally unmixing hemoglobin (Hb) and oxyhemoglobin (HbO2) with commonly used linear methods (3) that neglect the aforementioned fluence effects. Previous deep learning approaches to qPAI try to estimate optical absorption from PA measurements and then derive functional tissue properties from these estimations, potentially leading to error propagation (10). In contrast to this, we propose to directly estimate the functional tissue parameter sO2 from pixel-wise spectra , which is a vector of the initial pressure at the same spatial location over all recorded wavelengths. For this, we use multispectral in silico training data, as illustrated in Figure 1. This way, we force the machine learning algorithm to account for fluence effects in the spectra during sO2 estimation. According to initial results, our in vivo sO2 estimates are physiologically more plausible when compared to linear spectral unmixing techniques.
2 Materials and Methods
2.1 Concept overview
With LSD-qPAI we approximate a function to estimate sO2 from initial pressure spectra (). It is a data-driven method in which a neural network learns to compensate for different extents of spectral coloring within a given spectrum, where the term spectral coloring refers to changes in the spectrum at a given spatial location due to wavelength-dependent absorption in the surrounding tissue (15). To account for the lack of real data comprising reliable reference or even ground truth values given recordings, we create a dataset of pixel-wise spectra with various degrees of spectral coloring obtained from Monte Carlo simulated in silico multispectral images (cf. Figure 1). The variety of possibilities for spectral coloring is simulated by extracting spectra from different spatial locations within the image (e.g. shallow or deep background structures and superficial of deep vascular structures). With the generation of a representative dataset, the network learns to account for spectral coloring when inferring from input spectra.
 |
During training, the algorithm is presented tuples , with and sO. Here, each spectrum is normalized such that . When estimating oxygenation for recorded in vivo spectra these are normalized as well - sacrificing amplitude information to eliminate the need to calibrate the in silico training data to the target domain.
2.2 Prototype implementation
In the following paragraphs, we provide detailed descriptions of the prototype implementation of our approach, namely the simulation pipeline, the used deep learning model, and a linear spectral unmixing method.
Simulation pipeline
We create simple homogeneous tissue volumes comprising tubular vessel structures that run orthogonal to the imaging plane. We simulated the light transport in this medium with a Monte Carlo method and simulated each of the in silico vessel phantoms with 26 wavelengths equidistant from 700 nm to 950 nm in 10 nm steps. For the Monte Carlo simulation, we used a multithreaded adaptation of the Monte Carlo framework mcxyz (16) with photons for each simulation on a 0.6 mm grid.
Deep learning model
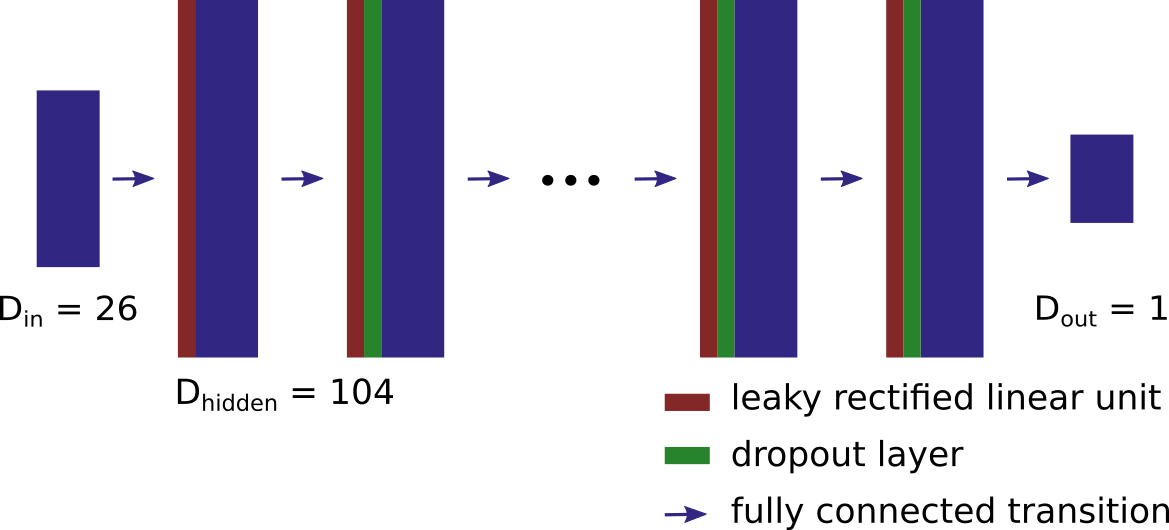
For reconstruction of sO2 from , we use a simple fully connected neural network architecture (cf. Figure 2). We implement the network with eight hidden layers with four times the size of the input layer using pytorch (17) and perform the experiments with the trixi framework (18). We use an 1 loss function, a learning rate of 10-4, a batch size of 2000, with 1000 batches per epoch, and train the network for 25 epochs. The size of the input layers corresponds to the number of simulated or measured wavelengths (26 in this study) and we have a one dimensional output layer, which corresponds to the sO2 estimation as the target parameter.
 |
Linear spectral unmixing
We use a linear spectral unmixing algorithm as a reference for the in vivo imaging results. Specifically, we use the C++ Eigen (19) implementation of the QR householding matrix decomposition to unmix the recorded spectra for Hb and HbO2 and calculate sO2 from the ratio of these.
3 Experiments and Results
In the following section we outline the experiments we conducted for validation of the presented approach. The purpose of our experiments was two-fold: we first show the feasibility of our method with an in silico evaluation on a held-out set from the same distribution as the training data. Secondly, we conduct feasibility tests on two different in vivo datasets, of which the first contains PA images of an open porcine brain and the second dataset comprises PA images of the human forearm. These datasets are chosen because the compositions of relevant chromophores in tissue are very different in both cases. For both of these in vivo settings we also compute sO2 with a linear spectral unmixing algorithm to provide a reference.
Simulation parameters
The key to the general applicability of the LSD-qPAI method is the simulation of a representative dataset of spectra. For this initial study, we created a total of 971 in silico phantoms containing 2 - 10 tubular vessel-mimicking structures in a homogeneous background at random locations orthogonal to the imaging plane. For tissue mimicking a priori conditions, we assumed blood vessels to have a hemoglobin concentration of 150 g/dl (20), generic background tissue to have a blood volume fraction of 2%, and also consider an average of 5% fat and 80% water in this background tissue. The tubular vessel structures have a radius randomly drawn from a uniform distribution between 0.5 mm and 4 mm. Each vessel phantom was assigned a distinct constant blood oxygenation in vessel structures and the same constant blood oxygenation in the background. The tissue absorption coefficient was calculated for each voxel based on these assumptions and we set the reduced scattering coefficient to be constant over all wavelengths with 15 cm-1.
In silico validation
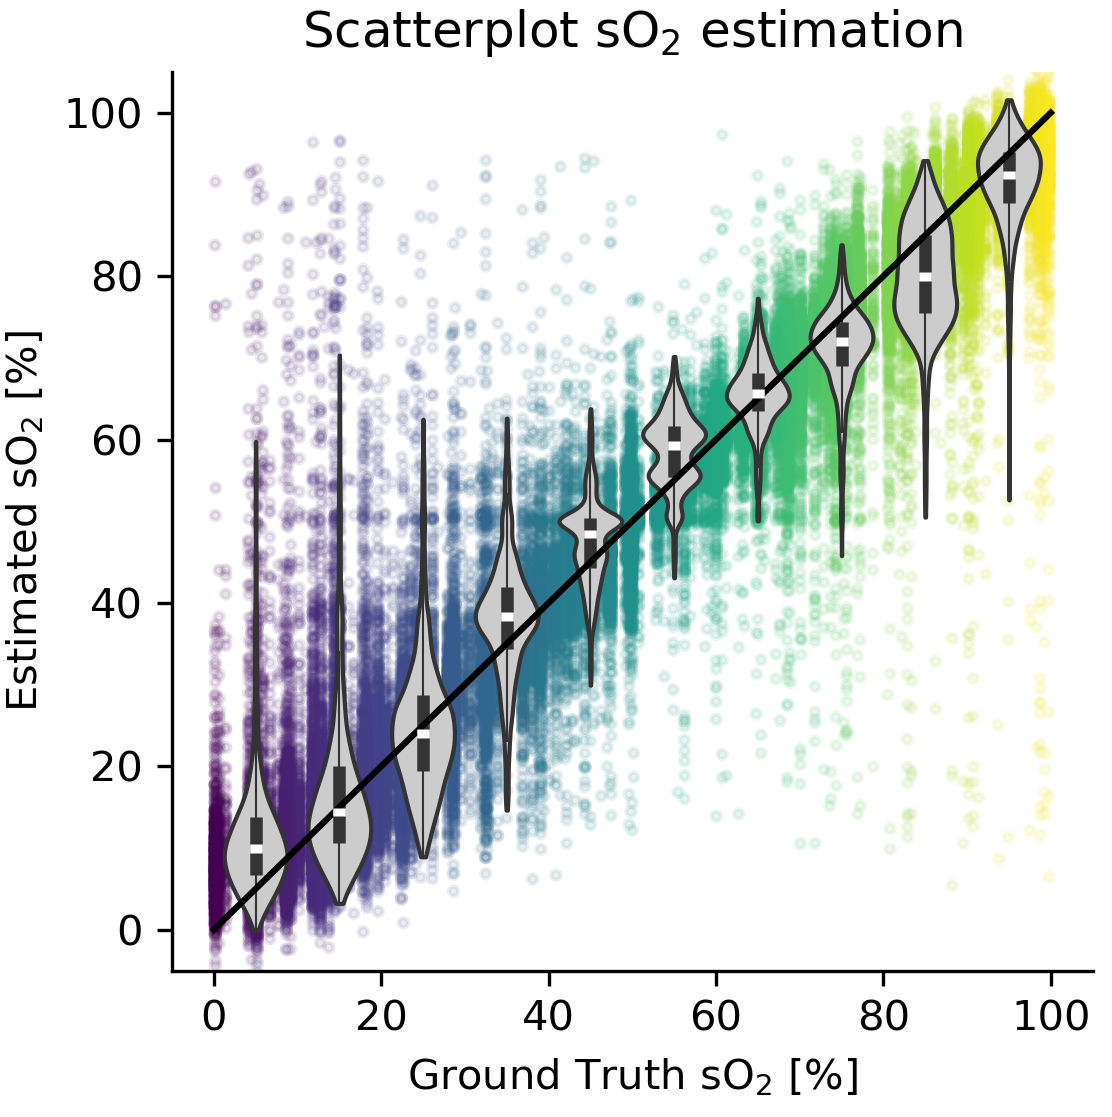
We use 80% of the in silico dataset for training, 10% for supervision of the training process and hyperparameter optimization, and the remaining 10% as a test set to report the in silico results. We report the relative sO2 estimation error e, where represents the estimated blood oxygen saturation and represents the ground truth simulated blood oxygenation. All in silico estimation results for the test data are shown in Figure 3. Additionally, violin plots present the error distribution within each interval of ten percentage points (0 – 10%, 10 – 20%, etc). The median relative estimation error e was 6.1% with an interquartile range of (2.4%, 18.7%).
 |
Imaging of porcine brain
As our first in vivo experiment, we applied our method to images of a porcine brain during open surgery. These images were recorded at the same wavelengths as in the training dataset. We evaluate a single series of images which were normalized by the recorded laser energy and reconstructed with the delay-and-sum algorithm using a hamming window. For the calculation of the mean oxygenation within the ROI, only those point estimates were taken into consideration, where the signal at the isosbestic point of 800 nm was greater than a noise equivalent level.
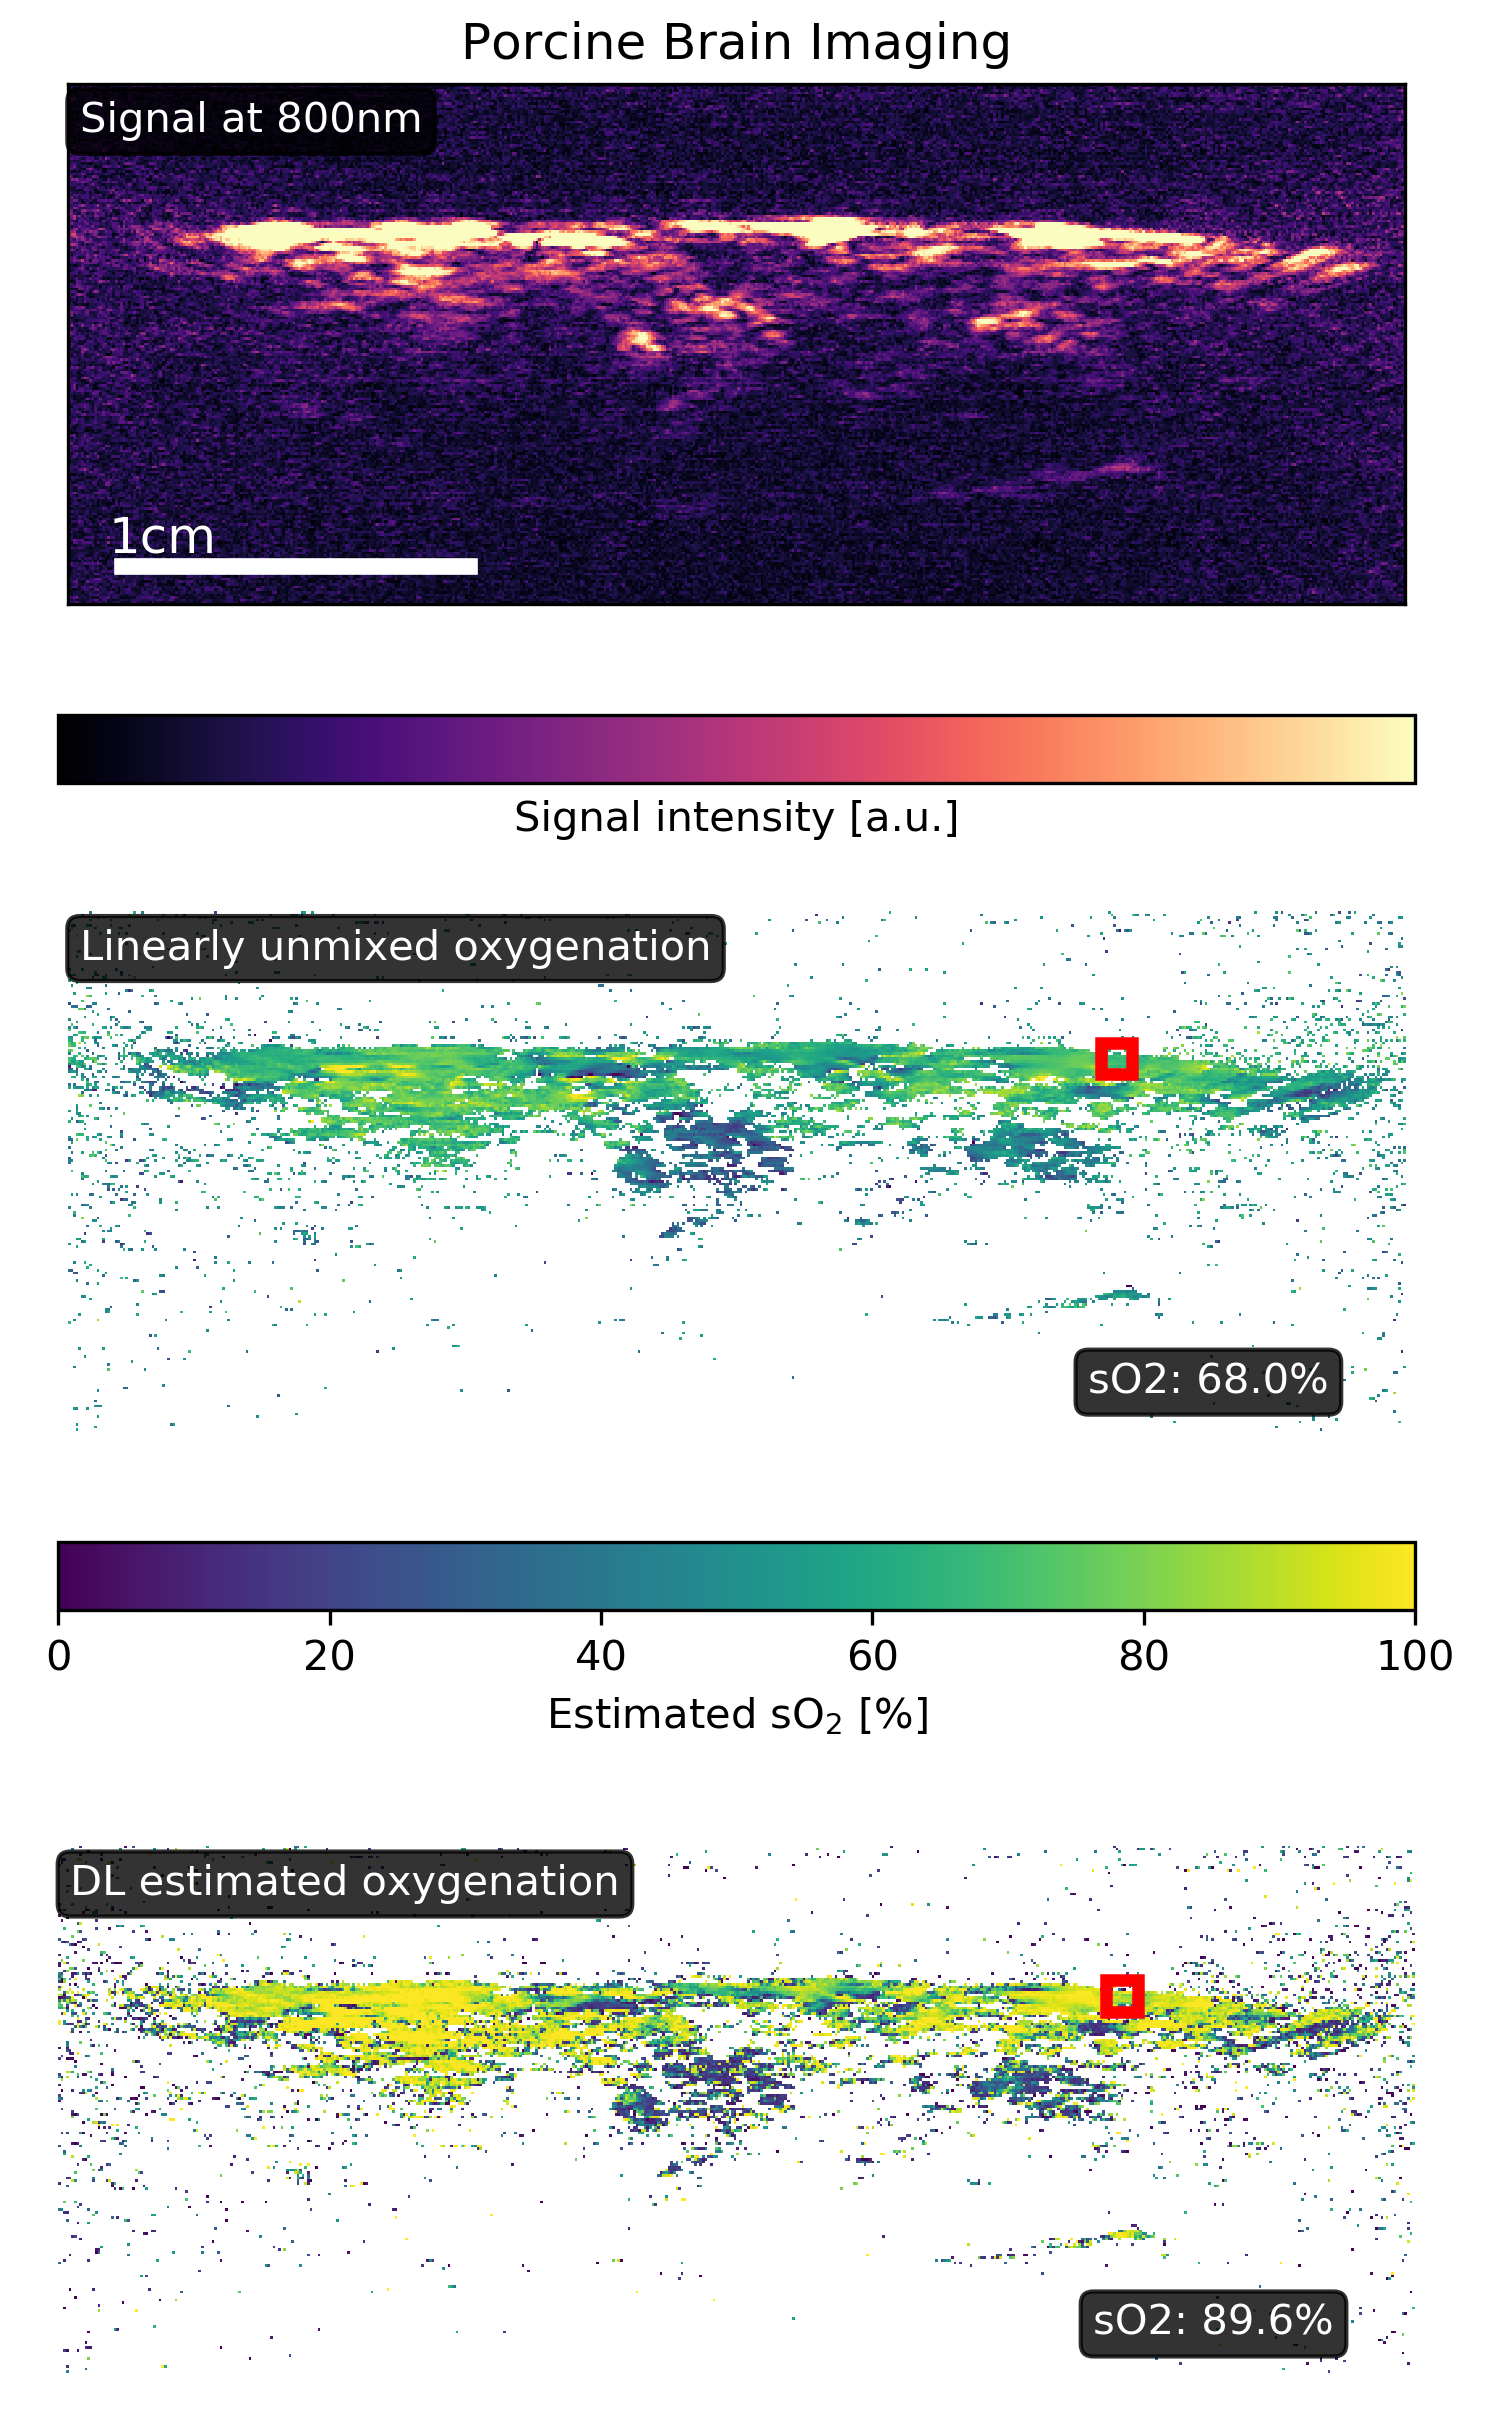 |
In the image, the red bounding box marks an area where blood with a high oxygenation was present (cf. Figure 4). Our method estimated a blood oxygenation of about 90% , whereas linear spectral unmixing using a QR decomposition yielded an estimate of 68% in the same area.
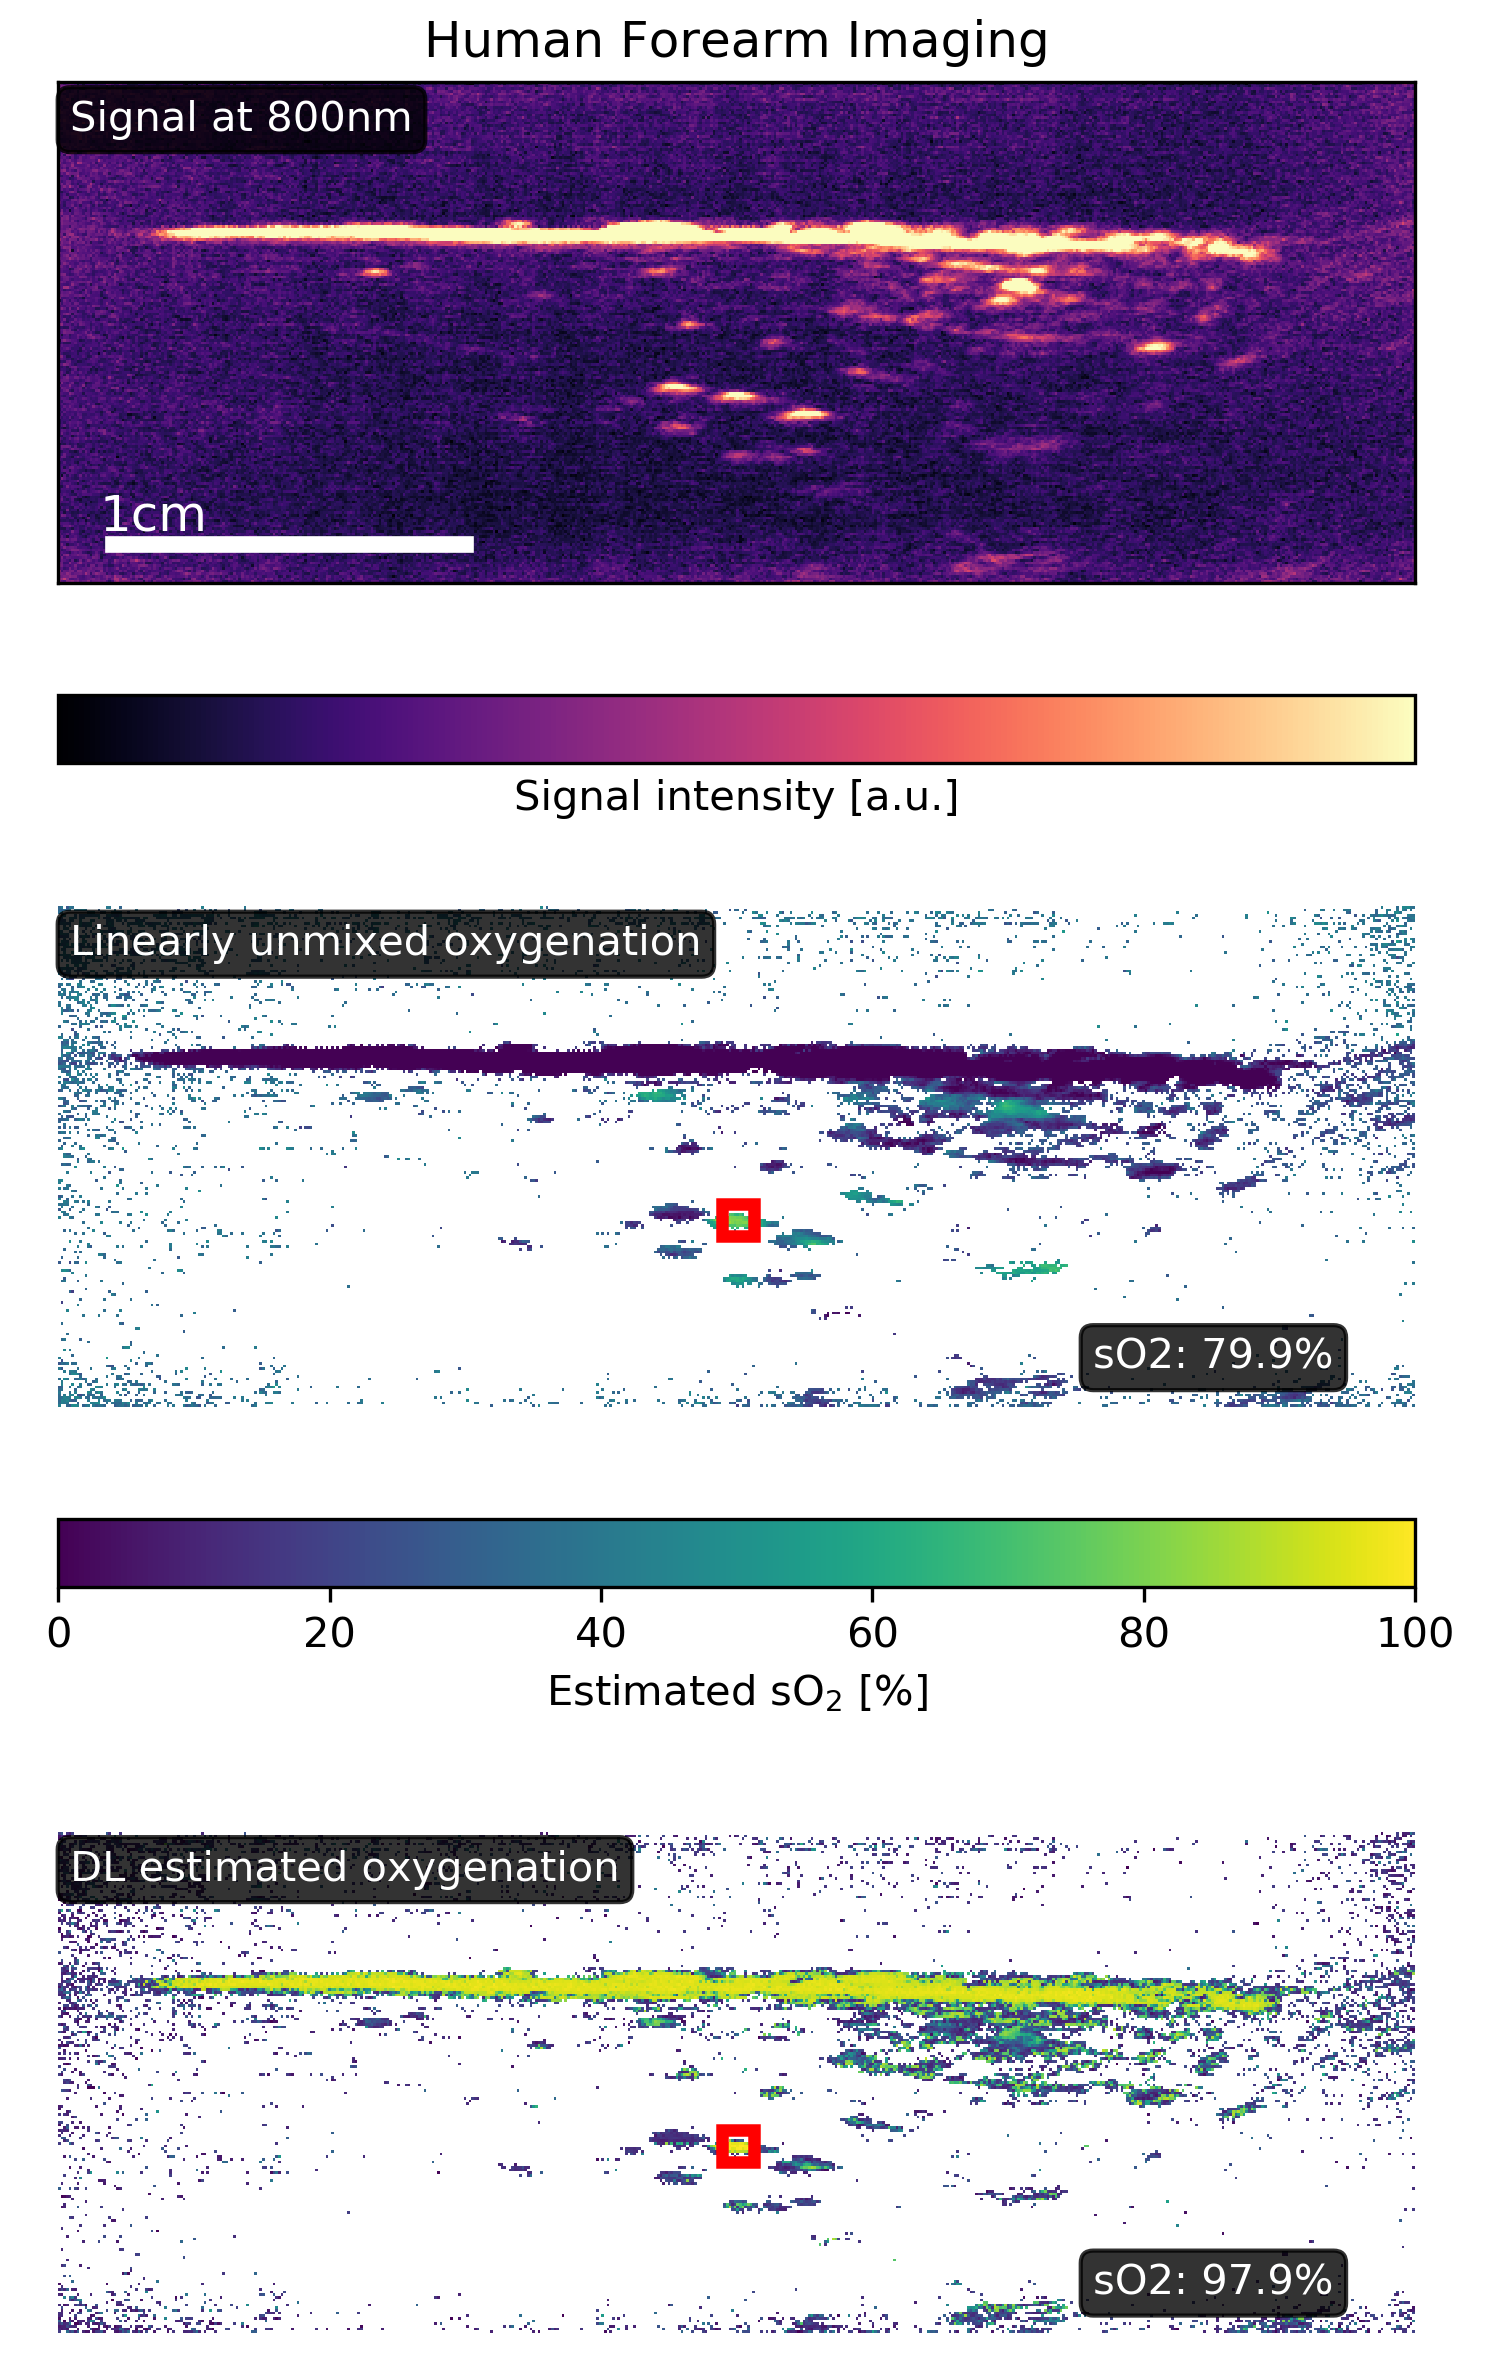
Imaging of human forearm
We also applied our method to in vivo images of a the forearm of a healthy human volunteer also with the same 26 wavelengths as used in the simulations. This imaging scenario was specifically chosen as an out-of-distribution test for the method. This is, because no well matching spectra should be contained in our training set, as we did not consider the presence of melanin in our simulation. We normalized each image by the laser energy and reconstructed the images with the delay-and-sum algorithm using a hamming window. To decrease the inter frame variability, we averaged over 10 consecutive frames of the same wavelength. Prior to averaging we registered the images with an optical flow-based method to account for motion artifacts (21).
In the oxygenation images shown in Figure 5, the upper signal originating from the radial artery is chosen as the region of interest (ROI) and marked by a red bounding box. In this ROI, only those point estimates were taken into consideration for the averaged sO2 result, where the signal at 800 nm was greater than a noise equivalent level. The arterial blood oxygenation as determined by our algorithm was about 98%, whereas spectral unmixing using a QR linear unmixing algorithm yielded a value of about 80%.
 |
4 Discussion and Conclusion
In this work, we investigate the feasibility of inferring sO2 from pixel-wise initial pressure spectra using a deep learning model trained on simulated data. While a photoacoustic signal is proportional to the product of optical absorption and the light fluence , standard unmixing algorithms ignore the dependence on , which can potentially result in large errors, especially deep in tissue. To overcome this issue, we propose the LSD-qPAI algorithm that learns a mapping function from pixel-wise multispectral initial pressure data to blood oxygenation. Our initial in silico results look promising, yielding a median sO2 estimation error of 6% in silico. The LSD-qPAI method is potentially relevant especially for clinical imaging with hand-held PA scanners, as sO2 estimations with high accuracy and robustness can potentially be computed in real time. This has been demonstrated in similar diffuse reflectance multispectral imaging applications (22).
In prior work, we achieved a comparable accuracy in silico when estimating the optical absorption coefficient (10, 12). However, in contrast to these methods, we now are also able to obtain plausible results in vivo when imaging an open pig brain. Here, the estimations of our method are closer to the expected arterial blood oxygenation values of healthy subjects (near 100% (23)). Especially in comparison to the results of classical linear unmixing, LSD-qPAI seems to provide physiologically more plausible estimations.
Our method utilizes a normalization of the simulated and recorded spectra, sacrificing amplitude information to eliminate the need to calibrate the in silico training data to the target domain. However, this also means that we discard one dimension of the feature vector, restricting the minimum amount of spectra needed to be able to reliably infer optical properties.
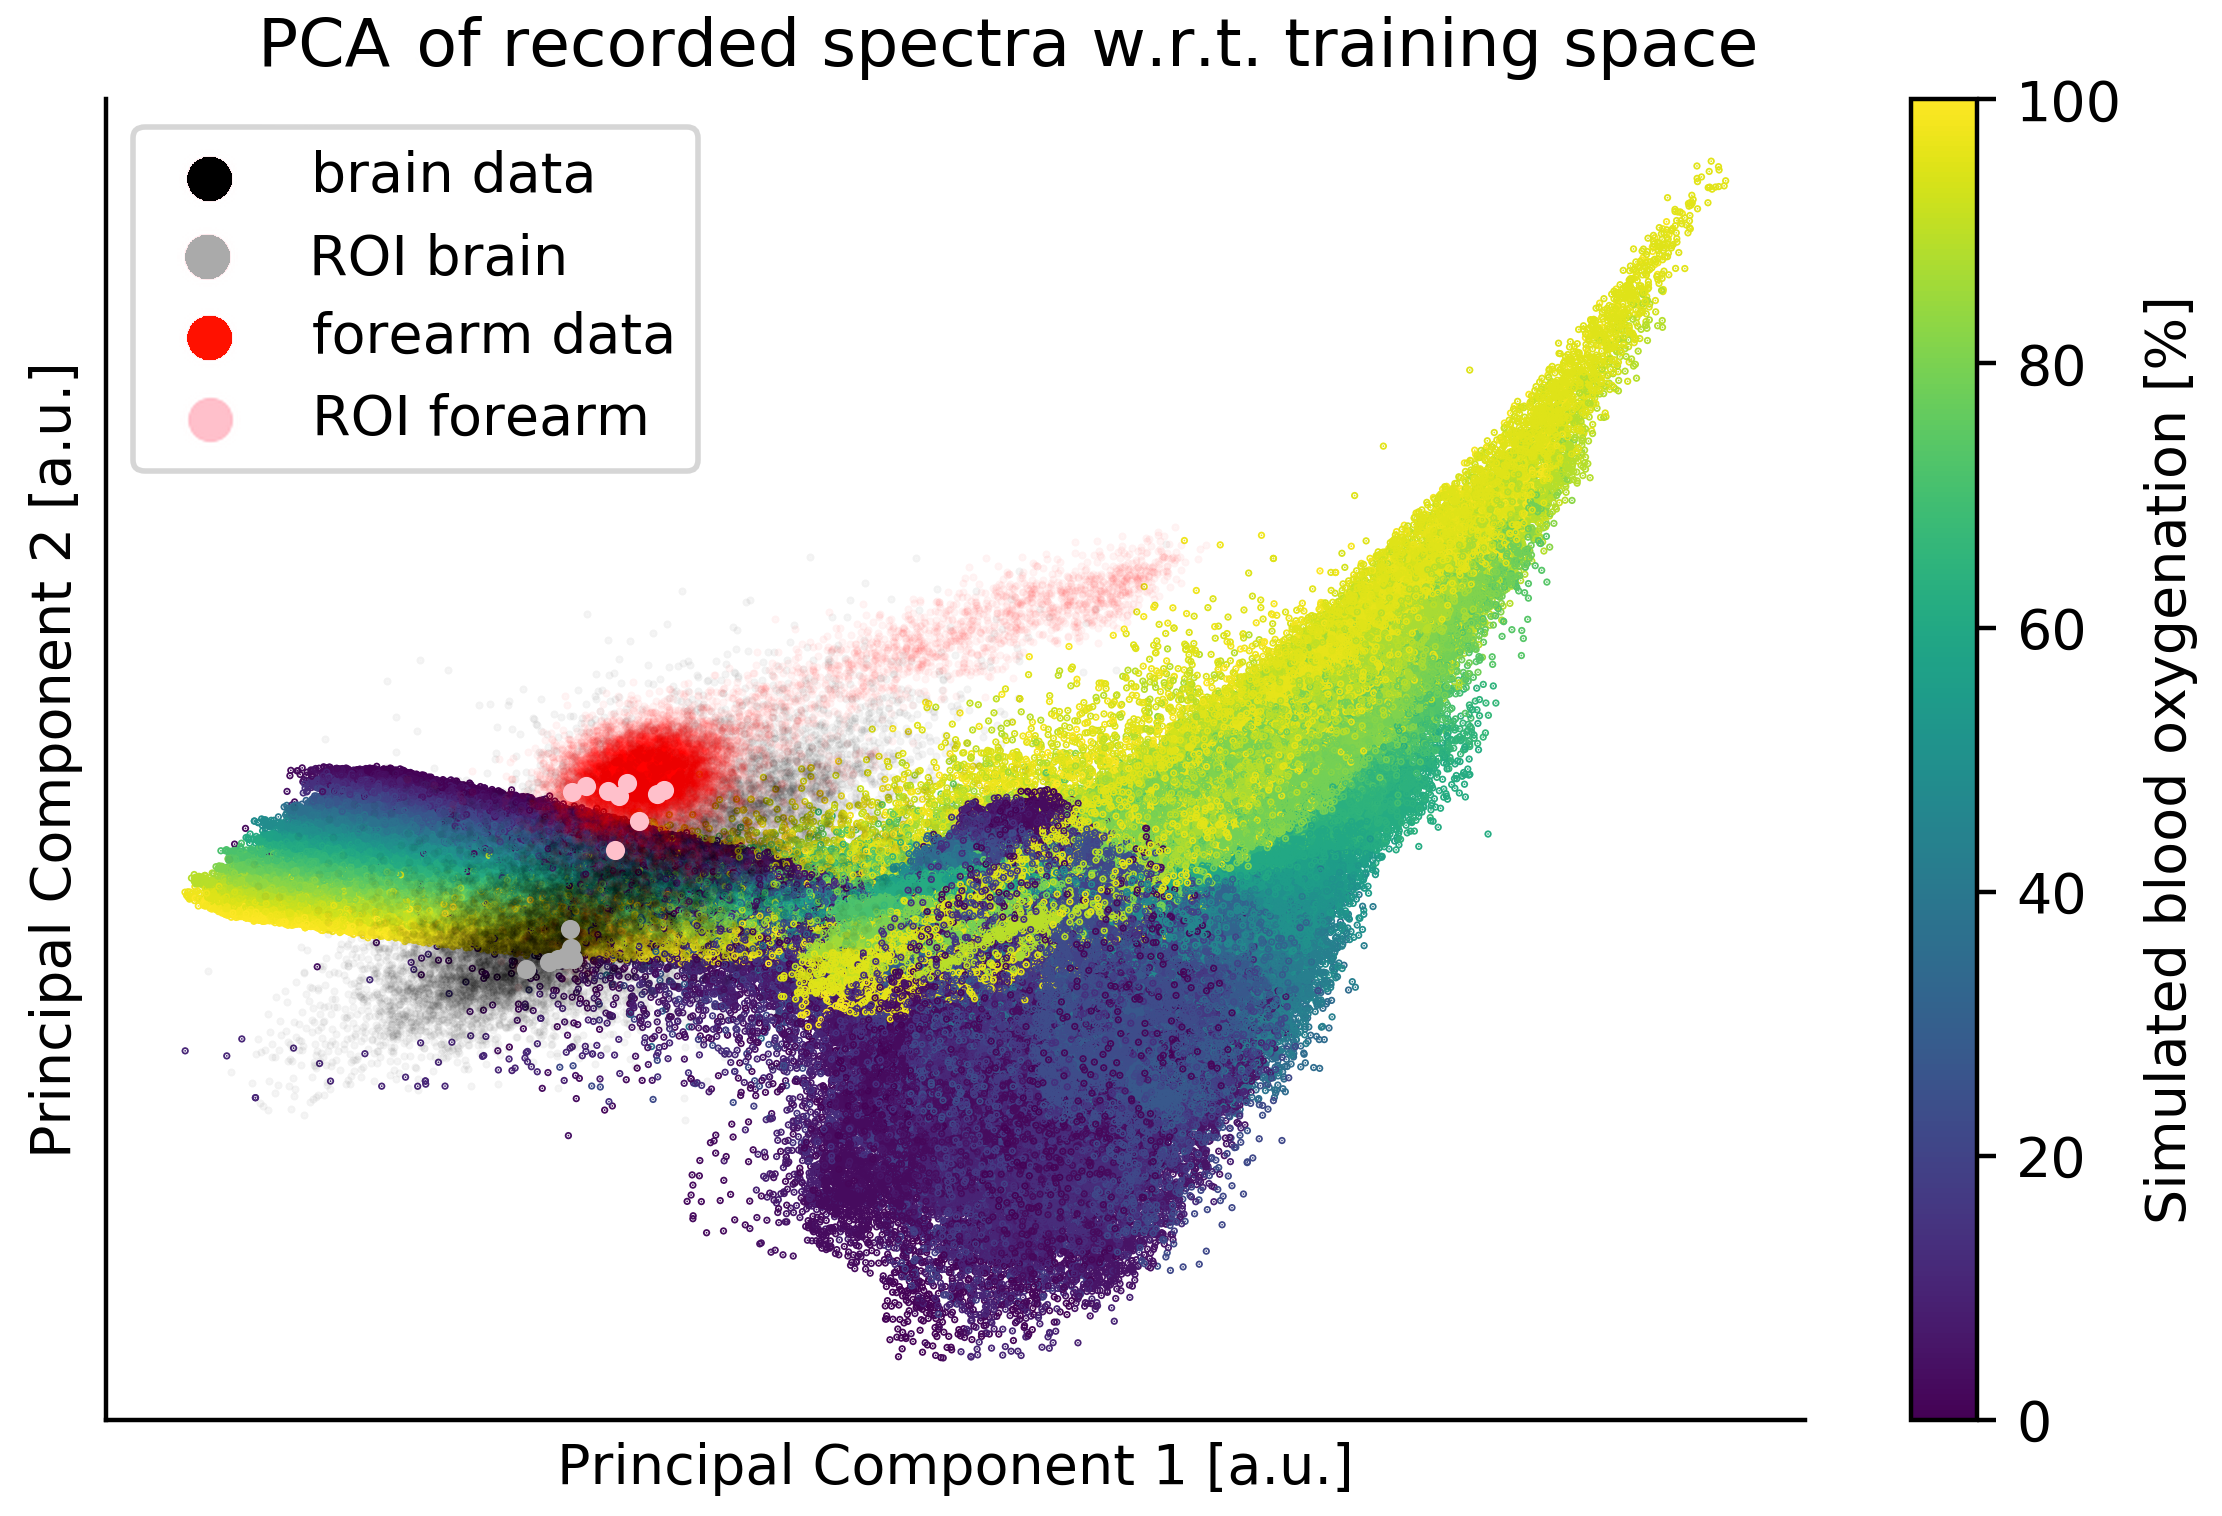
For the in vivo experiments it was to be expected that the recorded in vivo spectra of the brain images match our training distribution more closely compared to the forearm images. This is because light needs to penetrate through the skin in order to obtain images of the forearm, which contains melanin, a chromophore that was not included in the simulation framework. It can be seen that neither the proposed method nor linear unmixing can handle skin tissue well, estimating implausible and even impossible sO2 results. Projecting the in vivo spectra to the first two principal components of the training data seems to confirm this hypothesis (cf. Fig. 6). In the figure it is apparent that most of the porcine spectra (colored in black) are contained within the support of the first two principal components of our simulation space, whereas this does not appear to be the case for the forearm spectra. In this context it should be noted that the first two principal components (computed on the training data) account for 95.4% of the variation in our dataset. The projection image illustrates that the distribution of the training data match the distribution of the test (in vivo) data more closely when imaging pig brain instead of human forearm.
 |
When considering the large number of plausible tissue geometry and oxygenation configurations, the number of training samples used for this study was low. Also, no noise model was applied to the simulated spectra in addition to the simulation noise inherent to the Monte Carlo procedure. Hence, a thorough investigation of the influence of a realistic noise model on the spectra would be very interesting. Our a priori assumptions for the tissue parameters used in the simulation pipeline led to very difficult situations for the unmixing algorithm to resolve. For example, due to the 2 % blood volume fraction in the background, light fluence was the dominating factor even in shallow point absorbers - a behavior not usually observed in realistic scenarios, where less than 1% would be a more realistic assumption (20). Also, the simulation assumption that blood oxygenation is constant throughout the tissue is not generally correct and more realistic variations on these assumptions should be considered in future work.
Overall, the presented initial results in vivo are very promising. However, a thorough and well-designed in vivo validation needs to be performed to deduce meaningful conclusions regarding the general applicability of the presented method. Such future studies should cover a much broader range of possible sO2 values and include more realistic scenarios when assessing the unmixing accuracy. Future work should also include a comprehensive comparison of this method to state-of-the-art methods, such as eigenspectra multispectral optoacoustic tomography (eMSOT) (13), the end-to-end qPAI method presented by Cai et al. (11), as well as other linear and nonlinear spectral unmixing techniques (24, 3).
Acknowledgements
This project has received funding from the European Union’s Horizon 2020 research and innovation programme through the ERC starting grant COMBIOSCOPY under grant agreement No. ERC-2015-StG-37960. The authors would like to thank E. Santos, M. Herrera, and A. Hernández-Aguilera for provisioning of PA brain data, K. Dreher, N. Holzwarth, A. Klein, and S. Onogur for proof-reading the manuscript and the ITCF of the DKFZ for enabling extensive use of their computing cluster for data simulation.
Author Contributions
Conceptualization, J.G., T.K., T.A., and L.M.-H.; Data curation, J.G. and T.K.; Formal analysis, J.G.; Funding acquisition, L.M.-H.; Investigation, T.K., T.A., and J.G.; Methodology, J.G. and T.K.; Project administration, L.M.-H.; Software, J.G.; Supervision, L.M.-H.; Validation, J.G. and T.K.; Visualization, J.G.; Method naming, T.K.; Writing—original draft, J.G.; and Writing—review and editing, J.G., T.K., T.A. and L.M.-H.
Bibliography
References
- (1) Cox, B., Laufer, J., and Beard, P., “The challenges for quantitative photoacoustic imaging,” in [Photons Plus Ultrasound: Imaging and Sensing 2009 ], 7177, 717713, International Society for Optics and Photonics (2009).
- (2) Wang, L. V. and Hu, S., “Photoacoustic tomography: in vivo imaging from organelles to organs,” science 335(6075), 1458–1462 (2012).
- (3) Li, M., Tang, Y., and Yao, J., “Photoacoustic tomography of blood oxygenation: A mini review,” Photoacoustics (2018).
- (4) Maslov, K., Zhang, H. F., and Wang, L. V., “Effects of wavelength-dependent fluence attenuation on the noninvasive photoacoustic imaging of hemoglobin oxygen saturation in subcutaneous vasculature in vivo,” Inverse Problems 23(6), S113 (2007).
- (5) Bu, S., Liu, Z., Shiina, T., Kondo, K., Yamakawa, M., Fukutani, K., Someda, Y., and Asao, Y., “Model-based reconstruction integrated with fluence compensation for photoacoustic tomography,” IEEE Transactions on Biomedical Engineering 59(5), 1354–1363 (2012).
- (6) Zhao, L., Yang, M., Jiang, Y., and Li, C., “Optical fluence compensation for handheld photoacoustic probe: An in vivo human study case,” Journal of Innovative Optical Health Sciences 10(04), 1740002 (2017).
- (7) Vogt, W. C., Zhou, X., Andriani, R., Wear, K. A., Pfefer, T. J., and Garra, B. S., “Photoacoustic oximetry imaging performance evaluation using dynamic blood flow phantoms with tunable oxygen saturation,” Biomedical Optics Express 10(2), 449–464 (2019).
- (8) Cox, B. T., Arridge, S. R., Köstli, K. P., and Beard, P. C., “Two-dimensional quantitative photoacoustic image reconstruction of absorption distributions in scattering media by use of a simple iterative method,” Applied Optics 45(8), 1866–1875 (2006).
- (9) Laufer, J., Delpy, D., Elwell, C., and Beard, P., “Quantitative spatially resolved measurement of tissue chromophore concentrations using photoacoustic spectroscopy: application to the measurement of blood oxygenation and haemoglobin concentration,” Physics in Medicine & Biology 52(1), 141 (2006).
- (10) Kirchner, T., Gröhl, J., and Maier-Hein, L., “Context encoding enables machine learning-based quantitative photoacoustics,” Journal of biomedical optics 23(5), 056008 (2018).
- (11) Cai, C., Deng, K., Ma, C., and Luo, J., “End-to-end deep neural network for optical inversion in quantitative photoacoustic imaging,” Optics letters 43(12), 2752–2755 (2018).
- (12) Gröhl, J., Kirchner, T., Adler, T., and Maier-Hein, L., “Confidence estimation for machine learning-based quantitative photoacoustics,” Journal of Imaging 4(12), 147 (2018).
- (13) Tzoumas, S., Nunes, A., Olefir, I., Stangl, S., Symvoulidis, P., Glasl, S., Bayer, C., Multhoff, G., and Ntziachristos, V., “Eigenspectra optoacoustic tomography achieves quantitative blood oxygenation imaging deep in tissues,” Nature communications 7, ncomms12121 (2016).
- (14) Brochu, F. M., Brunker, J., Joseph, J., Tomaszewski, M. R., Morscher, S., and Bohndiek, S. E., “Towards quantitative evaluation of tissue absorption coefficients using light fluence correction in optoacoustic tomography,” IEEE transactions on medical imaging 36(1), 322–331 (2017).
- (15) Tzoumas, S., Deliolanis, N., Morscher, S., and Ntziachristos, V., “Unmixing molecular agents from absorbing tissue in multispectral optoacoustic tomography,” IEEE transactions on medical imaging 33(1), 48–60 (2014).
- (16) Jacques, S. L., “Coupling 3d monte carlo light transport in optically heterogeneous tissues to photoacoustic signal generation,” Photoacoustics 2(4), 137–142 (2014).
- (17) Paszke, A., Gross, S., Chintala, S., Chanan, G., Yang, E., DeVito, Z., Lin, Z., Desmaison, A., Antiga, L., and Lerer, A., “Automatic differentiation in pytorch,” (2017).
- (18) Zimmerer, D., Petersen, J., Koehler, G., Wasserthal, J., Adler, T., and Wirkert, A., “MIC-DKFZ/trixi,” (2018).
- (19) Guennebaud, G., Jacob, B., et al., “Eigen v3.” http://eigen.tuxfamily.org (2010).
- (20) Jacques, S. L., “Optical properties of biological tissues: a review,” Physics in Medicine & Biology 58(11), R37 (2013).
- (21) Kirchner, T., Gröhl, J., Sattler, F., Bischoff, M. S., Laha, A., Nolden, M., and Maier-Hein, L., “An open-source software platform for translational photoacoustic research and its application to motion-corrected blood oxygenation estimation,” arXiv preprint arXiv:1901.09781 (2019).
- (22) Wirkert, S. J., Kenngott, H., Mayer, B., Mietkowski, P., Wagner, M., Sauer, P., Clancy, N. T., Elson, D. S., and Maier-Hein, L., “Robust near real-time estimation of physiological parameters from megapixel multispectral images with inverse monte carlo and random forest regression,” International journal of computer assisted radiology and surgery 11(6), 909–917 (2016).
- (23) Zander, R., “The oxygen status of arterial human blood,” Scandinavian Journal of Clinical and Laboratory Investigation 50(sup203), 187–196 (1990).
- (24) Keshava, N. and Mustard, J. F., “Spectral unmixing,” IEEE signal processing magazine 19(1), 44–57 (2002).