Hydrodynamics and rheology of a vesicle doublet suspension
Abstract
The dynamics of an adhesive two-dimensional vesicle doublet under various flow conditions is investigated numerically using a high-order, adaptive-in-time boundary integral method. In a quiescent flow, two nearby vesicles move slowly towards each other under the adhesive potential, pushing out fluid between them to form a vesicle doublet at equilibrium. A lubrication analysis on such draining of a thin film gives the dependencies of draining time on adhesion strength and separation distance that are in good agreement with numerical results. In a planar extensional flow we find a stable vesicle doublet forms only when two vesicles collide head-on around the stagnation point. In a microfluid trap where the stagnation of an extensional flow is dynamically placed in the middle of a vesicle doublet through an active control loop, novel dynamics of a vesicle doublet are observed. Numerical simulations show that there exists a critical extensional flow rate above which adhesive interaction is overcome by the diverging stream, thus providing a simple method to measure the adhesion strength between two vesicle membranes. In a planar shear flow, numerical simulations reveal that a vesicle doublet may form provided that the adhesion strength is sufficiently large at a given vesicle reduced area. Once a doublet is formed, its oscillatory dynamics is found to depend on the adhesion strength and their reduced area. Furthermore the effective shear viscosity of a dilute suspension of vesicle doublets is found to be a function of the reduced area. Results from these numerical studies and analysis shed light on the hydrodynamic and rheological consequences of adhesive interactions between vesicles in a viscous fluid.
pacs:
87.16.D-,83.80.Lz,83.60.-a,47.11.HjI Introduction
Vesicles (closed fluid-filled phospholipid bilayer membranes) have been widely utilized as biological cell mimics in biophysics and material engineering Sackmann (1996); Fenz and Sengupta (2012); Barthes-Biesel (2016). The ever expanding applications of vesicles have encouraged detailed experimental, theoretical, and numerical investigations of vesicle dynamics in applied flow, electric fields, and magnetic fields. Experimental investigations of vesicles have uncovered vesicle properties and various novel applications Dobereiner (2000); Evans et al. (2013); Sugiyama and Toyota (2018). Theoretical investigations are often limited to small-deformation analysis on a nearly spherical vesicle or spheroidal analysis on a spheroidal vesicle Barthes-Biesel and Rallison (1981); Misbah (2006); Vlahovska and Gracia (2007); Finken et al. (2008); Zhang et al. (2013); Nganguia and Young (2013). On the other hand, various numerical methods have been developed for simulating the transient hydrodynamics of vesicle suspensions Bagchi et al. (2005); Biben (2005); Veerapaneni et al. (2009); Seol et al. (2016).
Hydrodynamics of a single vesicle in Stokes flow has been extensively investigated. In a planar shear flow, the vesicle hydrodynamics is characterized by the reduced volume (reduced area in two dimensions), viscosity contrast between interior and exterior fluids, and shear rate of the imposed far-field fluid flow. In addition, a vesicle with a rigid particle inside is also investigated as a biological mimic of a eukaryotic cell with a nucleus that occupies nearly half of the intracellular volume Veerapaneni et al. (2011). Small-deformation analysis shows that a vesicle tank-treads in a planar shear flow for low viscosity contrast and shear rate. At high viscosity contrast the tank-treading dynamics transitions to tumbling dynamics Misbah (2006); Vlahovska and Gracia (2007), and this leads to a transition in the effective shear viscosity of the vesicle suspension Misbah (2006); Vitkova et al. (2008) that is also validated by direct numerical simulations Ghigliotti et al. (2010) and experiments Vitkova et al. (2008); Deschamps et al. (2009); Kantsler et al. (2008a); Zabusky et al. (2011). Between tank-treading and tumbling vesicle dynamics, a breathing (tremble) mode is also observed Misbah (2006); Kantsler et al. (2008b); Zhao and Shaqfeh (2011); Spann et al. (2014) to alter the effective shear viscosity. In an extensional flow (planar or uniaxial), vesicle shape dynamics depends sensitively on the vesicle reduced volume and the elastic capillary number Kantsler et al. (2008b); Zhao and Shaqfeh (2013); Narsimhan et al. (2014); Dahl et al. (2016): Asymmetric shape and oscillatory undulation of the vesicle membrane are two examples of the complex vesicle hydrodynamics in an extensional flow.
Collective hydrodynamics of vesicles is dictated by the vesicle-vesicle interactions. In a quiescent flow, vesicle-vesicle adhesion leads to the formation of vesicle doublets Ziherl (2007); Ziherl and Svetina (2007) or clusters Svetina and Ziherl (2008); Gu et al. (2016); Flormann et al. (2017). As a model for red blood cell (RBC) aggregates, a simplified model for adhesive vesicle-vesicle interactions can reproduce vesicle shapes similar to those observed in experiments of fibrinogen-induced RBC aggregates Svetina and Ziherl (2008); Gu et al. (2016); Flormann et al. (2017); Hoore et al. (2018); Brust et al. (2014); Clavería et al. (2017). Using the Lennard-Jones (L.-J.) potential for point-point interaction between two vesicle membranes without the molecular details of adhesive interactions between RBCs, Flormann et al. Flormann et al. (2017) found that, under strong adhesion, the membrane may buckle to a sigmoidal shape in the contact region. Such a sigmoidal vesicle shape is also observed in RBC doublets and explained in a slightly different model Ziherl and Svetina (2007). It remains unknown how adhesive interactions between vesicles might lead to different vesicle hydrodynamics that results in different rheological properties of a vesicle suspension. Such studies will provide useful insight into the rheology of blood flow Chien et al. (1967) and how to use nano solutes to control the hypertension by adjusting the adhesive interactions between RBCs.
In numerical simulations of a vesicle suspension, the adhesive interaction between two vesicles is often ignored Veerapaneni et al. (2009); Rahimian et al. (2010) for numerical convenience, mostly because a small time step is often needed to resolve the dynamics of the lubrication thin film between two membranes with adhesion. However, adhesive interactions between RBCs lead to RBC clusters that are expected to alter the rheological properties of the RBC suspension Neu and Meiselman (2002); Svetina and Ziherl (2008). Hydrodynamic simulations of adhesive vesicles in a quiescent flow have revealed physical insights to the equilibrium shapes of RBC aggregates in both experiments Flormann et al. (2017) and theory Ziherl and Svetina (2007). The main goal of this work is to investigate the hydrodynamics of adhesive vesicles in flow conditions common in microfluidics such as a planar shear flow and an extensional flow.
The electrostatic nature of lipid molecules (a hydrophobic tail and a hydrophilic head with an electric dipole) complicates the interactions between a lipid bilayer membrane and another bilayer membrane Evans and Metcalfe (1984); Evans (1988); Israelachvili (1991); Perutkova et al. (2013) or a solid (such as a glass substrate or a nano particle). Adhesion between a vesicle and a solid has been extensively studied with more focus on the static equilibrium shapes Seifert and Lipowsky (1990); Bernard et al. (2000); Shi et al. (2006); Lin and Freund (2007); Gruhn et al. (2007); Das and Du (2008); Keh et al. (2014); Zhang et al. (2009); Agudo-Canalejo and Lipowsky (2015a, b); Steinkuhler et al. (2016); Keh and Leal (2016); Agudo-Canalejo and Lipowsky (2017) than the transient adhesion process Cantat and Misbah (1999); Sukumaran and Seifert (2001); Blount et al. (2013). Adhesive interactions between lipid membranes are essential in many biomedical, biological, and biophysical processes. For example, vesicle adhesion is crucial to initiate membrane fusion and fission in endocytosis, exocytosis, and the transport of small vesicles through membrane surfaces. In the absence of an external electric field and ions in the solvents, it is reported that the adhesive interactions between two membranes can be well approximated by the L.-J.-type potential Flormann et al. (2017), that consists of a long-range attraction component (truncated at some finite distance beyond which membrane interaction becomes negligible) and a short-range repulsion component Israelachvili (1991), and the combination of the two gives rise to an equilibrium distance where the interaction potential is at its minimum Israelachvili (1991).
The strength of membrane-membrane adhesion can be estimated through the membrane contact angle at the edge of contact zone Ramachandran et al. (2010); Mares et al. (2012). Alternatively, researchers have used the micropipette to measure the adhesive force between two vesicles bound by strong adhesion Evans and Metcalfe (1984); Frostad et al. (2014): Evans and Metcalfe Evans and Metcalfe (1984) were able to measure the reduction in the free energy per unit area of membrane-membrane contact formation due to the van der Waals’ attraction. For the adhesive interaction between two lipid bilayer membranes in buffer solutions, a typical range for the energy density is between to , similar to the adhesion energy density of between two RBCs Flormann et al. (2017). Frostad et al. Frostad et al. (2014) investigated the depletion-attraction induced adhesion between two vesicles, and identified the dynamic role of membrane tension during membrane adhesion/peeling.
For adhesion interaction between a vesicle and a substrate Gruhn et al. (2007), the boundary between weak and strong adhesion is around : the vesicle-substrate interaction is “strong” when the adhesion energy density is larger than and “weak” when the energy density is less than . The ratio of total adhesion energy to the bending energy (bending modulus of lipid bilayer membranes ) gives a measure of the vesicle deformation in the presence of adhesion Ramachandran et al. (2010).
In this work we focus on regimes where such ratio is of order one, between the weak adhesion (adhesion energy/bending energy ) and strong adhesion (adhesion energy/bending energy ) regimes. In this regime the membrane deformation may increase the “contact area” between two vesicles and enhance the adhesion effects. The equilibration of vesicle membranes in the strong adhesion regime has been well-studied and documented (see Agrawal (2011); Ramachandran et al. (2010); Steinkuhler et al. (2016); Flormann et al. (2017) and references therein). However it is unclear how the adhesion couples to the vesicle hydrodynamics in this regime. This paper aims to address this question with quantitative characterization in terms of physical parameters.
In a quiescent environment, sub-micron size vesicles are found to form a doublet due to their van der Waals’ attractive interactions Ramachandran et al. (2010). Due to the strong van der Waals’ adhesive force, the vesicles are far from spherical shape and the membrane is almost flat in the “contact” region. Gires et al. used small-deformation analysis to investigate the hydrodynamic interactions between two vesicles in a planar shear flow with a long separation distance Gires et al. (2012). They found that the vesicle interaction could be either attractive or repulsive depending on the organization of the two vesicles relative to the shear flow Gires et al. (2014). To the best of authors’ knowledge, the effects of close-range vesicle adhesion on their hydrodynamics under an external flow have not been studied and quantified. The goal of this work is to use state-of-the-art boundary integral simulations to numerically investigate the dynamics of two vesicles in both planar shear flow and extensional flow for a wide range of vesicle shapes and adhesive strength and distance.
Boundary integral equation (BIE) approaches are well-suited for solving the low Reynolds flow problems considered here as they lead to reduction in dimensionality and achieve high-order accuracy even for moving geometry problems. When the vesicles adhere, one major issue for BIE solvers is to resolve the vesicle-vesicle hydrodynamic forces which become nearly singular. We use an interpolation-based quadrature rule Quaife and Biros (2014) to maintain high-order accuracy for all vesicle-vesicle separation distances. To overcome the numerical stiffness induced by the membrane bending forces and to control the global error, we employ a second-order spectral deferred implicit-explicit adaptive time stepping scheme Quaife and Biros (2016).
This paper is organized as follows. In Section II we formulate our model for two-dimensional vesicle hydrodynamics with adhesive interactions between membranes of distinct vesicles. We simulate the adhesion process of two vesicles in a quiescent flow in Section III, where we also present a simple lubrication model to estimate how long it takes for two nearby vesicles to reach the separation distance set by the adhesion potential. In Section IV we first study the hydrodynamics of two vesicles in a planar extensional flow. We then numerically investigate the hydrodynamics of a vesicle doublet in a fluid trap where the stagnation point is actively controlled to be at the center of the vesicle doublet. From these results we propose a novel application of the microfluidic fluid trap to probe the adhesion strength between lipid bilayer membranes in solutions. In Section V we investigate how two vesicles may form a doublet as they move toward each other under a planar shear flow. We map out the parameter regions for bound/unbound vesicles under a planar shear flow, and we also investigate the effects of adhesive interactions on the rheological properties of a dilute suspension of vesicle doublets. Finally in Section VI we discuss the implications of our results and point out a few potential future directions.
II Governing Equations
We consider a suspension of locally inextensible vesicles in an unbounded two-dimensional viscous fluid. For simplicity, we assume the fluid viscosity both inside and outside the vesicles is the same; however, incorporating viscosity contrast is rather straightforward in our numerical algorithm. While we focus on a vesicle doublet suspension for the rest of the paper, here we provide the most general formulation for multiple vesicles interacting with each other through both hydrodynamic and adhesive forces. Individual vesicles are denoted as , , and they are parameterized in arclength as . The union of all vesicles is denoted by . Given a background velocity , the governing (dimensionless) equations are
| conservation of momentum | (1) | |||||
| conservation of mass | ||||||
| far-field condition | ||||||
| velocity continuity | ||||||
| local inextensibility | ||||||
| stress balance on membranes |
where is the fluid velocity field, is the pressure, and the scaled viscosity inside the vesicles. Outside the vesicle with () the viscosity of the interior (exterior) fluid. We set the viscosity ratio for the rest of the paper. is the stress tensor, is the jump across the membrane, and is the traction that is the sum of the bending, stretching, and adhesion forces defined in equation (8) of Appendix A. The bending force, arising from the Helfrich energy model, is , where the subscript denotes derivative with respect to arclength . is the bending modulus which we set to be 1 for all examples. The stretching force is , where the tension, , acts as a Lagrange multiplier to satisfy the local extensibility constraint. The resistance to bending and stretching are standard assumptions on vesicles. In this work, we include an adhesive force, , that we now describe.
 (a) (a)
|
 (b) (b)
|
 (c) (c)
|


The adhesion potential for a vesicle membrane has been modeled by a L.-J. type potential
| (2) |
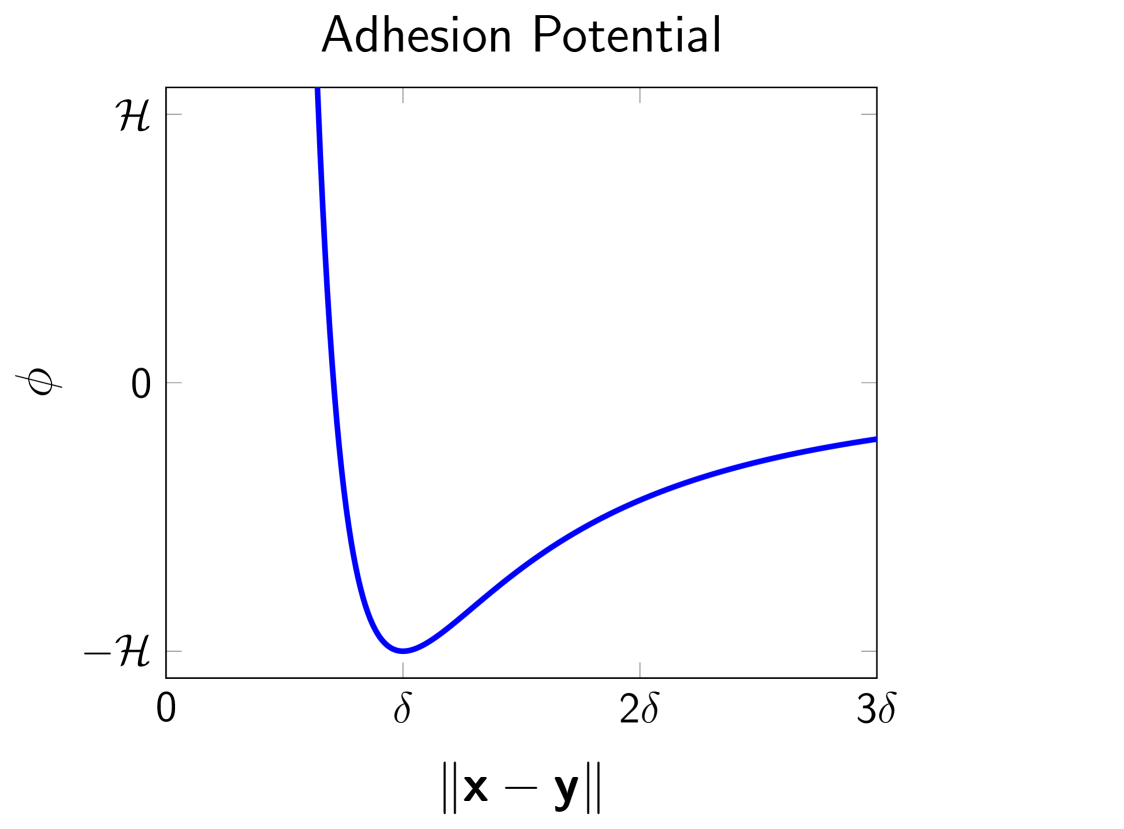
where is the Hamaker constant, is the adhesion length scale, and is the distance between a patch on the vesicle membrane and a point on the other object, which could be another vesicle membrane or a flat solid wall. The characteristics of the L.-J. potential are summarized in Figure 1(a): The adhesive force is zero at the equilibrium distance . For large distances () the adhesive potential is attractive while for small distances () the potential is repulsive to prevent physical contact. The long-range attraction component should decay sufficiently fast to mimic the finite-range attraction between RBCs. In this work we are mainly interested in effects of adhesive interactions between two vesicles drawn together by the surrounding linear flow. Therefore we do not introduce any truncation in the long-range attraction.
The exponents in equation (2) depend on the geometry and the molecular details of the two objects under adhesion Israelachvili (1991): corresponds to two flat, planar surfaces interacting with each other, and has been a common choice for studying membrane-solid adhesion Seifert and Lipowsky (1990); Sukumaran and Seifert (2001); Shi et al. (2006); Lin and Freund (2007); Blount et al. (2013); Young and Stone (2017). On the other hand, corresponds to the L.-J. potential between two molecules, and has been used to model membrane-membrane adhesion Flormann et al. (2017). In our case, the adhesion potential is between two small patches of lipid bilayer membrane (because the lipid molecules are coarse-grained in the continuum modeling). Thus a reasonable choice for between two coarse-grained membrane patches would be between those for two planar surfaces and two point molecules.
A large value of corresponds to a sharp increase in the repulsion force as two objects are within the separation distance . This poses a numerical challenge since the problem becomes stiff (i.e., requires a very small time step) for large . The adaptive time-stepping BIE scheme makes it possible to simulate vesicle adhesive dynamics with specified numerical precision for reasonable computation time. We explore several combinations of in the simulations of two vesicles forming a doublet in a quiescent flow and in a shear flow. We found that, as long as the close-range interaction is well resolved both in space (using the near-singular evaluations) and time (using the high-order adaptive time integration), there is very little difference in both the dynamic evolution and equilibrium configuration between and . Therefore, in this work, we use to regulate the numerical stiffness introduced by the adhesive force.
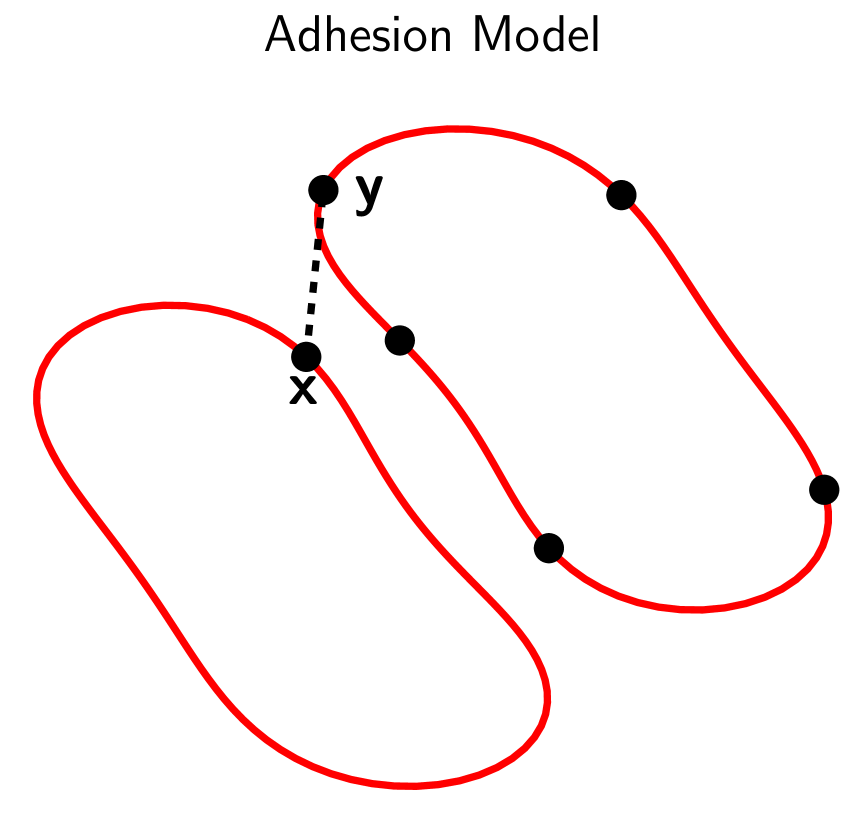
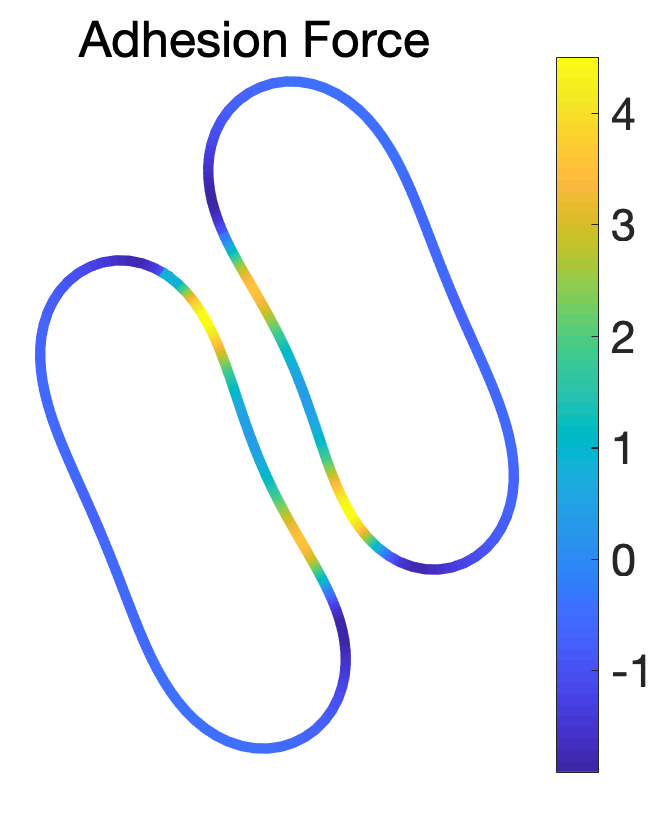
Focusing on intermediate adhesive strengths, we use Hamaker constants ranging from to times the bending modulus. We assume that the adhesion force from equation (2) applies between all pairs of points on different vesicles, and in Appendix B the net adhesive force at a point on vesicle is shown to be
| (3) |
This summation of adhesive forces is illustrated in Figure 1(b). Figure 1(c) is an example of the calculated adhesive force projected onto their center-of-mass vector. We notice that the adhesive force is repulsive in the contact region, while for the rest of the membranes there is an attractive force that acts to pull the two vesicles together. The summary of boundary integral formulation can be found in Appendix A. For the rest of the paper, the dimensionless bending modulus is set to be one () unless otherwise specified.
III Adhesion of two vesicles in a quiescent flow
We consider two identical vesicles suspended in a quiescent flow. Without any external forcing such as an imposed electric field or a fluid flow in the far-field, the long-range attraction pulls the vesicles together until their separation distance is close to . The L.-J. type potential prohibits physical contact between the two membranes and instead keeps them close to the separation distance . In Section III.1, we compute the expected time for the vesicles to reach an equilibrium configuration and compare the analysis with numerical simulations. In Section III.2, we characterize the effects of the adhesion parameters and the vesicles’ reduced area on the shape of the contact region and the bending and adhesive energies.
III.1 Effects of the adhesion parameters on draining times
When two vesicles move towards (or away from) each other under a constant force without any imposed external flow, the height, , of the thin liquid film between two vesicles follows the draining dynamics Ramachandran and Leal (2010)
| (4) |
where is the area expansion modulus, is the viscosity of the exterior fluid, and is the radius of the undeformed vesicle. For the case of a constant forcing (independent of separation distance and time ), equation (4) can be easily integrated to relate the film thickness and time :
where is the vesicle separation at . We note that for an attractive (repulsive) interaction between two vesicles, and consequently decreases (increases) from the initial separation distance . When the force is attractive, decreases monotonically, and in the above equation is the draining time that diverges as .
When the force on each vesicle is a function of the separation distance of the form
| (5) |
with integers , attraction is dominant at “large” distances () while repulsion is dominant at “small” distances (). Integration of equation (4) with the as defined in equation (5) gives the relationship between and . In this case, the relationship involves an integral of a function of the dimensionless variable :
Solving for ,
| (6) |
and equation (6) tells us that both the adhesion strength and the separation distance affect the time it takes for a pair of vesicles to reach the separation distance under adhesion force in equation (5). In particular, the duration is proportional to (i) the separation distance (thus as ), and (ii) the adhesion strength (as in the constant forcing case Ramachandran and Leal (2010)). From the above analysis we also expect that the scaling of with respect to depends on the adhesion potential, while the scaling with respect to adhesion strength is independent of the specific form of the potential.
 (a) (a)
|
 (b) (b)
|
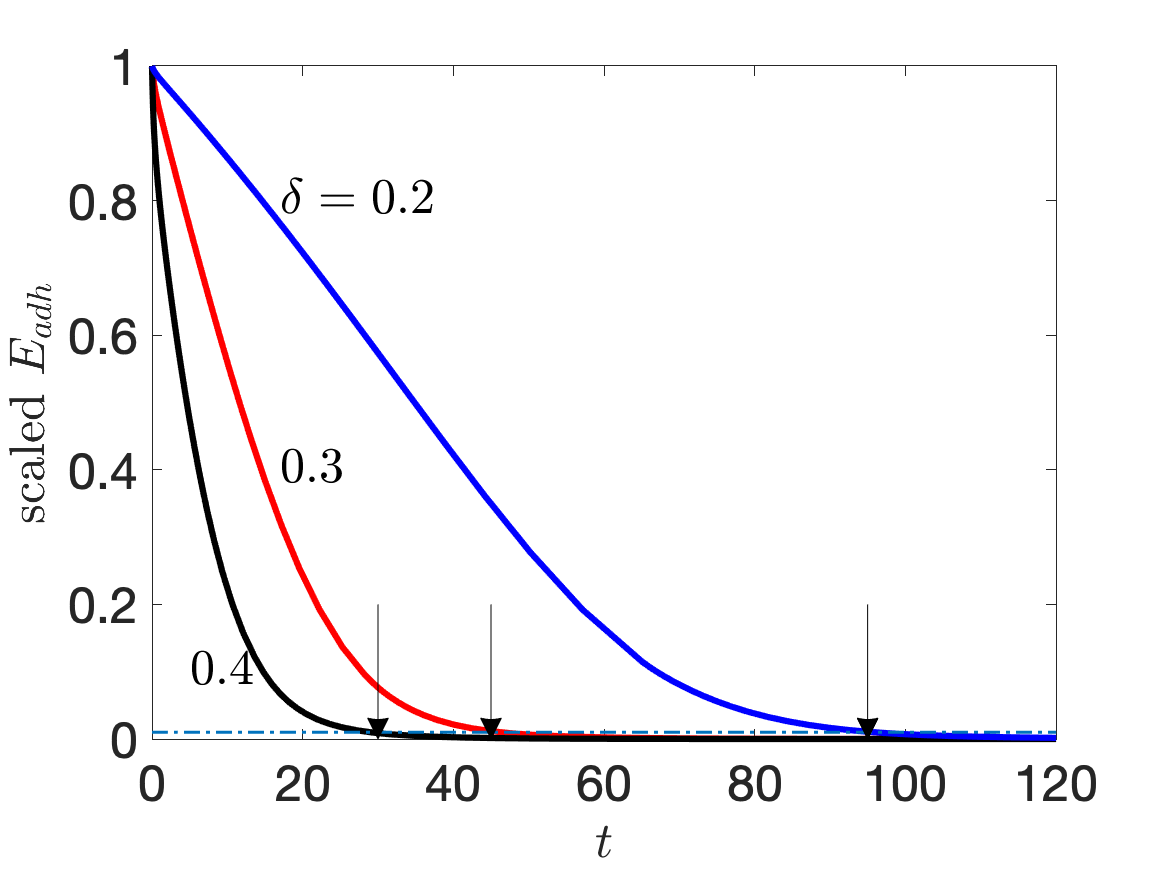
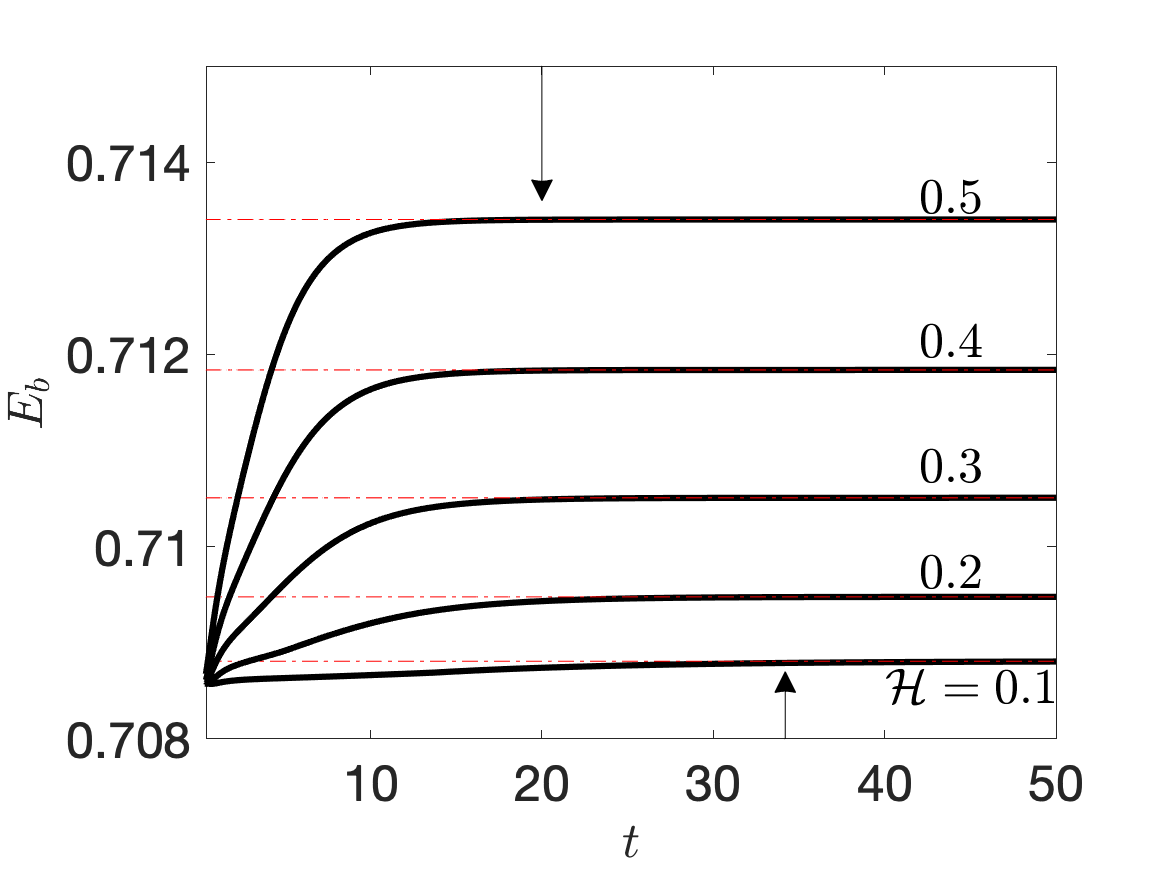
To test the scaling of the duration with respect to and , we simulate the vesicle adhesion dynamics in a quiescent flow. Starting with two vesicles at a distance of twice the vesicle radius, the long-range attraction pulls the vesicles together. Figure 2(a) shows the scaled adhesion energy versus time with and three values of as labeled. Adhesion energy reaches minimum at equilibrium, and the scaled evolves towards zero at equilibrium. The arrows indicate the times when the scaled adhesion energy reaches within of equilibrium: for , for , and for :
The scaling with respect to adhesion strength is illustrated in Figure 2(b), where and varies from to as labeled. Again the arrows indicate the times when the equilibrium is reached within :
From the above results, we conclude that the scaling in equation (6) captures the adhesion dynamics of two vesicles that interact with each other via the adhesion force in equation (5).
III.2 Effects of the adhesion parameters on equilibrium configuration of a vesicle pair
We again simulate two identical adhering vesicles with the adhesion force in equation (5). The initial vesicle separation is smaller than in the previous simulations so that the equilibrium configuration is achieved in a shorter time horizon. Once a vesicle doublet is formed, the membrane shape in the contact region depends on the adhesion strength relative to the membrane bending modulus. For weak to moderate adhesion strength, vesicle membranes are flattened in the contact region while the rest of vesicle maintains a nearly spherical shape Evans and Metcalfe (1984); Evans (1988); Israelachvili (1991); Ramachandran et al. (2010). Under a strong adhesion, however, the vesicle membranes in the contact region buckle and form a sigmoidal shape that has also been observed in RBC doublets Ziherl (2007); Ziherl and Svetina (2007); Flormann et al. (2017). An external electric field is also able to buckle a vesicle membrane that is adhered to a solid substrate Steinkuhler et al. (2016).
In this work we focus on weakly adhesive vesicles whose equilibrium shapes in a quiescent flow are shown in the left plot of Figure 3 for three reduced areas: , , and with and .
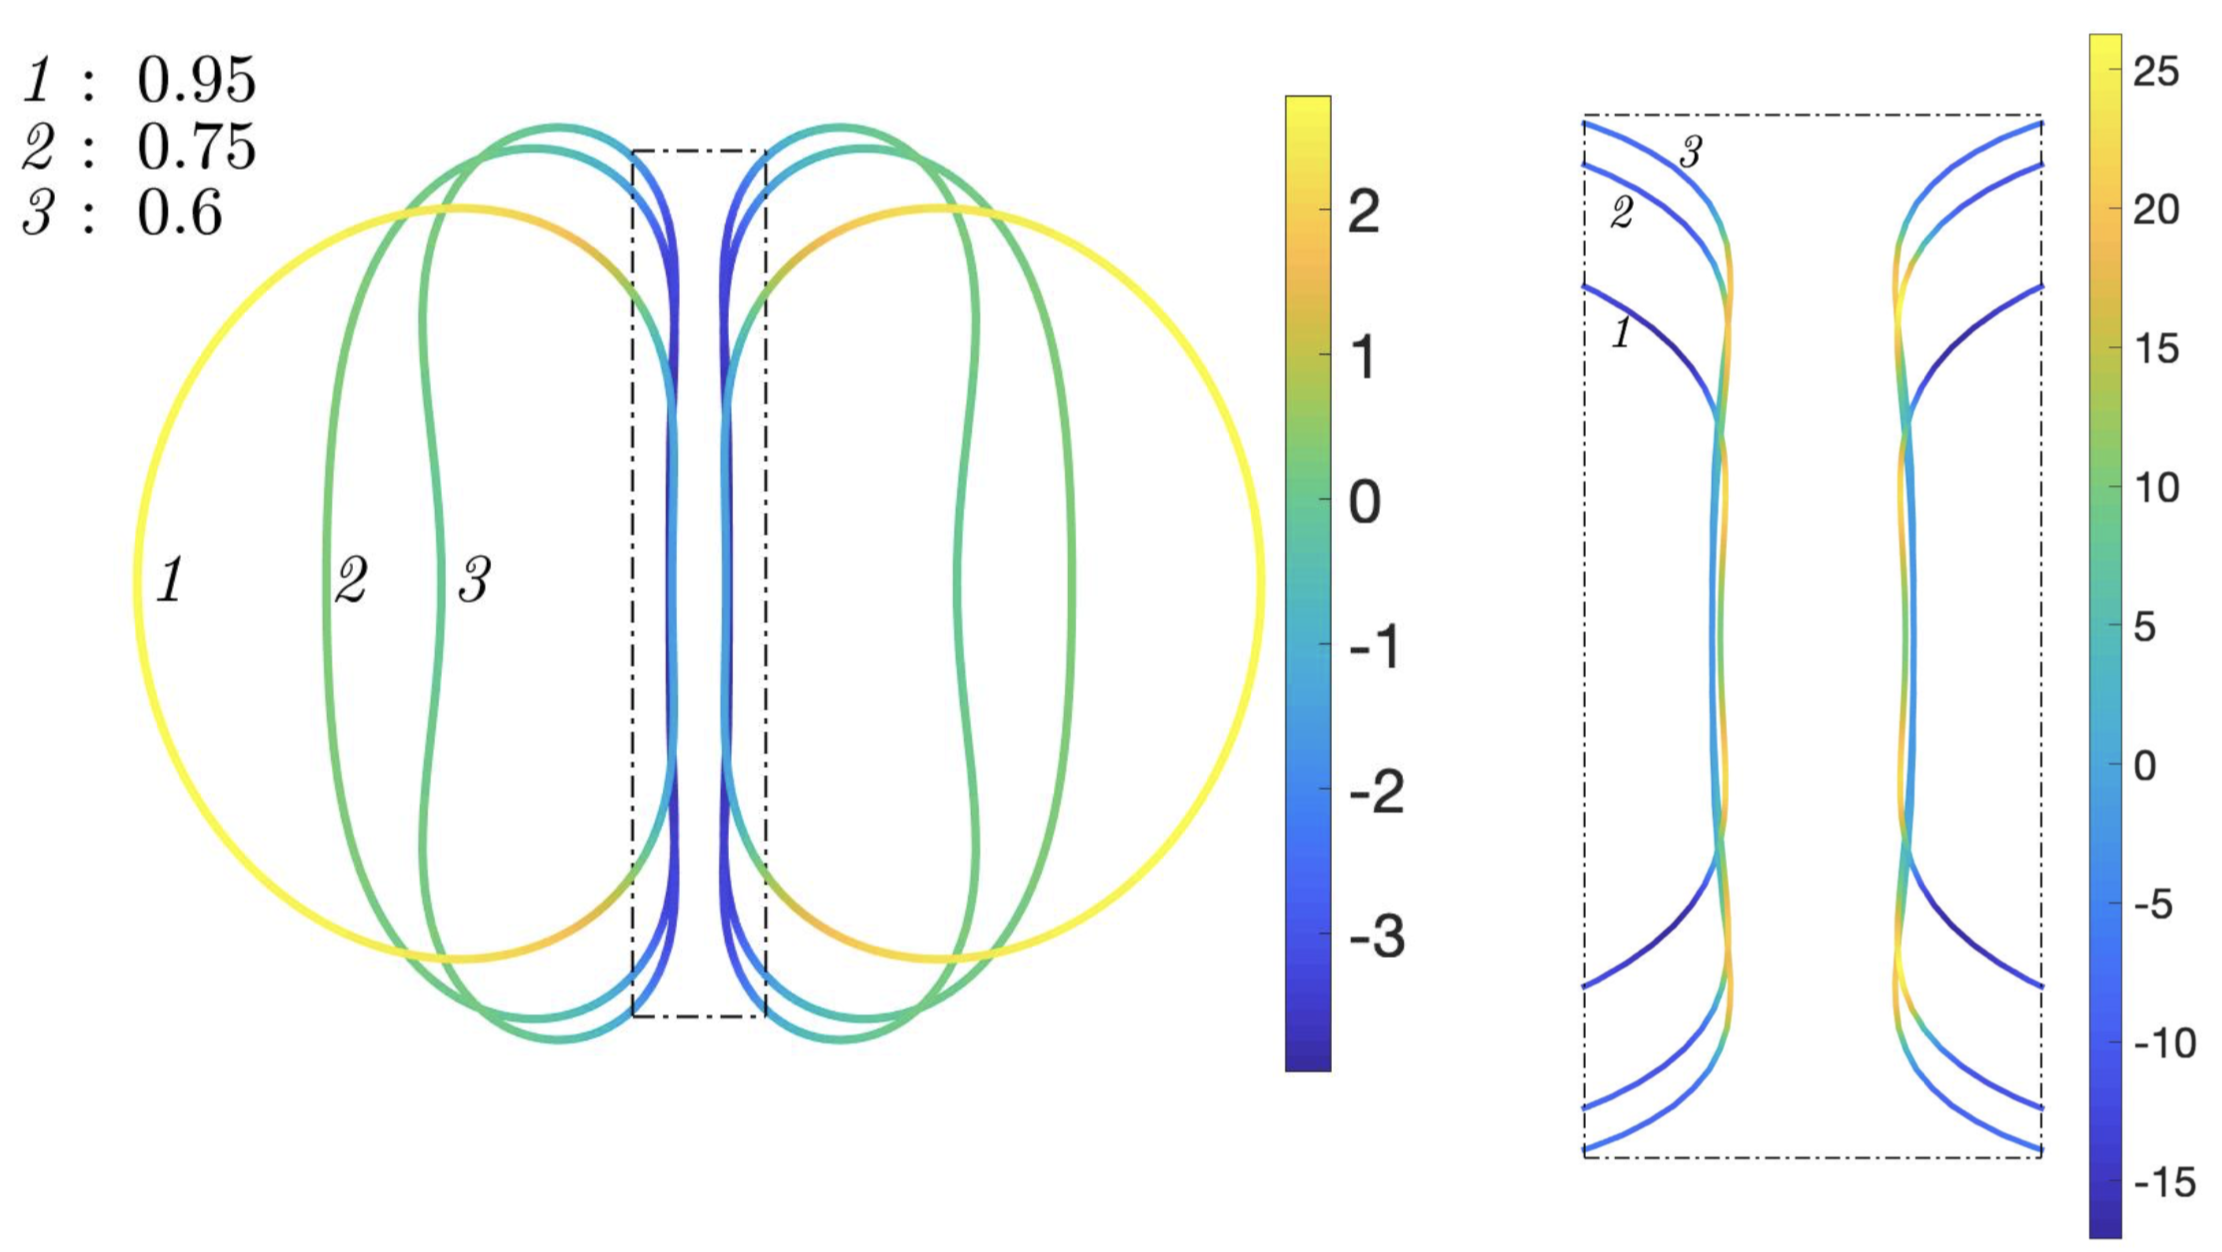
The equilibrium vesicle shape for is the circular cap with a flat contact region. This is similar to the observed shapes of two vesicles under strong adhesive interaction in Ramachandran et al. (2010). When vesicles are more deflated with a reduced area , the equilibrium vesicle shape is elongated with a bigger contact region. This is consistent with the equilibrium shapes of a vesicle doublet under a L.-J. potential Flormann et al. (2017). As the reduced area decreases further, we observe undulation of the vesicle membrane on the non-contact side while the contact region remains flat. The color coding along each curve is the tension of the vesicle membrane. We observe that the membrane tension in the contact region is very negative, indicating a dominant compression of membrane when the adhesion force is strong to keep the vesicles bound together.
The right plot of Figure 3 is a zoom (not to-scale) of the membranes in the contact region, where the membranes are not perfectly flat at all three values of reduced area. We observe that the membranes are slightly curved with a dip at the edge. Such membrane undulation in the contact region is predicted by lubrication analyses on an elastic membrane under adhesion with a solid substrate Blount et al. (2013); Young and Stone (2017). Results from the lubrication analysis show that this dip and slightly curved shape in the contact region are independent of the adhesion strength. The high membrane curvature at the edge may pose a problem for using the contact angle there to estimate the adhesion strength. This inspires us to investigate the possibility of using a dynamic fluid trap to measure the adhesion strength (see Section IV).
Also the dip at the edge of the contact region is related to (but different from) the buckling of membrane under strong adhesion: A closer inspection on the dip at the edge shows that the membrane distance is smaller than the neutral separation distance there for more deflated vesicles. For and the adhesion force is mostly attractive in the contact region except at the edge, where the adhesive force turns repulsive. For , however, the adhesion force is mostly repulsive, leading to large tension in the rest of the vesicle membrane.
 (a) (a)
|
 (b) (b)
|
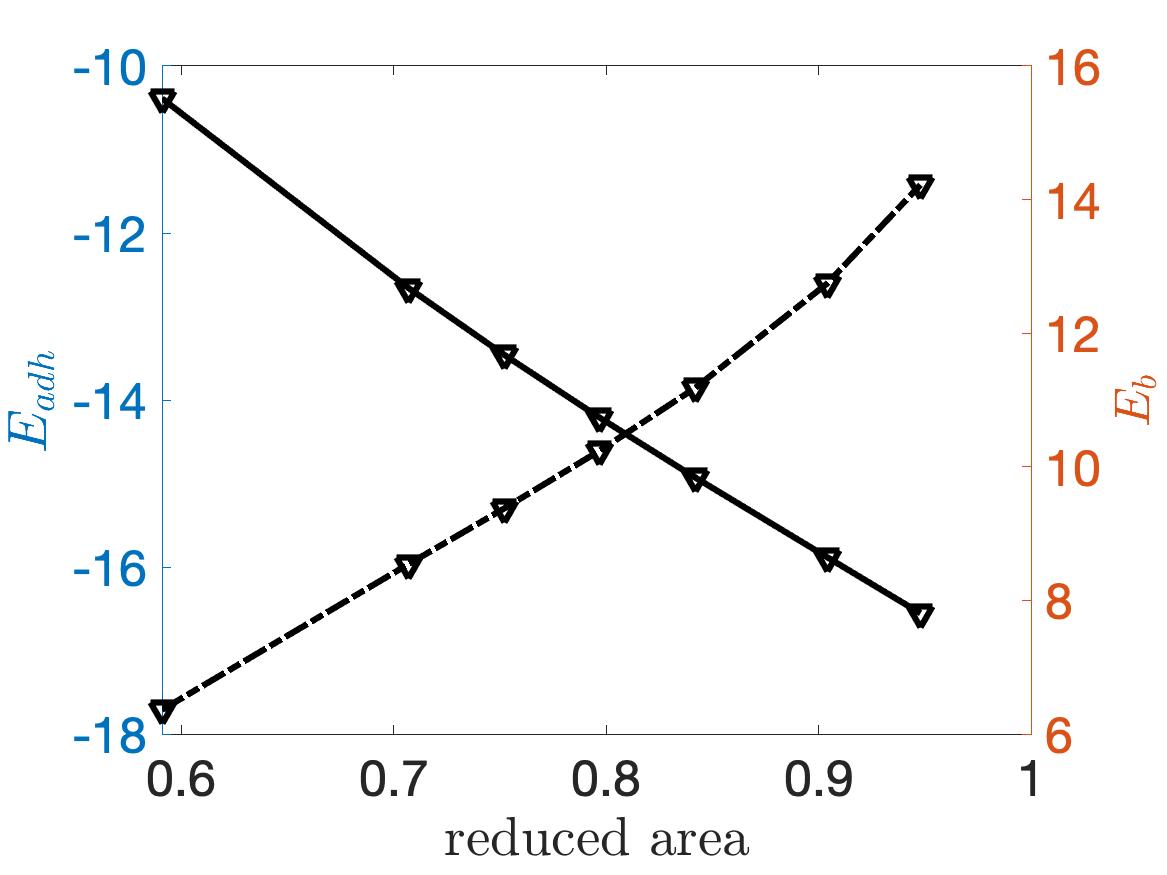
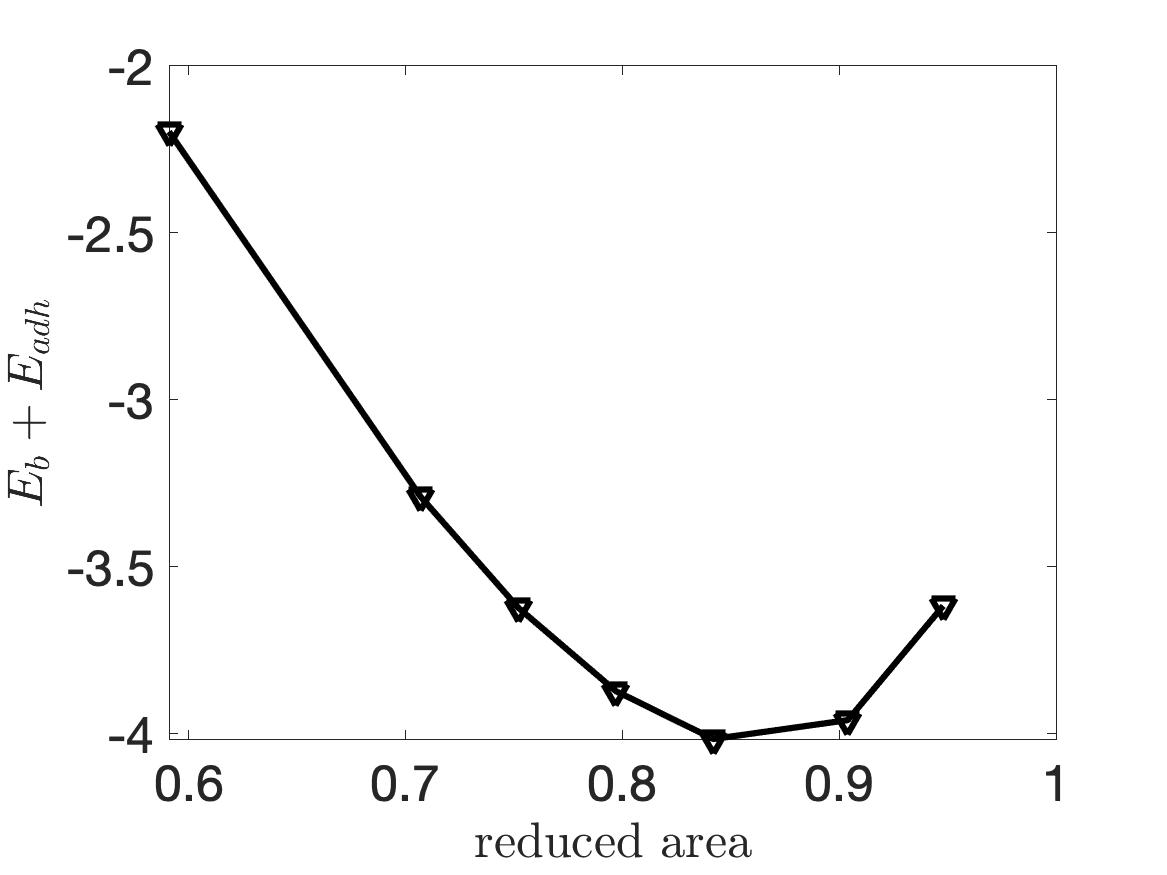
Figure 4(a) shows the total bending energy and adhesion energy as a function of the reduced area. The smaller the reduced area, the more vesicle area is available for deformation and thus the bending energy is higher. In contrast, the total adhesion energy becomes more negative as the reduced area decreases. The sum of the two energies is plotted in Figure 4(b), where a local minimum in the total energy is found around .
 (a) (a)
|
 (b) (b)
|
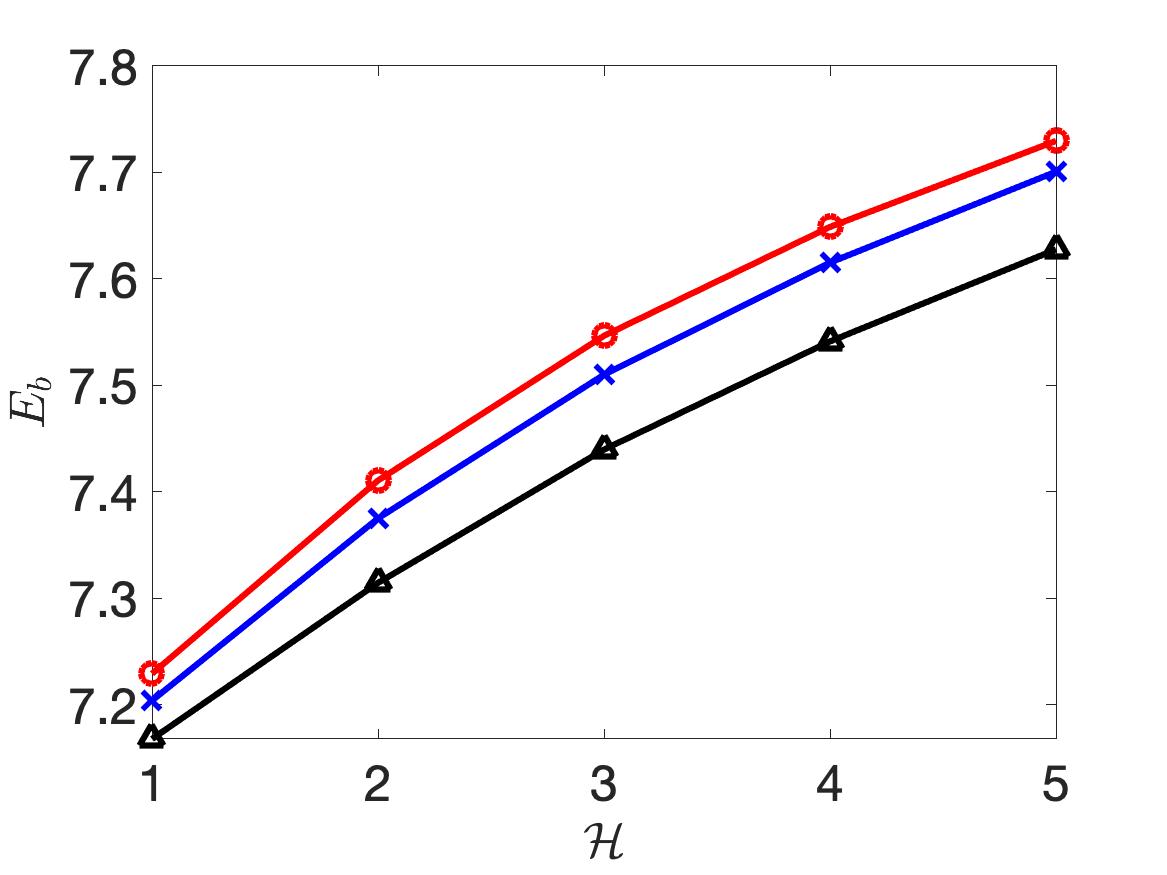
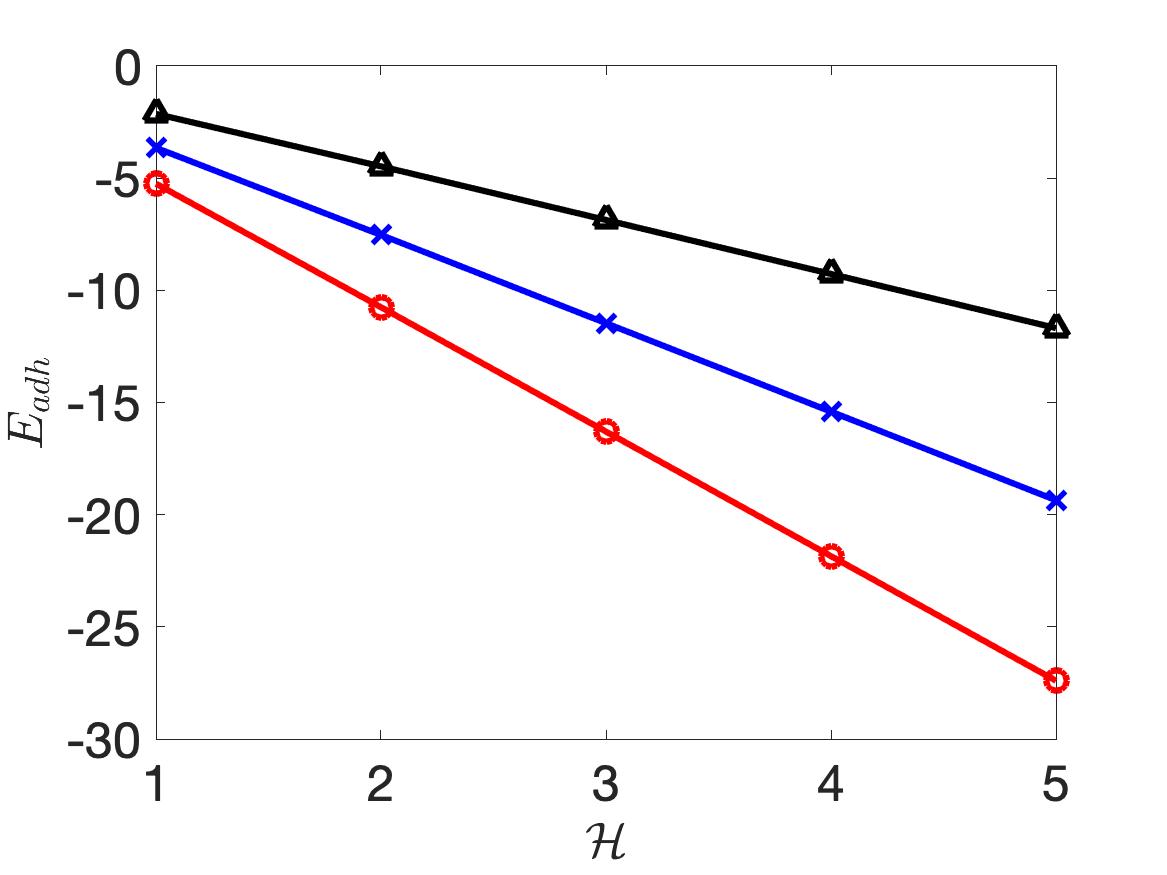
Figure 5 demonstrates how the adhesion strength and separation distance affect the equilibrium configuration of two vesicles under adhesive interactions. Both vesicles have a length of and a reduced area of . The total bending (a) and adhesion (b) energies at equilibrium are plotted against for three values of the separation distance . We observe that for the equilibrium vesicle shape does not vary much with the adhesion strength , while the total adhesion energy varies linearly with .
IV Adhesion of two vesicles in a planar extensional flow


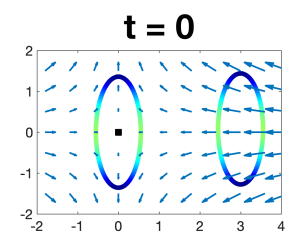
The hydrodynamics of a single vesicle in an extensional flow has revealed novel nonlinear vesicle dynamics not found for a viscous drop Kantsler et al. (2007, 2008b); Zhao and Shaqfeh (2013); Narsimhan et al. (2014); Dahl et al. (2016). Here we focus on a planar extensional flow where the fluid velocity field is centered at the origin (), the stagnation point where the fluid flow converges horizontally and diverges vertically. Placed symmetrically at the stagnation point of an extensional flow, a single vesicle may remain steady and symmetric for low extension rate . For sufficiently large extension rate the vesicle may undergo asymmetric deformation Kantsler et al. (2008b); Narsimhan et al. (2014); Dahl et al. (2016), similar to a surfactant-laden viscous drop under a planar extensional flow Jansen et al. (1997); Hu et al. (2000). Frostad et al. investigated the draining of thin film between two identical vesicles as they collide head-on in an extensional flow Frostad et al. (2013), however they did not include adhesive interaction between vesicles. In the following we first illustrate how two vesicles interact with each other under an adhesive potential in a planar extensional flow. We then illustrate how the adhesion strength between membranes can be measured non-intrusively by using the fluid trap.
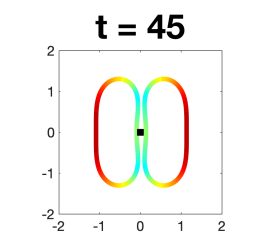
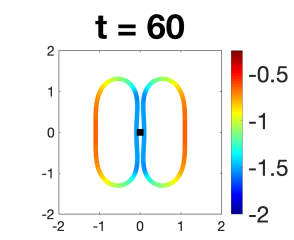
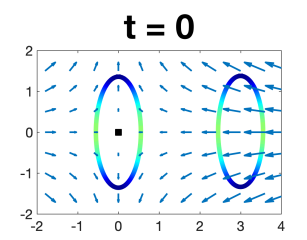
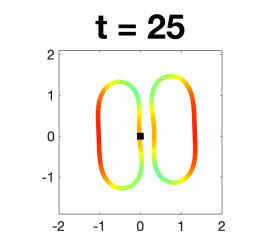
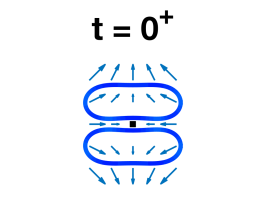
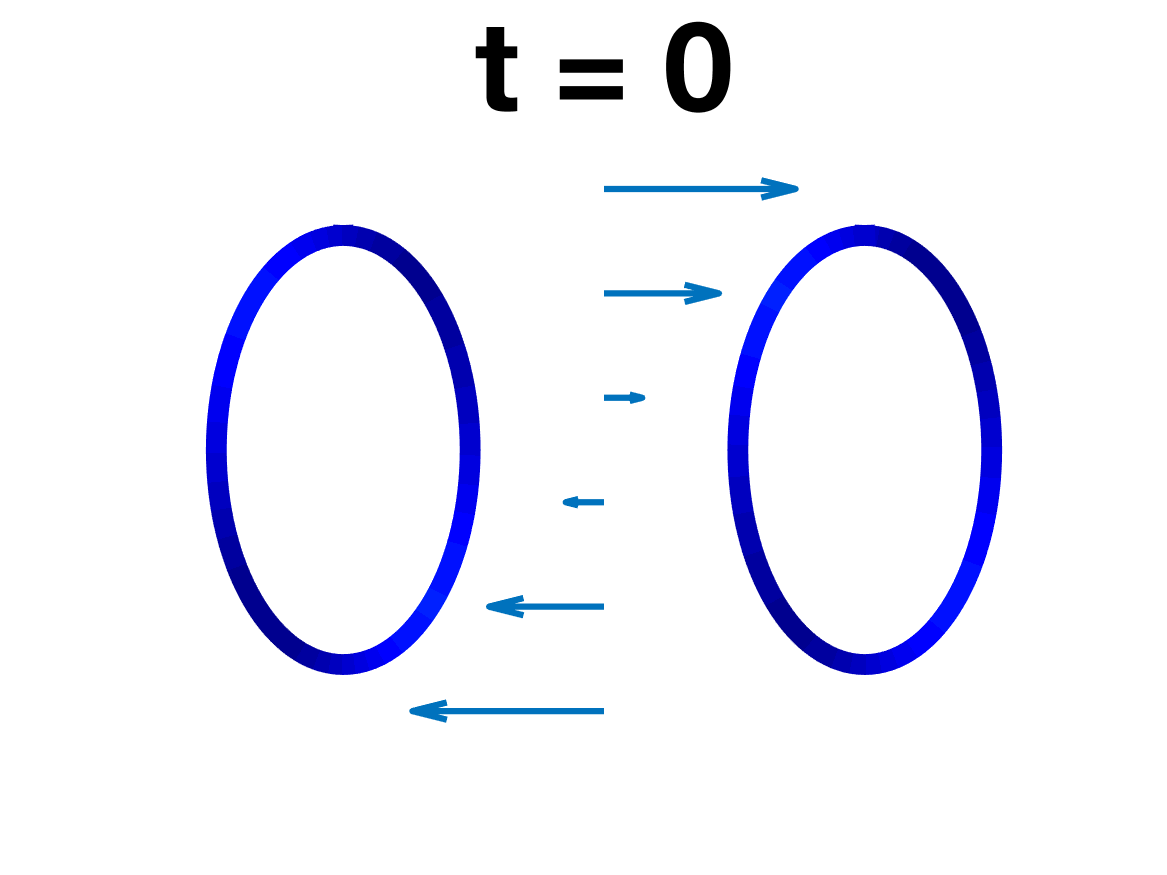
At the beginning of the first set of simulations (left panels in Figure 6) we place a vesicle at , and the other vesicle at where the initial vertical displacement varies from for the top row, for the second row, to for the bottom two rows in Figure 6. The Hamaker constant is for the top three rows, and is for the bottom row. The color coding is the membrane tension with the color bar on the right of each row. We note that the negative tension in an extensional flow is consistent with the destabilizing tension for a vesicle with finite bending forces Narsimhan et al. (2014).
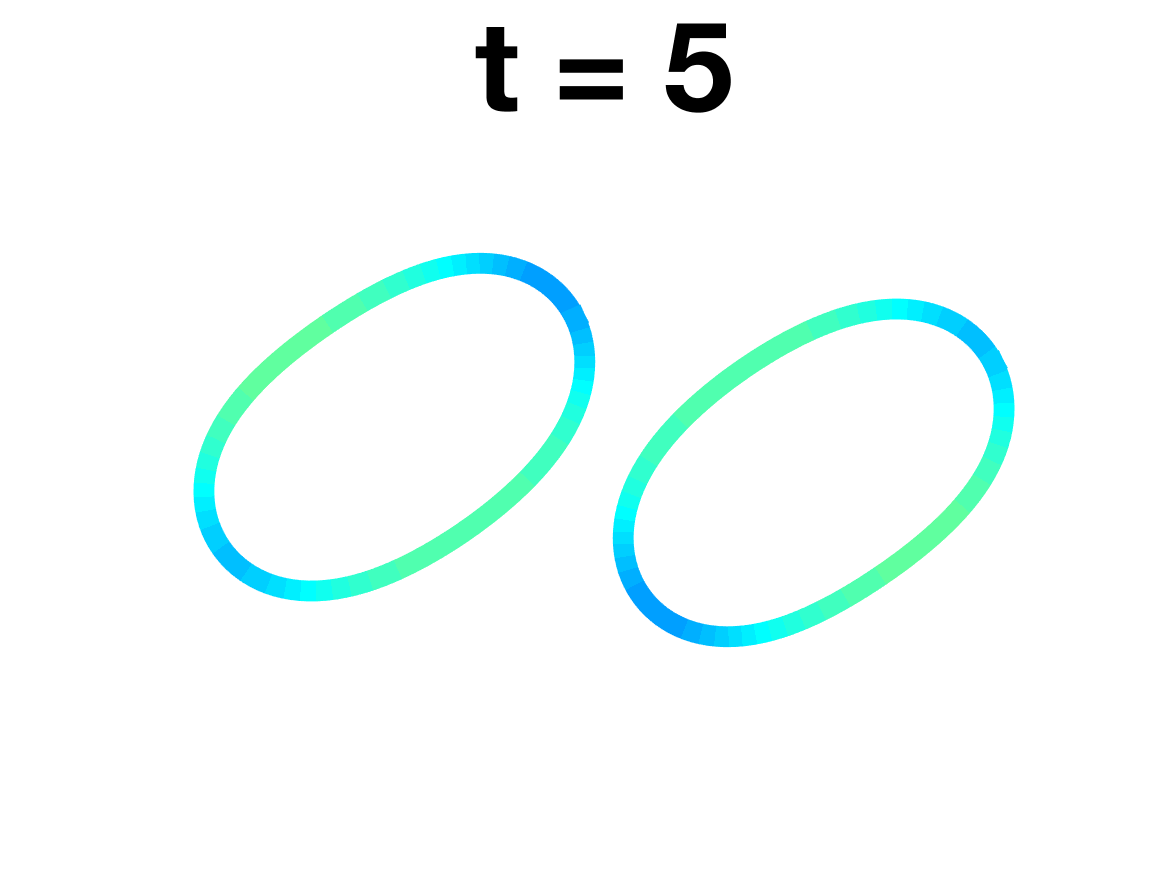
Once the planar extensional flow is turned on at , two vesicles move towards each other as shown in Figure 6. For in the top row, the two vesicles stay on the -axis as they move closer to form a doublet. We observe that the left vesicle (initially centered at ) moves to the left due to the impinging vesicle from the right. As time progresses they form a doublet and reach a steady configuration that is symmetric with respect to the stagnation point (square marks in the top row of Figure 6).
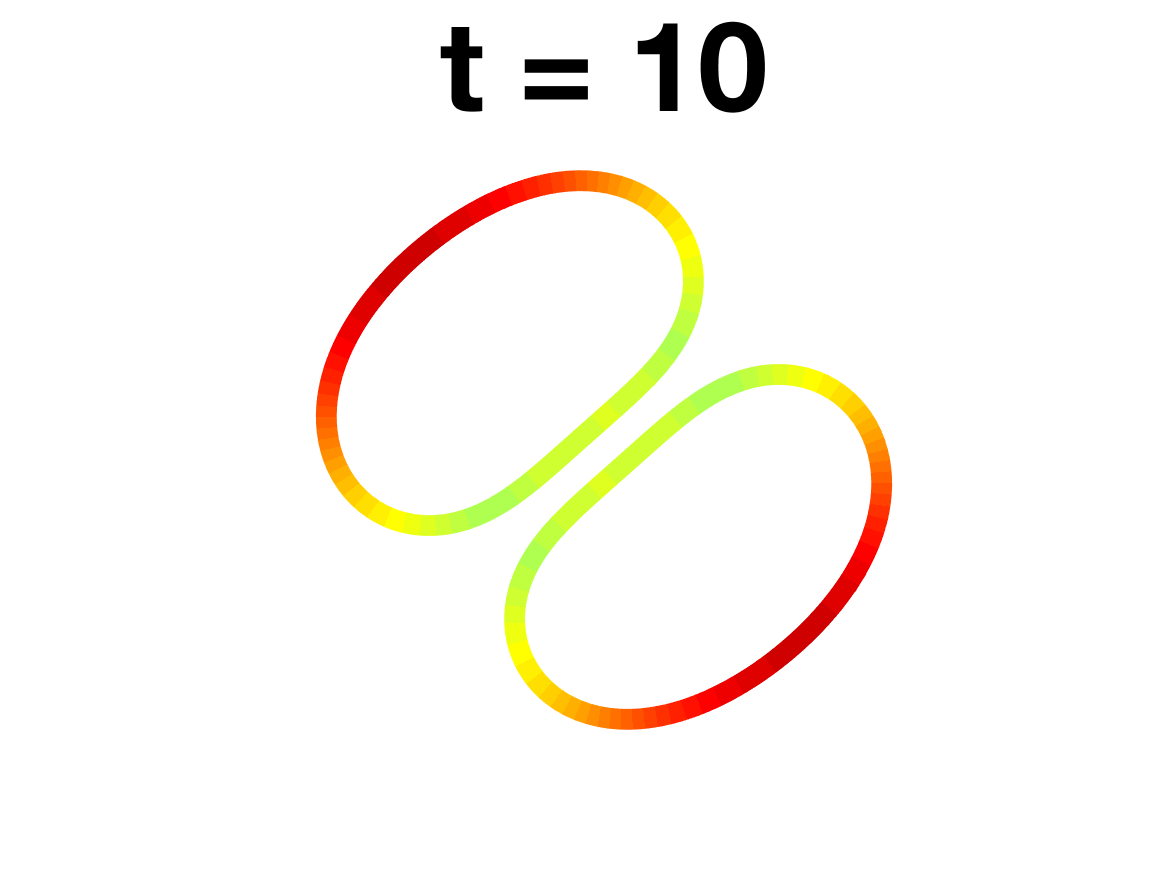
For we observe similar vesicle dynamics only at the beginning when the right vesicle moves towards the stagnation point and the left vesicle is pushed to the left of the stagnation point. As both vesicles come to close vicinity of the stagnation point, the elevated right vesicle () is pulled up by the diverging flow in the direction, causing rotation of both vesicles. We also observe that the larger the initial vertical displacement, the larger the rotation and the faster both vesicles move away from the stagnation point. For sufficiently strong adhesion ( for the first three rows in Figure 6), the two vesicles rotate and move away from the stagnation point as a doublet until the end of simulations (). As the two vesicles move farther away from the stagnation point, the extensional flow becomes more effective in pulling the two drops apart as shown in the third row of Figure 6. For (bottom row in Figure 6), the two vesicles are separated by the diverging flow as early as , and are clearly not a doublet at the end of simulation.
Here we provide two main observations drawn from the results in Figure 6: (1) The membrane tension is highly non-uniform on the vesicles, leading to a significant Marangoni stress along the membrane as in the case of a surfactant-laden drop at the center of an extensional flow. Thus it is reasonable to expect that the flow around the vesicles is significantly altered. (2) In an extensional flow, vesicles are prone to move away from the stagnation point. A small initial vertical displacement in one of the vesicles causes both vesicles to not only rotate but also move away from the center. Once vesicles move off the horizontal axis, their hydrodynamics is dominated by the diverging flow as they move farther away. Thus in the microfluidic experiment it is often more desirable to trap the vesicle around the center of an extensional flow Spjut (2010). With an active control algorithm to place the stagnation point at a desirable location by adjusting the flow with a feedback loop Bentley and Leal (1986); Johnson-Chavarria et al. (2011), a particle can be trapped at the stagnation point for long time scales to facilitate image acquisition or other detailed measures such as particle image velocimetry of flow inside and around the particle.
To explore the application of such a fluid trap to measure the adhesion strength between two bound vesicles, we propose the following experiment. Beginning with two identical vesicles in an equilibrium configuration that form a doublet with a flat contact region (Figure 3), we turn on the fluid trap with the stagnation point placed at the center of the vesicle doublet. Depending on the Hamaker constant, we expect that either the flow overcomes the adhesive force and the doublet is broken, or the adhesive force is sufficiently strong and the doublet reaches a stable stationary configuration.
 (a) (a)
|
 (b) (b)
|
 (c) (c)
|


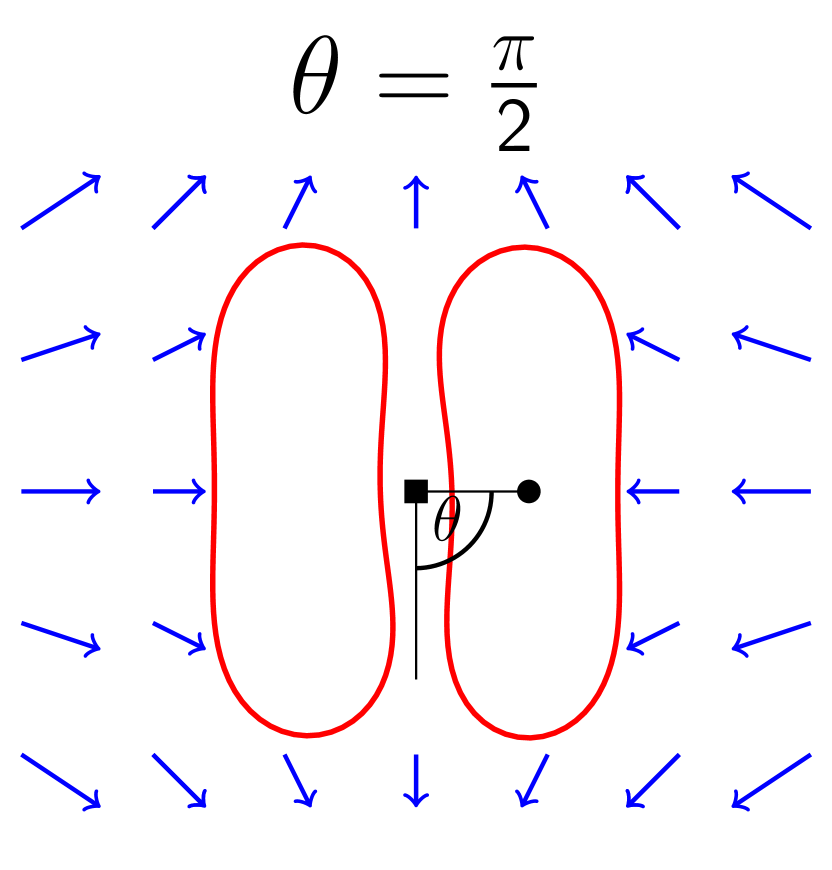
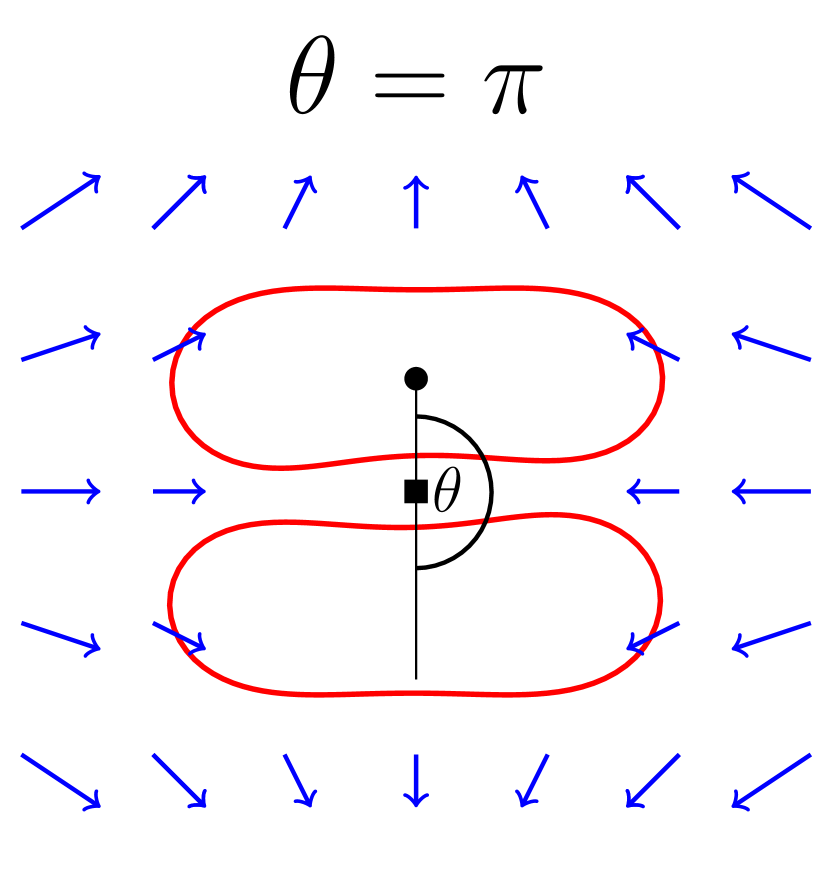
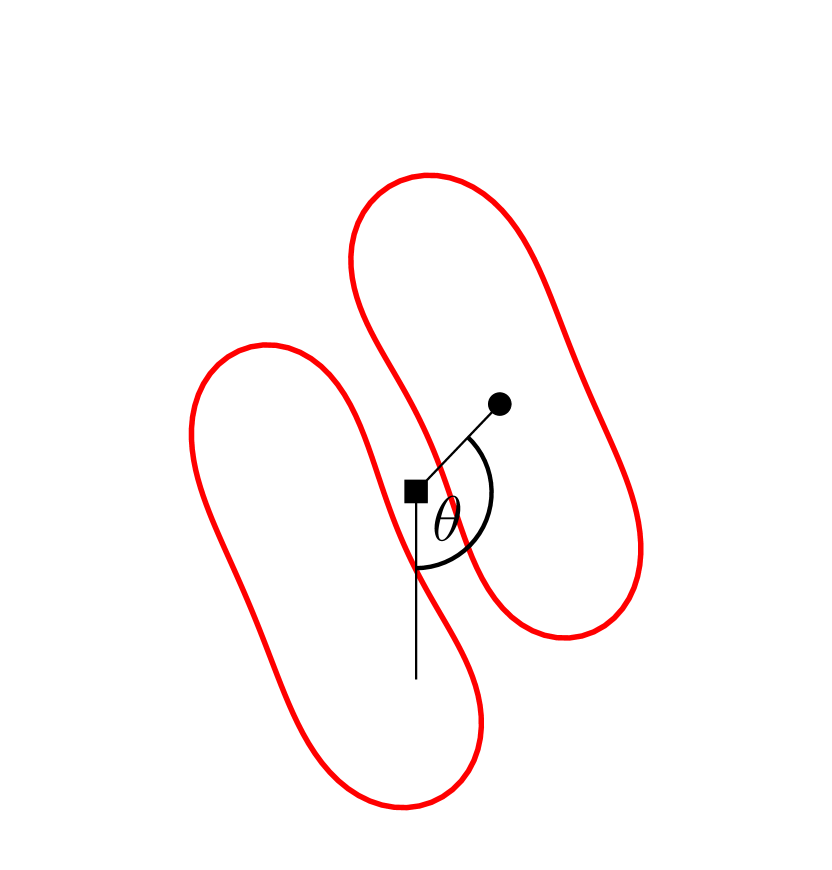
Based on how the contact region aligns with the extensional flow, we can define the inclination angle of the vesicle doublet as illustrated in Figure 7(b). When (Figure 7(a)) the diverging flow pulls the vesicles apart from each other and the attractive adhesion force is essential to keep the two vesicles from separating. In contrast, when (Figure 7(c)), the converging flow pushes the vesicles towards each other and the repulsive force is essential to keep the two vesicles at the separation distance. With the converging flow pushing the two vesicles towards the stagnation point dynamically placed at the doublet center, we expect the configuration to be more stable than the configuration.

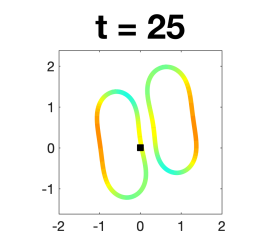
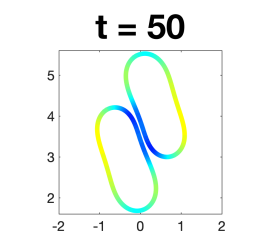
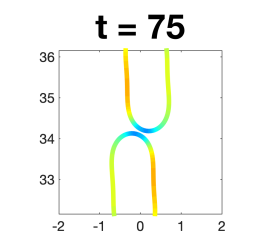
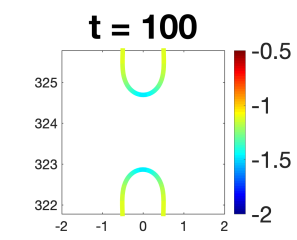
In the following numerical experiments we initially place a vesicle doublet with , so that the diverging flow may be strong enough to pull vesicles away from the doublet. At low extension rates, we expect the doublet to stay bound at the fluid trap stagnation point. On the other hand, the vesicle doublet may become unstable and eventually separate at higher extension rates. Thus we expect there to exist a critical extension rate above which the vesicle doublet cannot stay bound under a given adhesion potential. Therefore, the dependence of the critical extension rate on the adhesion potential and the mechanical vesicle properties provides a means to probe the physics of membrane adhesion.
We consider vesicle doublets with reduced areas 0.70, 0.75, 0.80, 0.85, 0.90, and 0.95, all with a length of , and we vary the extension rate () between and . Since the stagnation point can be controlled in an experimental setting Bentley and Leal (1986); Johnson-Chavarria et al. (2011), we mimic the active control of the microfluidic experiments by moving the center of the doublet at each time step so that the stagnation point occurs exactly in the middle of the doublet. With this adjustment, the vesicles either remain as a doublet in the fluid trap centered around the stagnation point, or the doublet is broken and the vesicles separate from one another.
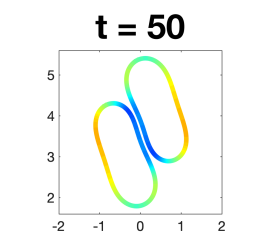
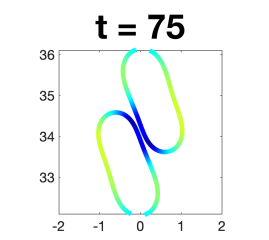
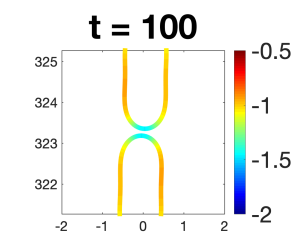
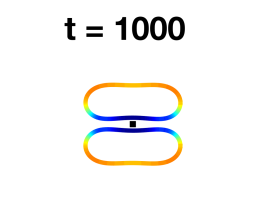
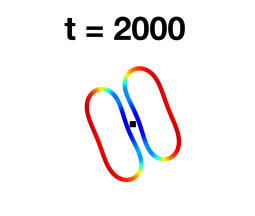
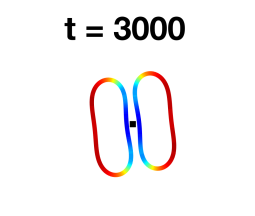
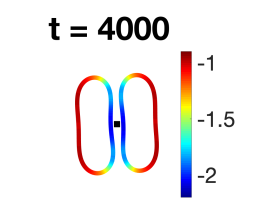
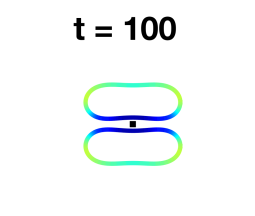
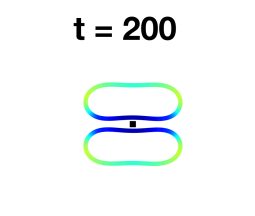
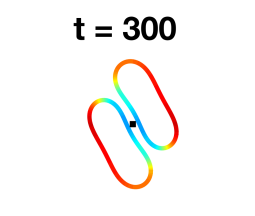
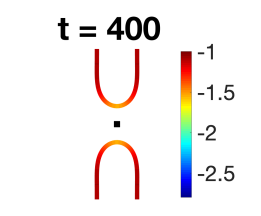
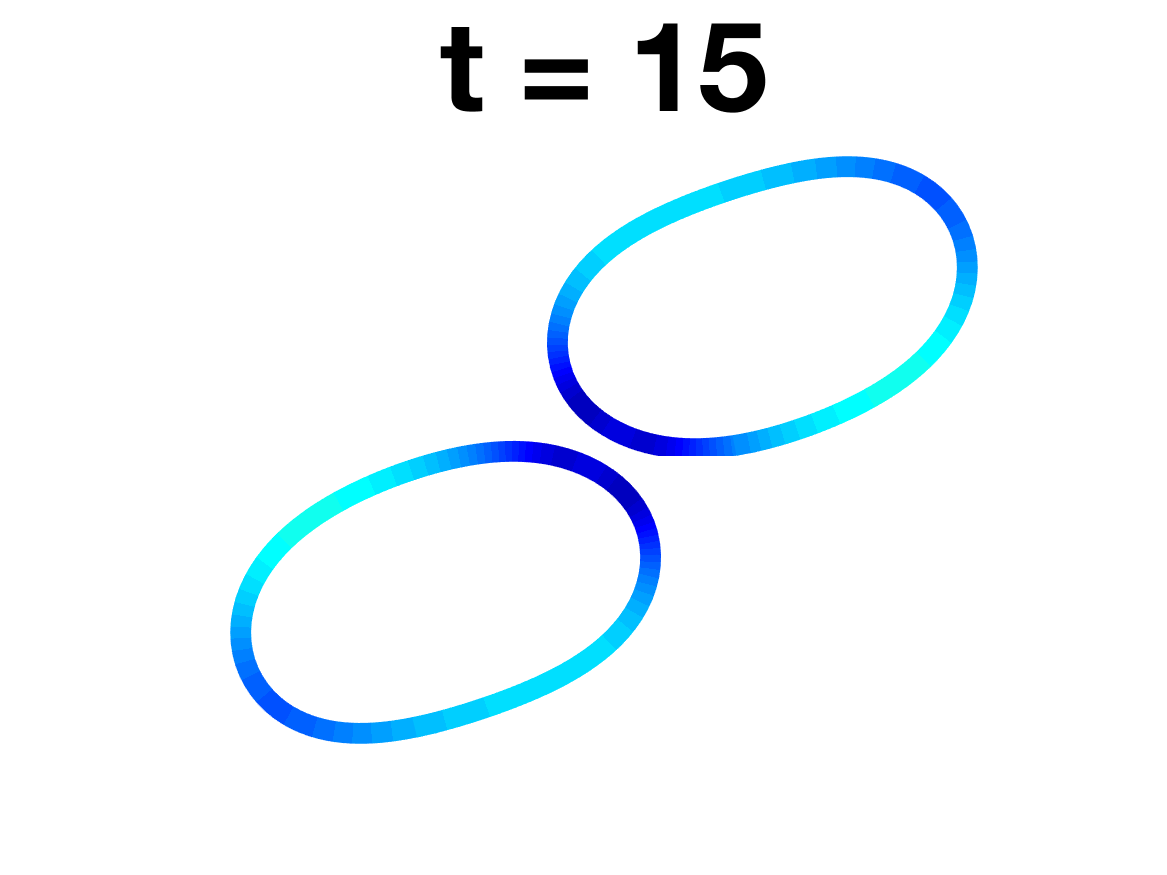
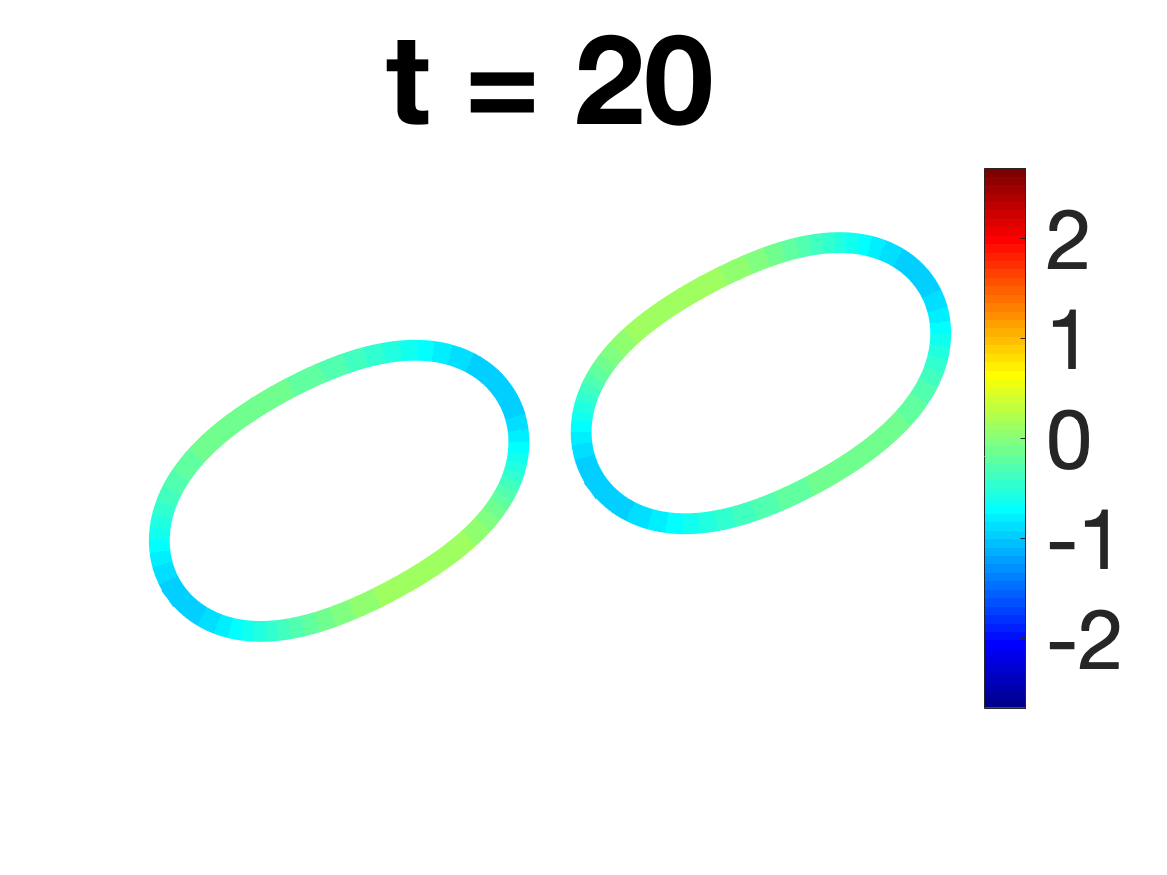
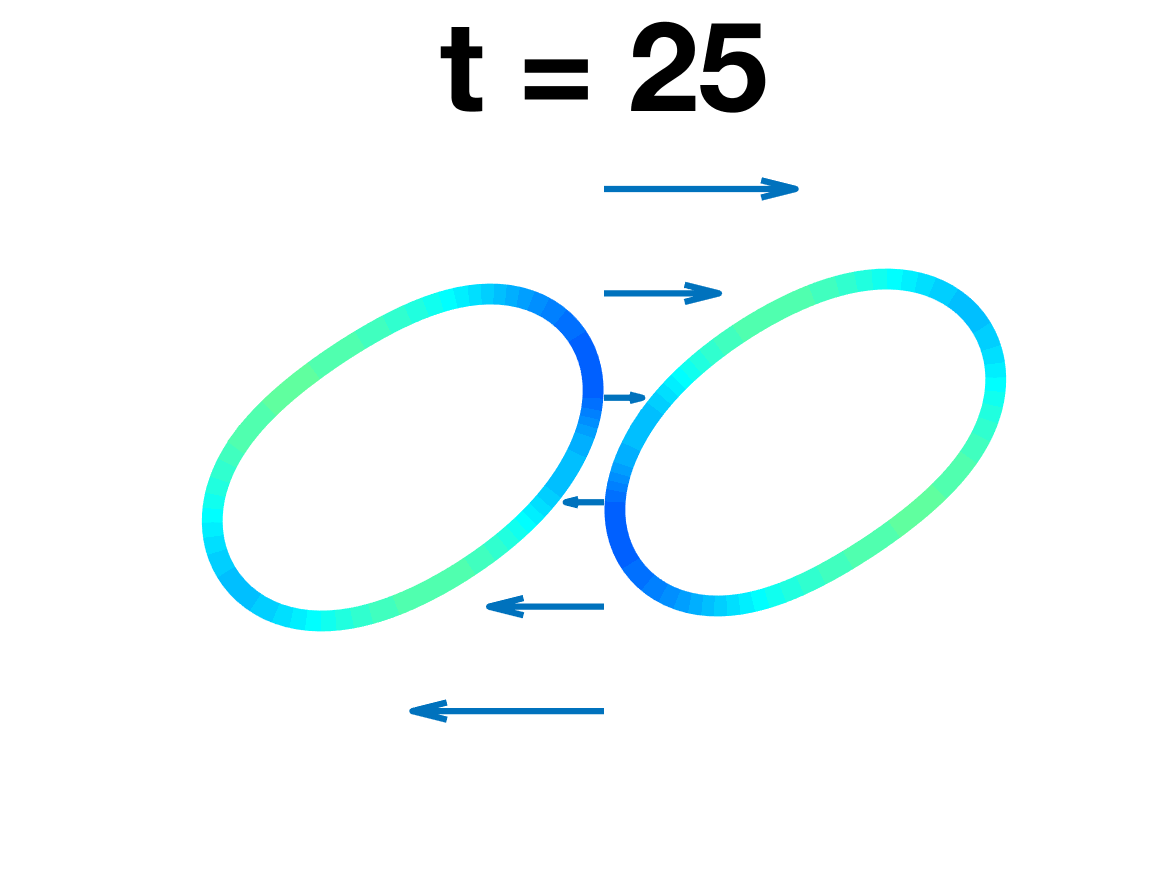
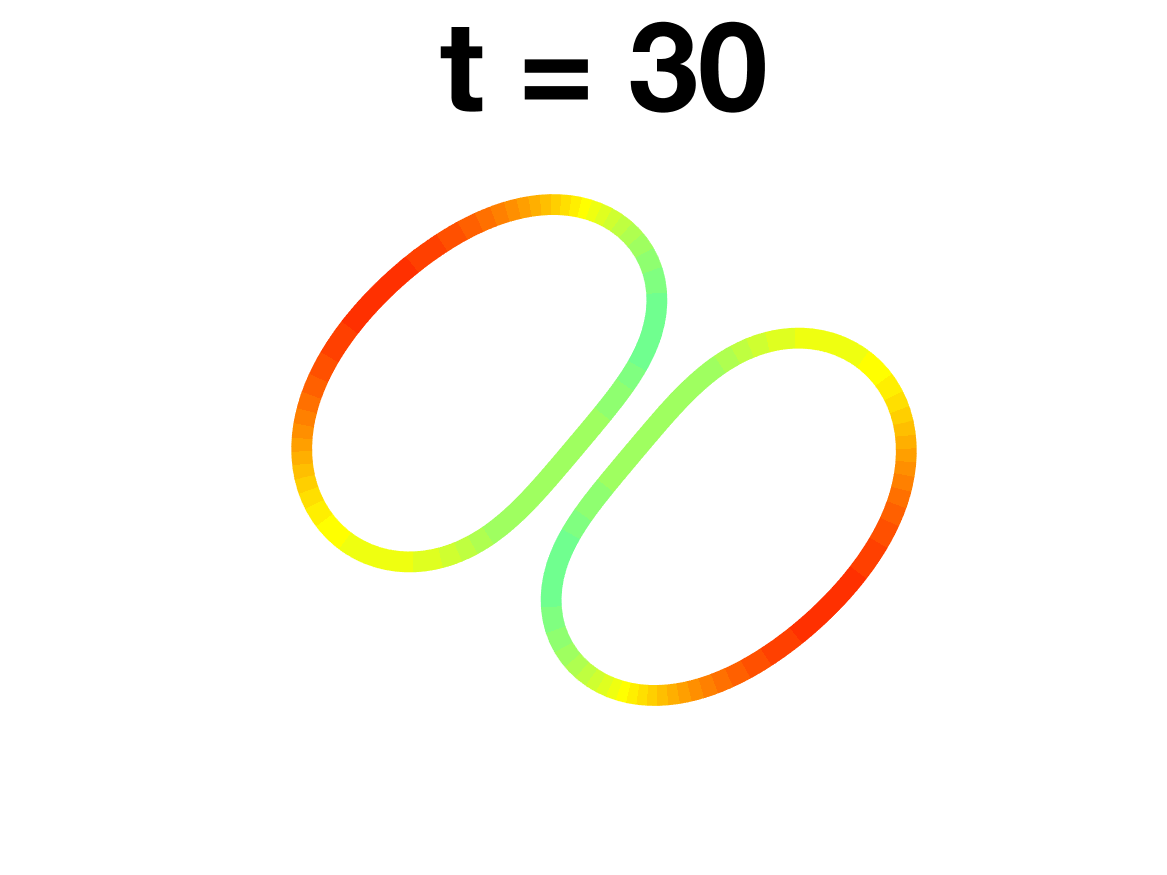
Figure 8 shows snapshots from simulating a vesicle doublet of reduced area at three different extension rates. A general feature of the doublet dynamics is that the doublet rotates from configuration towards the more stable configuration. We also observe that with moderate extension rates, the doublet falls short of aligning their long axis with the diverging direction. Moreover, the final inclination angle is closest to the stable for the smallest extension rates. While this doublet remains bound for all the considered extension rates, a doublet with a reduced area of is split with a critical extension rate (Figure 9).
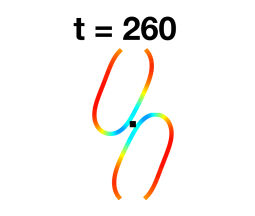
The equilibrium configuration for low extension rate (top row in Figure 8) is almost identical to the equilibrium configuration for (top row of Figure 6). The rotation of the vesicle doublet from to can be understood as the transition from an unstable configuration to a stable configuration . For higher extension rates (second and third rows in Figure 8) the partially rotated vesicle pairs at equilibrium are also very similar to the case of (second row of Figure 6). Such asymmetric vesicle configuration is reminiscent of the asymmetric deformation of a single vesicle in an extensional flow Kantsler et al. (2008b); Narsimhan et al. (2014); Dahl et al. (2016). To gain more insight into such nonlinear dynamics, in the following we explore more physical characterization of the transition from to at different reduced area and extension rate.
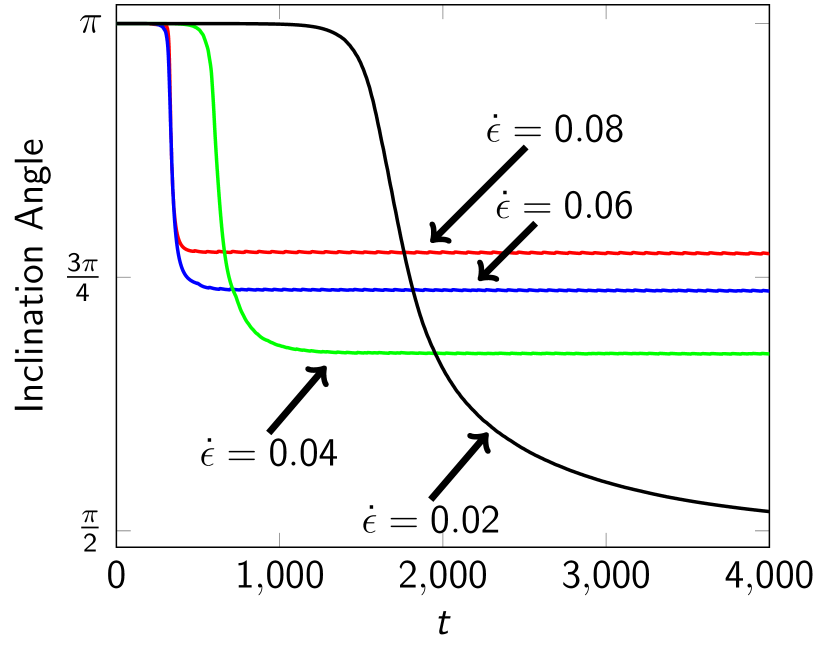
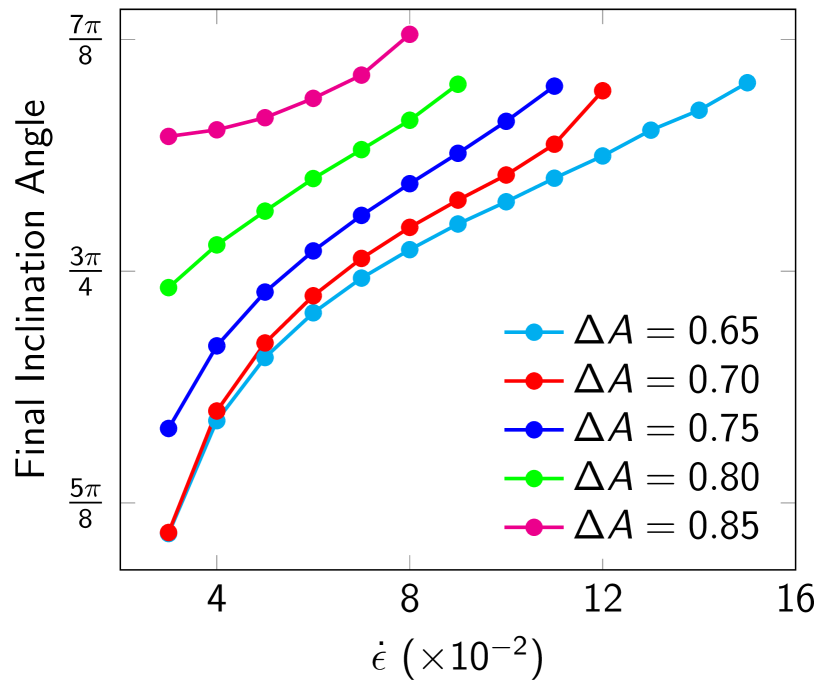
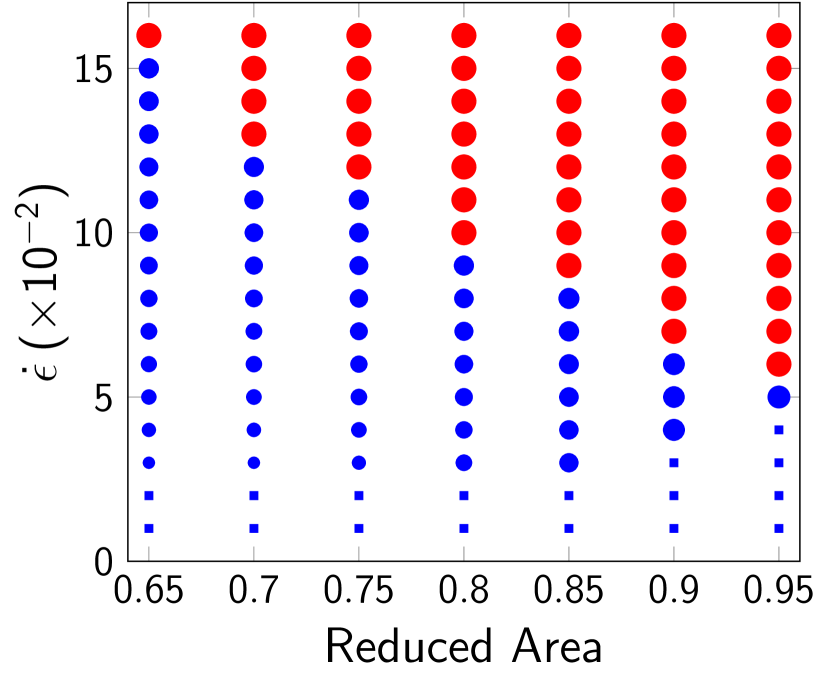
In Figure 10(a), we plot the inclination angle of the doublet as a function of time for four different extension rates, and the final inclination angle for all doublets that reach an equilibrium state are in Figure 10(b). We observe that not only do smaller extension rates result in smaller inclination angles, but smaller reduced areas also result in smaller inclination angles. We summarize the final inclination angle of the doublet in Figure 10(c). The size of the round dots are scaled to the final inclination angle as defined in Figure 7. At smaller extension rates, the vesicles come closer to aligning their long axis with the diverging direction. When the doublet is broken at reduced area , the extension rate is sufficiently large to align the long axis of the vesicle with the diverging direction and then the vesicles separate (Figure 9). For very low extension rates, the time horizon is insufficient for the doublet to reach an equilibrium state, and these simulations are marked with a square. Figure 10(c) also summarizes the reduced areas and extension rates that result in a bound vesicle doublet in a fluid trap: Parameter values with a blue mark result in a fluid trap and parameter values with a red mark result in vesicle separation.
 (a) (a)
|
 (b) (b)
|
 (c) (c)
|


V Adhesion of two vesicles in a planar shear flow
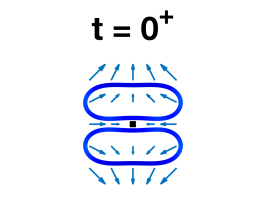
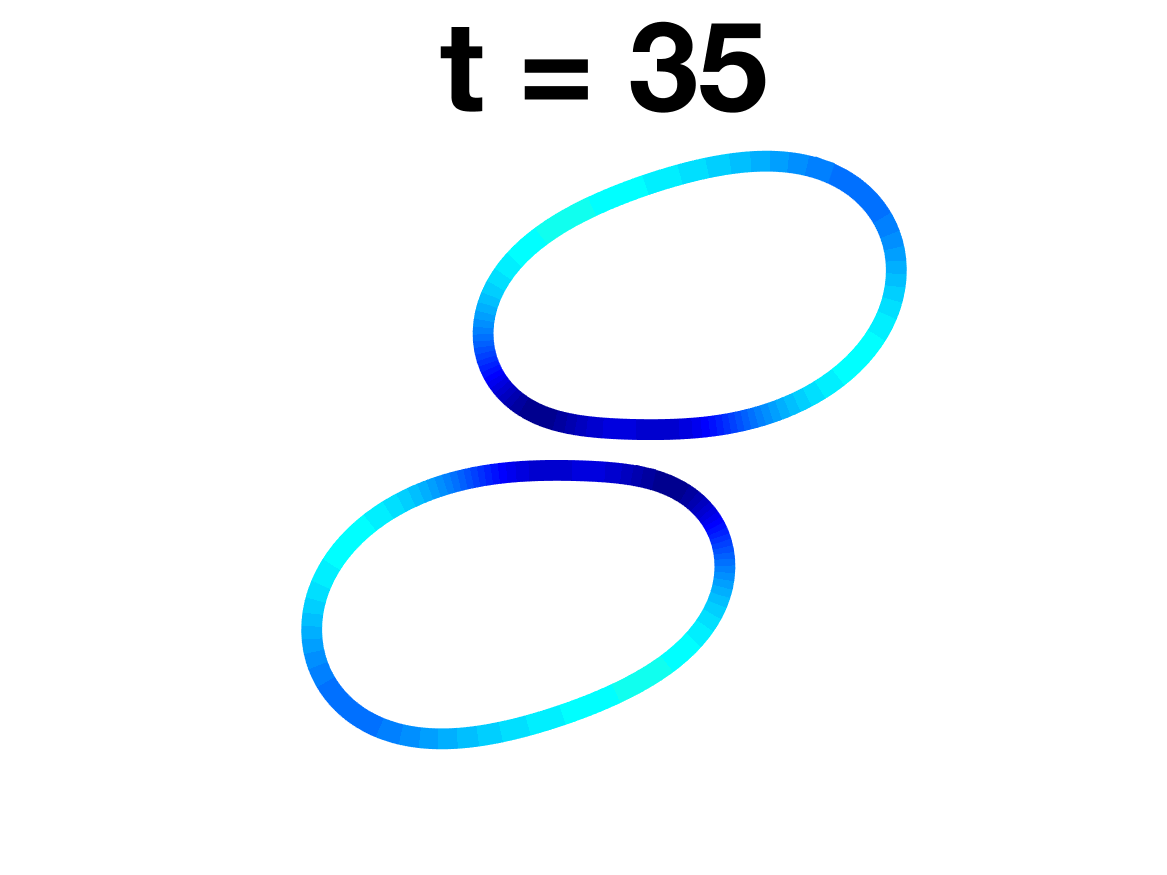
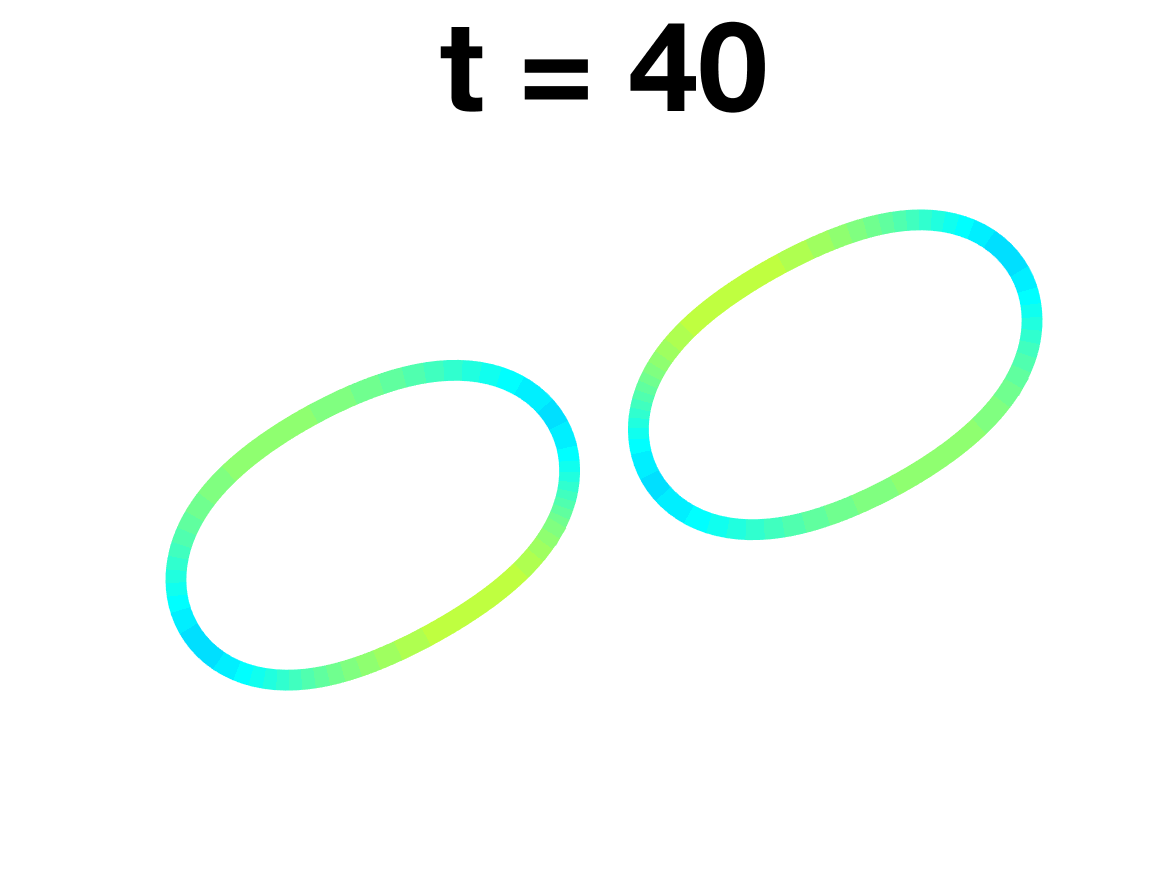
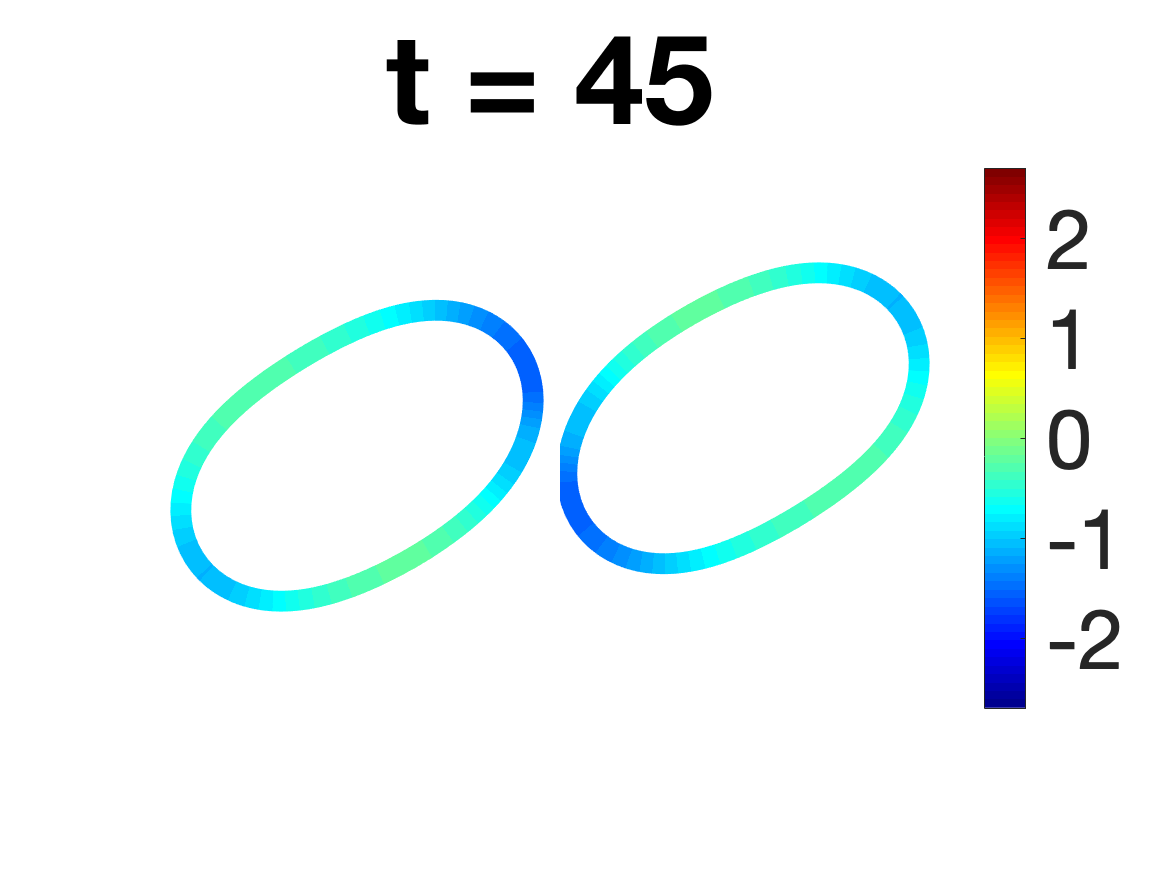
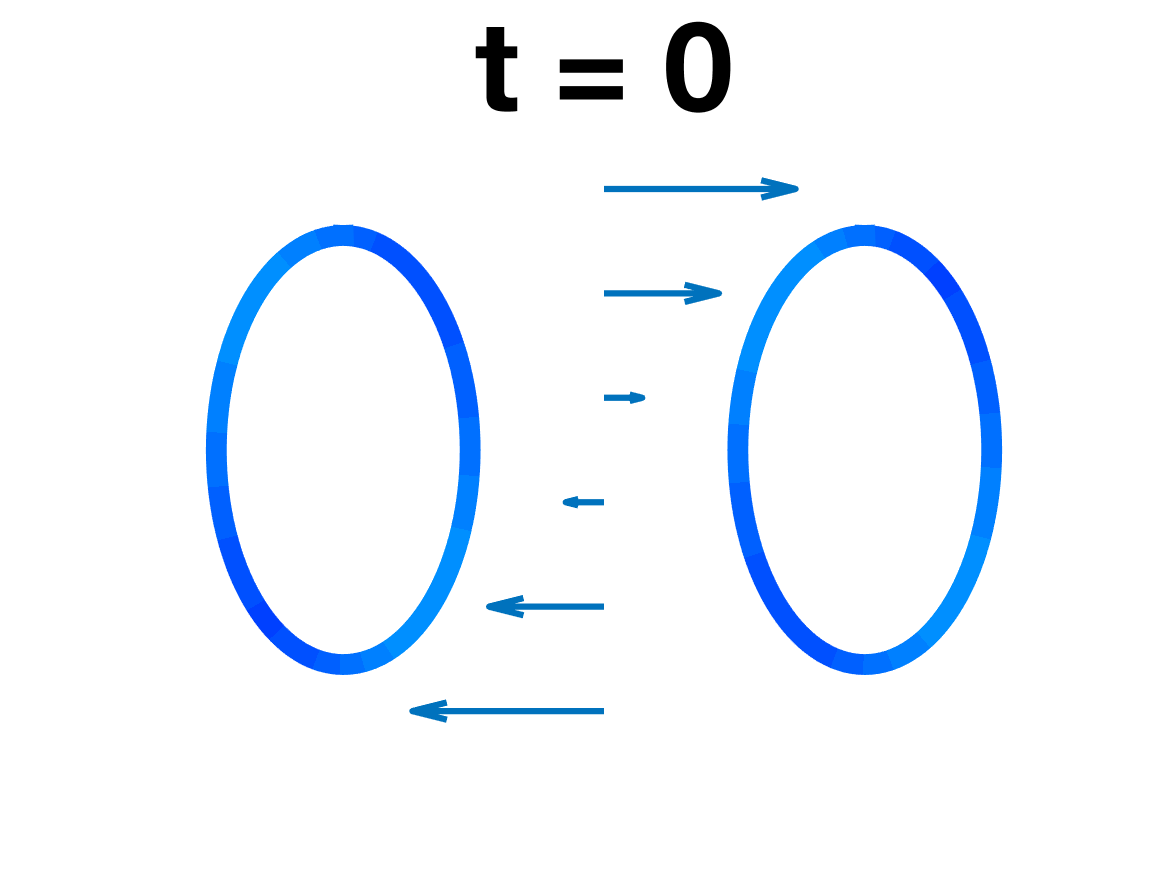
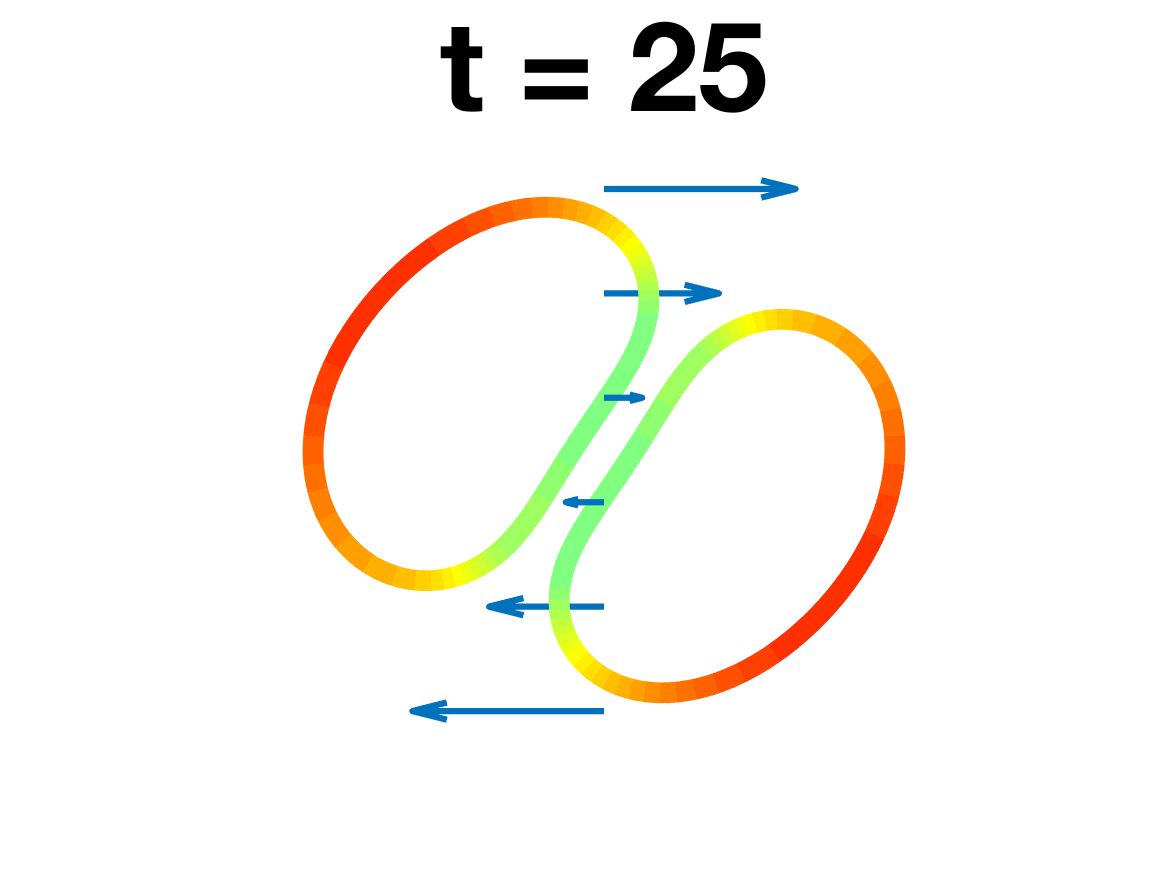
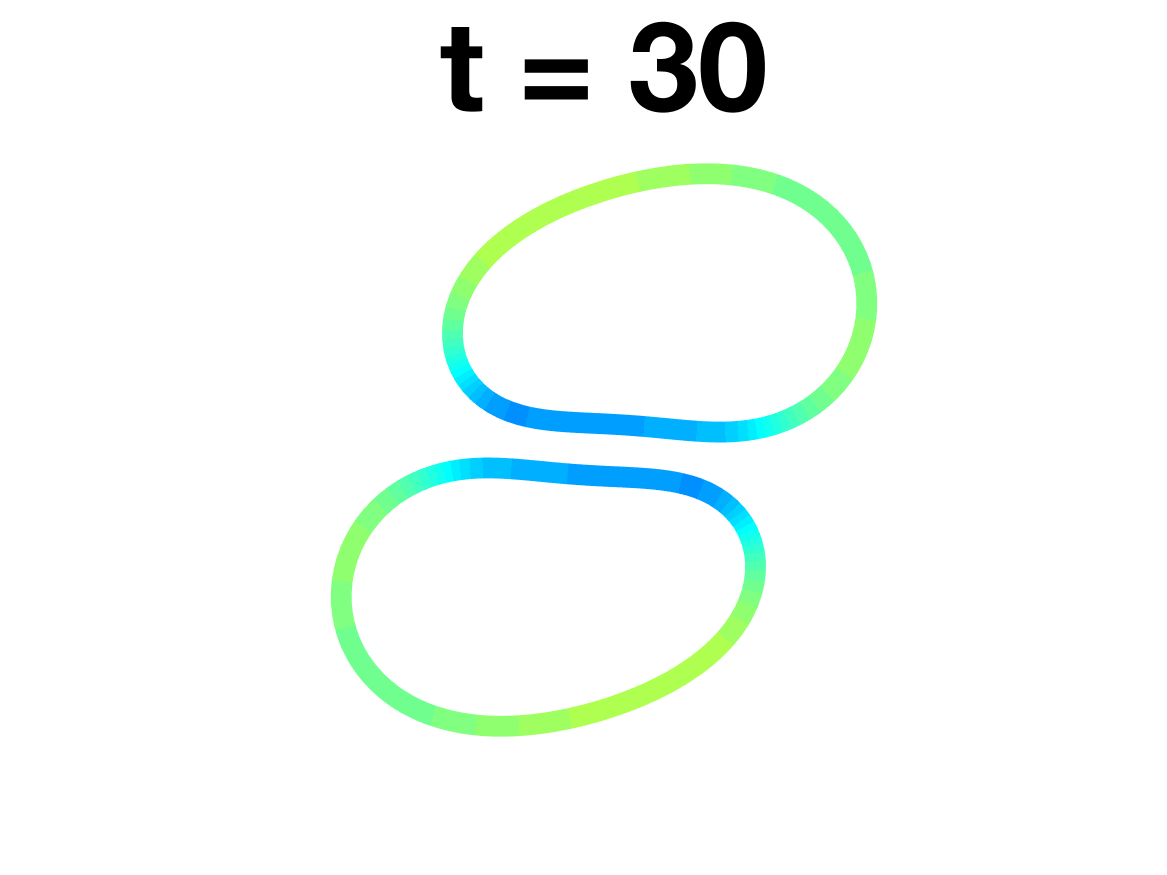
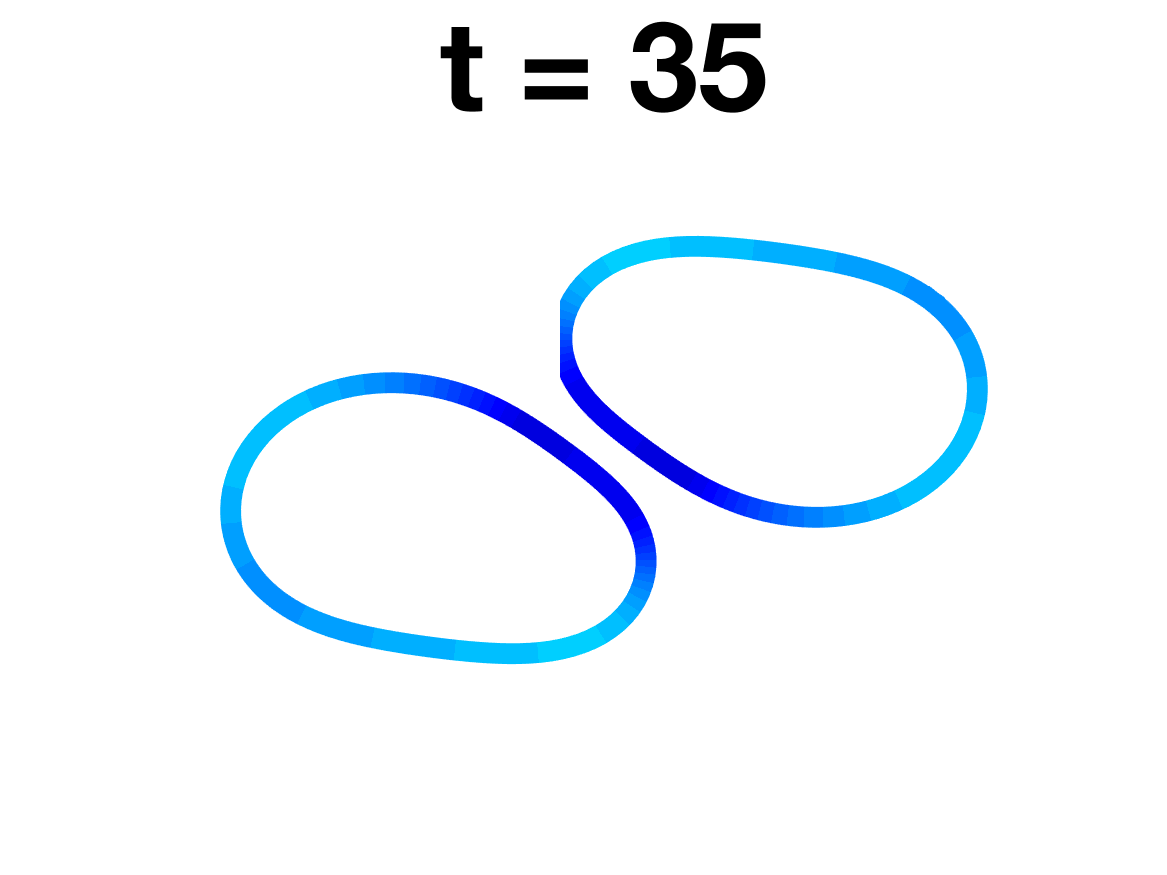
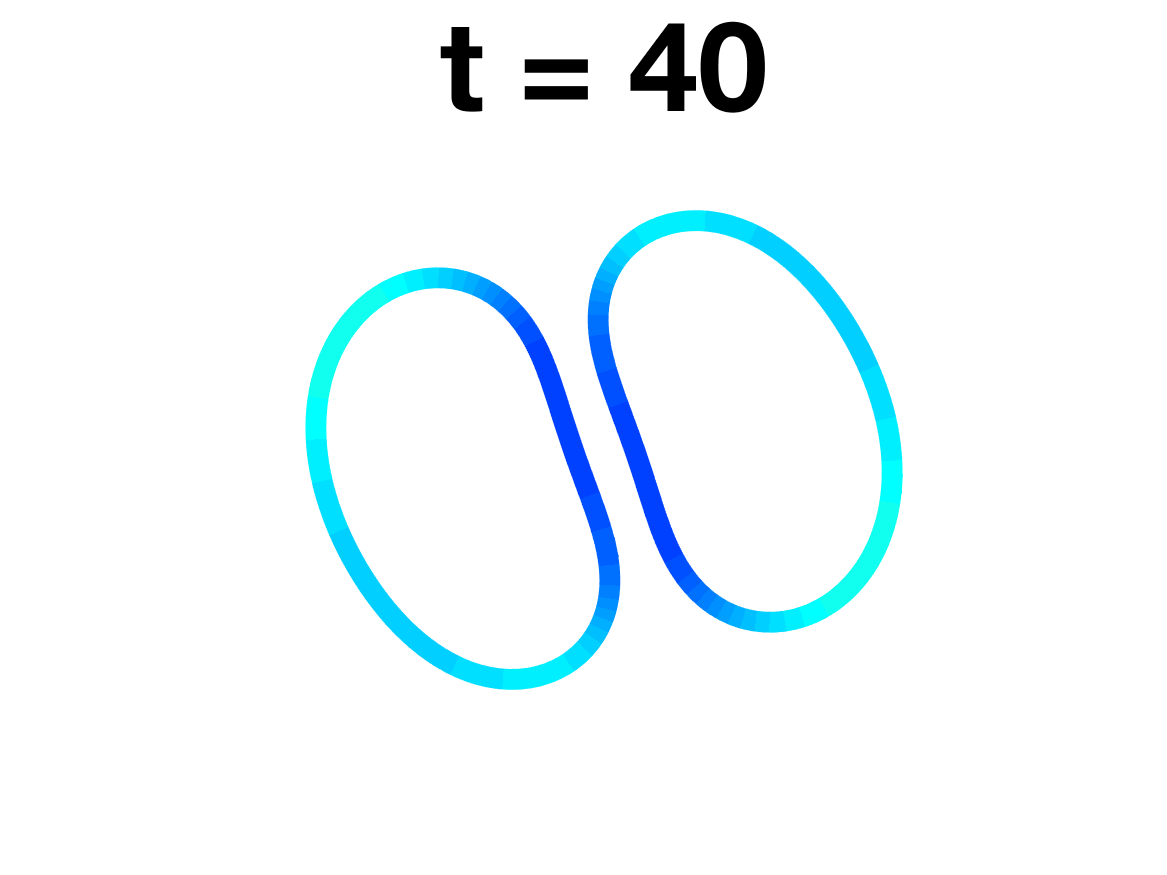
We consider two vesicles under a planar shear flow , where is the shear rate. To be consistent with simulations in previous sections, the vesicles have a length of for all reduced areas. The initial placement of the vesicles is chosen so that the flow dives them towards one another in a head-on collision. In the absence of adhesion, two vesicles deform significantly as they collide head-on, deflect to opposite sides of the -axis as they pass one another, and then separate. This head-on collision process of two vesicles or capsules in a planar shear flow is found to be similar between two- Breyiannis and Pozrikidis (2000); Rahimian et al. (2010) and three-dimensions Lac et al. (2007); Lac and Barthes-Biesel (2008); Omori et al. (2013); Rahimian et al. (2015). However, in the presence of adhesion, the vesicles can form a doublet for certain values of the separation distance , Hamaker constant , shear rate , and reduced area . If a doublet does form, then it undergoes a periodic motion with a period that depends on the same parameters.
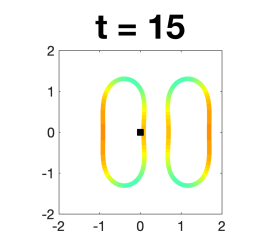
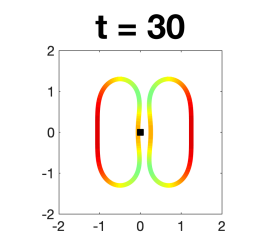
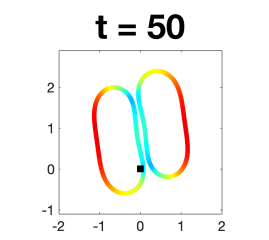
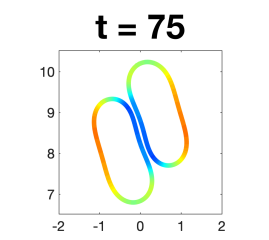
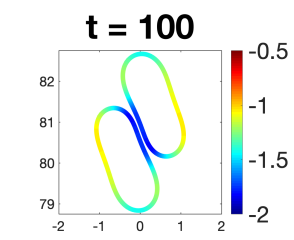
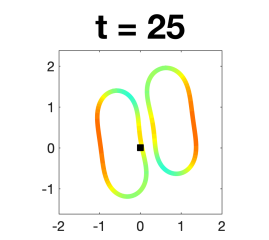
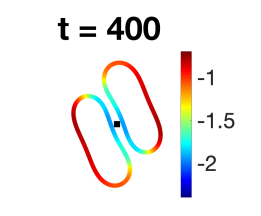
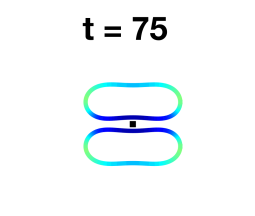
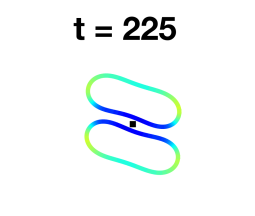
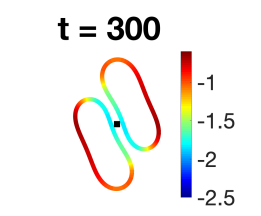
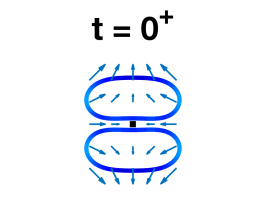
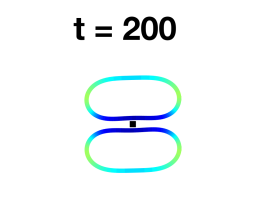
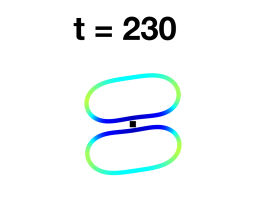
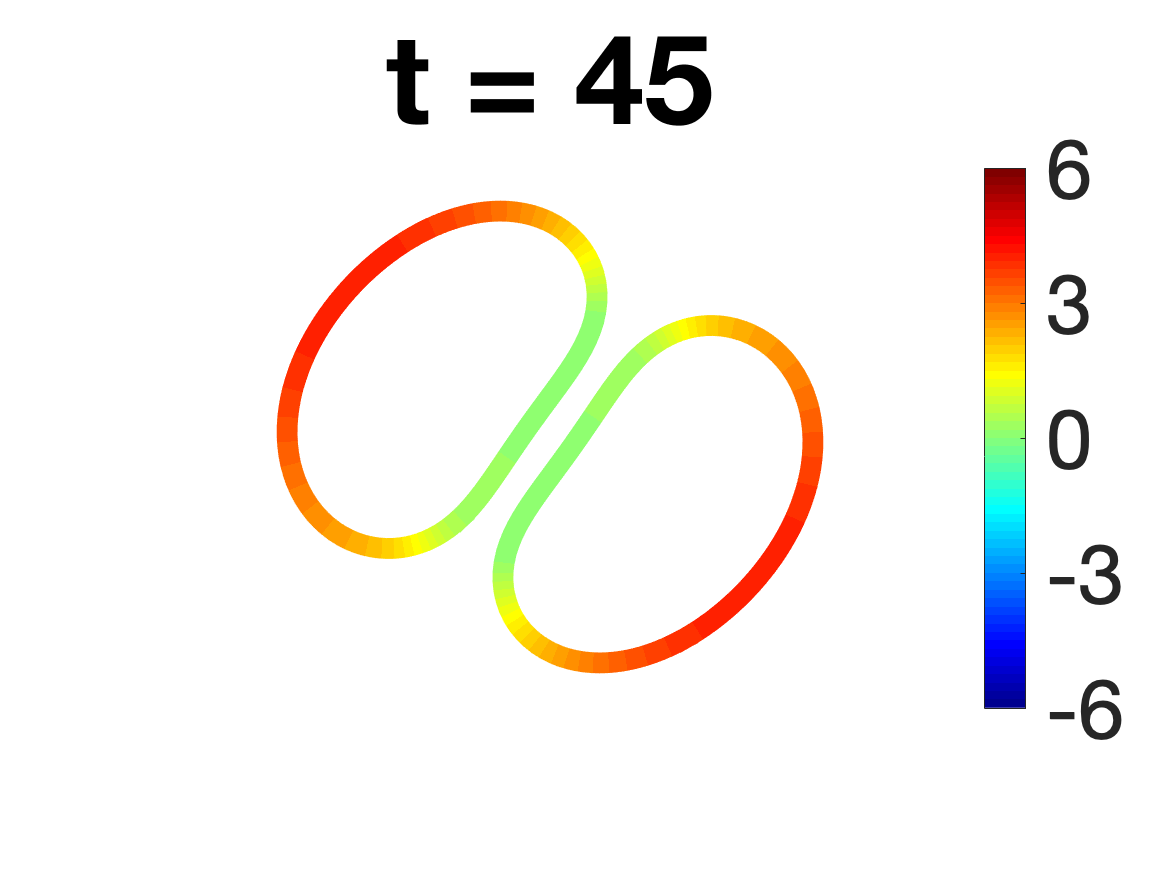
Figures 11 and 12 show snapshots of two vesicles that have formed a doublet and the color coding is the tension along the vesicles. Each of the vesicles have reduced area , shear rate , separation distance , and Hamaker constant (Figure 11) and (Figure 12). Similar to the quiescent example, the membrane tension is negative in the contact region indicating that the membrane is being compressed when the adhesive force is strongest. The two values for the Hamaker constant are chosen since the oscillation period of the vesicle doublet dynamics is both . For both cases the vesicles in the doublet move in tandem with a tank-reading motion that is much slower than the tank-treading motion that occurs in the absence of adhesion. However, the dynamics of a single period for these two Hamaker constants differ significantly. For the individual vesicles undergo a sliding motion as they pass one another (Figure 11). However, for , once the contact region is formed, the doublet maintains the same structure and undergoes a tumbling dynamic similar to a Jeffery orbit.
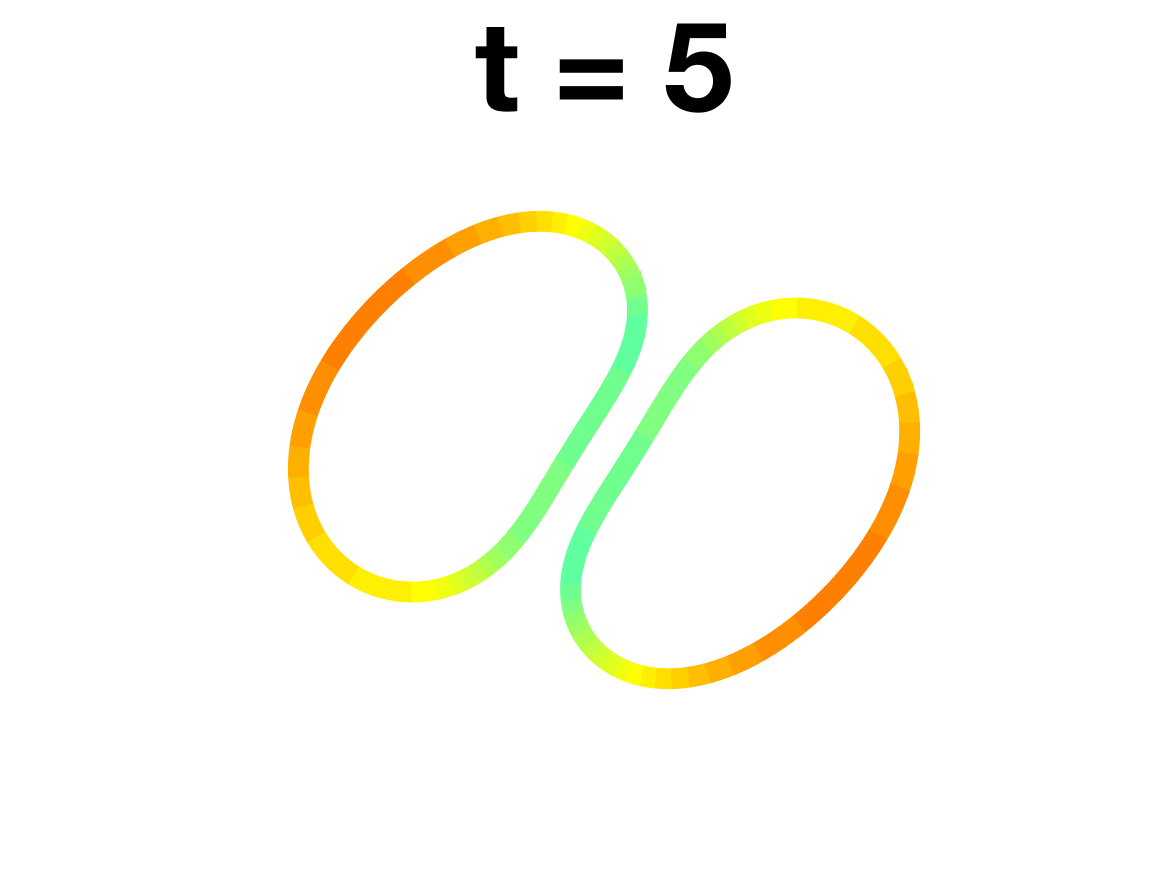
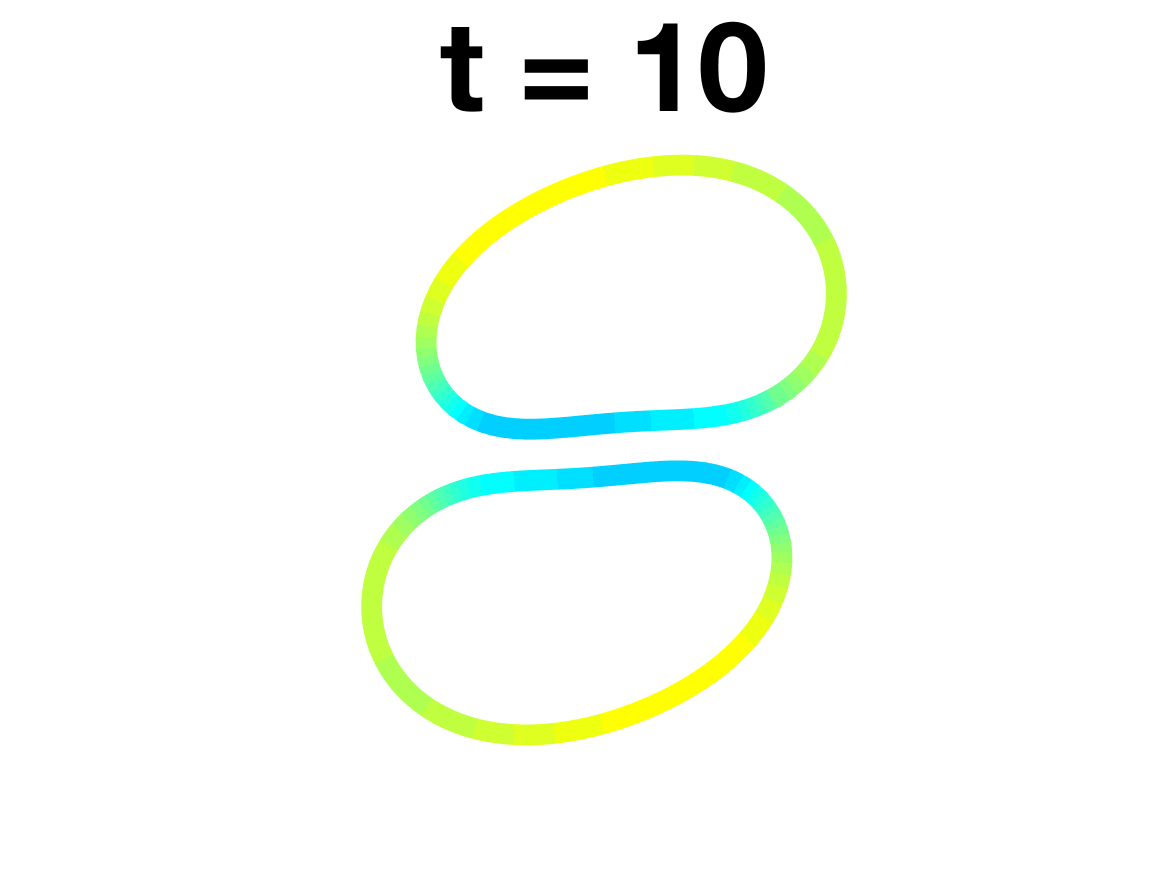
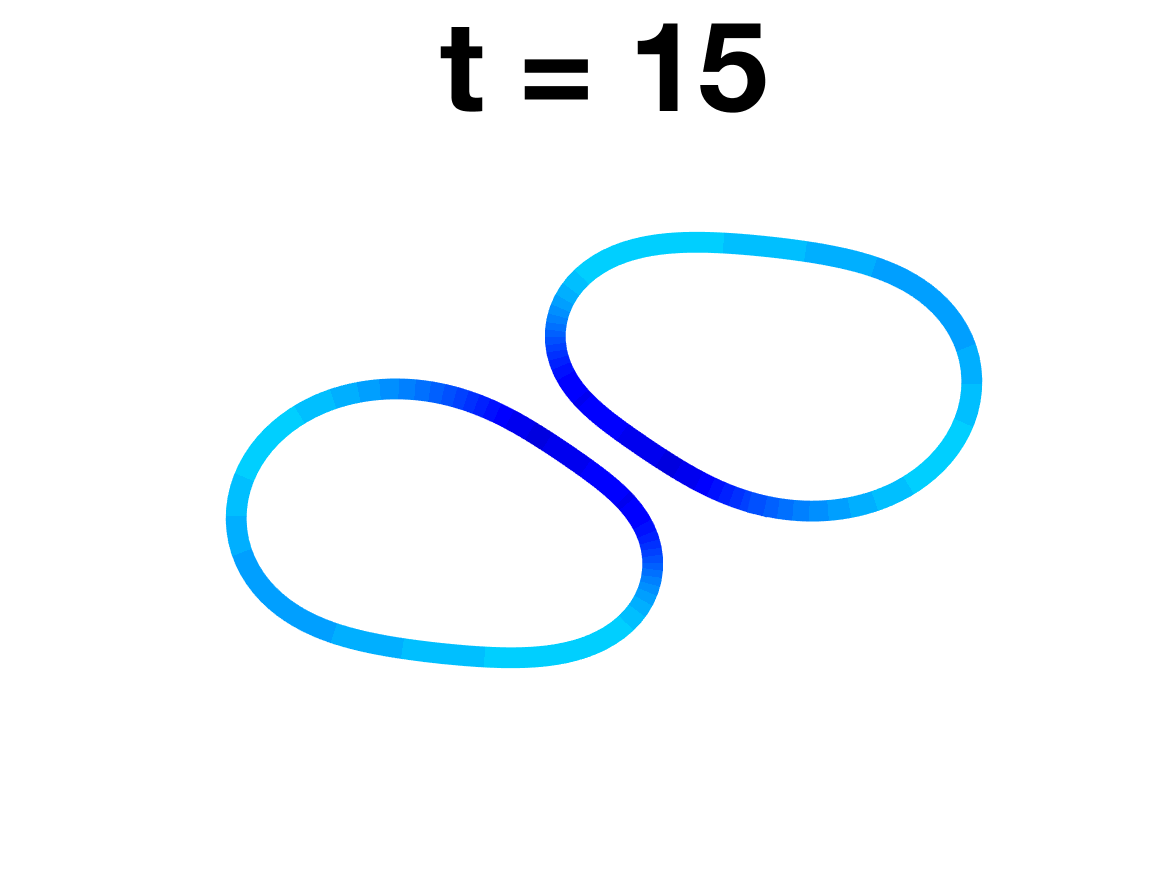
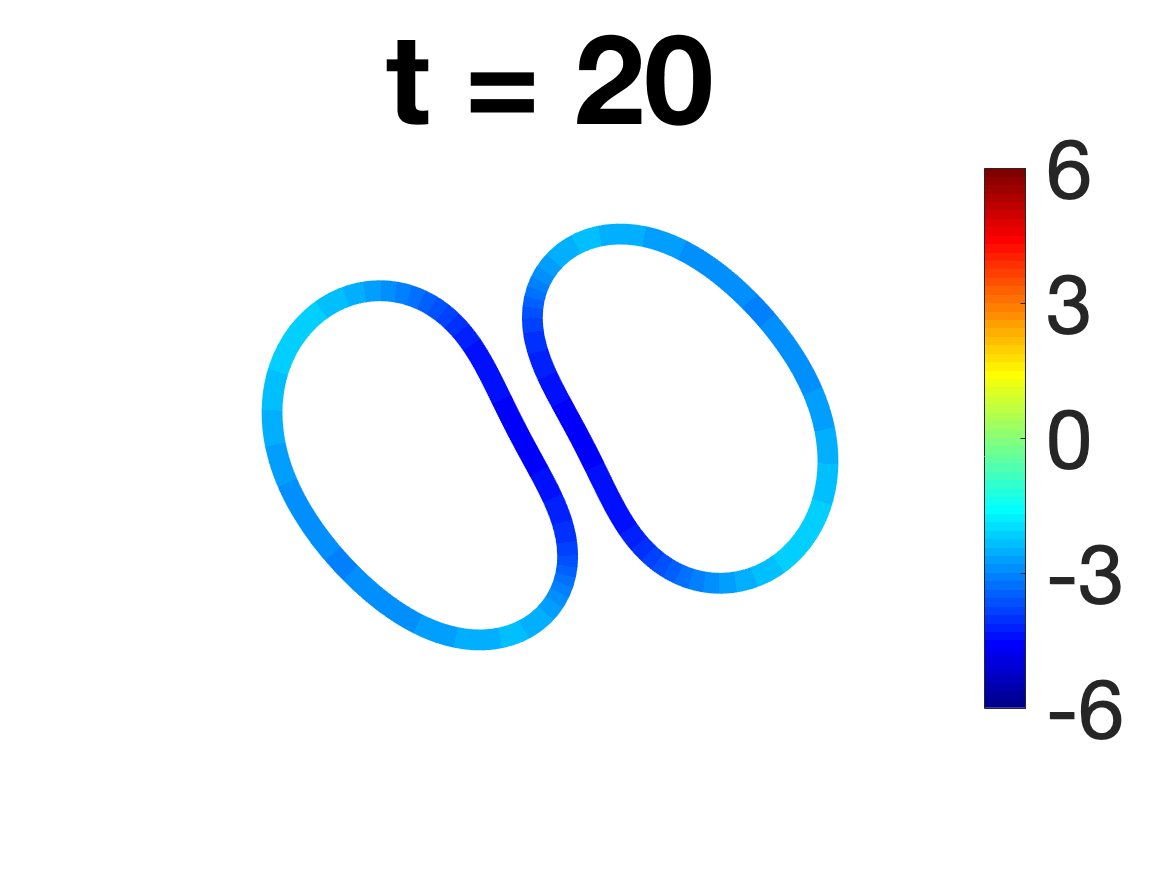
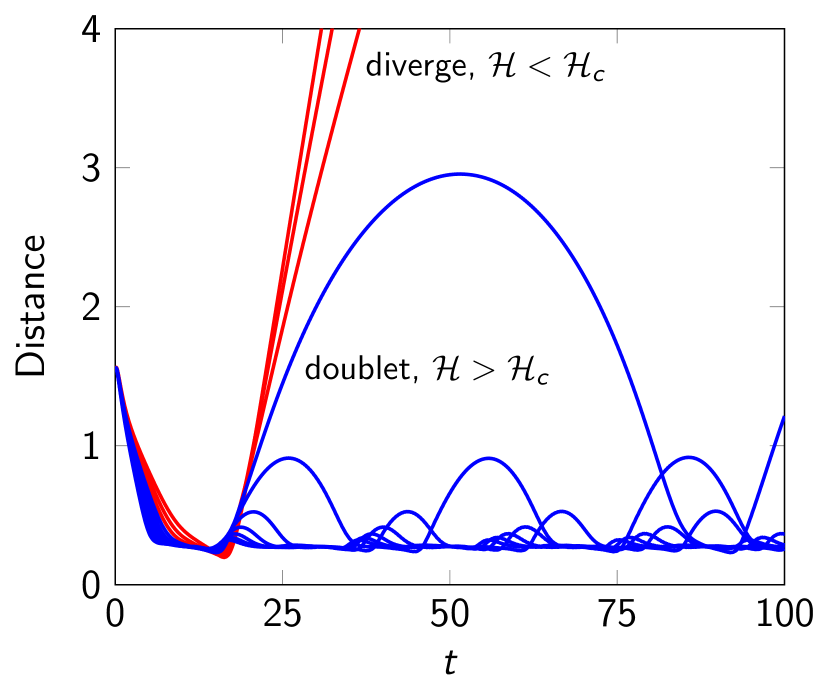
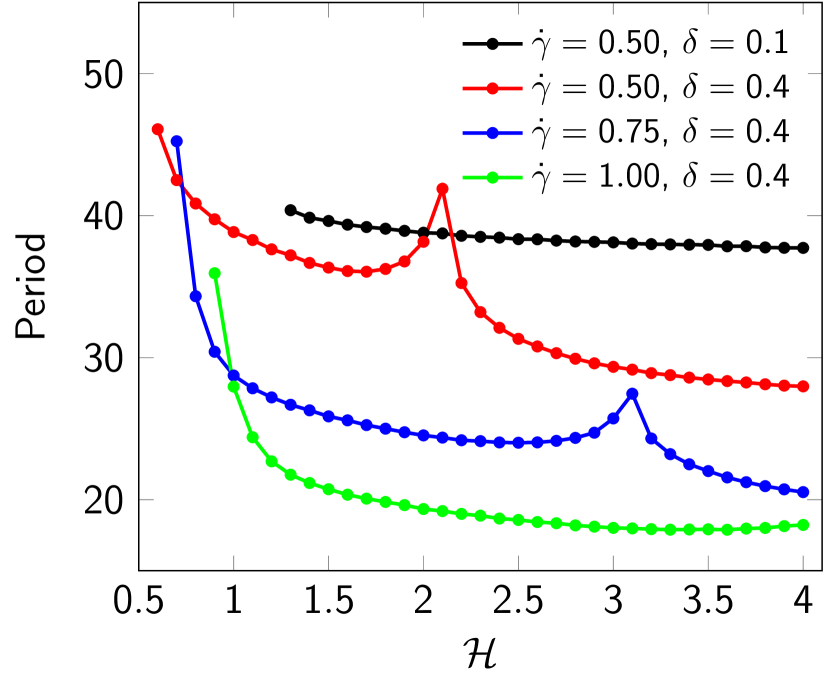
To further understand the formation of the doublet, we compute the minimum distance between two vesicles with reduced area , separation distance , and shear rate . Figure 13(a) shows this distance as a function of time for varying Hamaker constants. For Hamaker constants less than a critical value, , the adhesive force is not strong enough to form a doublet, and the distance between the vesicles grows with time (red curves). However, when , the adhesive force is sufficiently strong to bind the vesicles into a doublet, and then the doublet undergoes a periodic motion (blue curves). In Figure 13(b), we plot the time required for the doublet to make a complete revolution for three different shear rates and two different separation distances. Initially, as the shear rate increases, the period decreases. However, the transition from the weakly adhesive doublet (Figure 11) to the stronger adhesive doublet (Figure 12) results in an increase in the period. Once the Hamaker constant is sufficiently strong that the contact region remains fixed throughout the dynamics, the period of the doublet again decreases as the shear rate increases.
 (a) (a)
|
 (b) (b)
|
Especially at the large Hamaker constants, the dynamics of the doublet resemble those of a Jeffery orbit. An ellipse with aspect ratio undergoes a periodic tumbling motion with period Jeffery (1922)
| (7) |
Instead of measuring the aspect ratio of a doublet in a flow with shear rate , we use the computed period to define an effective aspect ratio that satisfies (7). Therefore, the effective aspect ratio is the aspect ratio of an ellipse in a shear flow that is undergoing a Jeffery orbit with period . For the Hamaker constants and , the shear rates, periods, and effective aspect ratio are summarized in Table 1, which illustrates that the effective aspect ratio of the doublet depends on both the Hamaker constant and the shear rate.
| 0.50 | 36.34 | 2.49 |
| 0.75 | 25.86 | 2.72 |
| 1.00 | 20.73 | 2.96 |
| 0.50 | 28.46 | 1.66 |
| 0.75 | 22.01 | 2.17 |
| 1.00 | 17.91 | 2.44 |
Furthermore the oscillatory dynamics in Figure 11 and Figure 12 illustrate that for similar oscillation periods, the actual aspect ratio of the vesicle doublet may be a dynamical variable as well. This indicates that the vesicle doublet’s oscillatory dynamics in a shear flow is more complicated than the Jeffery orbit of a rigid body.
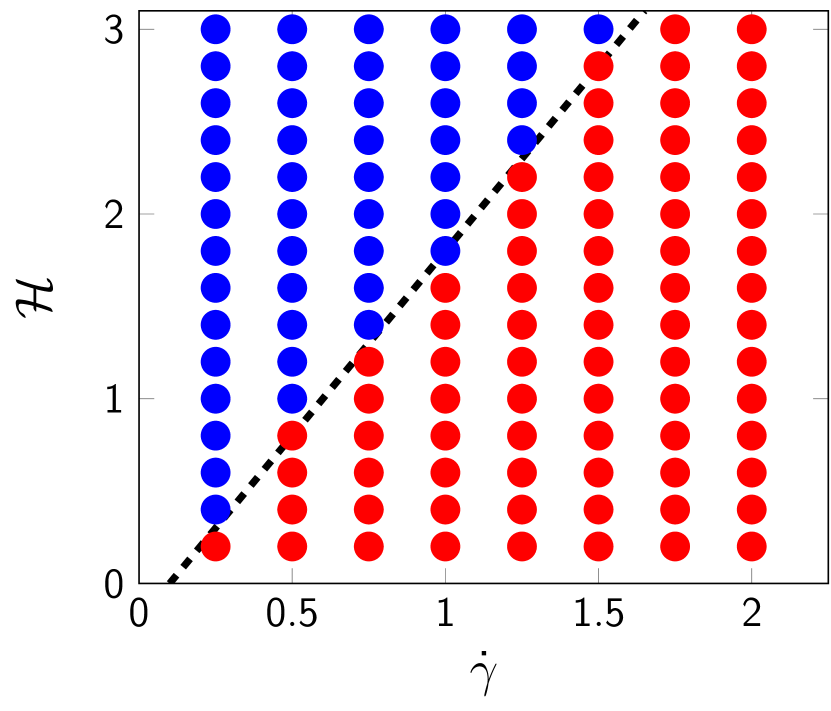
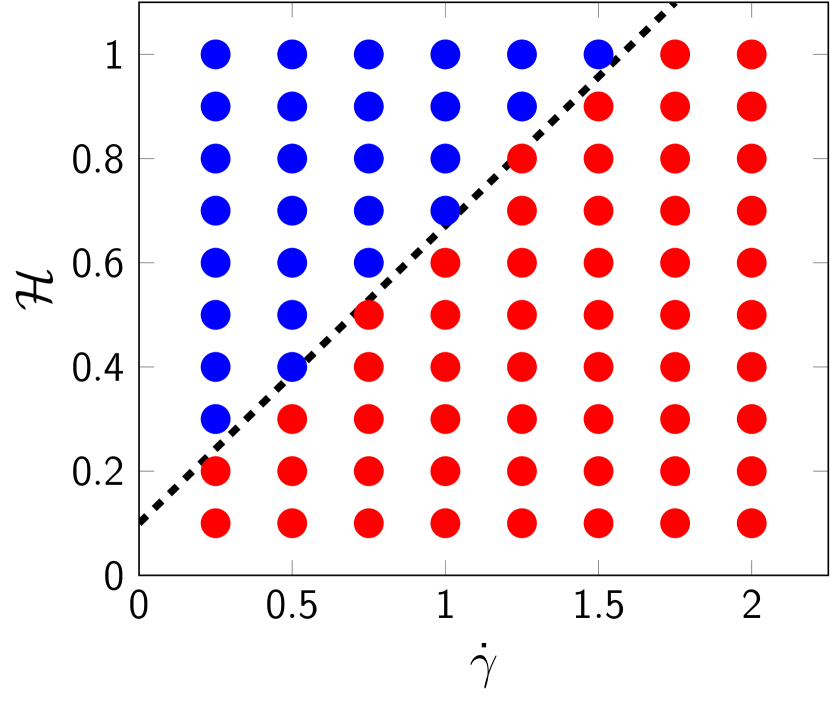
Next, for several shear rates, we determine the critical Hamaker constant, , that determines if the vesicles form a doublet or separate. Figure 14 indicates whether a doublet with is formed (blue) or not (red) for two different separation distances. The plot includes a line of best fit between the stable and unstable regions. Since the transition is linear for both separation distances, this indicates that a dimensionless number involving the ratio of the Hamaker constant and shear rate could be used to determine if a doublet forms or not. We note that the critical Hamaker constant also depends on the reduced area. For smaller reduced areas, we expect a smaller contact region to form and this will lower the Hamaker constant, and this behavior will be investigated in future work.
 (a) (a)
|
 (b) (b)
|
Finally, we investigate the rheology of a suspension of a doublet by computing the effective viscosity of a doublet and compare it to the effective viscosity of a single tank-treading vesicle. The effective viscosity is defined as the viscosity of a homogeneous Newtonian fluid with the same energy dissipation per macroscopic element of fluid. In a simple shear flow, the intrinsic viscosity, is
where
is the area fraction of vesicles, is the stress due to the vesicles, is the spatial average, is the total area of both vesicles, and is the traction as defined in equation (8).
 (a) (a)
|
 (b) (b)
|


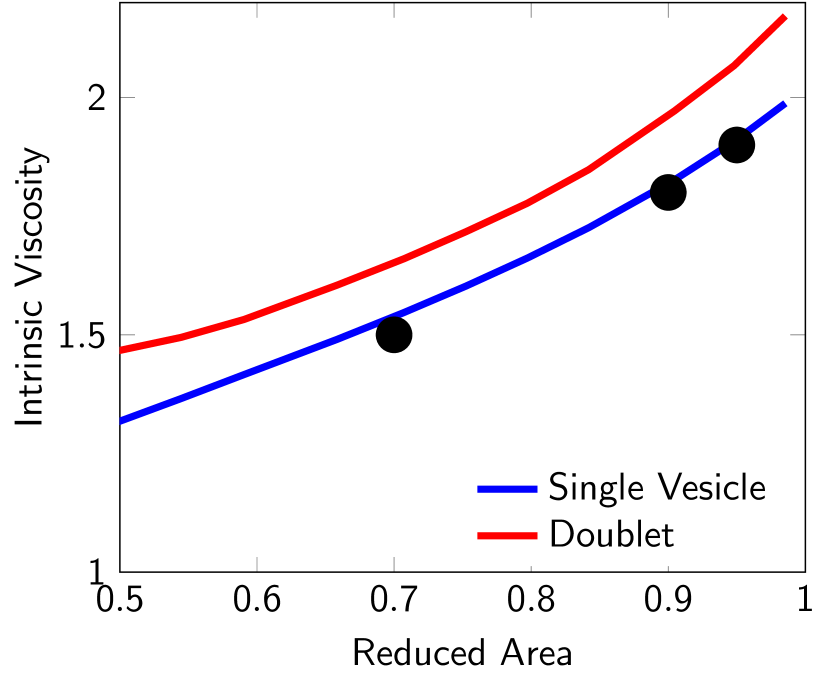
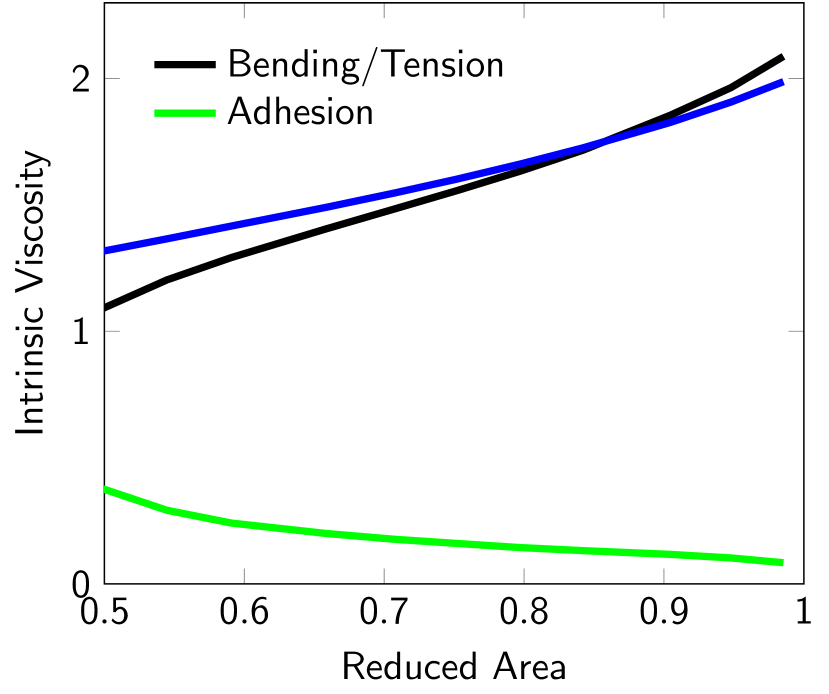
In Figure 15(a), we compare the intrinsic viscosity of a single tank-treading vesicle to a doublet with Hamaker constant , separation distance , and shear rate . To validate our simulations, we superimpose (black marks) the intrinsic viscosity calculated by Ghigliotti et al. Ghigliotti et al. (2010). The presence of the doublet slightly increases the intrinsic viscosity at all the reduced areas. We also compute the intrinsic viscosity of a doublet with , , and . Again, this doublet has a similar period to the case . At this larger Hamaker constant, the effective viscosity increases slightly from to . To further characterize the effect of adhesion, in Figure 15(b) we decompose the intrinsic viscosity into the contributions from the bending and tension (black), and the contribution from the adhesion (green). We also superimpose the intrinsic viscosity of a single tank-treading vesicle (blue) to demonstrate that the bending and tension of the doublet behave similarly, but not identically, to a dilute suspensions of non-adhering tank-treading vesicles. We see that the effect of the adhesion on the intrinsic viscosity is largest for vesicles with small reduced areas. We also decompose the intrinsic viscosity contributions of the doublet with and . When compared with the smaller Hamaker constant, the intrinsic viscosity contribution due to bending and tension is reduced from to , and the contribution due to adhesion is increased from to . Therefore, as the Hamaker constant increases, the increase in the intrinsic viscosity is due to the adhesive force rather than the bending and tension.
VI Conclusions
In this work we use a boundary integral formulation with adaptive time-stepping to simulate hydrodynamics of two vesicles with adhesive interactions. In a quiescent flow, two vesicles that are initially sufficiently far apart move towards each other under a long-range attraction. We use a lubrication theory to estimate the time required to reach the separation distance , and the theoretical scaling is in good agreement with numerical results. Once two membranes are within separation distance , the adhesive force turns repulsive and the membranes flatten to form a contact region. Our simulations show that the membranes in the contact region are actually curved with end points at the shortest distance, consistent with results for moderate adhesion strength in Flormann et al. (2017). Once a vesicle doublet forms, we examine the dependence of membrane bending and adhesion energies on the reduced area, the Hamaker constant, and the separation distance.
Next we conduct numerical simulations of two vesicles in a planar extensional flow. With initial configurations where two vesicles collide around the stagnation point (one vesicle at the stagnation point and the other vesicle placed close to the converging axis), the two vesicles form a doublet and stay around the flow center only when two vesicles collide head-on with no displacement . For we find that the vesicles rotate and move away from the stagnation point, and eventually move farther from each other due to the strong diverging flow in the far-field.
This inspires us to conduct a numerical experiment where a vesicle doublet is placed at the center of a fluid trap, which can be actively controlled in microfluidic channel so that fluid trap center is effectively the stagnation point of an extensional flow characterized by a extensional flow rate. At low flow rate, we find the doublet to rotate nearly ninety degrees to align with the flow such that the long axis of the doublet is parallel to the divergent axis and the convergent stream is pushing the two vesicles together. As the flow rate increases, the vesicle doublet rotates less, and when the flow rate exceeds the critical value, the diverging flow breaks the doublet structure by pulling the vesicles apart. These results indicate that it is possible to use the fluid trap to separate a vesicle doublet under adhesion, and thus provide a means to probe the adhesion strength between membranes. For a pair of -sized vesicles with a bending modulus of , an extensional flow rate of is expected to separate a vesicle doublet with reduced area of and a Hamaker constant , which corresponds to . These conditions are quite realizable in microfluidic experiments, and we hope that our simulations will inspire microfluidic experiments to be designed to measure membrane-membrane adhesion.
We also examine how adhesive interaction may dynamically lead to the formation of a vesicle doublet. We simulate two vesicles approaching each other in a planar shear flow, and examine how their adhesive interactions lead to doublet formation. Once a doublet forms, the two vesicle membranes rotate around each other as they deform dynamically. The usual tank-treading motion of a vesicle under shear flow is not observed in each of the two vesicles. We compute the effective shear viscosity of a dilute suspension of vesicle doublets, and found it to be more than twice the effective shear viscosity of a dilute suspension of single vesicles. Furthermore, we find that the membrane adhesion contribution to the shear viscosity increases with decreasing reduced area while the bending/tension contribution increases with the reduced area.
In our formulation we did not include any electrostatic interactions between membranes under adhesion. When the electrostatic interaction is important, an electro-osmotic pressure in the thin film is found to be responsible for the observed membrane undulation Steinkuhler et al. (2016). In addition, simulations presented in this work are for identical vesicles (same reduced area, length, and bending modulus) in the doublet. Flormann et al. demonstrated that asymmetric vesicle reduced area may lead to various equilibrium doublet shape such as male-female, asymmetric S-shape, and parachute shape. It is also possible that viscosity contrast may also lead to different equilibrium doublet shapes. Future work includes three dimensional simulations, dispersive vesicle properties (such as reduced area and bending modulus), viscosity contrast, and effects of confinement on adhesive interactions. Another future direction is to consider the clustering and packing of an unbounded suspension of vesicles Flormann et al. (2017).
Finally, it is not clear how thermal fluctuations may affect the hydrodynamics of vesicles under adhesion. For example, does the fluctuating hydrodynamics in the thin film between two vesicles enhance adhesion to keep vesicles bound under linear flows as speculated in cells Fenz et al. (2017)? Recently Liu et al. Liu et al. (2019) used immersed boundary simulations to show that, at a separation distance of tens of nanometers, the thin film between the two membranes facilitates the coupling between membranes via strong hydrodynamic interactions. In particular, they demonstrate numerically that the fluctuation in one membrane is highly correlated to the other membrane without any physical contact. We are actively pursuing this direction with hydrodynamic modeling and simulations of adhesive membranes with thermal fluctuations.
Acknowledgements.
BQ acknowledges support from Florida State University startup funds and Simons Foundation Mathematics and Physical Sciences-Collaboration Grants for Mathematicians 527139. SV acknowledges support from NSF under grants DMS-1719834 and DMS-1454010. YNY acknowledges support from NSF-DMS 1614863 and NSF-DMS 1412789. Both SV and YNY were also supported by the Flatiron Institute, a division of Simons Foundation. BQ and YNY contributed equally to model development and simulations. BQ developed the code. All authors contributed equally to writing the manuscript.Appendix A Integral Equation Formulation
Using potential theory and following Veerapaneni et al. (2009), we recast the governing equations (1) as integro-differential equations for the evolution of membrane positions:
where the single-layer potential is defined by
and the membrane force is a sum of the bending, tension and, adhesion forces:
| (8) |
Defining the bending operator as , the tension operator , and using IMEX-Euler, the no-slip boundary results in the time stepping method
and the inextensibility constraint that is discretized as
We discretize the vesicles at a set of collocation points, compute the bending and tension terms with Fourier differentiation, and apply Alpert quadrature Alpert (1999) to the weakly-singular single-layer potential . The source and target points of the adhesion force never coincide since they are always on different vesicles, so the adhesion force (3) is computed with the spectrally accurate trapezoid rule Trefethen and Weideman (2014).
The dynamics of a doublet undergoes many different time scales over time horizons that are sufficiently large to characterize the formation of a doublet and its rheological properties. Therefore, time adaptivity is crucial so that a user-specified tolerance is achieved without using a guess-and-check procedure to find an appropriately small fixed time step size. To control the error and achieve second-order accuracy in time, we use a time adaptive spectral deferred correction method that applies IMEX-Euler twice per time step Quaife and Biros (2016).
Appendix B Adhesion Force
Consider a suspension of two vesicles and parameterized as and , respectively, with . Here is the arclength, and we have assumed, without loss of generality, that both vesicles have length one. We use the L.-J. type potential
where is the distance between two points on a pair of vesicles. Then, we define the total adhesive energy on to be
Perturbing to results in a new vesicle , and the perturbed adhesive energy is
and the change in the energy is
We now decompose the perturbation into normal and tangential components as . The perturbed arclength term, to leading order, is
where is the curvature. To leading order, inextensible perturbations satisfy , so the arclength term of and are identical to leading order. Therefore,
and the adhesive force applied by vesicle 2 on vesicle 1 is
When , the above expression becomes
A similar expression holds for the adhesive force applied by vesicle 1 on vesicle 2, and equation (3) gives the adhesive force for a suspension of vesicles.
References
- Sackmann (1996) E. Sackmann, “Supported Membranes: Scientific and Practical Applications,” Science 271, 43–48 (1996).
- Fenz and Sengupta (2012) S. F. Fenz and K. Sengupta, “Giant vesicles as cell models,” Integr. Biol. 4, 982–995 (2012).
- Barthes-Biesel (2016) D. Barthes-Biesel, “Motion and deformation of elastic capsules and vesicles in flow,” Annu. Rev. Fluid Mech. 48, 23–52 (2016).
- Dobereiner (2000) H.-G. Dobereiner, “Properties of giant vesicles,” Current Opinion Colloid Int. Sci. 5, 256–263 (2000).
- Evans et al. (2013) E. Evans, W. Rawicz, and B. A. Smith, “Concluding remarks back to the future: mechanics and thermodynamics of lipid biomembrane,” Faraday Discussions 161, 591–611 (2013).
- Sugiyama and Toyota (2018) H. Sugiyama and T. Toyota, “Toward experimental evolution with giant vesicles,” Life 8, 53 (2018).
- Barthes-Biesel and Rallison (1981) D. Barthes-Biesel and J. M. Rallison, “The time-dependent deformation of a capsule freely suspended in a linear shear flow,” Journal of Fluid Mechanics 113, 251–267 (1981).
- Misbah (2006) C. Misbah, “Vascillating breathing and tumbling of vesicles under shear flow,” Physical Review Letters 96, 028104 (2006).
- Vlahovska and Gracia (2007) P. M. Vlahovska and R. Gracia, “Dynamics of a viscous vesicle in linear flows,” Physical Review E 75, 016313 (2007).
- Finken et al. (2008) R. Finken, A. Lamura, U. Seifert, and G. Gompper, “Two-dimensional fluctuating vesicles in linear shear flow,” European Physical Journal E 25, 309–321 (2008).
- Zhang et al. (2013) J. Zhang, J. Zahn, W. Tan, and H. Lin, “A transient solution for vesicle electrodeformation and relaxation,” Physics of Fluids 25, 071903 (2013).
- Nganguia and Young (2013) H. Nganguia and Y.-N. Young, “Equilibrium electrodeformation of a spheroidal vesicle in an ac electric field,” Physical Review E 88, 052718 (2013).
- Bagchi et al. (2005) P. Bagchi, P. C. Johnson, and A. S. Popel, “Computational fluid dynamic simulation of aggregation of deformable cells in a shear flow,” Journal of Biomechanical Engineering 127, 1070–1080 (2005).
- Biben (2005) T. Biben, “Phase-field models for free-boundary problems,” European Journal of Physics 26, 47–55 (2005).
- Veerapaneni et al. (2009) S. K. Veerapaneni, D. Gueyffier, D. Zorin, and G. Biros, “A boundary integral method for simulating the dynamics of inextensible vesicles suspended in a viscous fluid in 2D,” Journal of Computational Physics 228, 2334–2353 (2009).
- Seol et al. (2016) Y. Seol, W.-F. Hu, Y. Kim, and M.-C. Lai, “An immersed boundary method for simulating vesicle dynamics in three dimensions,” Journal of Computational Physics 322, 125–141 (2016).
- Veerapaneni et al. (2011) S. Veerapaneni, Y.-N. Young, P. M. Vlahovska, and J. Błazdzwicz, “Dynamics of a compound vesicle in shear flow,” Physical Review Letters 106, 158103 (2011).
- Vitkova et al. (2008) V. Vitkova, M. Mader, B. Polack, C. Misbah, and T. Podgorski, “Micro-macro link in rheology of erythrocyte and vesicle suspensions,” Biophysical Journal 95, L33–L35 (2008).
- Ghigliotti et al. (2010) G. Ghigliotti, T. Biben, and C. Misbah, “Rheology of a dilute two-dimensional suspension of vesicles,” Journal of Fluid Mechanics 653, 489–518 (2010).
- Deschamps et al. (2009) J. Deschamps, V. Kantsler, E. Serge, and V. Steinberg, “Dynamics of a vesicle in general flow,” Proc. Nat. Acad. Sci. 106, 11444–11447 (2009).
- Kantsler et al. (2008a) V. Kantsler, E. Segre, and V. Steinberg, “Dynamics of interacting vesicles and rheology of vesicle suspension in shear flow,” Europhysics Letters 82, 58005 (2008a).
- Zabusky et al. (2011) N. Zabusky, E. Segre, J. Deschamps, V. Kantsler, and V. Steinberg, “Dynamics of vesicles in shear and rotational flows: modal dynamics and phase diagram,” Physics of Fluids 23, 041905 (2011).
- Kantsler et al. (2008b) V. Kantsler, E. Segre, and V. Steinberg, “Critical dynamics of vesicle stretching transition in elongational flow,” Physical Review Letters 101, 048101 (2008b).
- Zhao and Shaqfeh (2011) H. Zhao and E. S. G. Shaqfeh, “The dynamics of a vesicle in simple shear flow,” Journal of Fluid Mechanics 674, 578–604 (2011).
- Spann et al. (2014) A. P. Spann, H. Zhao, and E. S. G. Shaqfeh, “Loop subdivision surface boundary integral method simulations of vesicles at low reduced volume ratio in shear and extensional flow,” Physics of Fluids 16, 031902 (2014).
- Zhao and Shaqfeh (2013) H. Zhao and E. S. G. Shaqfeh, “The shape stability of a lipid vesicle in a uniaxial extensional flow,” Journal of Fluid Mechanics 719, 345–361 (2013).
- Narsimhan et al. (2014) V. Narsimhan, A. P. Spann, and E. S. G. Shaqfeh, “The mechanism of shape instability for a vesicle in extensional flow,” Journal of Fluid Mechanics 750, 144–190 (2014).
- Dahl et al. (2016) J. B. Dahl, V. Narsimhan, B. Gouveia, S. Kumar, E. S. G. Shaqfeh, and S. J. Muller, “Experimental observation of the asymmetric instability of intermediate-reduced-volume vesicles in extensional flow,” Soft Matter 12, 3787–3796 (2016).
- Ziherl (2007) P. Ziherl, “Aggregates of Two-Dimensional Vesicles: Rouleaux, Sheets, and Convergent Extension,” Physical Review Letters 99, 128102 (2007).
- Ziherl and Svetina (2007) P. Ziherl and S. Svetina, “Flat and sigmoidally curved contact zones in vesicle-vesicle adhesion,” Proceedings of the National Academy of Sciences 104, 761–765 (2007).
- Svetina and Ziherl (2008) S. Svetina and P. Ziherl, “Morphology of small aggregates of red blood cells,” Bioelectrochemistry 73, 84–91 (2008).
- Gu et al. (2016) R. Gu, X. Wang, and M. Gunzburger, “A two phase field model for tracking vesicle-vesicle adhesion,” Math. Biol. 73, 1293–1319 (2016).
- Flormann et al. (2017) D. Flormann, O. Aouane, L. Kaestner, C. Ruloff, C. Misbah, T. Podgorski, and C. Wagner, “The buckling instability of aggregating red blood cells,” Scientific Reports 7, 7928 (2017).
- Hoore et al. (2018) M. Hoore, F. Yaya, T. Podgorski, C. Wagner, G. Gompper, and D. A. Fedosov, “Effect of spectrin network elasticity on the shapes of erythrocyte doublets,” Soft Matt. 14, 6278–6289 (2018).
- Brust et al. (2014) M. Brust, O. Aouane, M. Thiébaud, D. Flormann, C. Verdier, L. Kaestner, M. W. Laschke, H. Selmi, A. Benyoussef, T. Podgorski, G. Coupier, C. Misbah, and C. Wagner, “The plasma protein fibrinogen stabilizes clusters of red blood cells in microcapillary flows,” Scientific Reports 4, 4348 (2014).
- Clavería et al. (2017) Viviana Clavería, Othmane Aouane, Marine Thiébaud, Manouk Abkarian, Gwennou Coupier, Chaouqi Misbah, Thomas John, and Christian Wagner, “Clusters of red blood cells in microcapillary flow: hydrodynamic versus macromolecule induced interaction,” Soft Matter 12, 8235–8245 (2017).
- Chien et al. (1967) Shu Chien, Shunichi Usami, Robert J. Dellenback, Magnus I. Gregersen, Luddo B. Nanninga, and M. Mason Guest, “Blood Viscosity: Influence of Erythrocyte Aggregation,” Science 157, 829–831 (1967).
- Rahimian et al. (2010) A. Rahimian, S. K. Veerapaneni, and G. Biros, “Dynamic simulation of locally inextensible vesicles suspended in an arbitrary two-dimensional domain, a boundary integral method,” Journal of Computational Physics 229, 6466–6484 (2010).
- Neu and Meiselman (2002) B. Neu and H. J. Meiselman, “Depletion-Mediated Red Blood Cell Aggregation in Polymer Solutions,” Biophysical Journal 83, 2482–2490 (2002).
- Evans and Metcalfe (1984) E. Evans and M. Metcalfe, “Free energy potential for aggregation of giant, neutral lipid bilayer vesicles by Van der Waals attraction,” Biophysical Journal 46, 423–426 (1984).
- Evans (1988) E. Evans, Physical basis of cell-cell adhesion, edited by P. Bongrand (CRC Press, 1988).
- Israelachvili (1991) J. Israelachvili, Intermolecular and surface forces (Academic Press Inc., San Diego, 1991).
- Perutkova et al. (2013) S. Perutkova, M. Frank-Bertoncelj, B. Rozman, V. Kralj-Iglic, and A. Iglic, “Influence of ionic strength and beta2-glycoprotein i concentration on agglutination of like-charged phospholipid membranes,” Colloids and Surfaces B: Biointerfaces 111, 699–706 (2013).
- Seifert and Lipowsky (1990) U. Seifert and R. Lipowsky, “Adhesion of vesicles,” Physical Review A 42, 4768 (1990).
- Bernard et al. (2000) A.-L. Bernard, M.-A. Guedeau-Boudeville, L. Jullien, and J.-M. di Meglio, “Strong adhesion of giant vesicles on surface and permeability,” Langmuir 16, 6809–6820 (2000).
- Shi et al. (2006) W. Shi, X. Q. Feng, and H. Gao, “Two-dimensional model of vesicle adhesion on curved substrates,” Acta Mechanica Sinica 22, 529–535 (2006).
- Lin and Freund (2007) Y. Lin and L. B. Freund, “Forced detachment of a vesicle in adhesive contact with a substrate,” International Journal of Solids and Structures 44, 1927–1938 (2007).
- Gruhn et al. (2007) T. Gruhn, T. Franke, R. Dimova, and R. Lipowsky, “Novel method for measuring the adhesion energy of vesicles,” Langmuir 23, 5423–5429 (2007).
- Das and Du (2008) S. Das and Q. Du, “Adhesion of vesicles to curved substrates,” Physical Review E 77, 011907 (2008).
- Keh et al. (2014) M. P. Keh, J. Walter, and L. G. Leal, “Hydrodynamic interaction between a capsule and a solid boundary in unbounded stokes flow,” Phys. Fluids , 111903 (2014).
- Zhang et al. (2009) J. Zhang, S. Das, and Q. Du, “A phase field model for vesicle-substrate adhesion,” Journal of Computational Physics 228, 7837–7849 (2009).
- Agudo-Canalejo and Lipowsky (2015a) J. Agudo-Canalejo and R. Lipowsky, “Critical particle sizes for the Engulfment of Nanoparticles by Membranes and Vesicles with Bilayer Asymmetry,” ACS Nano Lett. 9, 3704–3720 (2015a).
- Agudo-Canalejo and Lipowsky (2015b) J. Agudo-Canalejo and R. Lipowsky, “Adhesive Nanoparticles as Local Probes of Membrane Curvature,” Nano Lett. 15, 7168–7173 (2015b).
- Steinkuhler et al. (2016) J. Steinkuhler, J. Agudo-Canalejo, R. Lipowsky, and R. Dimova, “Modulating vesicle adhesion by electric fields,” Biophysical Journal 111, 1454–1464 (2016).
- Keh and Leal (2016) M. P. Keh and L. G. Leal, “Adhesion and detachment of a capsule in axisymmetric flow,” Phys. Rev. Fluids , 013201 (2016).
- Agudo-Canalejo and Lipowsky (2017) J. Agudo-Canalejo and R. Lipowsky, “Uniform and Janus-like nanoparticles in contact with vesicles: energy landscapes and curvature-induced forces,” Soft Matt. 13, 2155 (2017).
- Cantat and Misbah (1999) I. Cantat and C. Misbah, “Lift force and dynamical unbinding of adhering vesicles under shear flow,” Physical Review Letters 83, 880 (1999).
- Sukumaran and Seifert (2001) S. Sukumaran and U. Seifert, “Influence of shear flow on vesicles near a wall: A numerical study,” Physical Review E 64 (2001).
- Blount et al. (2013) M. J. Blount, M. J. Miksis, and S. H. Davis, “The equilibria of vesicles adhered to substrates by short-ranged potentials,” Proceedings of the Royal Society A 469, 20120729 (2013).
- Ramachandran et al. (2010) A. Ramachandran, T. H. Anderson, L. G. Leal, and J. N. Israelachvili, “Adhesive Interactions between Vesicles in the Strong Adhesion Limit,” Langmuir 27, 59–73 (2010).
- Mares et al. (2012) T. Mares, M. Daniel, A. Iglic, V. Kralj-Iglic, and M. Fosnaric, “Determination of the strength of adhesion between lipid vesicles,” Scientific World Journal 2012, 146804 (2012).
- Frostad et al. (2014) J. M. Frostad, M. Seth, S. M. Bernasek, and L. G. Leal, “Direct measurement of interaction forces between charged multilamellar vesicles,” Soft Matt. 10, 7769 (2014).
- Agrawal (2011) A. Agrawal, “Mechanics of membrane-membrane adhesion,” Math. Mech. Solids 16, 872 (2011).
- Gires et al. (2012) P. Y. Gires, G. Danker, and C. Misbah, “Hydrodynamic interaction between two vesicles in a linear shear flow,” Physical Review E 86, 011408 (2012).
- Gires et al. (2014) Pierre-Yves Gires, Aparna Srivastav, Chaouqi Misbah, Thomas Podgorski, and Gwennou Coupier, “Pairwise hydrodynamic interactions and diffusion in a vesicle suspension,” Physics of Fluids 26 (2014).
- Quaife and Biros (2014) B. Quaife and G. Biros, “High-volume fraction simulations of two-dimensional vesicle suspensions,” Journal of Computational Physics 274, 245–267 (2014).
- Quaife and Biros (2016) B. Quaife and G. Biros, “Adaptive time stepping for vesicle suspensions,” Journal of Computational Physics 306, 478–499 (2016).
- Young and Stone (2017) Y.-N. Young and H. A. Stone, “Long-wave dynamics of an elastic sheet lubricated by a thin liquid film on a wetting substrate,” Physical Review Fluids 2, 064001 (2017).
- Ramachandran and Leal (2010) A. Ramachandran and G. Leal, “A scaling theory for the hydrodynamic interaction between a pair of vesicles or capsules,” Physics of Fluids 22, 091702 (2010).
- Kantsler et al. (2007) V. Kantsler, E. Segre, and V. Steinberg, “Vesicle dynamics in time-dependent elongation flow: Wrinkling instability,” Physical Review Letters 99, 178102 (2007).
- Jansen et al. (1997) J. J. M. Jansen, A. Boon, and W. G. M. Agterof, “Influence of Dynamic Interfacial Properties on Droplet Breakup in Plane Hyperbolic Flow,” AIChE J. 43, 1436–1447 (1997).
- Hu et al. (2000) Y. T. Hu, D. J. Pine, and L. Gary Leal, “Drop deformation, breakup, and coalescence with compatibilizer,” Phys. Fluids 12, 484 (2000).
- Frostad et al. (2013) J. M. Frostad, J. Walter, and L. G. Leal, “A scaling relation for the capillary-pressure driven drainage of thin films,” Phys. Fluids 25, 052108 (2013).
- Spjut (2010) J. E. Spjut, Trapping, deformation, and dynamics of phospholipid vesicles, Master’s thesis, University of California, Berkeley (2010).
- Bentley and Leal (1986) B. J. Bentley and L. G. Leal, “A computer-controlled four-roll mill for investigations of particle and drop dynamics in two-dimensional linear shear flows,” J. Fluid Mech. 167, 219–240 (1986).
- Johnson-Chavarria et al. (2011) E.M. Johnson-Chavarria, M. Tanyeri, and C.M. Schroeder, “A Microfluidic-Based Hydrodynamic Trap for Single Particles,” Journal of Visualized Experiments 47 (2011).
- Breyiannis and Pozrikidis (2000) G. Breyiannis and C. Pozrikidis, “Simple shear flow of suspensions of elastic capsules,” Theoret. Comput. Fluid Dynamics 13, 327–347 (2000).
- Lac et al. (2007) E. Lac, A. Morel, and D. Barthes-Biesel, “Hydrodynamic interaction between two identical capsules in simple shear flow,” J. Fluid Mech. 573, 149–169 (2007).
- Lac and Barthes-Biesel (2008) E. Lac and D. Barthes-Biesel, “Pairwise interaction of capsules in simple shear flow: Three-dimensional effects,” Phys. Fluids 20, 040801 (2008).
- Omori et al. (2013) T. Omori, T. Ishikawa, Y. Imai, and T. Yamaguchi, “Membrane tension of red blood cells pairwisely interacting in simple shear flow,” J. Biomechanics 46, 548–553 (2013).
- Rahimian et al. (2015) A. Rahimian, S. K. Veerapaneni, , D. Zorin, and G. Biros, “Boundary integral method for the flow of vesicles with viscosity contrast in three dimensions,” Journal of Computational Physics 298, 766–786 (2015).
- Jeffery (1922) G. B. Jeffery, “The Motion of Ellipsoidal Particles Immersed in a Viscous Fluid,” Proceedings of the Royal Society A 102, 161–179 (1922).
- Fenz et al. (2017) S. F. Fenz, T. Bihr, D. Schmidt, R. Merkel, U. Seifert, K. Sengupta, and A.-S. Smith, “Membrane fluctuations mediate lateral interactions between cadherin bonds,” Nature Phys. 13, 906–913 (2017).
- Liu et al. (2019) K. Liu, B. Chu, J. Newby, E. L. Read, J. Lowengrub, and J. Allard, “Hydrodynamics of transient cell-cell contact: The role of membrane permeability and active protrusion length,” PLOS Computational Biology 15, e1006352 (2019).
- Alpert (1999) B. K. Alpert, “Hybrid Gauss-Trapezoidal Quadrature Rules,” SIAM Journal on Scientific Computing 20, 1551–1584 (1999).
- Trefethen and Weideman (2014) L. N. Trefethen and J. A. C. Weideman, “The Exponentially Convergent Trapezoidal Rule,” SIAM Review 56, 385–458 (2014).