Now at ]School of Science, Westlake University, 18 Shilongshan Road, 310024, Hangzhou, China
Charge transport in oxygen-deficient EuTiO3: the emerging picture of dilute metallicity in quantum-paraelectric perovskite oxides
Abstract
We report on a study of charge transport in EuTiO3-δ single crystals with carrier density tuned across several orders of magnitude. Comparing this system with other quasi-cubic perovskites, in particular strontium titanate, we draw a comprehensive picture of metal-insulator transition and dilute metallicity in this O3 family. Because of a lower electric permittivity, the metal-insulator transition in EuTiO3-δ occurs at higher carrier densities compared to SrTiO3. At low temperature, a distinct resistivity is visible. Its prefactor smoothly decreases with increasing carrier concentration in a similar manner in three different perovskites. Our results draw a comprehensive picture of charge transport in doped quantum paraelectrics.
During the last decade, the metal-insulator transition (MIT) in weakly doped SrTiO3 has attracted renewed interest. The pure compound is a highly insulating quantum paraelectric Müller and Burkard (1979), which on the one hand becomes ferroelectric by a partial substitution of Sr by Ca (Sr1-xCaxTiO3, ) Bednorz and Müller (1984); de Lima et al. (2015). On the other hand it becomes metallic upon reduction (SrTiO3-δ) Spinelli et al. (2010) and even superconducting Schooley et al. (1964) at remarkably low carrier concentrations, which identified SrTiO3 as the most dilute superconductor Lin et al. (2013). Furthermore, a ferroelectric-like transition inside the superconducting phase has been observed in compounds with both, Ca substitution and oxygen vacancies (Sr1-xCaxTiO3-δ) Rischau et al. (2017). Apart from reduction, SrTiO3 has been subjected to other variants of -type doping by, e.g., substituting Ti4+ with Nb5+ (SrTi1-xNbxO3) Koonce et al. (1967); Binnig et al. (1980); Ohta et al. (2005); Spinelli et al. (2010), or Sr2+ with La3+ (Sr1-xLaxTiO3) Uematsu et al. (1984); Tang et al. (1996); Suzuki et al. (1996); Ohta et al. (2005). In all three cases a behavior of the resistivity is found Okuda et al. (2001); van der Marel et al. (2011); Lin et al. (2015). For many systems, the prefactor of is related to the electronic specific heat coefficient , since both depend on the Fermi energy , as is expressed in the Kadowaki-Woods ratio Kadowaki and Woods (1986). Furthermore, itself depends on the carrier density and one may expect a particular scaling behavior in as shown for metallic SrTiO3-δ Lin et al. (2015); Mikheev et al. (2016).
In order to investigate these phenomena in other systems, EuTiO3 is a prime candidate, because both materials are similar in many aspects. Sr2+ and Eu2+ have almost the same ionic radius 111In Shannon’s paper of ionic radii Shannon (1976) no value is given for the ionic radius of Eu2+ with a twelvefold coordination, but it is pointed out that the radius of Eu2+ is only slightly larger than that of Sr2+ for all coordination numbers. This is supported by the fact, that the lattice parameters of both compounds are almost the same Brous et al. (1953). Both compounds have the ideal cubic perovskite structure (space group ) at room temperature and undergo a structural phase transition to tetragonal () upon cooling Bussmann-Holder et al. (2011); Allieta et al. (2012), and both are quantum paraelectrics Müller and Burkard (1979); Katsufuji and Takagi (2001); Kamba et al. (2007). Nevertheless, there are also clear differences. SrTiO3 crystals are transparent, whereas EuTiO3 is black, what can be understood from band structure calculations yielding a band gap of Akamatsu et al. (2011), whereas SrTiO3 has a gap of Bäuerle et al. (1978). SrTiO3 is non-magnetic in contrast to EuTiO3 where Eu2+ has a large, local magnetic moment of . These moments order antiferromagnetically below in a G-type configuration McGuire et al. (1966); Scagnoli et al. (2012).
The research on -doped EuTiO3 is sparse. To our knowledge only five publications exist: One report deals with poly- and single-crystalline EuTi1-xNbxO3 with Li et al. (2015) and another two with single-crystalline Eu1-xLaxTiO3 ( Katsufuji and Tokura (1999); Tomioka et al. (2018)). Studies of oxygen-deficient EuTiO3 are restricted to ceramics Kennedy et al. (2014) and thin films Kugimiya et al. (2007). Here, we present a detailed study of single-crystalline EuTiO3-δ tuned from semiconducting to metallic via reduction. We derive the electron mobility and discuss its temperature dependence in comparison to that of SrTiO3. We find an resistivity behavior of metallic EuTiO3-δ where systematically decreases with increasing charge-carrier content, which is discussed in a larger context of charge transport in weakly doped perovskite oxides.
The EuTiO3 crystals were grown by the floating-zone technique. We used polycrystalline powders of Eu2O3 (chemical purity ), TiO (), and TiO2 () as starting materials. The powders were mixed for and the mixture was pressed to a cylindrical rod at . In order to avoid emergence of Eu3+ via oxygen capture, we skipped preliminary powder reactions and put the pressed rod directly into the floating-zone system. Centimeter-sized single crystals were grown in argon atmosphere using a growth speed of and a relative rotation of the rods of . X-ray powder diffraction measurements verified phase purity and Laue images confirmed single crystallinity.
The as-grown crystal was cut into cuboid pieces with all faces being planes. In order to induce electron doping, the samples were annealed in sealed fused-quartz tubes with low argon pressure () and titanium metal powder () acting as oxygen catcher. The quartz tubes were heated for at temperatures between and depending on the intended carrier concentration. In order to have an indicator for homogeneity, in each run two samples with different thicknesses ( and ) were annealed simultaneously in the same quartz tube. Resistivity and Hall effect measurements were carried out by a standard four-probe and six-probe method, respectively, using a home-built dipstick setup and a commercial 3He insert (Heliox, Oxford Instruments) for wet cryostats.
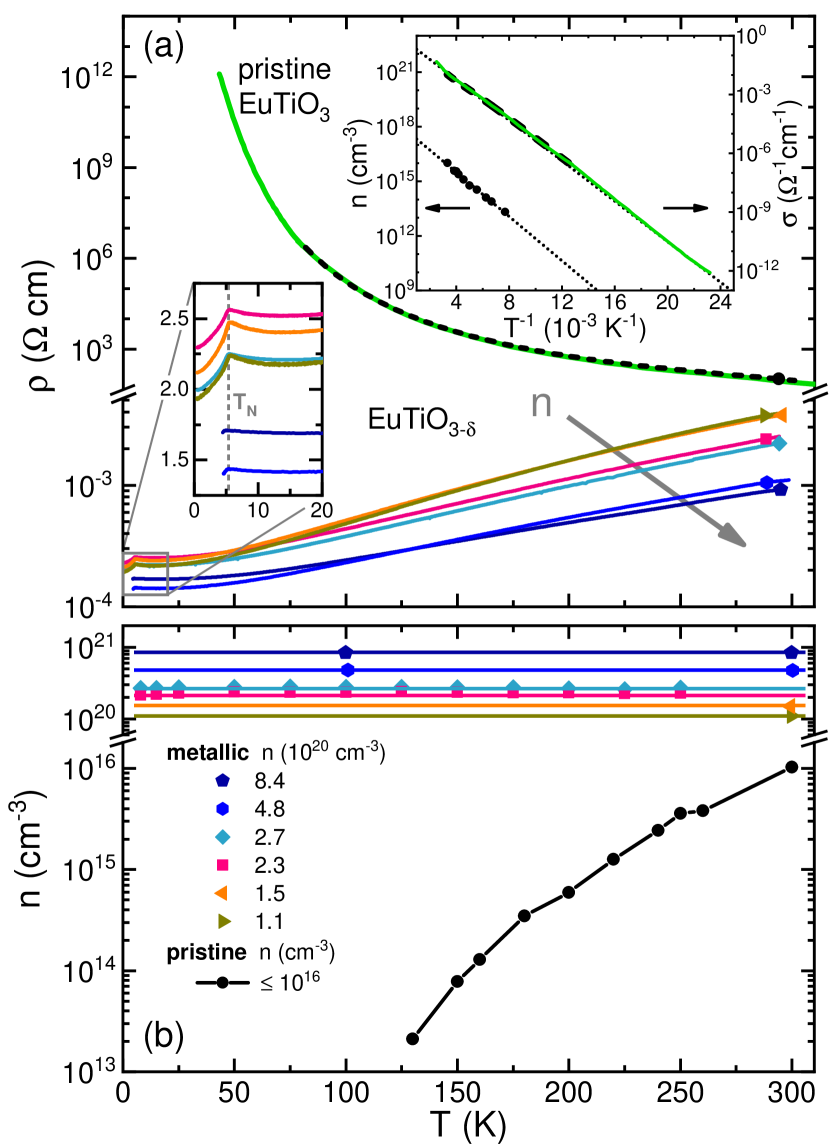
Figure 1 shows the resistivity and charge carrier density as a function of temperature—both in semilogarithmic scales—for different EuTiO3-δ samples. In contrast to SrTiO3, which is highly insulating, the DC conductivity of pristine EuTiO3 is measurable down to about (Fig. 1 (a)) and is complemented with dielectric spectroscopy measurements (see Appendix A) to even lower temperature. Its carrier density obtained from Hall effect measurements (Fig. 1 (b)) is temperature dependent and ranges from at room temperature down to at the lowest measurable temperature (). The activated behavior is clearly seen in the Arrhenius plots of both, conductivity and carrier density (upper inset of Fig. 1). The corresponding fits yield very similar activation energies ( from conductivity and from carrier density), but both are much smaller than the theoretically expected intrinsic band gap of Akamatsu et al. (2011) meaning that the pristine EuTiO3 is weakly impurity-doped.
To induce a MIT, the aforementioned annealing technique is used. Annealing temperatures below seem to have no effect on the oxygen content, since the curves remain unchanged (not shown). For annealing temperatures above we obtain metallic samples with temperature-independent carrier densities that cover a range of to (see Fig. 1). Above the curves are ordered by carrier density, i.e., increases upon increasing and, in reverse, the curves are ordered by the high-temperature conductivity. At low temperatures, some of the curves are crossing each other, which may partly arise from different residual resistivities and/or some uncertainty in determining the exact geometries. For annealing temperatures , the simultaneously annealed samples of different thicknesses show large deviations in both, and . This indicates inhomogeneous charge carrier concentrations and thus these samples are not taken into account here. In this context, it is worth to mention that a certain gradient in the oxygen-defect concentration is naturally expected for post-annealed single crystals. However, above a certain critical concentration the wave functions of the induced charge carriers overlap sufficiently and a metallic state with an averaged homogeneous charge carrier density results.
The absence of homogeneous samples between pristine and metallic EuTiO3-δ hinders an exact determination of the MIT. The lowest carrier density of yields an upper boundary for the critical carrier density of the MIT and is about four orders of magnitude larger than the corresponding one () of SrTiO3 Spinelli et al. (2010). This difference can be understood by comparing the permittivities of EuTiO3 and SrTiO3. While SrTiO3 has an extremely large of roughly at low temperatures Müller and Burkard (1979), that of EuTiO3 is smaller by a factor of 50. We find (see Appendix A) in agreement with previous single-crystal data Katsufuji and Takagi (2001), whereas smaller values are reported for ceramics Kamba et al. (2007); Goian et al. (2009).
Of course, these values were obtained for pristine EuTiO3. For doped samples, one defines an effective Bohr radius , which renormalizes of the hydrogen atom by taking into account the permittivity and the band mass . The so-called Mott criterion Mott (1961) compares as a measure for the overlap of the electronic wave functions to the average distance between donor atoms . The huge low-temperature of SrTiO3 results in an effective Bohr radius of about , compared to for EuTiO3. Here, we use as determined for the lowest lying conduction band of SrTiO3-δ Lin et al. (2014) for both SrTiO3 and EuTiO3. The much smaller value of explains that of EuTiO3 is about four orders of magnitude larger than that of SrTiO3. In passing, we also note that the influence of the above-mentioned inhomogeneities in the oxygen-defect concentrations is suppressed more rapidly with increasing . Figure 2 (a) shows the scaling behavior as dashed lines for different values of . Experiments on doped semiconductors have detected a sharp MIT at a critical density of and the available data follows a scaling relation with Edwards and Sienko (1978); Edwards et al. (1995), which corresponds to the so-called Mott criterion Mott (1961). In perovskite oxides, there is no experimental data resolving a sharp MIT at and metallicity is observed in EuTiO3, SrTiO3 Spinelli et al. (2010), and KTaO3 Wemple (1965); Uwe et al. (1979) at carrier densities which are much larger than expected according to the Mott criterion. Nevertheless, these carrier densities scale with .
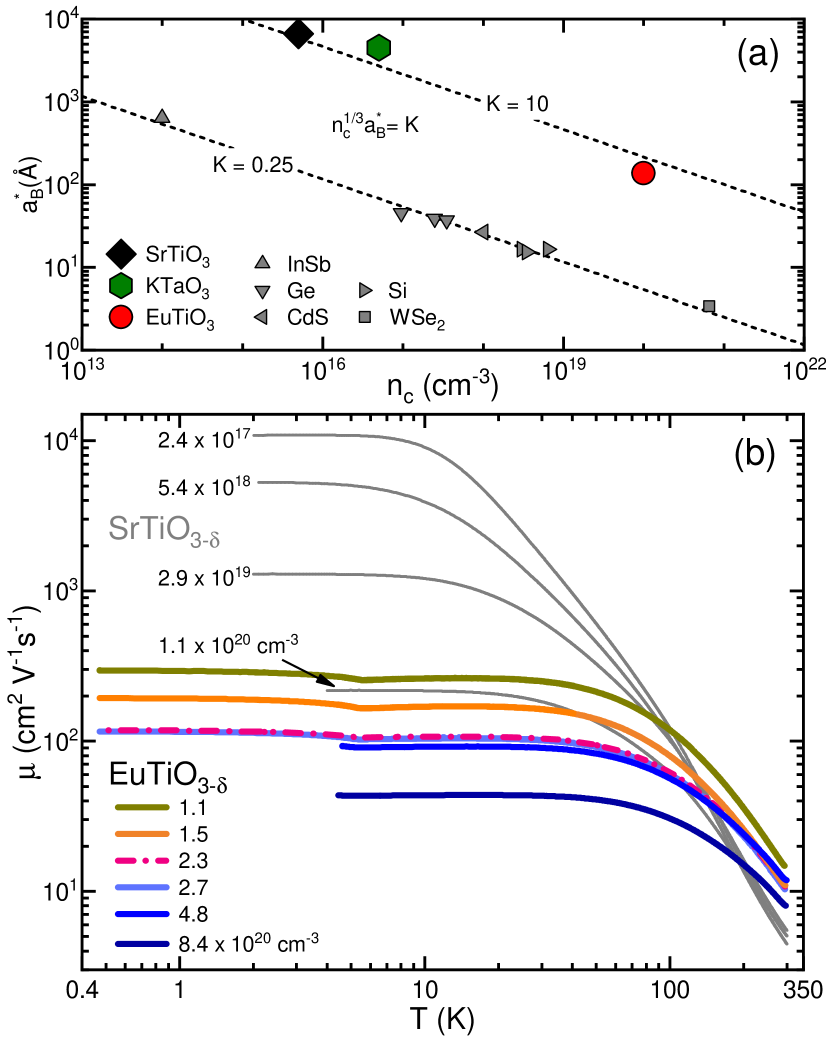
Figure 2 (b) displays the mobility of metallic EuTiO3-δ as a function of temperature in double-logarithmic scales. Below all curves approach constant values, which are ordered by carrier density , i.e., systematically decreases with increasing . The additional kinks result from the magnetic order at as already shown in Fig. 1 (a) for . In the high-temperature regime, the mobility curves decrease due to increasing electron-phonon scattering and seem to approach an -independent power law. Such a behavior has been already observed in SrTiO3 Lin et al. (2017). For comparison, we also show the mobility data of four SrTiO3-δ crystals with . Because SrTiO3-δ is already metallic for very low carrier densities, higher mobilities than in EuTiO3-δ are reached in the low-temperature regime, but even across both compounds all curves remain ordered by increasing . Towards high temperature, the mobility curves of SrTiO3-δ merge and fall below those of EuTiO3 above about . This is surprising in view of the structural phase transition of EuTiO3, which is in that temperature range Kennedy et al. (2014); Bussmann-Holder et al. (2011). In contrast, the transition in SrTiO3-δ appears at Müller et al. (1968); Müller and Burkard (1979) and linearly decreases with increasing charge-carrier content Tao et al. (2016). Using X-ray and Raman scattering measurements, we derive on our pristine EuTiO3 and for the highest (to be published elsewhere). However, neither SrTiO3-δ nor EuTiO3-δ show any anomalies in the mobility data reflecting the structural transitions. Recently, both the magnitude and temperature dependence of the mobility in SrTiO3-δ have attracted attention Mishchenko et al. (2018); Zhou et al. (2018). Mischenko et al. Mishchenko et al. (2018) argue that a polaronic approach can lead to a scattering rate larger than the thermal energy of carriers in agreement with the data. Ab initio calculations by Zhou et al. Zhou et al. (2018) reproduce the experimentally observed temperature dependence of the mobility of SrTiO3-δ Lin et al. (2017), but the calculated absolute value is an order of magnitude larger than the experimental data. Moreover, in these theoretical approaches the antiferrodistortive soft mode does not play a key role, in agreement with the absence of anomalies in the measured mobility data.
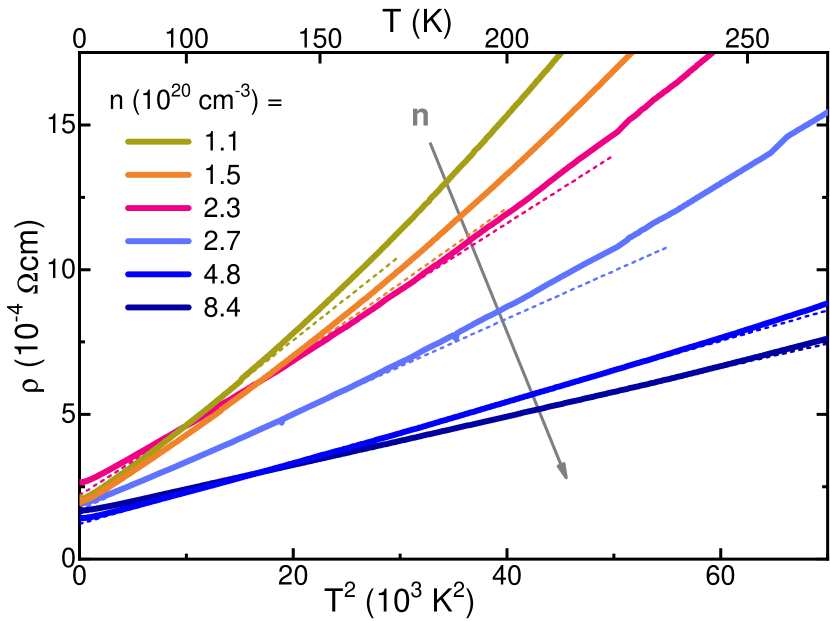
Figure 3 shows the resistivity as a function of together with fits of the form (dashed lines). The fits deviate from the data for high temperatures and with increasing carrier density the temperature range of the behavior systematically increases, which is in agreement with the findings for SrTiO3-δ Lin et al. (2015). In EuTiO3-δ we have an additional deviation at low temperatures that is related to the magnetic transition at . Figure 4 (a) shows the prefactor from these fits as a function of in double-logarithmic scales. Here, we compare for EuTiO3-δ to that of SrTiO3-δ, Sr1-xLaxTiO3, and SrTi1-xNbxO3 Lin et al. (2015); Okuda et al. (2001); van der Marel et al. (2011), and we also include of the non-titanate perovskite K1-xBaxTaO3 Sakai et al. (2009). All titanate systems follow a general trend as is marked by dotted black lines, which are guides to the eye and indicate power laws with . Band structure calculations for -doped SrTiO3 van der Marel et al. (2011) yield a model with three bands that are filled consecutively with increasing . The critical carrier densities (), at which the filling of the second (third) band sets in, are known from experiments Lin et al. (2014) and illustrated by background-color boundaries. Below , where only the first band is filled, a power law is seen as is expected for a single parabolic band with and a simple relation. When the second band starts to be filled at , the exponent of suddenly increases and finally approaches , which does not change much above .
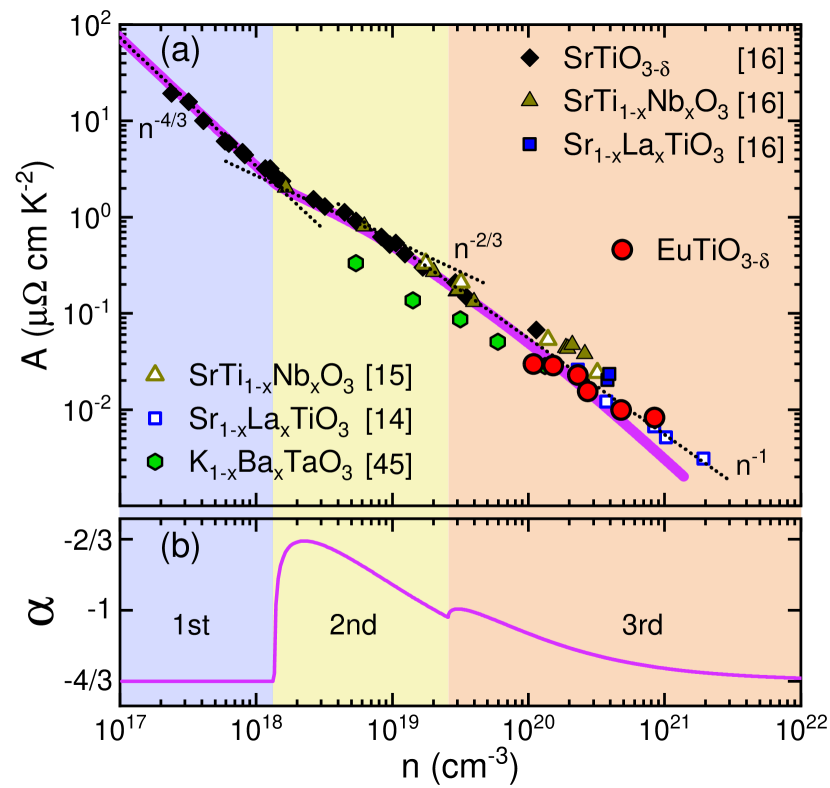
The increase of is a natural consequence of a three-band system. If we consider the most simple case of three parabolic bands with band minima at energies , effective masses , and densities of states , then each band contributes
| (1) |
to the total electron density . We use the band masses and from Shubnikov-de-Haas measurements of SrTiO3-δ Lin et al. (2014) and adjust to and , respectively, to match the experimental critical carrier densities 222In the three-band model of van der Marel et al. van der Marel et al. (2011) the lowest band is heavy, while the others are light. However, in our much simpler model with purely parabolic bands, we neglect band repulsion. Thus, the second band is the heavy one and crosses the lighter first band.. From the inverse function we calculate which describes the data of the doped titanates over almost the entire range of , as is shown by the thick line in Fig. 4 (a). This also holds for the exponent of obtained from the slope of vs. (Fig. 4 (b)). In view of the simple model, which neglects deviations from the parabolic band shapes as well as their anisotropy, this good agreement with the experimental data is remarkable. The available data of the non-titanate perovskite K1-xBaxTaO3 Sakai et al. (2009) fit into this picture as well, because this material has lower effective masses ( to ) Uwe et al. (1979). Consequently, at a given carrier concentration , the Fermi energy is larger and the prefactor is lower compared to the titanates. A more sophisticated theoretical treatment could provide a generalized uniform description of the behavior for an even larger variety of metallic perovskite oxides with low carrier densities.
In summary, we present a detailed report of the metal-insulator transition in oxygen-deficient single-crystalline EuTiO3, which shows many similarities with that in SrTiO3. However, it sets in at a much higher carrier concentration (factor ), which results from the smaller permittivity of EuTiO3, implying a smaller effective Bohr radius , i.e., a smaller overlap of the electronic wave functions. We show that metallicity in three perovskite oxides scales with the effective Bohr radius , but it emerges at a carrier density much larger than suggested by the Mott criterion. The low-temperature mobility of metallic EuTiO3 and SrTiO3 systematically increases with decreasing charge carrier concentration across both materials. We find an behavior in of metallic EuTiO3-δ where the prefactor systematically decreases with increasing charge carrier density and even quantitatively agrees with of doped SrTiO3. This general behavior of can be described within a three-band model.
Appendix A Dielectric Spectroscopy
The dielectric and transport properties of pristine EuTiO3 towards higher resistivities were determined by contact based impedance spectroscopy. These measurements were performed in a commercial 4He-flow cryo-magnet (Quantum-Design PPMS) on crystals in capacitor geometry with metallized surfaces and thickness along a cubic [100] axis. We used a high-impedance frequency response analyzer (Novocontrol) and a vector network analyzer (ZNB8, Rohde&Schwarz) to cover a joint frequency range with voltage stimulation below 1 Vrms.
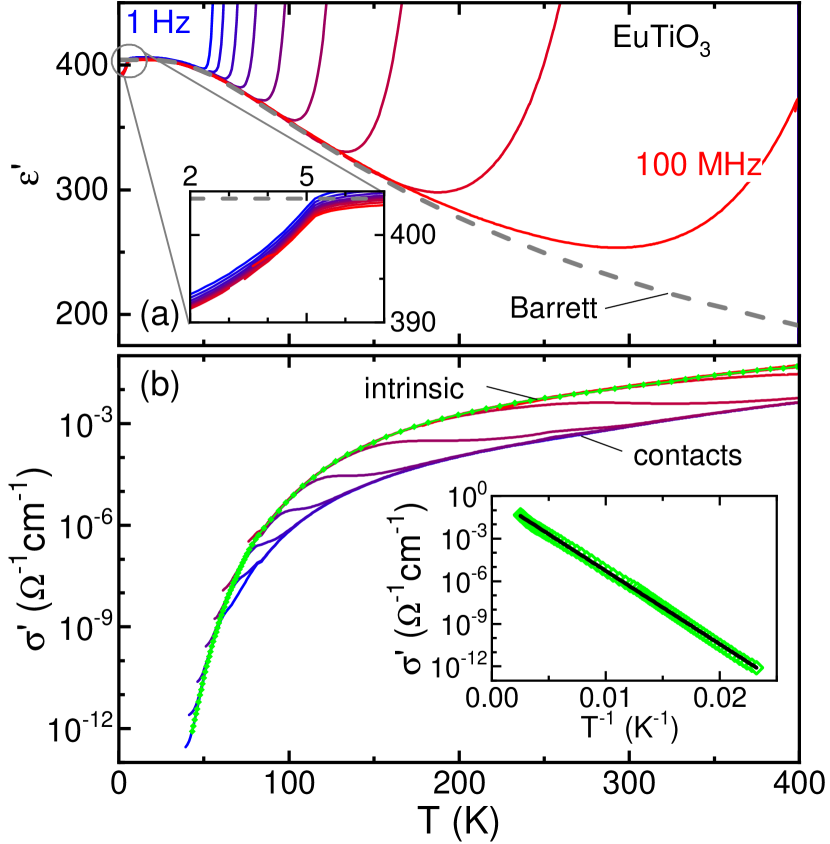
As expected for semi-conductors, Schottky-type depletion layers at the contact interfaces cause a capacitive contribution , which together with the contact resistance form an element in series with the intrinsic sample impedance. This gives rise to Maxwell-Wagner-type relaxational effects Maxwell (1954), but for frequencies the contacts effectively are short-circuited Lunkenheimer et al. (2002); Niermann et al. (2012). The crossover from contact-dominated to intrinsic response is clearly seen in the permittivity as well as in the conductivity . The low-/high- limit of the frequency- and temperature-dependent data represents the intrinsic quasi-static (Fig. 5 (a)). The corresponding intrinsic , marked in green in Fig. 5 (b) agrees well the inverse DC resistivity (see Fig. 1 (a)).
EuTiO3 is a quantum paraelectric where long-range order is prevented by quantum fluctuations. The fingerprint of quantum-paraelectric behavior is a Curie-like rise of the permittivity with decreasing temperature followed by a saturation at an elevated , which can be modeled by the well known Barrett formula Barrett (1952)
| (2) |
Here, represents the influence of quantum fluctuations and is the paraelectric Curie-temperature. The fit of the high-frequency data of reveals and . The value of agrees with a previous report Katsufuji and Takagi (2001) and, remarkably, it is four times larger compared to SrTiO3 Müller and Burkard (1979); Hemberger et al. (1996) indicating much stronger quantum fluctuations in EuTiO3. Our value differs in magnitude from Katsufuji and Takagi (2001) where a considerably smaller temperature range could be evaluated, but is also negative denoting rather antiferroelectric correlations in EuTiO3. As shown in the inset of Fig. 5 (a), has a clear anomaly at , which results from a significant magneto-electric coupling Katsufuji and Takagi (2001).
Acknowledgements.
We acknowledge support by the DFG (German Research Foundation) via project number 277146847 - CRC 1238 (Subprojects A02, B01, B02 and B03). This work is part of a DFG-ANR project funded by Agence Nationale de la Recherche (ANR-18-CE92-0020-01) and by the DFG through projects LO 818/6-1 and HE 3219/6-1. X. L. acknowledges support by the Alexander von Humboldt Foundation and Zhejiang Provincial Natural Science Foundation of China under Grant No. LQ19A040005.References
- Müller and Burkard (1979) K. A. Müller and H. Burkard, SrTiO3: An intrinsic quantum paraelectric below 4 K, Phys. Rev. B 19, 3593 (1979).
- Bednorz and Müller (1984) J. G. Bednorz and K. A. Müller, Sr1-xCaxTiO3: An Quantum Ferroelectric with Transition to Randomness, Phys. Rev. Lett. 52, 2289 (1984).
- de Lima et al. (2015) B. S. de Lima, M. S. da Luz, F. S. Oliveira, L. M. S. Alves, C. A. M. dos Santos, F. Jomard, Y. Sidis, P. Bourges, S. Harms, C. P. Grams, J. Hemberger, X. Lin, B. Fauqué, and K. Behnia, Interplay between antiferrodistortive, ferroelectric, and superconducting instabilities in Sr1-xCaxTiO3-δ, Phys. Rev. B 91, 045108 (2015).
- Spinelli et al. (2010) A. Spinelli, M. A. Torija, C. Liu, C. Jan, and C. Leighton, Electronic transport in doped SrTiO3: Conduction mechanisms and potential applications, Phys. Rev. B 81, 155110 (2010).
- Schooley et al. (1964) J. F. Schooley, W. R. Hosler, and M. L. Cohen, Superconductivity in semiconducting SrTiO3, Phys. Rev. Lett. 12, 474 (1964).
- Lin et al. (2013) X. Lin, Z. Zhu, B. Fauqué, and K. Behnia, Fermi surface of the most dilute superconductor, Phys. Rev. X 3, 021002 (2013).
- Rischau et al. (2017) C. W. Rischau, X. Lin, C. P. Grams, D. Finck, S. Harms, J. Engelmayer, T. Lorenz, Y. Gallais, B. Fauqué, J. Hemberger, and K. Behnia, A ferroelectric quantum phase transition inside the superconducting dome of Sr1-xCaxTiO3-δ, Nat. Phys. 13, 643 (2017).
- Koonce et al. (1967) C. S. Koonce, M. L. Cohen, J. F. Schooley, W. R. Hosler, and E. R. Pfeiffer, Superconducting Transition Temperatures of Semiconducting SrTiO3, Phys. Rev. 163, 380 (1967).
- Binnig et al. (1980) G. Binnig, A. Baratoff, H. E. Hoenig, and J. G. Bednorz, Two-Band Superconductivity in Nb-Doped SrTiO3, Phys. Rev. Lett. 45, 1352 (1980).
- Ohta et al. (2005) S. Ohta, T. Nomura, H. Ohta, and K. Koumoto, High-temperature carrier transport and thermoelectric properties of heavily La- or Nb-doped SrTiO3 single crystals, J. Appl. Phys. 97, 034106 (2005).
- Uematsu et al. (1984) K. Uematsu, O. Sakurai, N. Mizutani, and M. Kato, Electrical properties of La-doped SrTiO3 (La: 0.1 to 2.0 at %) single crystals grown by xenon-arc image floating zone method, J. Mater. Sci. 19, 3671 (1984).
- Tang et al. (1996) C. Q. Tang, Z. Xia, S. Yao, and S. Chen, Dependence of the electric properties and the positron lifetimes on the dopant content in La-doped SrTiO3, Cryst. Res. Technol. 31, 821 (1996).
- Suzuki et al. (1996) H. Suzuki, H. Bando, Y. Ootuka, I. H. Inoue, T. Yamamoto, K. Takahashi, and Y. Nishihara, Superconductivity in Single-Crystalline Sr1-xLaxTiO3, J. Phys. Soc. Jpn. 65, 1529 (1996).
- Okuda et al. (2001) T. Okuda, K. Nakanishi, S. Miyasaka, and Y. Tokura, Large thermoelectric response of metallic perovskites: Sr1-xLaxTiO3 (), Phys. Rev. B 63, 113104 (2001).
- van der Marel et al. (2011) D. van der Marel, J. L. M. van Mechelen, and I. I. Mazin, Common Fermi-liquid origin of resistivity and superconductivity in SrTiO3, Phys. Rev. B 84, 205111 (2011).
- Lin et al. (2015) X. Lin, B. Fauqué, and K. Behnia, Scalable resistivity in a small single-component Fermi surface, Science 349, 945 (2015).
- Kadowaki and Woods (1986) K. Kadowaki and S. B. Woods, Universal relationship of the resistivity and specific heat in heavy-Fermion compounds, Solid State Commun. 58, 507 (1986).
- Mikheev et al. (2016) E. Mikheev, S. Raghavan, J. Y. Zhang, P. B. Marshall, A. P. Kajdos, L. Balents, and S. Stemmer, Carrier density independent scattering rate in SrTiO3-based electron liquids, Sci. Rep. 6, 20865 (2016).
- Note (1) In Shannon’s paper of ionic radii Shannon (1976) no value is given for the ionic radius of Eu2+ with a twelvefold coordination, but it is pointed out that the radius of Eu2+ is only slightly larger than that of Sr2+ for all coordination numbers. This is supported by the fact, that the lattice parameters of both compounds are almost the same Brous et al. (1953).
- Bussmann-Holder et al. (2011) A. Bussmann-Holder, J. Köhler, R. K. Kremer, and J. M. Law, Relation between structural instabilities in EuTiO3 and SrTiO3, Phys. Rev. B 83, 212102 (2011).
- Allieta et al. (2012) M. Allieta, M. Scavini, L. J. Spalek, V. Scagnoli, H. C. Walker, C. Panagopoulos, S. S. Saxena, T. Katsufuji, and C. Mazzoli, Role of intrinsic disorder in the structural phase transition of magnetoelectric EuTiO3, Phys. Rev. B 85, 184107 (2012).
- Katsufuji and Takagi (2001) T. Katsufuji and H. Takagi, Coupling between magnetism and dielectric properties in quantum paraelectric EuTiO3, Phys. Rev. B 64, 054415 (2001).
- Kamba et al. (2007) S. Kamba, D. Nuzhnyy, P. Vaněk, M. Savinov, K. Knížek, Z. Shen, E. Šantavá, K. Maca, M. Sadowski, and J. Petzelt, Magnetodielectric effect and optic soft mode behaviour in quantum paraelectric EuTiO3 ceramics, Europhys. Lett. 80, 27002 (2007).
- Akamatsu et al. (2011) H. Akamatsu, Y. Kumagai, F. Oba, K. Fujita, H. Murakami, K. Tanaka, and I. Tanaka, Antiferromagnetic superexchange via 3d states of titanium in EuTiO3 as seen from hybrid Hartree-Fock density functional calculations, Phys. Rev. B 83, 214421 (2011).
- Bäuerle et al. (1978) D. Bäuerle, W. Braun, V. Saile, G. Sprüssel, and E. E. Koch, Vacuum ultraviolet reflectivity and band structure of SrTiO3 and BaTiO3, Z. Phys. B 29, 179 (1978).
- McGuire et al. (1966) T. R. McGuire, M. W. Shafer, R. J. Joenk, H. A. Alperin, and S. J. Pickart, Magnetic structure of EuTiO3, J. Appl. Phys. 37, 981 (1966).
- Scagnoli et al. (2012) V. Scagnoli, M. Allieta, H. Walker, M. Scavini, T. Katsufuji, L. Sagarna, O. Zaharko, and C. Mazzoli, EuTiO3 magnetic structure studied by neutron powder diffraction and resonant x-ray scattering, Phys. Rev. B 86, 094432 (2012).
- Li et al. (2015) L. Li, J. R. Morris, M. R. Koehler, Z. Dun, H. Zhou, J. Yan, D. Mandrus, and V. Keppens, Structural and magnetic phase transitions in EuTi1-xNbxO3, Phys. Rev. B 92, 024109 (2015).
- Katsufuji and Tokura (1999) T. Katsufuji and Y. Tokura, Transport and magnetic properties of a ferromagnetic metal: EuTiO3, Phys. Rev. B 60, R15021 (1999).
- Tomioka et al. (2018) Y. Tomioka, T. Ito, and A. Sawa, Magnetotransport Properties of Eu1-xLaxTiO3 Single Crystals, J. Phys. Soc. Jpn. 87, 094716 (2018).
- Kennedy et al. (2014) B. J. Kennedy, G. Murphy, E. Reynolds, M. Avdeev, H. E. R. Brand, and T. Kolodiazhnyi, Studies of the antiferrodistortive transition in EuTiO3, J. Phys.: Condens. Matter 26, 495901 (2014).
- Kugimiya et al. (2007) K. Kugimiya, K. Fujita, K. Tanaka, and K. Hirao, Preparation and magnetic properties of oxygen deficient EuTiO3-δ thin films, J. Magn. Magn. Mater. 310, 2268 (2007).
- Goian et al. (2009) V. Goian, S. Kamba, J. Hlinka, P. Vaněk, A. A. Belik, T. Kolodiazhnyi, and J. Petzelt, Polar phonon mixing in magnetoelectric EuTiO3, Eur. Phys. J. B 71, 429 (2009).
- Mott (1961) N. F. Mott, The Transition to the Metallic State, Philos. Mag. 6, 287 (1961).
- Lin et al. (2014) X. Lin, G. Bridoux, A. Gourgout, G. Seyfarth, S. Krämer, M. Nardone, B. Fauqué, and K. Behnia, Critical doping for the onset of a two-band superconducting ground state in SrTiO3-δ, Phys. Rev. Lett. 112, 207002 (2014).
- Edwards and Sienko (1978) P. P. Edwards and M. J. Sienko, Universality aspects of the metal-nonmetal transition in condensed media, Phys. Rev. B 17, 2575 (1978).
- Edwards et al. (1995) P. P. Edwards, T. V. Ramakrishnan, and C. N. R. Rao, The Metal-Nonmetal Transition: A Global Perspective, J. Phys. Chem. 99, 5228 (1995).
- Wemple (1965) S. H. Wemple, Some Transport Properties of Oxygen-Deficient Single-Crystal Potassium Tantalate (KTaO3), Phys. Rev. 137, A1575 (1965).
- Uwe et al. (1979) H. Uwe, J. Kinoshita, K. Yoshihiro, C. Yamanouchi, and T. Sakudo, Evidence for light and heavy conduction electrons at the zone center in KTaO3, Phys. Rev. B 19, 3041 (1979).
- Lin et al. (2017) X. Lin, C. W. Rischau, L. Buchauer, A. Jaoui, B. Fauqué, and K. Behnia, Metallicity without quasi-particles in room-temperature strontium titanate, npj Quantum Mater. 2, 41 (2017).
- Müller et al. (1968) K. A. Müller, W. Berlinger, and F. Waldner, Characteristic Structural Phase Transition in Perovskite-Type Compounds, Phys. Rev. Lett. 21, 814 (1968).
- Tao et al. (2016) Q. Tao, B. Loret, B. Xu, X. Yang, C. W. Rischau, X. Lin, B. Fauqué, M. J. Verstraete, and K. Behnia, Nonmonotonic anisotropy in charge conduction induced by antiferrodistortive transition in metallic SrTiO3, Phys. Rev. B 94, 035111 (2016).
- Mishchenko et al. (2018) A. S. Mishchenko, L. Pollet, N. V. Prokof’ev, A. Kumar, D. L. Maslov, and N. Nagaosa, Polaron mobility in the ”beyond quasiparticles” regime, arXiv (2018), arXiv:1812.10336 .
- Zhou et al. (2018) J.-J. Zhou, O. Hellman, and M. Bernardi, Electron-Phonon Scattering in the Presence of Soft Modes and Electron Mobility in SrTiO3 Perovskite from First Principles, Phys. Rev. Lett. 121, 226603 (2018).
- Sakai et al. (2009) A. Sakai, T. Kanno, S. Yotsuhashi, H. Adachi, and Y. Tokura, Thermoelectric Properties of Electron-Doped KTaO3, Jpn. J. Appl. Phys. 48, 097002 (2009).
- Note (2) In the three-band model of van der Marel et al. van der Marel et al. (2011) the lowest band is heavy, while the others are light. However, in our much simpler model with purely parabolic bands, we neglect band repulsion. Thus, the second band is the heavy one and crosses the lighter first band.
- Barrett (1952) J. H. Barrett, Dielectric Constant in Perovskite Type Crystals, Phys. Rev. 86, 118 (1952).
- Maxwell (1954) J. C. Maxwell, A Treatise on Electricity and Magnetism, 3rd ed. (Dover Publications, New York, 1954).
- Lunkenheimer et al. (2002) P. Lunkenheimer, V. Bobnar, A. V. Pronin, A. I. Ritus, A. A. Volkov, and A. Loidl, Origin of apparent colossal dielectric constants, Phys. Rev. B 66, 052105 (2002).
- Niermann et al. (2012) D. Niermann, F. Waschkowski, J. de Groot, M. Angst, and J. Hemberger, Dielectric Properties of Charge-Ordered LuFe2O4 Revisited: The Apparent Influence of Contacts, Phys. Rev. Lett. 109, 016405 (2012).
- Hemberger et al. (1996) J. Hemberger, M. Nicklas, R. Viana, P. Lunkenheimer, A. Loidl, and R. Böhmer, Quantum paraelectric and induced ferroelectric states in SrTiO3, J. Phys.: Condens. Matter 8, 4673 (1996).
- Shannon (1976) R. D. Shannon, Revised effective ionic radii and systematic studies of interatomic distances in halides and chalcogenides, Acta Crystallogr. Sect. A 32, 751 (1976).
- Brous et al. (1953) J. Brous, I. Fankuchen, and E. Banks, Rare earth titanates with a perovskite structure, Acta Crystallogr. 6, 67 (1953).