Searching for Highly Magnified Stars at Cosmological Distances: Discovery of a Redshift 0.94 Blue Supergiant in Archival Images of the Galaxy Cluster MACS J0416.1-2403
Abstract
Individual highly magnified stars have been recently discovered at lookback times of more than half the age of the Universe, in lensed galaxies that straddle the critical curves of massive galaxy clusters. Having confirmed their detectability, it is now important to carry out systematic searches for them in order to establish their frequency, and in turn learn about the statistical properties of high-redshift stars and of the granularity of matter in the foreground deflector. Here we report the discovery of a highly magnified star at redshift in a strongly lensed arc behind a Hubble Frontier Field galaxy cluster, MACS J0416.1-2403, discovered as part of a systematic archival search. The bright transient (dubbed “Warhol”) was discovered in Hubble Space Telescope data taken on 2014 September 15 and 16. This single image faded over a period of two weeks, and observations taken on 2014 September 1 show that the duration of the microlensing event was at most four weeks in total. The light curve may also exhibit slow changes over a period of years consistent with the level of microlensing expected from stars responsible for the intracluster light (ICL) of the cluster. Optical and infrared observations taken near peak brightness can be fit by a stellar spectrum with moderate host-galaxy extinction. A blue supergiant matches the measured spectral energy distribution near peak, implying a temporary magnification of at least several thousand. While the spectrum of an O-type star would also fit the transient’s spectral energy distribution, extremely luminous O-type stars are much less common than blue supergiants. The short timescale of the event and the estimated effective temperature indicate that the lensed source is an extremely magnified star.
1 Introduction
In 2016 May, imaging of a Hubble Frontier Field (HFF) galaxy-cluster field, MACS J1149.5+2223 (MACS1149; redshift ), revealed a several-week-long transient ( mag AB; mag AB at peak) in a highly magnified galaxy at (Kelly et al., 2018). A highly magnified image of the lensed star has always been detected in deep Hubble Space Telescope (HST) observations, and the spectral energy distribution (SED) of the star measured in HFF imaging in 2014 matches that of the bright transient detected in 2016 May, consistent with temporarily increased magnification. The SED also exhibits a strong Balmer jump present in some luminous stars yet absent from stellar outbursts. Finally, simulations of microlensing of a background star by stars or remnants in the foreground cluster can produce light curves similar to that observed (Diego et al., 2018; Kelly et al., 2018; Venumadhav et al., 2017). The discovery of the star realized a theoretical prediction that individual stars at cosmological distances could become sufficiently magnified to be detected (Miralda-Escude, 1991).
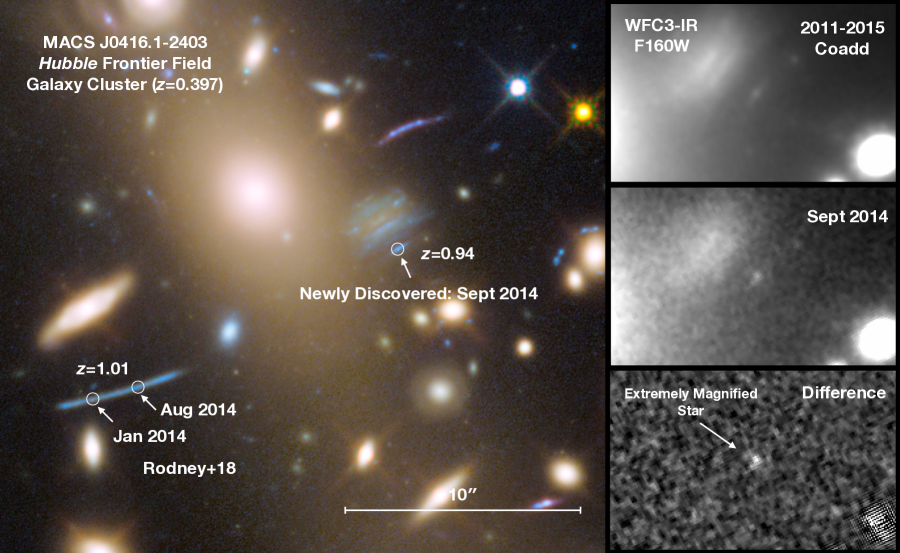
In 2014 January and August, the FrontierSN project (PI S. Rodney) detected a pair of transients dubbed the “Spock” events at two separate locations in a highly magnified galaxy at behind the MACS J0416.1-2403 (MACS0416; Ebeling et al. 2001) galaxy cluster () using HST. These events, whose locations are shown in Fig. 1, were identified during two month-long campaigns to image MACS0416 as part of HFF project (PI J. Lotz). While the events each lasted only several weeks, their interpretation was not immediately apparent. The detection of the lensed star in MACS J1149 magnified by at peak brightness prompted the interpretation of the two MACS0416 events as likely microlensing events (Rodney et al., 2018).
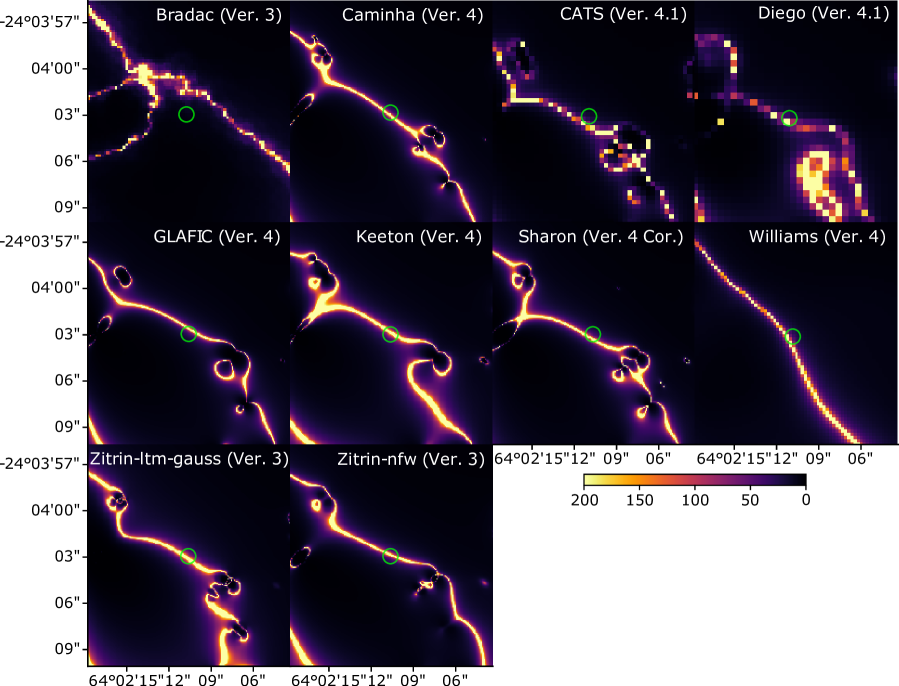
As shown in Fig. 1, we have now identified a third highly magnified star in the MACS0416 field in a different lensed galaxy at in archival HST imaging taken in 2014 September. We have named this transient “Warhol” given its “fifteen minutes of fame.” Fig. 2 shows that the transient is within a small fraction of an arcsecond from the location of the MACS0416 cluster’s critical curve according to published models. At these small separations from the critical curve, microlensing of bright stars in a background arc by objects in the foreground cluster including stars or remnants is not only possible, but in fact inevitable.
In Section 2, we describe the imaging data in this paper. Section 3 provides the details of the methods we use to analyze the HST imaging. In Section 4, the results of our analysis are presented, and our conclusions are given in Section 5. All magnitudes are in the AB system (Oke & Gunn, 1983), and we use a standard set of cosmological parameters (, , = 70 km s-1 Mpc-1).
2 Data
Imaging of the MACS0416 galaxy-cluster field with the ACS and WFC3 cameras has been acquired as part of the Cluster Lensing and Supernova survey with Hubble (CLASH; GO-12459; Postman et al. 2012), the Grism Lens-Amplified Survey from Space (GLASS; PI T. Treu; GO-13459; Schmidt et al. 2014; Treu et al. 2015), the HFF (GO-13496; Lotz et al. 2017), the FrontierSN follow-up program (PI S. Rodney; GO-13386), and the Final UV Frontier project (PI Siana; GO-14209). Earlier imaging of the MACS0416 field, not analyzed in this paper, was acquired with the WFPC2 (PI H. Ebeling; GO-11103). The microlensing peak we report here occurred in the target-of-opportunity imaging follow-up of the Spock events (Rodney et al., 2018) acquired by the FrontierSN program.
3 Methods
3.1 Image Processing and Coaddition
We aligned all imaging with TweakReg, and then resampled images to a scale of 0.03″ pixel-1 using AstroDrizzle (Fruchter et al., 2010).
3.2 PythonPhot Photometry
We use PythonPhot111https://github.com/djones1040/PythonPhot (Jones et al., 2015) to measure the light curves from difference imaging. The PythonPhot package includes an implementation of point-spread function (PSF) fitting photometry based on the DAOPHOT algorithm (Stetson, 1987).
4 Results
4.1 Position and Underlying Arc
The transient’s J2000 coordinates are , in the World Coordinate System (WCS) of the official HFF coadded images. A spectrum of the underlying arc acquired by the CLASH-VLT survey yielded (Balestra et al., 2016; Caminha et al., 2017). The smaller redshift of the arc (compared with the previous examples of lensed stars) implies that fainter stars can be magnified above the detection threshold. Patrício et al. (2018) measure an oxygen abundance of 12 + log(O/H) = dex and a low extinction of from nebular emission lines for the lensed system from Multi Unit Spectroscopic Explorer (MUSE) integral-field unit (IFU) spectroscopy.
4.2 Magnification Predictions for Galaxy-Cluster Models
We calculate magnification maps at using ten independent Frontier Fields Lens Models (Lotz et al., 2017) for the MACS0416 galaxy cluster, as shown in Fig. 2. The predicted magnification due to the galaxy-cluster lens at Warhol’s position is listed in Table 2. In general, the locations of galaxy-cluster critical curves are constrained by current models to within several tenths of an arcsecond in the best cases. Given Warhol’s proximity to the critical curve, the uncertainty in the critical curve’s location results in a large magnification uncertainty at its position.
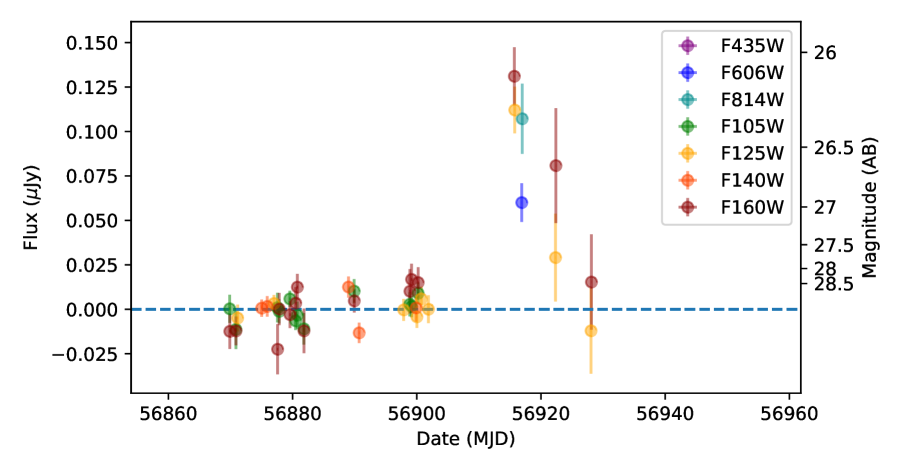
4.3 Light Curve and Duration of Event
The optical and near-infrared light curve plotted in Fig. 3 shows that the microlensing event faded over a period of at least two weeks. The event was at least times brighter (total flux) in the infrared (IR) band than its underlying arc in archival HST imaging during the HFF project, as the true peak of this microlensing event may have occurred during gaps of HST visits, as shown in Fig. 3. Photometry is measured using a 0.2″ aperture (detailed values are listed in Table 3).
A microlensing peak should have a duration roughly , where is the size of the lensed source and is the transverse velocity of the lensing system. Given the km s-1 expected relative transverse velocity between the galaxy cluster and background source, the several-week timescale of the microlensing peaks implies that the lensed sources can only extend for at most several tens of AU. Consequently, the lensed systems must be stellar systems (e.g., single star or binary system) instead of a star cluster.
4.4 A Single-Image Transient Event
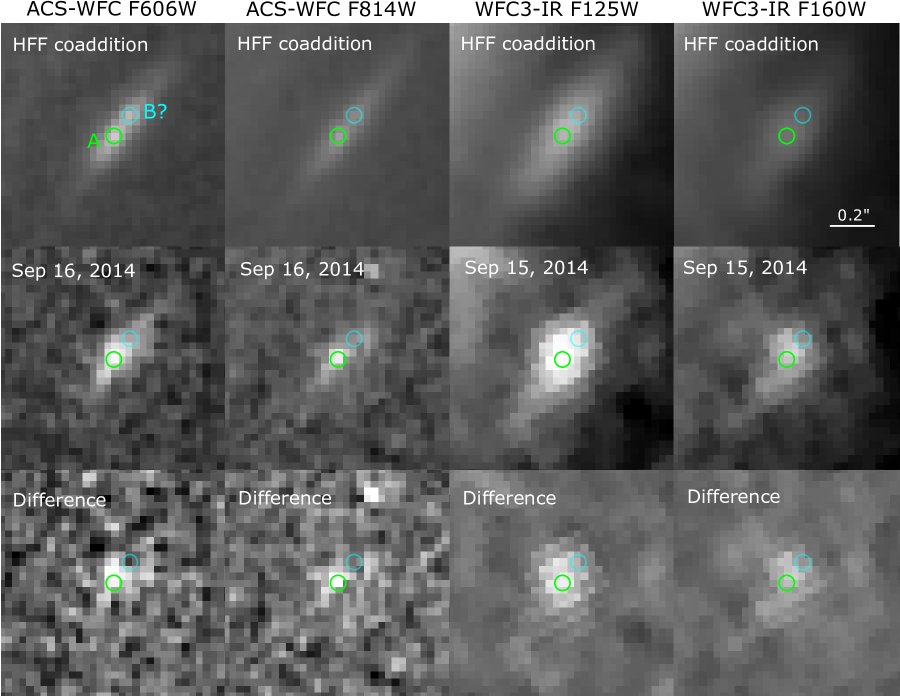
Sources near a cluster fold caustic (with no microlenses) should appear as a pair of images with equal magnification. Therefore, if the new transient were a stellar outburst, we would expect to see a pair of transients with a relative time delay of less than a day. By contrast, a microlensing event should only appear as a single transient, as a star or remnant in the cluster becomes temporarily aligned with one of the magnified images of the background star. As shown in Fig. 6, only a single bright transient along the arc was detected during the 2014 September HST visits.
4.5 A Counterimage of the Lensed Star?
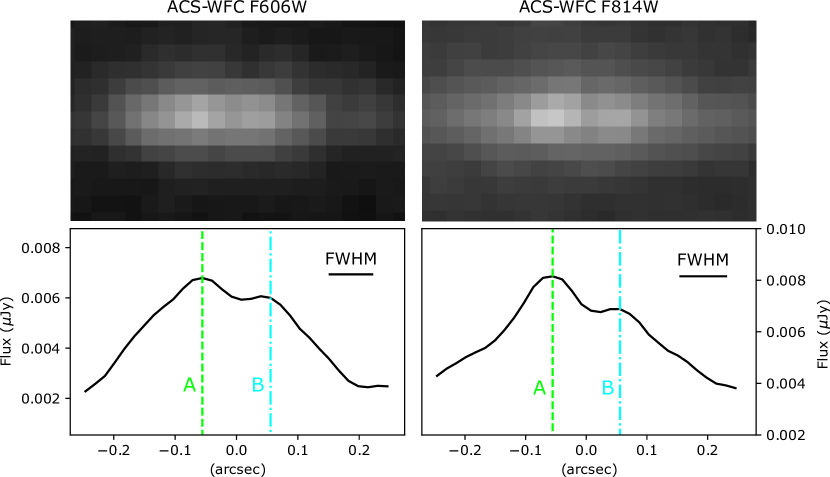
Warhol’s location, marked by the green circle labeled “A” in Fig. 6, corresponds to a peak along the underlying arc in coadditions of HFF F606W and F814W imaging acquired before the microlensing event. To determine whether a counterimage of the underlying source may exist along the arc, we measured the flux inside of a 0.05″ diameter aperture as we moved it along the arc. Fig. 7 shows possible evidence for a second peak labeled “B” along the underlying arc. The locations A and B are separated by . In the absence of microlensing, the fluxes of two counterimages should be identical. Therefore, the fact that two observed potential counterimages do not exhibit equal fluxes implies the presence of microlensing.
| Spec. Model | Temp | F125W | ||||
|---|---|---|---|---|---|---|
| BSG | B8V | 11749K | -8.5 | 34.94 | -0.52 | 3003 |
| Extreme MS | O5V | 39810K | -8 | 35.58 | -0.39 | 5381 |
| MS | O5V | 39810K | -5.40 | 38.18 | -0.39 | 59002 |
| MS | O9V | 35481K | -4.00 | 39.60 | -0.37 | 218257 |
| MS | B0V | 28183K | -3.70 | 39.87 | -0.39 | 280249 |
| MS | B1V | 22387K | -3.20 | 40.33 | -0.43 | 429719 |
| MS | B3V | 19054K | -2.10 | 41.41 | -0.45 | 1163781 |
| MS | B5-7V | 14125K | -2.10 | 41.38 | -0.48 | 1126591 |
| MS | B8V | 11749K | -1.08 | 42.36 | -0.52 | 2789947 |
4.6 Spectral Energy Distribution of the Star
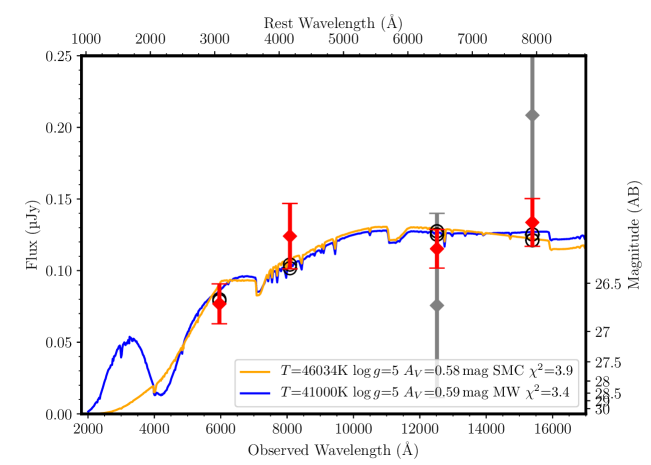
After correcting for extinction expected for the Galactic foreground ( mag; Schlafly & Finkbeiner 2011), we fit the spectral energy distribution (SED) of the microlensing peak. ACS-WFC F606W and F814W, as well as WFC-IR F125W and F160W, imaging was acquired during a first epoch on 2014 September 15–16; the optical and IR integrations were interspersed with each other in time. As shown in Fig. 3, the transient was still detected during a second imaging epoch on 2014 September 22.
We simultaneously fit a Castelli & Kurucz (2004) stellar atmosphere model and a host-galaxy extinction curve to the measured SED of the Warhol microlensing event. We assume that the source did not vary significantly while the optical and IR images were acquired during the first epoch. We include as a fit parameter the change in the magnification (relative normalization of the SED) between the first and second epochs.
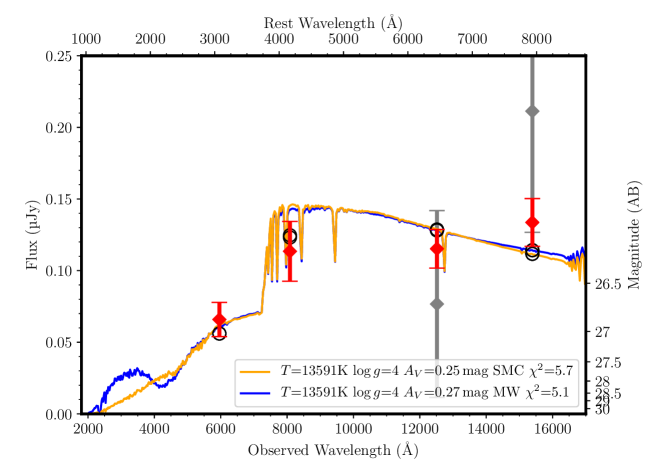
Fig. 4 shows the best fit to the measured photometry when we allow the temperature of the stellar photosphere to vary as a free parameter. In Fig. 5, we show that the best-fitting stellar model (with temperature K) to the highly magnified blue supergiant Icarus in the MACS1149 field (Kelly et al., 2018) also provides a reasonable fit to Warhol’s SED. The low to moderate best-fitting host-galaxy dust extinction is consistent with the mag extinction inferred by Patrício et al. (2018) from an analysis of nebular emission lines from the lensed galaxy. We expect that microlensing may only potentially be chromatic when a microcaustic is close to the limb of the star, but this should occur over a very short timescale smaller than the 2 days during which observations near peak were acquired.
4.7 Magnification
We use the definition of a K-correction as
| (1) |
where is the observer-frame apparent magnitude in the y band, is the rest-frame absolute magnitude in the x band, and is the distance modulus. To calculate a K-correction, we use Eq. 2 of Kim et al. (1996),
| (2) |
where , is the WFC3 synthetic magnitude of a redshifted model spectrum, and is the synthetic Johnson V-band magnitude of the rest-frame model spectrum. Using the best-fitting spectral models, we calculate , and adopt mag at (with no correction for magnification).
For fold caustics, the source-plane area within which the magnification exceeds scales as . Consequently, low-magnification microlensing events have greater probability of occurring. In the case of Icarus, a persistent image of the lensed blue supergiant has always been detected in deep HST imaging, and the magnification is on average 300–600, with inferred microlensing magnification reaching up to during an event in 2016 (Kelly et al., 2018).
The luminosities of blue supergiant stars in the Small Magellanic Cloud (SMC) reach mag Dachs (1970). There are examples of extremely luminous, main-sequence O-type stars such as Melnick 34 in the 30 Doradus complex in the Large Magellanic Cloud (LMC) with an absolute magnitude of (Doran et al., 2013).
However, a very luminous O-type star or Wolf-Rayet stars showing H in their spectra (WNH) should be extremely rare, whereas cooler B-type supergiants at lower bolometric luminosity but similar will be much more common in the field of a star-forming galaxy. The comparatively small abundance of WNH stars arises from their initial masses (very approximately 100 vs. 10–20 ), but also the significantly longer lifetimes at the lower masses. Among binary stars, blue supergiants can also be blue stragglers from mass gainers and mergers.
For a blue supergiant star with identical temperature and luminosity, the apparent magnitude observed for Warhol at would require a factor smaller magnification than would Icarus at given its peak apparent magnitude of . We note, however, that Warhol’s light curve likely does not include its peak brightness. In Table 1, we list the magnification required for main-sequence and post-main-sequence stars of different spectroscopic types.
4.8 Constraints on Source Size
The separation between A and its possible counterimage B is . Near the critical curve, the GLAFIC galaxy-cluster mass model yields the following magnification for each of the images, in the case of a smooth model (i.e., with no microlensing):
| (3) |
where is the angular distance from the critical curve. At an offset of from the galaxy-cluster critical curve, (, ), which may be a plausible location for caustic crossing given the saturation argument presented by Diego et al. (2018).
We also compute the source crossing time as
| (4) |
where is a transverse velocity of the cluster and is a radius of a backgroud star that is magnified. From the light curve, we have days (see Fig. 2 of Miralda-Escude 1991 to see how relates to the expected timescale of the light curve’s evolution), which yields a limit of . Assuming and , the maximum magnification estimated using Eq. 48 of Oguri et al. (2018) is
| (5) |
For (typical mass of a star responsible for the intracluster light of the cluster), we have for , for , and for , where a larger yields a greater maximum magnification. The comparison with Table 1 suggests that normal main-sequence stars are unlikely to be observed as microlensing events, and we need to consider either blue supergiants or extremely luminous O-type stars to explain the Warhol event.
As shown in Fig. 7, the sources A and B appear to be unresolved in HFF F606W and F814W imaging acquired before the microlensing event. An approximate estimate, assuming a transversal magnification of 100, indicates that the coincident source at positions A and B detected in HFF imaging occurred must be 3 pc at most, so it must be a single star, stellar system, or a compact stellar cluster.
| Model | References | ||
|---|---|---|---|
| Bradač (v3) | 11 | 197 | Hoag et al. (2016); Bradač et al. (2009, 2005) |
| Caminha (v4) | 56 | 205 | Caminha et al. (2017) |
| CATS (v4.1) | 15 | 201 | Jauzac et al. (2014); Richard et al. (2014); Jauzac et al. (2012) |
| Diego (v4.1) | 25 | 250 | Diego et al. (2005a, b, 2007, 2015) |
| GLAFIC (v4) | 45 | 180bbObtained using updated high-resolution maps instead of the published HFF models. | Kawamata et al. (2018, 2016); Oguri (2010) |
| Keeton (v4) | 369 | 304 | McCully et al. (2014); Ammons et al. (2014); Keeton (2010) |
| Sharon (v4 Cor.) | 40 | 228 | Johnson et al. (2014); Jullo et al. (2007) |
| Williams/GRALE (v4) | 40bbObtained using updated high-resolution maps instead of the published HFF models. | 250bbObtained using updated high-resolution maps instead of the published HFF models. | Sebesta et al. (2016); Liesenborgs et al. (2006) |
| Zitrin-ltm-gauss (v3) | 100 | 331 | Zitrin et al. (2013, 2009) (see also Merten et al. 2011, 2009) |
| Zitrin-nfw (v3) | 348 | 208 | Zitrin et al. (2013, 2009) (see also Merten et al. 2011, 2009) |
5 Conclusions
In archival HST imaging taken in 2014 September, we have identified a microlensing event dubbed Warhol in a strongly lensed galaxy at very close to the location of the critical curve of the foreground MACS0416 galaxy cluster at . The transient’s SED is consistent with the presence of a strong Balmer break, expected for blue supergiant stars, which are also the most common very luminous stars at rest-frame optical wavelengths.
The lower temperatures and densities of H-rich stellar eruptions, by contrast, generally lack a strong Balmer jump. Further evidence for a microlensing event is the absence of a second detected transient event near the critical curve, as shown in Fig. 6. Time delays should be on the order of days at small separations from the critical curve, yet no opposing image is detected. The probability that Warhol could consist of two unresolved images of an outburst is very small, given the comparatively small area in the source plane where any such eruption must occur (Kelly et al., 2018). Warhol’s spatial coincidence with the underlying source in the strongly lensed background implies it is very unlikely to be the explosion or outburst of a star in the intracluster medium.
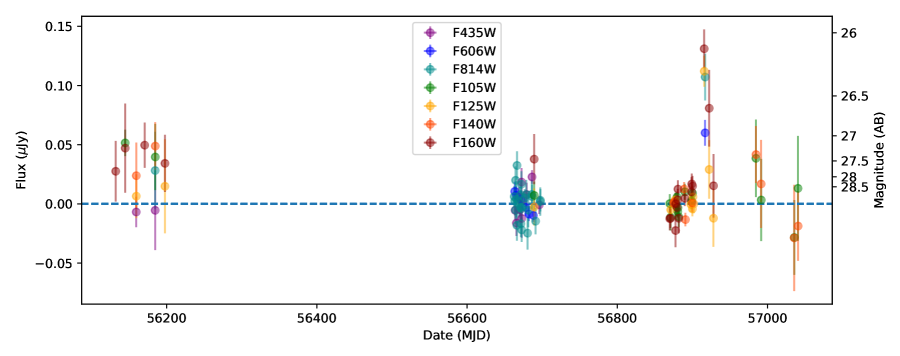
Furthermore, long-term variation in the light curve measured at Warhol’s position is consistent with slow fluctuations expected from microlensing by objects in the MACS0416 intracluster medium.
The frequency of bright microlensing events including Icarus (Kelly et al., 2018), likely the Spock events (Rodney et al., 2018), and Warhol provide a new probe of the mass density of objects in the intracluster medium (Diego et al., 2018; Kelly et al., 2018; Venumadhav et al., 2017; Oguri et al., 2018), as well as the qualitative properties and luminosity functions of massive stars at high redshift (Kelly et al., 2018). Diego (2018) have found that 50,000 luminous stars at redshifts between and should experience an average magnification exceeding 100 from lensing halos of all masses. Of these, approximately 8000 stars should have a mean magnification greater than 250 and should exhibit relatively frequent microlensing peaks. Windhorst et al. (2018) have also recently shown that high magnification during caustic-crossing events close to cluster critical curves should provide an opportunity to observe directly Population III stars at high redshifs using the James Webb Space Telescope.
| Date | Bandpass | Flux | |
|---|---|---|---|
| (MJD) | (Jy) | (Jy) | |
| 56159.53 | ACS F435W | -0.0068 | 0.0129 |
| 56184.75 | ACS F435W | -0.0054 | 0.0336 |
| 56663.91 | ACS F435W | -0.0054 | 0.0080 |
| 56665.62 | ACS F435W | -0.0162 | 0.0109 |
| 56668.55 | ACS F435W | 0.0055 | 0.0082 |
| 56670.42 | ACS F435W | -0.0049 | 0.0049 |
| 56671.94 | ACS F435W | 0.0025 | 0.0083 |
| 56672.47 | ACS F435W | 0.0184 | 0.0118 |
| 56672.73 | ACS F435W | -0.0123 | 0.0163 |
| 56679.25 | ACS F435W | 0.0079 | 0.0099 |
| 56686.41 | ACS F435W | 0.0227 | 0.0057 |
| 56696.11 | ACS F435W | -0.0008 | 0.0077 |
| 56663.43 | ACS F606W | 0.0105 | 0.0083 |
| 56665.36 | ACS F606W | 0.0073 | 0.0075 |
| 56671.47 | ACS F606W | 0.0040 | 0.0074 |
| 56678.25 | ACS F606W | -0.0030 | 0.0071 |
| 56682.10 | ACS F606W | -0.0086 | 0.0059 |
| 56688.21 | ACS F606W | -0.0098 | 0.0052 |
| 56916.89 | ACS F606W | 0.0600 | 0.0109 |
| 56184.74 | ACS F814W | 0.0282 | 0.0326 |
| 56662.65 | ACS F814W | 0.0062 | 0.0087 |
| 56663.56 | ACS F814W | 0.0025 | 0.0122 |
| 56664.43 | ACS F814W | -0.0052 | 0.0118 |
| 56664.56 | ACS F814W | 0.0199 | 0.0117 |
| 56665.49 | ACS F814W | 0.0039 | 0.0152 |
| 56666.35 | ACS F814W | -0.0181 | 0.0130 |
| 56666.49 | ACS F814W | 0.0325 | 0.0119 |
| 56669.28 | ACS F814W | 0.0013 | 0.0128 |
| 56670.61 | ACS F814W | -0.0030 | 0.0122 |
| 56671.16 | ACS F814W | 0.0078 | 0.0112 |
| 56671.60 | ACS F814W | -0.0167 | 0.0113 |
| 56672.07 | ACS F814W | -0.0040 | 0.0115 |
| 56672.28 | ACS F814W | 0.0166 | 0.0110 |
| 56672.60 | ACS F814W | -0.0219 | 0.0103 |
| 56672.87 | ACS F814W | -0.0026 | 0.0117 |
| 56676.58 | ACS F814W | 0.0050 | 0.0074 |
| 56678.91 | ACS F814W | 0.0079 | 0.0124 |
| 56680.44 | ACS F814W | -0.0247 | 0.0139 |
| 56681.50 | ACS F814W | -0.0053 | 0.0143 |
| 56686.15 | ACS F814W | 0.0080 | 0.0124 |
| 56686.55 | ACS F814W | 0.0061 | 0.0102 |
| 56691.20 | ACS F814W | -0.0146 | 0.0111 |
| 56697.44 | ACS F814W | 0.0020 | 0.0120 |
| 56697.57 | ACS F814W | 0.0030 | 0.0094 |
| 56916.96 | ACS F814W | 0.1072 | 0.0197 |
| 56144.84 | WFC3 F105W | 0.0515 | 0.0111 |
| 56184.88 | WFC3 F105W | 0.0396 | 0.0279 |
| 56689.40 | WFC3 F105W | 0.0072 | 0.0117 |
| 56869.77 | WFC3 F105W | 0.0003 | 0.0079 |
| 56870.76 | WFC3 F105W | -0.0113 | 0.0111 |
| 56877.46 | WFC3 F105W | 0.0009 | 0.0084 |
| 56877.73 | WFC3 F105W | -0.0012 | 0.0068 |
| 56879.46 | WFC3 F105W | 0.0058 | 0.0046 |
| 56880.38 | WFC3 F105W | -0.0065 | 0.0052 |
| 56880.65 | WFC3 F105W | -0.0033 | 0.0077 |
| 56881.71 | WFC3 F105W | -0.0110 | 0.0089 |
| 56889.81 | WFC3 F105W | 0.0102 | 0.0067 |
| 56898.77 | WFC3 F105W | 0.0028 | 0.0068 |
| 56899.04 | WFC3 F105W | 0.0016 | 0.0061 |
| 56900.10 | WFC3 F105W | 0.0090 | 0.0061 |
| 56984.57 | WFC3 F105W | 0.0385 | 0.0327 |
| 56991.60 | WFC3 F105W | 0.0033 | 0.0347 |
| 57035.58 | WFC3 F105W | -0.0284 | 0.0316 |
| 57040.55 | WFC3 F105W | 0.0131 | 0.0443 |
| 56159.60 | WFC3 F125W | 0.0065 | 0.0185 |
| 56197.79 | WFC3 F125W | 0.0149 | 0.0397 |
| 56689.34 | WFC3 F125W | -0.0026 | 0.0157 |
| 56871.04 | WFC3 F125W | -0.0049 | 0.0075 |
| 56876.93 | WFC3 F125W | 0.0033 | 0.0048 |
| 56897.84 | WFC3 F125W | -0.0003 | 0.0062 |
| 56899.97 | WFC3 F125W | -0.0043 | 0.0062 |
| 56900.64 | WFC3 F125W | 0.0059 | 0.0069 |
| 56901.83 | WFC3 F125W | 0.0000 | 0.0079 |
| 56915.76 | WFC3 F125W | 0.1121 | 0.0131 |
| 56922.33 | WFC3 F125W | 0.0291 | 0.0247 |
| 56928.05 | WFC3 F125W | -0.0121 | 0.0242 |
| 56159.62 | WFC3 F140W | 0.0238 | 0.0280 |
| 56184.87 | WFC3 F140W | 0.0489 | 0.0201 |
| 56874.94 | WFC3 F140W | 0.0006 | 0.0048 |
| 56875.87 | WFC3 F140W | 0.0016 | 0.0058 |
| 56888.95 | WFC3 F140W | 0.0125 | 0.0060 |
| 56890.67 | WFC3 F140W | -0.0133 | 0.0057 |
| 56899.84 | WFC3 F140W | 0.0008 | 0.0077 |
| 56984.63 | WFC3 F140W | 0.0417 | 0.0240 |
| 56991.47 | WFC3 F140W | 0.0169 | 0.0372 |
| 57035.45 | WFC3 F140W | -0.0287 | 0.0449 |
| 57040.62 | WFC3 F140W | -0.0187 | 0.0293 |
| 56132.22 | WFC3 F160W | 0.0276 | 0.0256 |
| 56144.86 | WFC3 F160W | 0.0471 | 0.0376 |
| 56170.77 | WFC3 F160W | 0.0496 | 0.0191 |
| 56197.77 | WFC3 F160W | 0.0342 | 0.0241 |
| 56689.33 | WFC3 F160W | 0.0378 | 0.0212 |
| 56869.78 | WFC3 F160W | -0.0124 | 0.0099 |
| 56870.78 | WFC3 F160W | -0.0122 | 0.0081 |
| 56877.48 | WFC3 F160W | -0.0225 | 0.0141 |
| 56877.75 | WFC3 F160W | 0.0001 | 0.0091 |
| 56879.47 | WFC3 F160W | -0.0030 | 0.0075 |
| 56880.40 | WFC3 F160W | 0.0034 | 0.0090 |
| 56880.67 | WFC3 F160W | 0.0125 | 0.0075 |
| 56881.73 | WFC3 F160W | -0.0122 | 0.0126 |
| 56889.83 | WFC3 F160W | 0.0047 | 0.0066 |
| 56898.79 | WFC3 F160W | 0.0101 | 0.0125 |
| 56899.06 | WFC3 F160W | 0.0168 | 0.0088 |
| 56900.12 | WFC3 F160W | 0.0151 | 0.0086 |
| 56915.70 | WFC3 F160W | 0.1311 | 0.0163 |
| 56922.39 | WFC3 F160W | 0.0808 | 0.0323 |
| 56928.12 | WFC3 F160W | 0.0153 | 0.0268 |
References
- Ammons et al. (2014) Ammons, S. M., Wong, K. C., Zabludoff, A. I., & Keeton, C. R. 2014, ApJ, 781, 2
- Balestra et al. (2016) Balestra, I., Mercurio, A., Sartoris, B., et al. 2016, ApJS, 224, 33
- Bradač et al. (2005) Bradač, M., Schneider, P., Lombardi, M., & Erben, T. 2005, A&A, 437, 39
- Bradač et al. (2009) Bradač, M., Treu, T., Applegate, D., et al. 2009, ApJ, 706, 1201
- Caminha et al. (2017) Caminha, G. B., Grillo, C., Rosati, P., et al. 2017, A&A, 600, A90
- Castelli & Kurucz (2004) Castelli, F., & Kurucz, R. L. 2004, ArXiv Astrophysics e-prints, astro-ph/0405087
- Dachs (1970) Dachs, J. 1970, A&A, 9, 95
- Diego (2018) Diego, J. M. 2018, ArXiv e-prints, arXiv:1806.04668
- Diego et al. (2005a) Diego, J. M., Protopapas, P., Sandvik, H. B., & Tegmark, M. 2005a, MNRAS, 360, 477
- Diego et al. (2005b) Diego, J. M., Sandvik, H. B., Protopapas, P., et al. 2005b, MNRAS, 362, 1247
- Diego et al. (2007) Diego, J. M., Tegmark, M., Protopapas, P., & Sandvik, H. B. 2007, MNRAS, 375, 958
- Diego et al. (2015) Diego, J. M., Broadhurst, T., Benitez, N., et al. 2015, MNRAS, 446, 683
- Diego et al. (2018) Diego, J. M., Kaiser, N., Broadhurst, T., et al. 2018, ApJ, 857, 25
- Doran et al. (2013) Doran, E. I., Crowther, P. A., de Koter, A., et al. 2013, A&A, 558, A134
- Ebeling et al. (2001) Ebeling, H., Edge, A. C., & Henry, J. P. 2001, ApJ, 553, 668
- Fruchter et al. (2010) Fruchter, A. S., Hack, W., Dencheva, M., Droettboom, M., & Greenfield, P. 2010, in 2010 Space Telescope Science Institute Calibration Workshop, p. 382-387, 382–387
- Hoag et al. (2016) Hoag, A., Huang, K.-H., Treu, T., et al. 2016, ApJ, 831, 182
- Jauzac et al. (2012) Jauzac, M., Jullo, E., Kneib, J.-P., et al. 2012, MNRAS, 426, 3369
- Jauzac et al. (2014) Jauzac, M., Clément, B., Limousin, M., et al. 2014, MNRAS, 443, 1549
- Johnson et al. (2014) Johnson, T. L., Sharon, K., Bayliss, M. B., et al. 2014, ApJ, 797, 48
- Jones et al. (2015) Jones, D. O., Scolnic, D. M., & Rodney, S. A. 2015, PythonPhot: Simple DAOPHOT-type photometry in Python, Astrophys. Source Code Lib., ascl:1501.010
- Jullo et al. (2007) Jullo, E., Kneib, J.-P., Limousin, M., et al. 2007, New J. Phys., 9, 447
- Kawamata et al. (2018) Kawamata, R., Ishigaki, M., Shimasaku, K., et al. 2018, ApJ, 855, 4
- Kawamata et al. (2016) Kawamata, R., Oguri, M., Ishigaki, M., Shimasaku, K., & Ouchi, M. 2016, ApJ, 819, 114
- Keeton (2010) Keeton, C. R. 2010, Gen. Rel. Grav., 42, 2151
- Kelly et al. (2018) Kelly, P. L., Diego, J. M., Rodney, S., et al. 2018, Nature Astronomy, 2, 334
- Kim et al. (1996) Kim, A., Goobar, A., & Perlmutter, S. 1996, PASP, 108, 190
- Liesenborgs et al. (2006) Liesenborgs, J., De Rijcke, S., & Dejonghe, H. 2006, MNRAS, 367, 1209
- Lotz et al. (2017) Lotz, J. M., Koekemoer, A., Coe, D., et al. 2017, ApJ, 837, 97
- McCully et al. (2014) McCully, C., Keeton, C. R., Wong, K. C., & Zabludoff, A. I. 2014, MNRAS, 443, 3631
- Merten et al. (2009) Merten, J., Cacciato, M., Meneghetti, M., Mignone, C., & Bartelmann, M. 2009, A&A, 500, 681
- Merten et al. (2011) Merten, J., Coe, D., Dupke, R., et al. 2011, MNRAS, 417, 333
- Miralda-Escude (1991) Miralda-Escude, J. 1991, ApJ, 379, 94
- Oguri (2010) Oguri, M. 2010, PASJ, 62, 1017
- Oguri et al. (2018) Oguri, M., Diego, J. M., Kaiser, N., Kelly, P. L., & Broadhurst, T. 2018, Phys. Rev. D, 97, 023518
- Oke & Gunn (1983) Oke, J. B., & Gunn, J. E. 1983, ApJ, 266, 713
- Patrício et al. (2018) Patrício, V., Richard, J., Carton, D., et al. 2018, MNRAS, 477, 18
- Pickles (1998) Pickles, A. J. 1998, PASP, 110, 863
- Postman et al. (2012) Postman, M., Coe, D., Benítez, N., et al. 2012, ApJS, 199, 25
- Richard et al. (2014) Richard, J., Jauzac, M., Limousin, M., et al. 2014, MNRAS, 444, 268
- Rodney et al. (2018) Rodney, S. A., Balestra, I., Bradac, M., et al. 2018, Nature Astronomy, 2, 324
- Schlafly & Finkbeiner (2011) Schlafly, E. F., & Finkbeiner, D. P. 2011, ApJ, 737, 103
- Schmidt et al. (2014) Schmidt, K. B., Treu, T., Brammer, G. B., et al. 2014, ApJ, 782, L36
- Sebesta et al. (2016) Sebesta, K., Williams, L. L. R., Mohammed, I., Saha, P., & Liesenborgs, J. 2016, MNRAS, 461, 2126
- Stetson (1987) Stetson, P. B. 1987, PASP, 99, 191
- Treu et al. (2015) Treu, T., Schmidt, K. B., Brammer, G. B., et al. 2015, ApJ, 812, 114
- Venumadhav et al. (2017) Venumadhav, T., Dai, L., & Miralda-Escudé, J. 2017, ApJ, 850, 49
- Windhorst et al. (2018) Windhorst, R. A., Timmes, F. X., Wyithe, J. S. B., et al. 2018, ApJS, 234, 41
- Zitrin et al. (2009) Zitrin, A., Broadhurst, T., Umetsu, K., et al. 2009, MNRAS, 396, 1985
- Zitrin et al. (2013) Zitrin, A., Meneghetti, M., Umetsu, K., et al. 2013, ApJ, 762, L30