Scalable Multilayer Architecture of Assembled Single-Atom Qubit Arrays
in a Three-Dimensional Talbot Tweezer Lattice
Abstract
We report on the realization of a novel platform for the creation of large-scale 3D multilayer configurations of planar arrays of individual neutral-atom qubits: a microlens-generated Talbot tweezer lattice that extends 2D tweezer arrays to the third dimension at no additional costs. We demonstrate the trapping and imaging of rubidium atoms in integer and fractional Talbot planes and the assembly of defect-free atom arrays in different layers. The Talbot self-imaging effect for microlens arrays constitutes a structurally robust and wavelength-universal method for the realization of 3D atom arrays with beneficial scaling properties. With more than 750 qubit sites per 2D layer, these scaling properties imply that qubit sites
are already accessible in 3D in our current implementation. The trap topology and functionality are configurable in the micrometer regime. We use this to generate interleaved lattices with dynamic position control and parallelized sublattice addressing of spin states for immediate application in quantum science and technology.
10.1103/PhysRevLett.130.180601
Rapid advances in experimental platforms for quantum science and technology propel progress in a wide range of forefront research: exploiting the laws of quantum mechanics, experiments promote quantum chemistry [1], quantum interferometry [2], quantum metrology [3, 4], and quantum information science [5, 6, 7, 8].
One of the signature architectures are arrays of neutral atoms in optical tweezers [9], which constitute a versatile experimental platform with comprehensive coherent control of quantum states and tunable interactions at the single quantum level. Their spatially resolved trapping sites are adaptable to hold individual atoms [10, 11, 12] and can be composed of multiple colors of laser light [13, 14, 15, 16]. Straightforward dynamic position control facilitates the coherent transport of quantum states [17, 18, 19, 20, 21] and the seminal assembly of defect-free subarrays [22, 23, 24, 25, 9]. Thus, arrays of individually controlled microtraps lend themselves to the bottom-up engineering of quantum systems with configurable tunnel coupling [26, 19, 27, 9, 28] and on-demand Rydberg interactions [29, 30, 22, 23, 24, 25, 31, 32, 9, 33, 16, 34].
For future progress, scalability is pivotal. In this Letter, we resolve this issue with a configurable large-scale implementation using a novel platform for quantum simulation and computing: we harness the Talbot effect [35, 36, 37, 38] to extend a microlens-array (MLA) generated 2D periodic configuration of single-atom microtraps to a multilayer architecture in the third dimension (Fig. 1). This Talbot tweezer lattice unlocks a new class of 3D atomic arrays with excellent scalability as it is built in parallel from a microfabricated source element with tens of thousands of lenslets [39, 40] and the self-imaging effect that extends the 2D tweezer array to 3D at no additional costs.
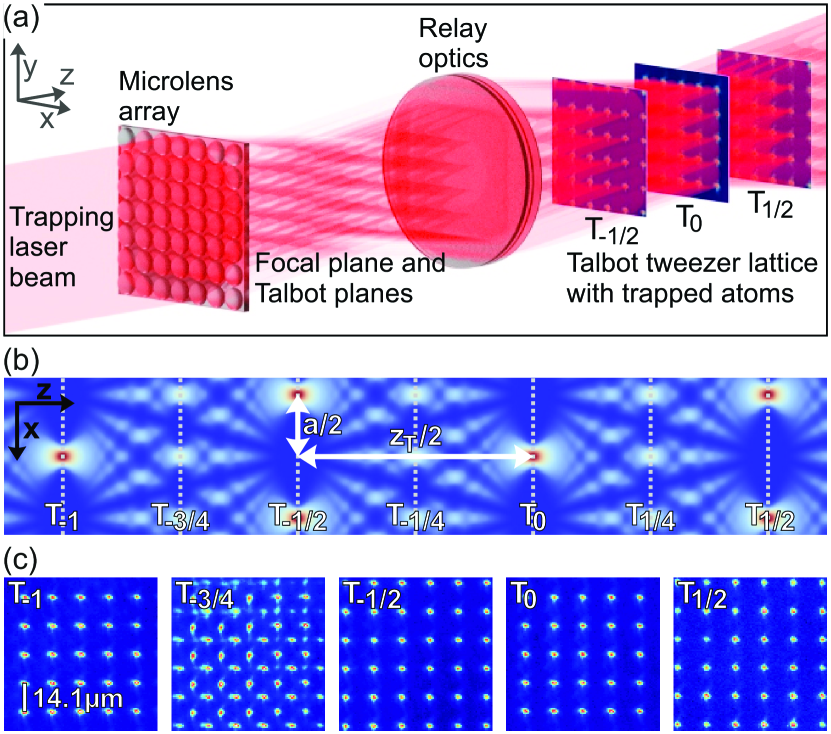
Figure 1(a) visualizes the experimental platform: the source element is a quadratic-grid MLA that is illuminated by a trapping laser beam with a Gaussian profile and produces a 2D periodic spot pattern in its focal plane. This is the origin of a 3D Talbot lattice, which exhibits integer and fractional self-images of the generating pattern in the axial dimension, referred to as Talbot planes [41]. The separation of integer self-images is given by the Talbot length , which is a quadratic function of the spatial period of the generating pattern. In our setup, the MLA’s focal plane with a pitch identical to the pitch of the MLA is reimaged and demagnified by the use of relay optics, which renders the trap size , trap pitch , and the associated Talbot length configurable. Individual planes are labeled according to their axial position normalized to with being the reimaged focal plane. An important modification due to reimaging is the appearance of negative indexed Talbot planes before the focal plane that complete the symmetric 3D structure of the resulting Talbot tweezer lattice. Principal planes, such as , show the same in-plane trapping geometry and pitch as the focal plane and are separated by . The planar arrays in consecutive principal planes are shifted by in the x and y direction.
A typical MLA, as used in the realization shown in Fig. 1, consists of refractive lenslets with a pitch of (see figure caption for experimental parameters). Figure 1(b) shows a 2D projection of the simulated Talbot tweezer lattice in the relevant region along the optical axis.
During a sequence of optical molasses, laser cooled 85Rb atoms are prepared in the lattice traps with typical depths on the order of . Because of the collisional blockade effect [10, 11], each site is occupied by one atom at most. For the preparation and imaging of a 2D array of atoms in a selected Talbot plane, the imaging system is focused to the selected plane and the atoms in all other planes are removed with a resonant blow-away laser beam. Figure 1(c) exemplarily shows the averaged fluorescence images of individual atoms stored in the traps of the reimaged focal plane and of the Talbot planes , , and . The trap positions are stable and optically resolved which reveals the underlying periodic geometry. For the fractional plane an increase in the number of trapping sites is observed.
As expected, the trap pitch is reduced by a factor of 2, but the number of trapping sites with visible atomic fluorescence differs from a simple model: the signal is weaker and even vanishes for a subclass of sites at regular positions. We attribute the observed behavior to a modulation of the peak intensities within the plane resulting, for certain positions, in a reduction of the trap depth to the limit where atoms are no longer retained.
This effect arises from interference of light transmitted by the lenslets and light transmitted through the interstices of the MLA as well as from components of the light field that are not included in a simple paraxial description and originate in the spherical shape and limited aperture of the lenslets [36, 54].
We do not observe these effects in the principal Talbot planes and thus limit our experiments to atoms within these principal planes.
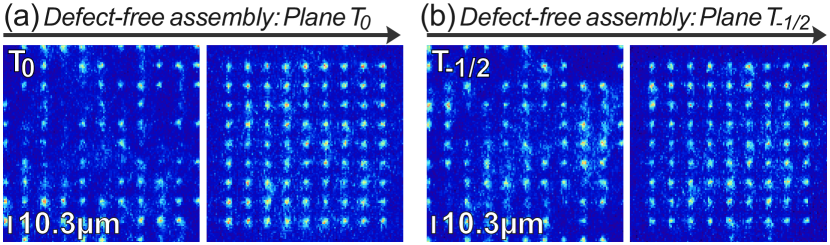
The stochastic nature of the single-atom loading process is reflected by the random distribution of stored atoms within the 3D lattice, as pictured in Figs. 2(a) (left) and 2(b) (left) for the tweezer arrays of planes and . We observe a maximum probability of 0.6 to load an atom for central sites. This necessitates the incorporation of techniques for individual atom transport [17, 18, 19, 20, 21] and deterministic target pattern assembly [21, 22, 23, 24, 25, 9], as a broad range of applications prerequires defect-free atom arrays and the ability to mend atom loss during operation. For this purpose, we use a superposed movable optical tweezer. This technique lends itself to 3D layered configurations of tweezer arrays [55] and is applicable to any Talbot plane in a straightforward fashion as demonstrated in this Letter.
In our setup, the transport tweezer is aligned with the imaging system and therefore automatically focused to the selected plane. The principle of operation is detailed in [39, 56], where it has been applied to the rearrangement of atoms in the plane so far. Starting from the initial atom distribution, which serves as a reservoir, a sequence of transport operations is performed in order to reach complete filling of a predefined target structure.
We define a atom cluster as target structure and operate on a reservoir grid of sites. On average, we initially prepare 191(17) atoms.
Figures 2(a) and 2(b) show fluorescence images of the atom pattern before and after successful assembly in the planes and . After rearrangement, we observe an average filling fraction on the order of and a typical success rate for a defect-free cluster of . This demonstrates that defect-free atom assembly is possible in all principle planes of the Talbot tweezer lattice.

As a consequence, the Talbot tweezer lattice exhibits superior scalability by extending the assembled atom configurations from 2D to 3D. The 3D scaling properties as a function of laser power , i.e., the number of trapping sites per principal plane multiplied by the number of planes with sufficient trap depth, are governed by the following argument:
within the 2D focal plane, the number of traps is identical to the number of illuminated lenslets which is proportional the square of the trap beam radius at the position of the MLA. The Talbot effect gives rise to an additional linear increase in the number of suitable principal Talbot planes and thus in the total number of traps as a function of the trap beam radius. In total, this leads to a cubic scaling of the integral trap number in all principal planes of the 3D tweezer lattice.
On the other hand, the required laser power increases linearly with the number of illuminated lenslets and quadratically with the trap beam radius at the MLA. No extra laser power is required for trapping of atoms in the additional Talbot planes. Extending to the third dimension comes for free!
Furthermore, is proportional to the ratio of trap size and trap pitch. An increased spot size reduces the divergence of the propagating laser beams and accordingly reduces walk-off effects in the Talbot planes. A similar effect results from a reduction of the trap pitch, as this contracts the Talbot lattice.
As usual for optical traps, the required power scales quadratically with the inverse trap size: . Hence, we obtain the overall scaling .
Figure 3 depicts these Talbot-specific scaling properties alongside an experimental implementation of a single-atom Talbot tweezer lattice optimized for a large number of traps. In Fig. 3(a), the integral number of traps of all principal planes is given as a function of the trap laser power on the MLA. To calculate this number, the Talbot tweezer lattice is simulated by propagating an array of Gaussian beams [41]. Traps shallower than one-fifth of the normalized trap depth are neglected, which is in agreement with the experimental observations. For comparison, the green curve visualizes the linear scaling of the number of traps in one Talbot plane as a function of laser power.
Obviously the scaling of the integral number of traps surpasses the scaling of the number of traps in one plane: the traps in the additional Talbot planes come for free.
The image of Fig. 3(b) shows averaged fluorescence of the plane of our largest implemented Talbot tweezer lattice. In this realization, the trapping laser was set to a wavelength of and a radius (waist) of lens pitches. A total power of was illuminating the lens array. The ratio of trap size and trap pitch was .
These parameters result in 17 relevant principal planes originating from an array of 777 tweezers of sufficient depth in the plane .
The variation along the principal planes is shown in Fig. 3(c). For the central tweezer intensity, a comparison of the ideal model (dashed blue line) to the results obtained when accounting for uncertainties of the MLA parameters (blue dots) is given. As evident, the two models show only minor deviations. Furthermore, the self-imaging process results in a healing of perturbations for Talbot planes apart from .
A detailed analysis of the properties of the MLAs used in this work and of the resulting Talbot tweezer lattices, as well as the impact of light field imperfections and production tolerances of MLAs are given in the Supplementary Material [41].
The in-plane trap count is depicted in green (dots, right axis).
In total, we calculate a number of traps of sufficient depth for this Talbot tweezer lattice, as presented in Fig. 3(a).
Within the readily accessible limits of titanium-sapphire laser technology, the power illuminating the MLA can be scaled by at least a factor of 5 beyond the given power. This increases the integral number of traps in the 3D lattice by a factor of 11, pushing the number of attainable single atom qubit sites beyond based on the parameters of Fig. 3(b). No specific measures for reducing the spectral width beyond the typical parameters of commercial titanium-sapphire lasers are required due to the small variation of the lengths of the beam paths contributing to each Talbot spot [57].
In order to further explore the potential of Talbot tweezer lattices for quantum computation and simulation, we combine the scalability of our platform with the ability to parallelize quantum operations using interleaved Talbot lattices. This technique enables the dynamic modification of configurations in interleaved 2D subarrays and furthermore the realization of 3D layered geometries with layer separations not limited to the Talbot length. Thereby the class of accessible geometries is significantly expanded to elaborate arrangements that incorporate parallelized transport [18, 11, 21], enable multispecies trapping [29, 9, 15, 58], can be configured to implement atom subgroups and ancilla atoms [59, 25, 60, 58], and give access for applying inhomogeneous interaction potentials [61]. Versatile interleaved and layered Talbot tweezer lattices can be implemented by employing multiple MLAs [18, 62] as well as by the illumination of a single MLA with multiple laser beams. The latter approach, as presented here, results in axially superposed lattice planes if the interleaved tweezer lattices are of near-identical wavelength. Lateral displacement of the lattice sites is achieved through a modification of the incident angle on the MLA. While the displacement is a linear function of the MLA’s focal length for the plane , for all other Talbot planes one has to consider the effective focal length, which is enlarged by the absolute value of their axial separation from the focal plane before reimaging. Hence, working in a Talbot plane significantly reduces the required angular displacement for achieving a sufficient lateral displacement. This allows one to dynamically compose tweezer arrays of versatile geometries with flexible site separation from superposed movable subarrays that can be controlled independently.
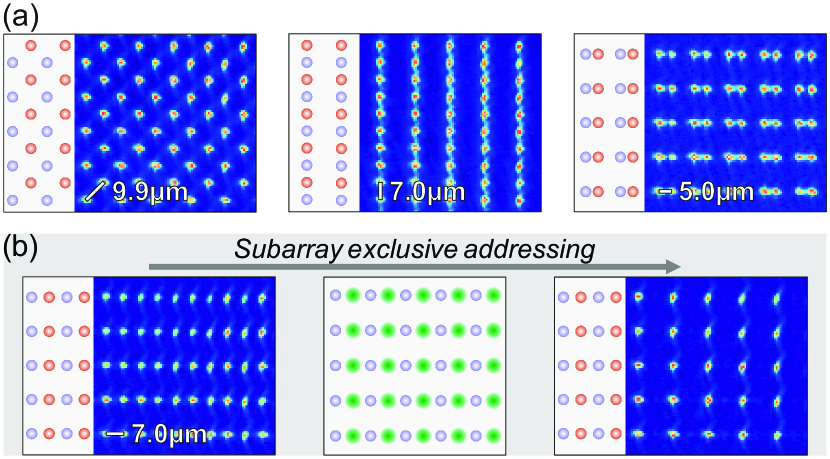
Figure 4 shows configurations of two tweezer subarrays in the Talbot plane which are created from two interleaved lattices. These are implemented by extending the setup of Fig. 1 by a second trapping laser beam illuminating the same MLA under a variable angle.
The two beams of equal size are set to a frequency difference of to avoid interference effects. An enclosed angle of introduces an offset of between the respective subarrays. Figure 4(a) (left) shows a uniform arrangement that reduces the trap separation by a factor of , with each site of one respective subarray (red) being equidistant to four sites of the other one (blue).
Furthermore, the trap positions can be tuned to create atom chains and to favor pairs of atoms as presented in Fig. 4(a) (middle and right). In the current implementation, traps stay independent for a minimum separation of , which is consistent with the trap waist.
Considering applications of interacting atoms (e.g., via Rydberg interactions) the latter two asymmetric configurations allow for the implementation of selectable interaction geometries with interactions taking place, e.g., only along the columns as in Fig. 4(a) (middle) or only between multiple realizations of atom pairs as in Fig. 4(a) (right).
Laser-induced state manipulation and atom-atom coupling also profit from our approach: the sites of each sublattice remain independently laser-addressable in a parallelized fashion through the MLA, which focuses the addressing light onto the stored atoms and thereby amplifies state manipulation and atom-light coupling. If the addressing beam is set to spatial overlap with the trapping light before illuminating the MLA, it is auto-aligned with the traps while the spacing of interleaved tweezer arrays in a selected Talbot plane can be arbitrarily set within the limits given by trap pitch and trap waist.
In the experiments of Fig. 4(b) we demonstrate parallelized laser addressing in sublattices with the transfer of the spin state of single atoms stored in tweezer subarrays with a spacing of . First, all atoms in the full set of traps are initialized to the state of the 85Rb ground-state hyperfine manifold and state-selectively detected afterwards by removing the population of the state prior to detection (left). The results displayed on the right account for a modified experimental sequence where laser addressing transfers the atoms to the state in a sublattice-exclusive fashion after initial state preparation, resulting in vanishing fluorescence at the addressed sites. This presents atom chains exhibiting antiferromagnetic ordering along the horizontal dimension in Fig. 4(b).
The addressing light at is brought to spatial overlap with the respective sublattice by superposing it with the respective trapping laser beam using a single mode optical fiber. For the center trap, the measured occupation probability after initial state preparation is . This value is reduced to when including the subarray-exclusive state transfer before the state-selective detection. For the unaddressed subarray, we observe a reduction on the order of . We contribute this crosstalk to chromatic aberrations causing imperfect overlap of the addressing light and addressed sites as well as residual scattering in the unaddressed sublattice.
In summary, we have created Talbot tweezer lattices unfolding multisite 3D atom configurations with customizable structure sizes in the micrometer regime. With the presented work, microlens-generated tweezer arrays enter a regime that has formerly been accessible only by phase-sensitive standing wave configurations [63, 64], yet they retain the simplicity and robustness of the MLA-based optical setup as well as their inherent features of coherent quantum state transport [18] and single-site addressability for qubit and spin-state manipulation [65].
The straightforward assembly of defect-free atom arrays facilitates bottom-up engineering of quantum systems in 2D and 3D geometries. In addition, atom separations can be dynamically adapted in 3D using layered interleaved configurations, while sublattice-exclusive addressability extends techniques for the initialization and readout of quantum states and allows for the parallelization of operations.
The implemented Talbot tweezer lattices provide several thousand of single-addressable atomic qubits with separations well within the limits for coherent Rydberg-mediated interactions [56] with direct implications for neutral atom quantum information science.
Extending the reported results within the limits of available technology, Talbot tweezer lattices in the regime of quantum systems are accessible already to date.
Acknowledgements.
We acknowledge financial support by the Deutsche Forschungsgemeinschaft (DFG) [Grants No. BI 647/6-1 and No. BI 647/6-2, Priority Program SPP 1929 (GiRyd)] and by the Federal Ministry of Education and Research (BMBF) [Grant No. 13N15981]. We thank L. Pause, T. Preuschoff, M.R. Sturm, and R. Walser for insightful discussions.References
- Quéméner and Julienne [2012] G. Quéméner and P. S. Julienne, Ultracold molecules under control!, Chemical Reviews 112, 4949 (2012).
- Cronin et al. [2009] A. D. Cronin, J. Schmiedmayer, and D. E. Pritchard, Optics and interferometry with atoms and molecules, Rev. Mod. Phys. 81, 1051 (2009).
- Ludlow et al. [2015] A. D. Ludlow, M. M. Boyd, J. Ye, E. Peik, and P. O. Schmidt, Optical atomic clocks, Rev. Mod. Phys. 87, 637 (2015).
- Degen et al. [2017] C. L. Degen, F. Reinhard, and P. Cappellaro, Quantum sensing, Rev. Mod. Phys. 89, 035002 (2017).
- Georgescu et al. [2014] I. M. Georgescu, S. Ashhab, and F. Nori, Quantum simulation, Rev. Mod. Phys. 86, 153 (2014).
- Alexeev et al. [2021] Y. Alexeev, D. Bacon, K. R. Brown, R. Calderbank, L. D. Carr, F. T. Chong, B. DeMarco, D. Englund, E. Farhi, B. Fefferman, A. V. Gorshkov, A. Houck, J. Kim, S. Kimmel, M. Lange, S. Lloyd, M. D. Lukin, D. Maslov, P. Maunz, C. Monroe, J. Preskill, M. Roetteler, M. J. Savage, and J. Thompson, Quantum computer systems for scientific discovery, PRX Quantum 2, 017001 (2021).
- Altman et al. [2021] E. Altman, K. R. Brown, G. Carleo, L. D. Carr, E. Demler, C. Chin, B. DeMarco, S. E. Economou, M. A. Eriksson, K.-M. C. Fu, M. Greiner, K. R. Hazzard, R. G. Hulet, A. J. Kollár, B. L. Lev, M. D. Lukin, R. Ma, X. Mi, S. Misra, C. Monroe, K. Murch, Z. Nazario, K.-K. Ni, A. C. Potter, P. Roushan, M. Saffman, M. Schleier-Smith, I. Siddiqi, R. Simmonds, M. Singh, I. Spielman, K. Temme, D. S. Weiss, J. Vučković, V. Vuletić, J. Ye, and M. Zwierlein, Quantum simulators: Architectures and opportunities, PRX Quantum 2, 017003 (2021).
- Bharti et al. [2022] K. Bharti, A. Cervera-Lierta, T. H. Kyaw, T. Haug, S. Alperin-Lea, A. Anand, M. Degroote, H. Heimonen, J. S. Kottmann, T. Menke, W.-K. Mok, S. Sim, L.-C. Kwek, and A. Aspuru-Guzik, Noisy intermediate-scale quantum algorithms, Rev. Mod. Phys. 94, 015004 (2022).
- Kaufman and Ni [2021] A. M. Kaufman and K.-K. Ni, Quantum science with optical tweezer arrays of ultracold atoms and molecules, Nature Phys 17, 1324 (2021).
- Ott [2016] H. Ott, Single atom detection in ultracold quantum gases: a review of current progress, Reports on Progress in Physics 79, 054401 (2016).
- Brown et al. [2019] M. O. Brown, T. Thiele, C. Kiehl, T.-W. Hsu, and C. A. Regal, Gray-molasses optical-tweezer loading: Controlling collisions for scaling atom-array assembly, Phys. Rev. X 9, 011057 (2019).
- Jenkins et al. [2022] A. Jenkins, J. W. Lis, A. Senoo, W. F. McGrew, and A. M. Kaufman, Ytterbium nuclear-spin qubits in an optical tweezer array, Phys. Rev. X 12, 021027 (2022).
- Schlosser et al. [2019] M. Schlosser, J. Kruse, and G. Birkl, Synchronization of atomic quantum systems in multi-site optical trapping potentials (2019), arXiv:1902.00370 .
- Barredo et al. [2020] D. Barredo, V. Lienhard, P. Scholl, S. de Léséleuc, T. Boulier, A. Browaeys, and T. Lahaye, Three-dimensional trapping of individual Rydberg atoms in ponderomotive bottle beam traps, Phys. Rev. Lett. 124, 023201 (2020).
- Zhang et al. [2022] J. T. Zhang, L. R. B. Picard, W. B. Cairncross, K. Wang, Y. Yu, F. Fang, and K.-K. Ni, An optical tweezer array of ground-state polar molecules, Quantum Science and Technology 7, 035006 (2022).
- Graham et al. [2022] T. Graham, Y. Song, J. Scott, C. Poole, L. Phuttitarn, K. Jooya, P. Eichler, X. Jiang, A. Marra, B. Grinkemeyer, M. Kwon, M. Ebert, J. Cherek, M. Lichtman, M. Gillette, J. Gilbert, D. Bowman, T. Ballance, C. Campbell, and M. Saffman, Multi-qubit entanglement and algorithms on a neutral-atom quantum computer, Nature (London) 604, 457 (2022).
- Beugnon et al. [2007] J. Beugnon, C. Tuchendler, H. Marion, A. Gaëtan, Y. Miroshnychenko, Y. R. Sortais, A. M. Lance, M. P. Jones, G. Messin, A. Browaeys, et al., Two-dimensional transport and transfer of a single atomic qubit in optical tweezers, Nature Phys 3, 696 (2007).
- Lengwenus et al. [2010] A. Lengwenus, J. Kruse, M. Schlosser, S. Tichelmann, and G. Birkl, Coherent transport of atomic quantum states in a scalable shift register, Phys. Rev. Lett. 105, 170502 (2010).
- Kaufman et al. [2015] A. Kaufman, B. Lester, M. Foss-Feig, M. Wall, A. Rey, and C. Regal, Entangling two transportable neutral atoms via local spin exchange, Nature (London) 527, 208 (2015).
- Dordević et al. [2021] T. Dordević, P. Samutpraphoot, P. L. Ocola, H. Bernien, B. Grinkemeyer, I. Dimitrova, V. Vuletić, and M. D. Lukin, Entanglement transport and a nanophotonic interface for atoms in optical tweezers, Science 373, 1511 (2021).
- Bluvstein et al. [2022] D. Bluvstein, H. Levine, G. Semeghini, T. T. Wang, S. Ebadi, M. Kalinowski, A. Keesling, N. Maskara, H. Pichler, M. Greiner, V. Vuletić, and M. D. Lukin, A quantum processor based on coherent transport of entangled atom arrays, Nature (London) 604, 451 (2022).
- Adams et al. [2019] C. S. Adams, J. D. Pritchard, and J. P. Shaffer, Rydberg atom quantum technologies, Journal of Physics B: Atomic, Molecular and Optical Physics 53, 012002 (2019).
- Browaeys and Lahaye [2020] A. Browaeys and T. Lahaye, Many-body physics with individually controlled Rydberg atoms, Nature Phys 16, 132 (2020).
- Henriet et al. [2020] L. Henriet, L. Beguin, A. Signoles, T. Lahaye, A. Browaeys, G.-O. Reymond, and C. Jurczak, Quantum computing with neutral atoms, Quantum 4, 327 (2020).
- Morgado and Whitlock [2021] M. Morgado and S. Whitlock, Quantum simulation and computing with Rydberg-interacting qubits, AVS Quantum Science 3, 023501 (2021).
- Murmann et al. [2015] S. Murmann, A. Bergschneider, V. M. Klinkhamer, G. Zürn, T. Lompe, and S. Jochim, Two fermions in a double well: Exploring a fundamental building block of the Hubbard model, Phys. Rev. Lett. 114, 080402 (2015).
- Sturm et al. [2017] M. R. Sturm, M. Schlosser, R. Walser, and G. Birkl, Quantum simulators by design: Many-body physics in reconfigurable arrays of tunnel-coupled traps, Phys. Rev. A 95, 063625 (2017).
- Spar et al. [2022] B. M. Spar, E. Guardado-Sanchez, S. Chi, Z. Z. Yan, and W. S. Bakr, Realization of a Fermi-Hubbard optical tweezer array, Phys. Rev. Lett. 128, 223202 (2022).
- Saffman [2016] M. Saffman, Quantum computing with atomic qubits and Rydberg interactions: progress and challenges, Journal of Physics B: Atomic, Molecular and Optical Physics 49, 202001 (2016).
- Browaeys et al. [2016] A. Browaeys, D. Barredo, and T. Lahaye, Experimental investigations of dipole-dipole interactions between a few Rydberg atoms, Journal of Physics B: Atomic, Molecular and Optical Physics 49, 152001 (2016).
- Ebadi et al. [2021] S. Ebadi, T. T. Wang, H. Levine, A. Keesling, G. Semeghini, A. Omran, D. Bluvstein, R. Samajdar, H. Pichler, W. W. Ho, et al., Quantum phases of matter on a 256-atom programmable quantum simulator, Nature (London) 595, 227 (2021).
- Scholl et al. [2021] P. Scholl, M. Schuler, H. J. Williams, A. A. Eberharter, D. Barredo, K.-N. Schymik, V. Lienhard, L.-P. Henry, T. C. Lang, T. Lahaye, et al., Quantum simulation of 2D antiferromagnets with hundreds of Rydberg atoms, Nature (London) 595, 233 (2021).
- Ma et al. [2022] S. Ma, A. P. Burgers, G. Liu, J. Wilson, B. Zhang, and J. D. Thompson, Universal gate operations on nuclear spin qubits in an optical tweezer array of atoms, Phys. Rev. X 12, 021028 (2022).
- Chew et al. [2022] Y. Chew, T. Tomita, T. P. Mahesh, S. Sugawa, S. de Léséleuc, and K. Ohmori, Ultrafast energy exchange between two single Rydberg atoms on a nanosecond timescale, Nature Photonics 16, 724 (2022).
- Wen et al. [2013] J. Wen, Y. Zhang, and M. Xiao, The Talbot effect: recent advances in classical optics, nonlinear optics, and quantum optics, Adv. Opt. Photon. 5, 83 (2013).
- Besold and Lindlein [1997a] B. Besold and N. Lindlein, Fractional Talbot effect for periodic microlens arrays, Optical Engineering 36, 1099 (1997a).
- Mennerat-Robilliard et al. [1998] C. Mennerat-Robilliard, D. Boiron, J. M. Fournier, A. Aradian, P. Horak, and G. Grynberg, Cooling cesium atoms in a Talbot lattice, EPL (Europhysics Letters) 44, 442 (1998).
- Ovchinnikov [2006] Y. B. Ovchinnikov, Coherent manipulation of atoms by copropagating laser beams, Phys. Rev. A 73, 033404 (2006).
- Ohl de Mello et al. [2019] D. Ohl de Mello, D. Schäffner, J. Werkmann, T. Preuschoff, L. Kohfahl, M. Schlosser, and G. Birkl, Defect-free assembly of 2D clusters of more than 100 single-atom quantum systems, Phys. Rev. Lett. 122, 203601 (2019).
- Voelkel [2012] R. Voelkel, Wafer-scale micro-optics fabrication, Advanced Optical Technologies 1, 135 (2012).
- [41] See Supplemental Material (second part of this document) for properties of MLA light fields and the effects of imperfections on Talbot tweezer lattices, which includes additional Refs. [42, 43, 44, 45, 46, 47, 48, 49, 50, 51, 52, 53].
- Zappe [2012] H. Zappe, Micro-optics: a micro-tutorial, Advanced Optical Technologies 1, 117 (2012).
- Gonzalez-Hernandez et al. [2023] D. Gonzalez-Hernandez, S. Varapnickas, A. Bertoncini, C. Liberale, and M. Malinauskas, Micro-optics 3D printed via multi-photon laser lithography, Advanced Optical Materials 11, 2201701 (2023).
- Schäffner et al. [2020] D. Schäffner, T. Preuschoff, S. Ristok, L. Brozio, M. Schlosser, H. Giessen, and G. Birkl, Arrays of individually controllable optical tweezers based on 3D-printed microlens arrays, Opt. Express 28, 8640 (2020).
- Kirner et al. [2019] R. Kirner, J. Béguelin, M. Eisner, W. Noell, T. Scharf, and R. Voelkel, Improvements on the uniformity of large-area microlens arrays in fused silica, Opt. Express 27, 6249 (2019).
- Schlosser et al. [2011] M. Schlosser, S. Tichelmann, J. Kruse, and G. Birkl, Scalable architecture for quantum information processing with atoms in optical micro-structures, Quantum Information Processing 10, 907 (2011).
- Pause et al. [2023] L. Pause, T. Preuschoff, D. Schäffner, M. Schlosser, and G. Birkl, Reservoir-based deterministic loading of single-atom tweezer arrays (2023), arXiv:2302.12730 .
- Gillen et al. [2006] G. D. Gillen, S. Guha, and K. Christandl, Optical dipole traps for cold atoms using diffracted laser light, Phys. Rev. A 73, 013409 (2006).
- Li and Wolf [1981] Y. Li and E. Wolf, Focal shifts in diffracted converging spherical waves, Optics Communications 39, 211 (1981).
- Ruffieux et al. [2006] P. Ruffieux, T. Scharf, H. P. Herzig, R. Völkel, and K. J. Weible, On the chromatic aberration of microlenses, Opt. Express 14, 4687 (2006).
- Winthrop and Worthington [1965] J. T. Winthrop and C. R. Worthington, Theory of Fresnel images. I. Plane periodic objects in monochromatic light, J. Opt. Soc. Am. 55, 373 (1965).
- Besold and Lindlein [1997b] B. Besold and N. Lindlein, Practical limitations of Talbot imaging with microlens arrays, Pure and Applied Optics: Journal of the European Optical Society Part A 6, 691 (1997b).
- Patorski [1989] K. Patorski, I The self-imaging phenomenon and its applications, in Progress in Optics, Vol. 27, edited by E. Wolf (Elsevier, 1989) pp. 1–108.
- Kim et al. [2015] H. Kim, W. Lee, H. Lee, and J. Ahn, Nonparaxial aberrations in the optical Talbot effect probed by quantum-dot fluorescence tomography, Phys. Rev. A 91, 033817 (2015).
- Barredo et al. [2018] D. Barredo, V. Lienhard, S. De Léséleuc, T. Lahaye, and A. Browaeys, Synthetic three-dimensional atomic structures assembled atom by atom, Nature (London) 561, 79 (2018).
- Schlosser et al. [2020] M. Schlosser, D. Ohl de Mello, D. Schäffner, T. Preuschoff, L. Kohfahl, and G. Birkl, Assembled arrays of Rydberg-interacting atoms, Journal of Physics B: Atomic, Molecular and Optical Physics 53, 144001 (2020).
- Huft et al. [2022] P. Huft, Y. Song, T. M. Graham, K. Jooya, S. Deshpande, C. Fang, M. Kats, and M. Saffman, Simple, passive design for large optical trap arrays for single atoms, Phys. Rev. A 105, 063111 (2022).
- Singh et al. [2022] K. Singh, C. E. Bradley, S. Anand, V. Ramesh, R. White, and H. Bernien, Mid-circuit correction of correlated phase errors using an array of spectator qubits (2022), arXiv:2208.11716 .
- Weimer et al. [2010] H. Weimer, M. Müller, I. Lesanovsky, P. Zoller, and H. P. Büchler, A Rydberg quantum simulator, Nature Phys 6, 382 (2010).
- Sheng et al. [2022] C. Sheng, J. Hou, X. He, K. Wang, R. Guo, J. Zhuang, B. Mamat, P. Xu, M. Liu, J. Wang, and M. Zhan, Defect-free arbitrary-geometry assembly of mixed-species atom arrays, Phys. Rev. Lett. 128, 083202 (2022).
- de Léséleuc et al. [2019] S. de Léséleuc, V. Lienhard, P. Scholl, D. Barredo, S. Weber, N. Lang, H. P. Büchler, T. Lahaye, and A. Browaeys, Observation of a symmetry-protected topological phase of interacting bosons with Rydberg atoms, Science 365, 775 (2019).
- Schlosser et al. [2012] M. Schlosser, J. Kruse, C. Gierl, S. Teichmann, S. Tichelmann, and G. Birkl, Fast transport, atom sample splitting and single-atom qubit supply in two-dimensional arrays of optical microtraps, New Journal of Physics 14, 123034 (2012).
- Gross and Bloch [2017] C. Gross and I. Bloch, Quantum simulations with ultracold atoms in optical lattices, Science 357, 995 (2017).
- Kumar et al. [2018] A. Kumar, T.-Y. Wu, F. Giraldo, and D. S. Weiss, Sorting ultracold atoms in a three-dimensional optical lattice in a realization of Maxwell’s demon, Nature (London) 561, 83 (2018).
- Kruse et al. [2010] J. Kruse, C. Gierl, M. Schlosser, and G. Birkl, Reconfigurable site-selective manipulation of atomic quantum systems in two-dimensional arrays of dipole traps, Phys. Rev. A 81, 060308(R) (2010).
Supplementary Information:
Scalable Multilayer Architecture of Assembled Single-Atom Qubit Arrays
in a Three-Dimensional Talbot Tweezer Lattice
This document provides supplementary information on the characteristics of microlens arrays, the simulation of the generated light fields, and the requirements on the incident trapping laser light for the implementation of a Talbot tweezer lattice. In the second part, special emphasis is given to the effects of imperfections of microlens arrays resulting from production tolerances and the mitigation of perturbations induced by the self-imaging process.
I Microlens Arrays (MLA)
The micro-fabrication of optical elements builds on a rich technological foundation that facilitates the production of complex refractive and diffractive structures for a variety of optical materials such as polymers and glasses [42, 40, 43]. While direct laser writing has proven proficient for free-form micro-optics, multi-element systems and rapid prototyping [43, 44], lithographic techniques adapted from semiconductor processing enable the wafer-level batch fabrication of micro-optical elements with nanoscale precision on planar substrates [42, 40, 45]. MLAs covering an extensive range of parameters are commercially available.
Focusing on regular-grid, two-dimensional arrays of converging lenses, as required for the implementation of an atom-optical Talbot tweezer lattice, hexagonal- and quadratic-grid MLAs have been used in atom-optic experiments [46, 44, 47]. Lenslets are either contiguous or of circular footprint. Chrome apertures and standard anti-reflection coatings can be applied. Typical numerical apertures are on the order of and diameter and pitch (i.e., grid spacing) are in the range of . A quadratic grid pattern of pitch results in million lenslets on an wafer.
I.1 Optical Properties of MLAs used for this work
| Parameters: Microlens arrays | ||||||||
| Parameter set | Lenslet xy-pitch |
Approx. lenslet
diameter () |
Radius of curvature
(ROC) |
Geometrical
focal length () |
Fresnel number (FN) |
Effective
focal length () |
Effective
numerical aperture |
Talbot length () |
| MLA1 | ||||||||
| MLA2 (Fig. S1) | ||||||||
Both MLAs used for this work have been fabricated utilizing photolithography and reactive ion etching on fused silica. This material withstands cw laser powers of tens of kilowatts per centimeter (linear power density) that therefore effectively imposes no limit on atom tweezer experiments. The MLAs are of quadratic grid with circular lenslets of spherical profile. Anti-reflection coating has been applied for the relevant wavelengths (residual reflectance ¡ ). Relevant parameters are listed in Tab. S1. The lenslet pitch, approximate diameter and radius of curvature of the spherical profile are given by the manufacturer. The remaining parameters have been calculated on this basis. The listed values are in agreement with simulations and experimental findings.
The geometrical focal length of a spherical lens relates to its radius of curvature by , the numerical aperture can be calculated from with the lenslet diameter according to and the Fresnel number is given by .
Special attention has to be taken for FN on the order of and below, where diffraction at the lens aperture significantly modifies the focused beam. In the limiting case of a circular aperture with
vanishing refractive power [48, 57], the light field behind the aperture shows an intensity maximum at a distance of . This effect reduces the effective focal length and induces a relative focal shift for finite values of ROC that can be approximated by giving [49, 50].
I.2 MLA light fields
The illumination of an MLA with a beam of coherent laser light whose lateral size is significantly larger than the lenslet pitch propagating along the z-direction produces a periodic spot pattern in the focal plane. The Talbot effect describes the appearance of regular self images of this spot array along the optical axis. For a quadratic grid array of spatial period (pitch) , the axial position of the Talbot planes is given by [51]:
| (S1) |
Here, the spatial period of the generating pattern corresponds to the lenslet xy-pitch, is the Talbot length and , , are natural numbers for which the conditions , apply. Integer Talbot planes () and the fractional Talbot planes with fully recreate the generating pattern, while the planar arrays of the latter are shifted by in the x- and y-direction. Between these principal Talbot planes (), additional fractional Talbot planes showing periodic patterns with an increased number of spots can be found. Individual Talbot planes are labeled according to their axial position normalized to with being the original spot array.
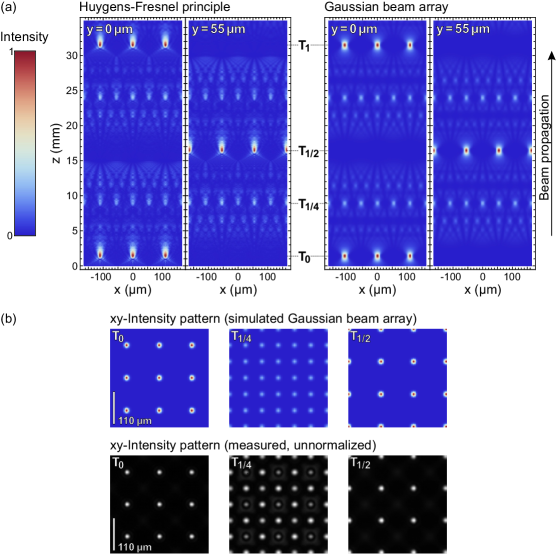
Figure S1 visualizes the generated light field for a -pitch microlens array (MLA2, see Tab. S1). As a reference, the intensity distribution behind MLA2 has been computed on basis of the Huygens–Fresnel principle by numerically propagating an incident plane wave. Two xy-sections are presented in Fig. S1(a) (left), starting at position of the MLA at and covering three lenslets in x-direction with the lens centers at and . The focal spots of these lenslets are visible in the section for that intersects the lenslet centers. Their axially nonsymmetric local intensity distribution reflects the expected interplay of refraction and diffraction [50]. The focal spot array is perfectly recreated at a distance of one Talbot length . The section at lies exactly in between two rows of lenslets. Hence, the focal array is absent but the shifted principal plane is intersected at a distance of . In the two xz-sections, additional fractional Talbot planes are visible. A closer look at non-principal Talbot planes (e.g., ) implies a modulation of spot intensities for non-principal Talbot planes [36, 54].
With the objective of reducing the computational demands, Figure S1(a) (right) depicts the two xz-sections for numerical data generated by propagating an array of Gaussian beams matched to the parameters of MLA2. As evident from the plots, the models are in perfect agreement regarding the position of Talbot planes and spot intensities in principal Talbot planes. Therefore, for all further calculations concerning principal Talbot planes the Gaussian beam model has been used, as presented in the main text (Figs. 1, 3) and in this document. Note that even though the plots of Fig. S1 are related to Fig. 1(b) of the main text, Fig. 1(b) shows vertically projected (i.e., integrated) data for the reimaged tweezer array, such that all Talbot planes become visible in one 2D plot.
Figure S1(b) displays xy-sections for , , . The top row shows calculated data, images in the bottom row are measured intensity distributions (unnormalized). As expected, the focal array is reproduced in the principal plane while being shifted by in x- and y-direction. For the fractional Talbot plane , the Gaussian beam model reproduces the correct positions and number of spots yet fails to capture the modulation of spot intensities, as anticipated in the discussion of Fig. S1(a), which is visible in the imaged intensity distribution. This modulation has also been observed for the atom traps of the similar Talbot plane (see Fig. 1(c) of the main text).
II Talbot Tweezer Lattice after reimaging
| Parameters: Reimaging / Talbot tweezer lattice | ||||||
|---|---|---|---|---|---|---|
|
Parameter set
(Figs. of main text) |
Microlens array |
Geometrical
magnification |
Reimaged xy-pitch | Talbot length |
Radial (xy) trap
size (measured) |
Longitudinal (z) trap size |
| Lattice 1 (Figs. 1, 3(a), 4) | MLA1 | 375(10)/800(8) | ||||
| Lattice 2 (Figs. 2, 3) | MLA2 | 375(10)/4000(40) | ||||
Experimentally, the Talbot tweezer lattice for atom trapping is realized by reimaging the MLA’s focal plane into an apparatus providing laser cooled atoms [62]. Hence, the final parameters are defined by the combination of MLA and relay optics. Typically, the MLA’s focal plane is demagnified during reimaging that results in a strong decrease of , now given by the reimaged xy-pitch, and of the Talbot length. In the regime where the Talbot length becomes significantly smaller than the image distance of the optical setup, Talbot planes also appear before the reimaged focal Plane . These planes complete the symmetric 3D structure of the resulting Talbot tweezer lattice and are labeled with negative indices. Table S2 specifies the parameters of the Talbot tweezer lattices implemented in this work. The radial and longitudinal trap size are given by the numerical aperture of the reimaging optics and are thus identical for both implementations.
Figure S2 gives an estimate of the number of beams (i.e., lenslets) contributing to the recreation of the tweezer arrays by the self-imaging effect. In the simple model of Fig. S2(a), the waist of the central tweezer of the reimaged focal plane (blue) is drawn in 2D along the optical axis for the parameters of lattice 2 (see Tab. S2). It is evident, that this envelope already encloses a multitude of tweezer sites (gray and black dots) in the closest principal planes. The xy-section for the tweezer array of in Fig. S2(b) visualizes a number of 69 tweezer sites enclosed by the central tweezer beam of . This number equals the number of beams contributing to each tweezer in the Talbot planes [52]. The scaling is depicted in Fig. S2(c) for principal Talbot planes to . Note that a modification of the tweezer waist would change the beam divergence but not the pitch or Talbot length and thus would directly impact the scaling.
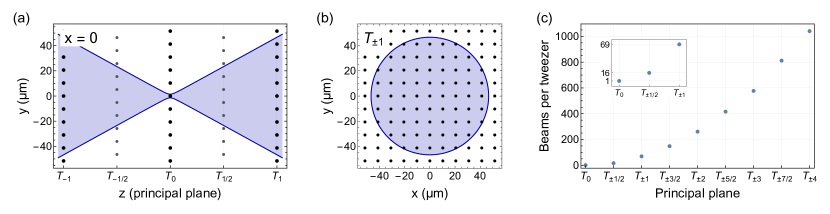
Beyond the simple schematic of Fig. S2, the finite size of the trapping laser beam on the MLA and therefore the finite number of lenslets and corresponding focal array tweezers that effectively contribute has to be considered. For the implementation of lattice 2 shown in Fig. 3 of the main text, the trapping laser beam waist is . This gives a waist of the intensity envelope of the reimaged focal tweezer array of and covers an area of 965 tweezers. Experimentally, tweezer depths (i.e., maximum intensities) shallower than one fifth of the center tweezer depth are considered to be insufficient to hold atoms, which reduces the effective number of single atom tweezers in to . This finite generating pattern causes the decline of tweezer depths in the Talbot tweezer arrays with increasing distance to . Propagating a Gaussian beam array with parameters according to the experiment yields 17 relevant principal planes containing tweezers of sufficient depth (see Fig. 3(c) of main text).
III Imperfections and Tolerances
| Tolerances: Microlens array (MLA2) | ||
| Parameter |
Value
(mean) |
Uncertainty
(uniform distribution) |
|
Brilliance
estimated E-field amplitude variation |
1 | |
|
xy-Pitch
specified value and xy-positioning error |
||
|
Radius of curvature
specified value and tolerance |
||
|
Geometric focal length
calculated value and uncertainty of ROC |
||
| Uncertainties: Reimaged focal plane / Talbot tweezer array | ||
|
Brilliance
estimated E-field amplitude variation |
1 | |
|
xy-Pitch
propagated pitch and xy-positioning error |
||
|
z-Position
propagated focal length error |
(origin) | |
|
Radial trap size
measured waist ( intensity) and uncertainty |
||
|
Longitudinal trap size
Rayleigh range calculated from waist |
||
A substantial analysis of the real-world performance of Talbot tweezer lattices must include detrimental imperfections of light fields and production tolerances of microlens arrays. As the experiments are conducted with continuous-wave, single-frequency laser light, which is guided by single-mode optical fibers, imperfections in spectral and spatial coherence properties can be neglected (see Ref. [57], Appendix C). In an approach to capture deviations from a perfect spatial mode (Gaussian mode) of the initial trapping laser beam impinging on the MLA and a variation of the transmittance between individual lenslets, a unified uncertainty of the electromagnetic field amplitude per focal array tweezer of has been included. This value is labeled as brilliance in Tab. S3, which also lists tolerances of the MLA and resulting uncertainties for the lattice generating array . These have been incorporated in the model of a propagated Gaussian beam array. Global modifications, such as a demagnification error arising from the tolerances of the relay optics and the focus shift caused by the finite aperture of the lenslets have been neglected, as they present a common-mode shift of the mean parameter value but do not add stochastic uncertainties.
In order to quantify the consequences for the Talbot tweezer lattice, 400 realizations of lattice 2 generated by an array of 6969 beams with parameters drawn randomly from a uniform distribution within the uncertainty bounds have been evaluated. Figure S3 exemplarily visualizes tweezer intensities. In Fig. S3(a), one realization of the intensities for the input beam array is shown. Figure S3(b) depicts the intensities and uncertainty for the central row where the intensity envelope set by the trapping laser beam waist on the MLA corresponds to pitches. The impact of imperfections in the generating array is illustrated in Fig. S3(c). The blue curve gives the central tweezer intensity of all relevant principal planes for an ideal model with zero uncertainty. Yellow dots represent the mean intensity obtained from the tolerance analysis with error bars according to the sample standard deviation:
| (S2) |
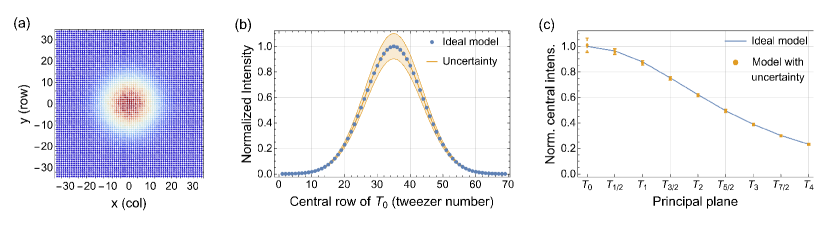
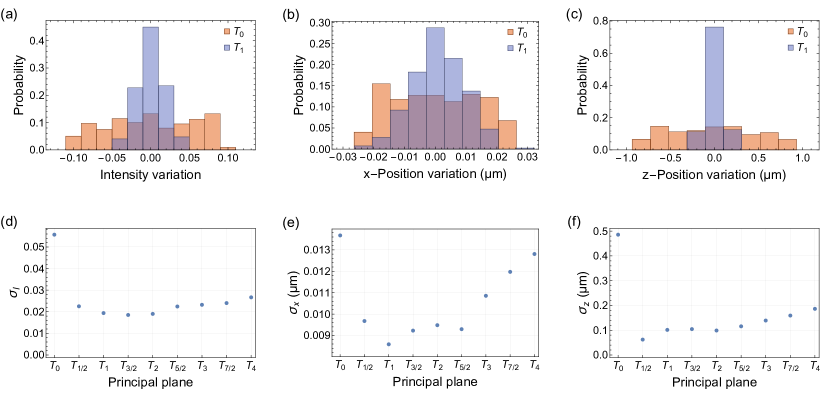
As evident from the graph, for all planes the mean tweezer intensity shows negligible deviation (¡ ) compared to the ideal model. Furthermore, the standard deviation is strongly reduced for the Talbot planes apart from the generating array (). The multi-beam interference creating the self images results in a healing of imperfections, a quality that has been reported for the Talbot effect in other systems as well [53]. Figure S4 details the statistical tolerances for the central tweezer intensities (a, d) as well as their lateral (b, e) and axial positions (c, f). In the top row, histograms of the variation of these quantities generated from the sample data of and are shown. The bottom row depicts the sample standard deviation for all relevant planes. Again, the striking mitigation of perturbations in the self images is manifested in the data. While the spread of tweezer intensities of is more than acceptable for a broad range of applications already and in addition results from a rather ample uncertainty estimate, it can be further improved through preconditioning of the incident trapping laser light using spatial light modulators [44]. Regarding the lateral and axial tweezer positions, statistical tolerances are found to be negligible with a value on the order of single percents of the trap size. Nevertheless, process improvements in MLA manufacturing facilitate further reduction of inhomogeneities [45]. As the analysis in Fig. S4 demonstrates, a significant reduction of uncertainties for 2D tweezer arrays can be achieved by the self-stabilizing averaging of trap parameters when operating in principal planes apart from . On basis of the presented analysis of light field imperfections and production tolerances of MLAs, Talbot tweezer lattices establish an accessible multilayer platform for quantum science with unprecedented scalability and high optical quality.