GRO J175027: a neutron star far behind the Galactic Center switching into the propeller regime
Abstract
We report on analysis of properties of the X-ray binary pulsar GRO J175027 based on X-ray (Chandra, Swift, and Fermi/GBM), and near-infrared (VVV and UKIDSS surveys) observations. An accurate position of the source is determined for the first time and used to identify its infrared counterpart. Based on the VVV data we investigate the spectral energy distribution (SED) of the companion, taking into account a non-standard absorption law in the source direction. A comparison of this SED with those of known Be/X-ray binaries and early type stars has allowed us to estimate a lower distance limit to the source at kpc. An analysis of the observed spin-up torque during a giant outburst in 2015 provides an independent distance estimate of kpc, and also allows to estimate the magnetic field on the surface of the neutron star at G. The latter value is in agreement with the possible transition to the propeller regime, a strong hint for which was revealed by Swift/XRT and Chandra. We conclude, that GRO J175027 is located far behind the Galactic Center, which makes it one of the furthest Galactic X-ray binaries known.
keywords:
stars: individual: GRO J175027– X-rays: binaries1 Introduction
High mass X-ray binaries (HMXBs), are binary systems hosting a compact object (i.e. a neutron star, or a black hole), and massive non-degenerate companion. A population of HMXBs is not uniform and can be roughly divided in several types depending on the observable properties, evolutionary status and optical companion (see Walter et al., 2015, for the recent review of HMXBs).
A large fraction of HMXBs constitutes so-called Be/X-ray binaries (BeXRBs). In these systems the optical companion is a fast rotating Be star with a typical luminosity class III-V, demonstrating spectral emission lines, which are formed in a rotating decretion disk around the star (Reig, 2011). Most of BeXRBs have a transient nature in X-rays, and demonstrate a strong variability of their X-ray luminosity of several orders of magnitude from erg s-1 in quiescence, and up to erg s-1 during the outbursts (see, e.g., Tsygankov et al., 2017b). This makes such systems unique natural laboratories for accretion studies (see, e.g., Negueruela & Okazaki, 2001; Okazaki & Negueruela, 2001; Poutanen et al., 2013; Okazaki et al., 2013; Tsygankov et al., 2017c, and references therein). A high X-ray luminosity of these objects reaching during outbursts makes them also an important probe to study the far side of the Galaxy (see, e.g., Lutovinov et al., 2016).
The transient X-ray pulsar GRO J175027 was discovered with the BATSE instrument onboard the Compton-GRO observatory during a strong outburst in July 1995 (Koh et al., 1995). The source was detected and recognized as a new X-ray pulsar due to a registration of coherent pulsations with the period of about 4.45 s, which was interpreted as a rotation period of the neutron star (Scott et al., 1997). The outburst lasted about two months, which allowed to determine not only orbital parameters of the system, but also to investigate the spin-up evolution during the outburst.
A second outburst from GRO J175027 was observed in the beginning of 2008 with the Swift and INTEGRAL observatories during several months (Shaw et al., 2009). These observations allowed to improve the orbital parameters of the system, to reconstruct for the first time a broadband spectrum of the source in the 5-70 keV energy band and to obtain estimates for the distance to GRO J175027 in the range of 12-22 kpc (based on the spin-up evolution during the outburst). The corresponding peak luminosity was estimated at the level of erg s-1. The high luminosity and observed transient behaviour led to the conclusion that GRO J175027 should be a Be/X-ray binary system demonstrating giant outbursts (Scott et al., 1997; Shaw et al., 2009).
The sky region around GRO J175027 was observed in October 1995 with the ASCA observatory, which detected the pulsations with the same period sec and improved the source localisation up to 2′ (Dotani et al., 1995). However, the optical counterpart still could not be unambiguously identified because the source is located in a crowded Galactic Center field.
In this paper we report results of a comprehensive analysis of Chandra, Neil Gehrels Swift and Fermi observations of GRO J175027 performed during the latest outburst, started in December 2014. We obtained an accurate localization of the source in X-rays and determined its infrared counterpart for the first time, based on the VVV survey data. Using available photometry of the counterpart, we estimated the spectral class of the optical star and distance to the system. We also traced evolution of the source X-ray flux and spectral parameters throughout the outburst, and discovered a strong hint for the transition of the source into a propeller regime.
2 Observations and data analysis
GRO J175027 was monitored in soft X-rays with the Swift/XRT telescope during both outbursts in 2008 and 2014-2015 (Target id. 31115). An important difference between these monitoring programs is that during the 2008 outburst the source was observed about dozen times in a high state, whereas observations in 2015 were mostly done during the outburst decay from Apr 12 to May 20, 2015.
Swift/XRT observations were performed in the Windowed Timing (WT) and Photon Counting (PC) modes depending on the source brightness. Final products (spectrum in each observation) were prepared using online tools provided by the UK Swift Science Data Centre (Evans et al., 2009)111http://www.swift.ac.uk/user_objects/. Due to calibration uncertainties at low energies222http://www.swift.ac.uk/analysis/xrt/digest_cal.php, we restricted the spectral analysis to the 0.7–10 keV energy band.
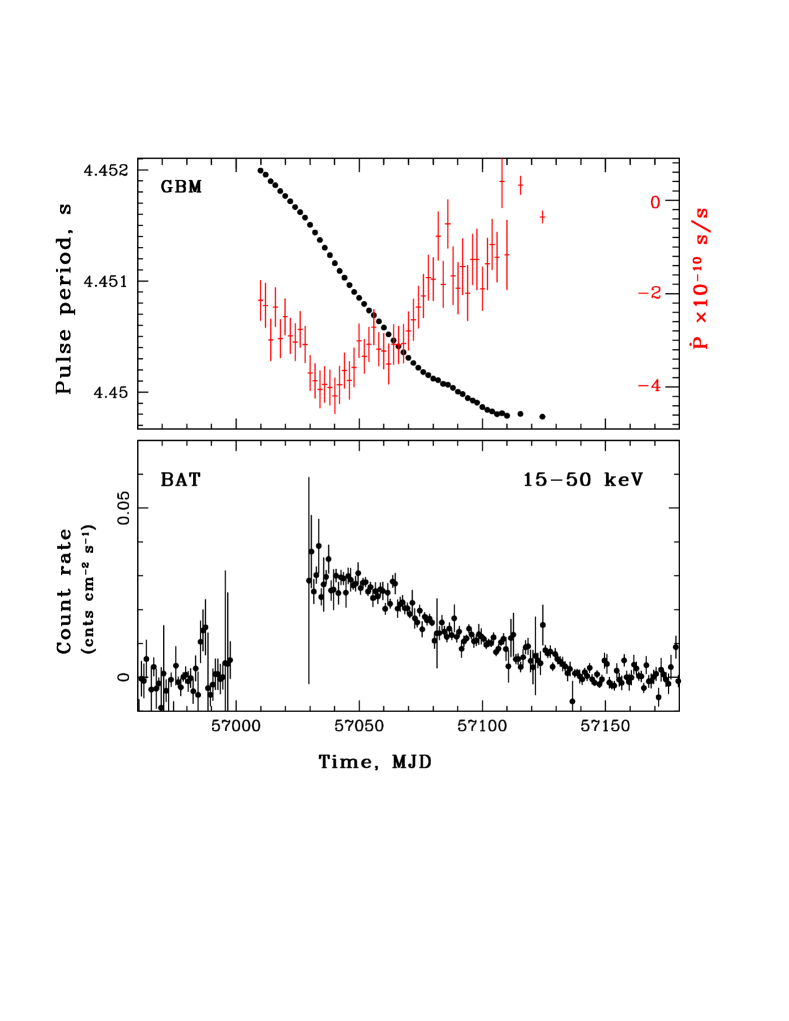
The source was also monitored with the Swift/BAT (Krimm et al. 2013, 15-50 keV energy band) and Fermi/GBM (Meegan et al. 2009, 12-25 keV energy band) instruments. We used these data to study the source behaviour at harder energies and to trace an evolution of the pulse period and its rate of change during the outburst (Fig.1). Data of both instruments were taken from the official sites333https://swift.gsfc.nasa.gov/results/transients/,444https://gammaray.nsstc.nasa.gov/gbm/science/pulsars/.
At the very end of the outburst (on May 20, 2015) Chandra observed GRO J175027 with the ACIS instrument (ObsID. 16723) with a total exposure of about 30 ks. The data were reduced with the standard software package ciao 4.9555http://cxc.harvard.edu/ciao/ with CALDB v4.7.5.
Taking into account the low flux of the source and low counting statistics during Swift/XRT and Chandra observations the obtained spectra were grouped to have at least 1 count per bin and were fitted in the xspec package using the -statistic (Wachter et al., 1979).
It is important to note that for any meaningful discussions or conclusions on the physical properties of the source a bolometric correction has to be applied to the observed fluxes in soft or hard energy bands. After applying the bolometric correction, we recalculated the fluxes in XRT and BAT energy bands to the energy range keV, which can be treated as a bolometric one for X-ray pulsars with a good accuracy. Using the bolometric flux of erg s-1 cm-2, spectral parameters and corresponding BAT count rate from Shaw et al. (2009), we estimate a conversion factor between the observed BAT count rate and the bolometric flux as erg s-1 cm-2/(cnts s-1). A conversion factor between the flux, measured by XRT, and the bolometric flux was estimated as from spectral shape and parameters, determined by Shaw et al. (2009). In the following analysis we apply these correction to all observational data and refer to the bolometrically corrected fluxes and luminosities, unless stated otherwise.
Finally, to search for the counterpart and to study its properties in the infrared band we used the latest public releases of VVV/ESO666http://www.eso.org/sci/observing/phase3/data_releases.html,777http://horus.roe.ac.uk/vsa/ and GPS/UKIDSS888http://surveys.roe.ac.uk/wsa/ sky survey data.
3 Magnetic field and distance estimates from the spin-up measurements
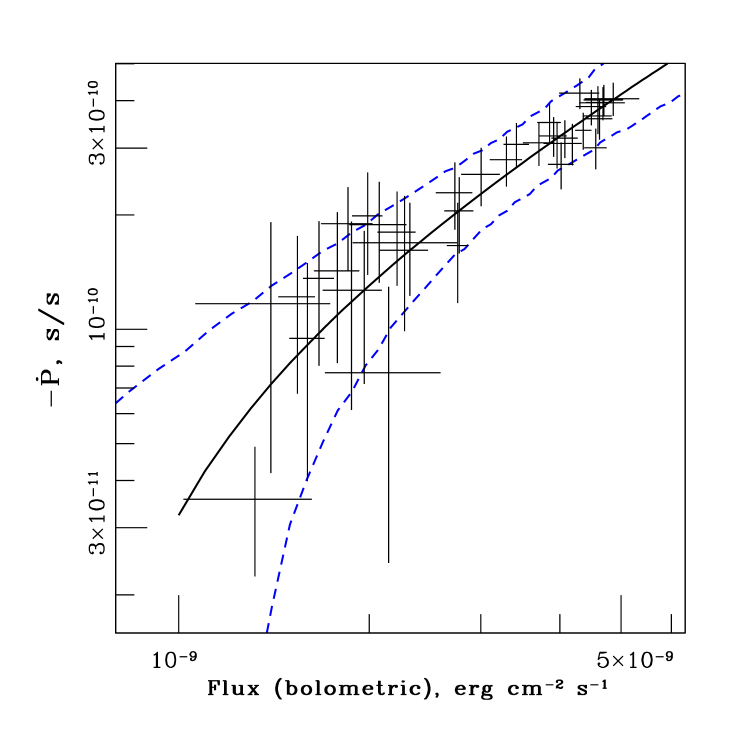
As it was mentioned above during the outburst we observe not only an evolution of the GRO J175027 luminosity but also an evolution of the neutron star spin-up rate. There are several models connecting a bolometric luminosity of the source with its spinning-up rate through the parameters of the neutron star – radius, mass, magnetic field, etc (see, e.g. Ghosh & Lamb, 1979; Wang, 1995; Kluźniak & Rappaport, 2007; Parfrey et al., 2016). These models describe an interaction of the accretion disc with the magnetosphere slightly differently, but for the bright outbursts they are agreed well (see, e.g., Tsygankov et al., 2016b; Filippova et al., 2017). Therefore in the following we assume that the dependence for GRO J175027 is given by the equation (15) from the paper of Ghosh & Lamb (1979). We rewrite them in the form, which is more convenient to describe observational data, using the bolometric flux () instead the bolometric luminosity:
| (1) |
where is a dimensionless accretion torque, describing the “accretion disc – magnetosphere” interaction, is the spin-up rate in units of s s-1, is the pulse period in seconds, is the magnetic dipole moment in units of G cm3, is the distance to the source in kpc and is the measured bolometric flux in units of erg s-1 cm-2. We are assuming also that the mass, radius and momentum of the inertia of the neutron star are , cm and g cm2, respectively.
The dependence for GRO J175027, based on the Swift/BAT and Fermi/GBM data, is plotted in Fig. 2. Experimental data were fitted with the Eq.(1) with best fit values of two parameters: kpc and , what corresponds to the strength of the magnetic field on the neutron star surface G (we used here a relation of ). This best fit model is shown by a solid line in Fig. 2. It is important to note, that this estimate depends strongly on the assumed torque model, so the uncertainties on these parameters can be quite large (see Fig.2 and, e.g., Tsygankov et al., 2016b) and lead to the possible distance and magnetic field ranges of kpc and G.
4 Propeller effect
In addition to spin properties, the magnetic field of the accreting neutron star can be estimated using large-scale variations of the observed flux. In particular, detection the so-called “propeller effect” (Illarionov & Sunyaev, 1975) can be used to estimate the field. The effect is observed in highly magnetized compact objects due to an existence of the critical mass accretion rate at which the magnetospheric radius (which depends on the accretion rate), becomes comparable with the corotation one (the radius where the linear velocity of the compact object’s rotation equals to the Keplerian one). At this point the velocity of the magnetic field lines exceeds the velocity of the matter in the accretion disc and the accretion is halted for low accretion rates due to an emerging centrifugal barrier. From the observational point of view this effect is well known for different types of binary systems with neutron stars ranging from accreting millisecond and X-ray pulsars to accreting magnetars (Stella et al., 1986; Cui, 1997; Campana et al., 2001, 2008; Tsygankov et al., 2016a; Tsygankov et al., 2016b; Lutovinov et al., 2017; Campana et al., 2018). Recently, Tsygankov et al. (2017c) showed that only fast rotating neutron stars (with the spin period of s) are able to enter the propeller regime.
Short spin period of GRO J175027 implies, that it must enter the propeller regime, so its magnetic field can be estimated using a “standard” equation for the limiting luminosity (see, e.g., Campana et al., 2001):
| (2) |
where and are the neutron star radius in units of cm and mass in units of 1.4M⊙, respectively, is the neutron star magnetic field strength in units of G. Factor relates the size of the magnetosphere for a given accretion configuration to the Alfvén radius ( is usually assumed in the case of the disc accretion; Ghosh & Lamb, 1979).
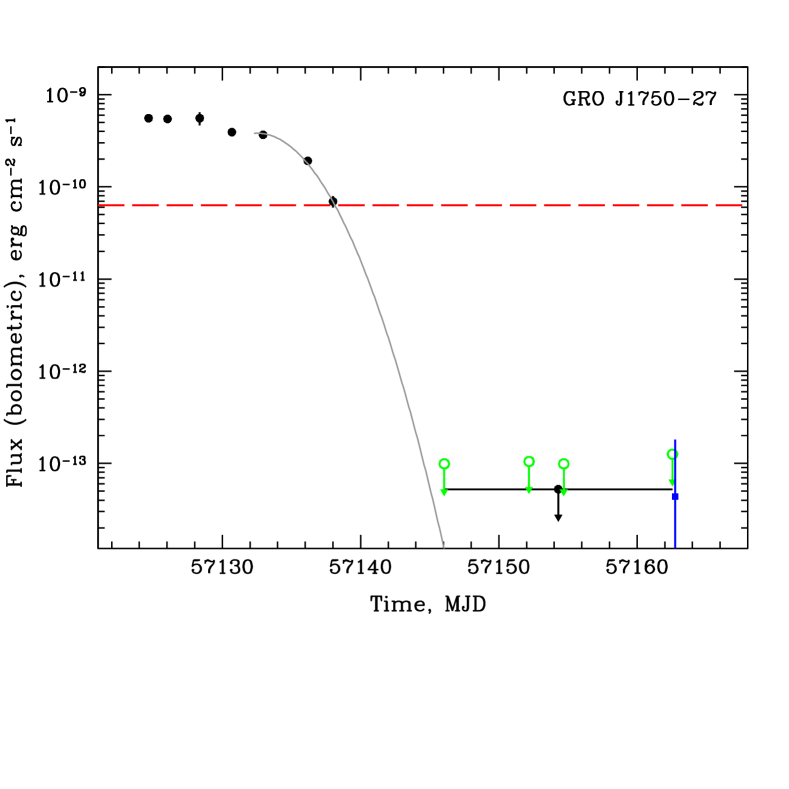
A light curve of GRO J175027 measured with the Swift/XRT and Chandra telescopes is presented in Fig. 3. Black circles represent a bolometric unabsorbed flux measured with the Swift/XRT telescope under assumption of the bolometric correction factor of (see Section 2). From the figure it is clearly seen a dramatic drop (by a factor around 1000) of the source flux after MJD 57138.
Note that there is a time gap (about eight days) between the last observation where the source was significantly detected and the next one where the source was not detected already. A typical exposure of an individual Swift/XRT observation was about only 1 ks. Such a low exposure and large expected distance to the system didn’t allow us to register the source flux. However, we were able to put upper limits on the source flux in each observation after the transition of the source to the propeller regime (shown by green circles in Fig.3). Also we averaged four Swift/XRT observations covering time interval MJD with the total exposure of about 3.5 ks. The source was not detected on the average sky map with the 2 upper limit comparable with the further Chandra detection (see Fig. 3 and recent paper of Rouco Escorial et al. 2018 for studying of the low level state). This drastic change of the source luminosity is very similar to what observed recently with Swift/XRT in several other X-ray pulsars (Tsygankov et al., 2016b; Lutovinov et al., 2017) and most likely related to its transition to the propeller regime. The solid grey line illustrates the best fit of the flux decay in the tail of the outburst with a Gaussian function. Although this model is not physically motivated, it fits the final stages of outbursts before the transition to the propeller regime quite well (see e.g., Campana et al., 1998; Campana et al., 2018; Lutovinov et al., 2017).
Unfortunately, gaps in the light curve do not allow us to estimate directly the transition luminosity. However, an abrupt fading of the source flux by approximately three orders of magnitude on the time scale of several days after MJD 57138 is a strong indication that the transition did indeed take place. A horizontal dashed line in Fig. 3 shows an upper limit erg s-1 cm-2 on the threshold flux of the possible transition to the propeller regime. Substituting , km and to the equation (2) this threshold flux corresponds to the magnetic field strength G for distances to the system of 15-20 kpc. Because is just an upper limit, the magnetic field estimates based on this flux are also should be considered as upper limits. Note, that these values are in good agreement with field estimated based on the observed spin-up rate (see Section 3).
5 X-ray position and spectral properties of GRO J175027
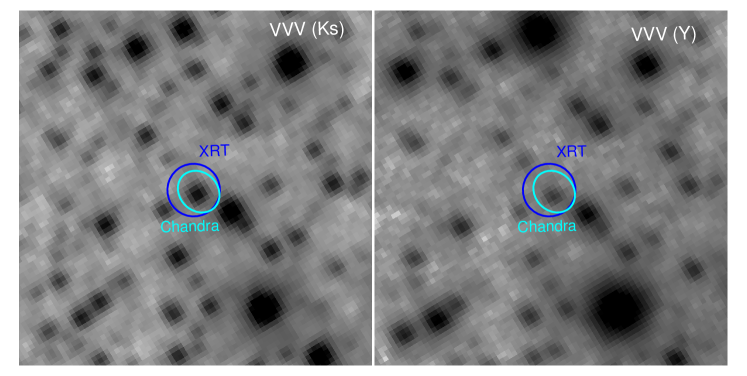
An optical companion of GRO J175027 was not yet known, mainly because of the lack of an accurate localization of the X-ray source in a very crowded sky field in the direction to the Galactic Center. Using the Chandra data we determined the source position as R.A.= 17h49m12.96s, Dec.= -26∘38′38.6′′ (J2000) with an ellipse region uncertainty of ′′ (90% confidence level as provided by celldetect routine). We calculated also the enhanced source position based on the Swift/XRT data (ObsID. 0003115012), where the astrometry is derived using field stars in the UVOT images (Evans et al., 2009)999http://www.swift.ac.uk/user_objects/index.php. The best-fit source position R.A.= 17h49m12.99s, Dec.=-26∘38′38.5′′ (J2000, error radius 1.9′′, 90% confidence level) is in a very good agreement with the Chandra results.
Thus based on the Swift/XRT and Chandra data we have determined, for the first time, accurate coordinates of GRO J175027 which will be subsequently used to search for its infrared counterpart (Fig.4).
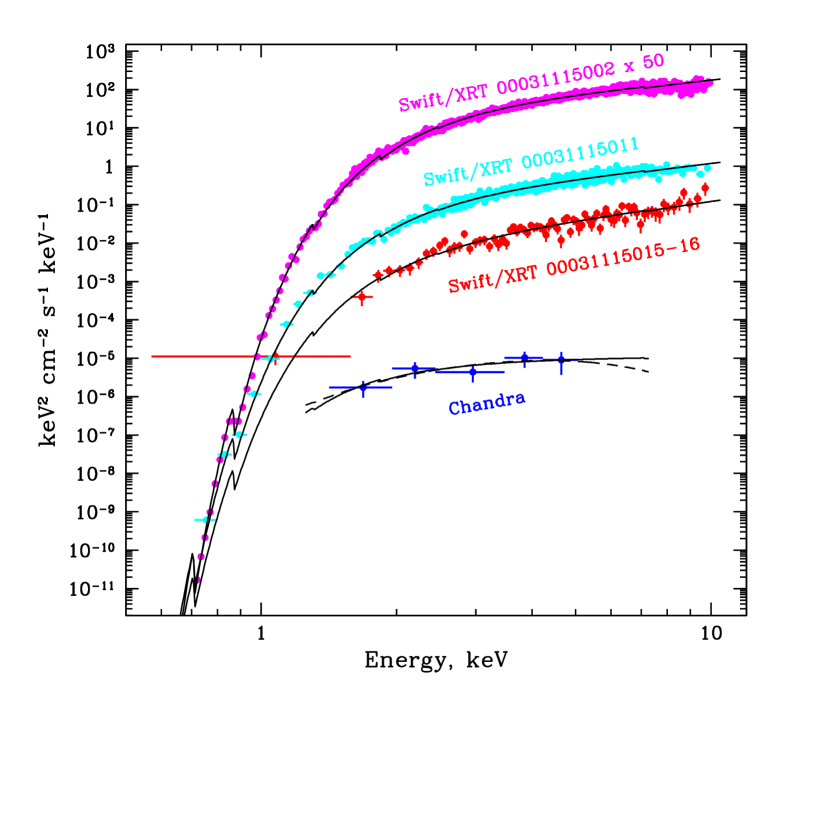
The source spectrum below 10 keV can be well described by a simple power law model modified by an absorption at low energies. The typical values of the photon index and absorption are about and cm-2, respectively, in a wide range of the source fluxes (we used here both sets of observations in 2008 and 2015, performed with Swift/XRT). Several spectra of GRO J175027, obtained in different states, are shown in Fig. 5.
As it was shown by Wijnands & Degenaar (2016) and Tsygankov et al. (2016b) the spectra of X-ray pulsars should to become significantly softer after the transition into the propeller regime and cease of the accretion. The GRO J175027 spectrum obtained with the Chandra observatory after such a transition is shown in Fig. 5 by blue points. It can be described by a black body model with the temperature of about 1 keV. Formally this spectrum looks softer in a comparison with the spectra before the transition, but its temperature is somewhat higher than expected for the propeller regime ( keV with the subsequent cooling, Wijnands & Degenaar 2016). It can be associated either with insufficient statistics (formally, the source spectrum can be also described by the absorbed powerlaw model with the photon index of ), or with a possible continuation of the accretion after the transition into the propeller regime (see, e.g., a discussion of different mechanisms of the low state emission in Tsygankov et al., 2017a).
Finally note, that the absorption value derived from X-ray spectra shows some excess in a comparison with the value cm-2 given in the standard catalogs LAB (Kalberla et al., 2005) and GASS III (Kalberla & Haud, 2015). It can be connected either with an additional internal absorption due to the matter expelled by a normal star before and during outbursts or clumps of the interstellar medium on the line of sight, which are not resolved on the radio maps.
6 IR counterpart: type and distance estimate
| VVV values (dr4) | |
|---|---|
An accurate localization of GRO J175027 in X-rays allowed us unambiguously identify its infrared counterpart based on the VVV/ESO and UKIDSS/GPS surveys. This object is presented in both catalogs with names of VVV J174912.96-263838.92 and UGPS J174912.97-263838.9, respectively. Positions of the object in VVV and UKIDSS catalogues are consistent with each other, so we use the VVV data further as this survey covers the sky in a larger number of filters (see Table 1). The source coordinates in the VVV catalogue are (J2000) R.A.=17h49m12.968s, Dec.= -26∘38′38.93′′ (Fig.4).
An availability of the multiband VVV photometry gives a possibility to estimate roughly a spectral energy distribution (SED) of the source and to compare it with that of other BeXRBs. Similar approach was used recently for another distant Be-system 2S 1553-542 (Lutovinov et al., 2016).
To estimate the SED of the source we need to correct its apparent magnitudes (Table 1) for the interstellar extinction in each filter. This, of course, requires a knowledge of an extinction law in the direction to the source. It is especially important, taking into account preliminary estimates of the distance to GRO J175027 as kpc (Scott et al., 1997; Shaw et al., 2009) and a number of previous publications, where it was shown that the extinction law for the central regions of the Galaxy might significantly differ from the standard one (see, e.g., Nishiyama et al., 2009; Revnivtsev et al., 2010; Karasev et al., 2010, 2015; Alonso-García et al., 2017; Karasev & Lutovinov, 2018). For the following analysis we used the absorption law and extinction ratios in different filters, obtained by Alonso-García et al. (2017) from the VVV survey data for the Galactic Center direction.
Using these measurements we are able to determine an absorption magnitude and distance to the Galactic bulge examining the position of red clump giants (which can be considered as a tracers of the bar – the cental structure of the bulge), on the color-magnitude diagram (CMD), reconstructed for all stars in the vicinity of ′′ of the studied object. The observed magnitude and color of the centroid of red clump giants (RCG) are and , respectively. Knowing an absolute magnitude and unabsorbed color of RCGs in these filters and (Alves, 2000; Gontcharov, 2017; Karasev & Lutovinov, 2018), we can determine the absorption magnitude to RCGs (and subsequently to the Galactic bulge) as based on the relation and the extinction ratio from Alonso-García et al. (2017). It is known that the distance to RCGs (or in other world to the bar) can vary at different longitudes (see, e.g., Gerhard & Martinez-Valpuesta, 2012). GRO J175027 is located in from the Galactic Center, therefore we refined the distance to the bulge to be more confident in the subsequent calculations. This distance kpc can be estimated from a relation , where is the apparent/measured magnitude, is the absolute magnitude, is the distance in pc and is the absorption magnitude.
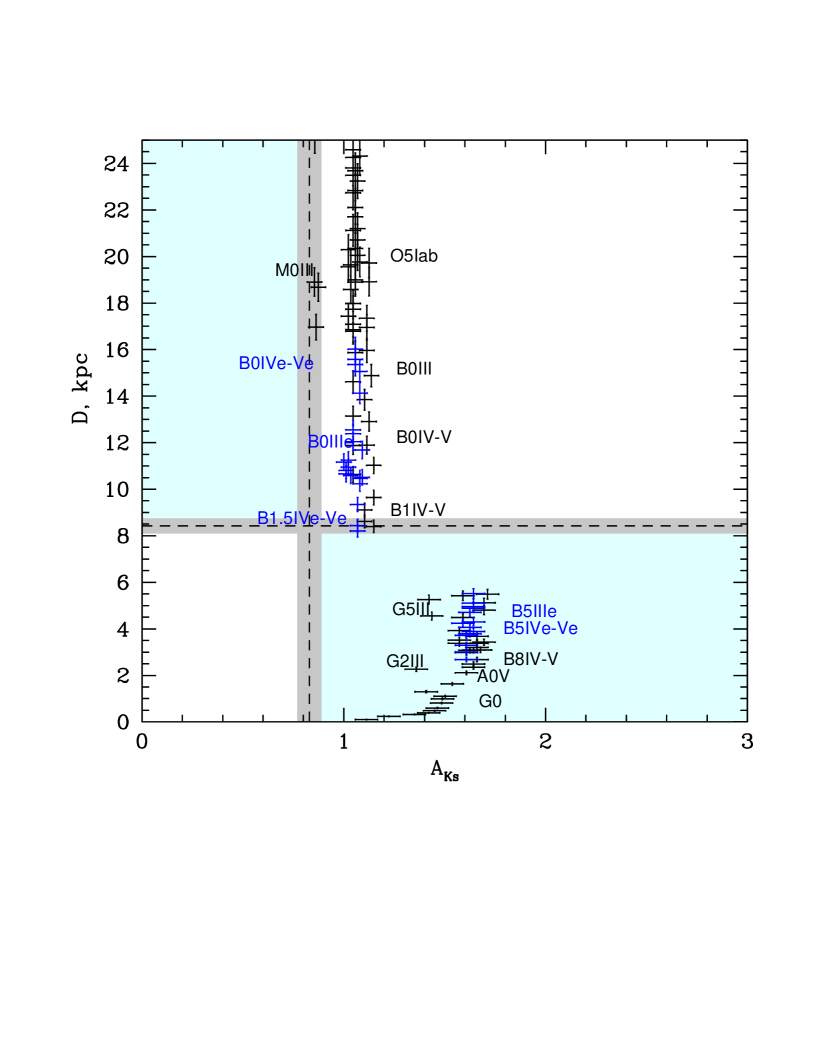
Based on the measurements of the distance and absorption to the Galactic bulge, we can try to estimate the absorption to the source and its class and distance. Assuming stars of different spectral and luminosity classes as the GRO J175027 companion, we define the correction for the absorption and the distance required for each of them to satisfy the observed values from the VVV survey (Table 1). It is important to note, that we don’t know exactly where the extinction law become a non-standard one, therefore for stars which are located before the bulge we use a standard extinction law (Cardelli et al., 1989), and for stars in the bulge or behind it the non-standard law is applied (see Karasev et al., 2015, for the detailed description).
The resulting “distance-absorption” diagram is presented in Fig.6. Stars of different classes, that potentially could be a counterpart of GRO J175027, lie in the white regions, whereas those that can not be the counterpart – in blue ones101010Absolute magnitudes and intrinsic colors of stars of different spectral and luminosity classes for the corresponding filters were taken from Wegner (2000, 2006, 2007, 2014) and Wegner (2015) for Be-stars.. Dashed lines correspond to the absorption and distance to the Galactic bulge and divide the diagram in these regions. Two conclusions can be made from this diagram: 1) a normal star in GRO J175027 should to have the class not later then B1-2 and to be located behind the Galactic Center; 2) the magnitude of the absorption to the object is .
Knowing the absorption for the filter and extinction laws/ratios, we can calculate the absorption for other filters and then derive corrected (unabsorbed) magnitudes for our star. To compare SED for this star with SEDs for known Be-systems or other stars, the unabsorbed magnitudes were converted to the absolute ones for two possible distances to the source: 15 and 20 kpc.
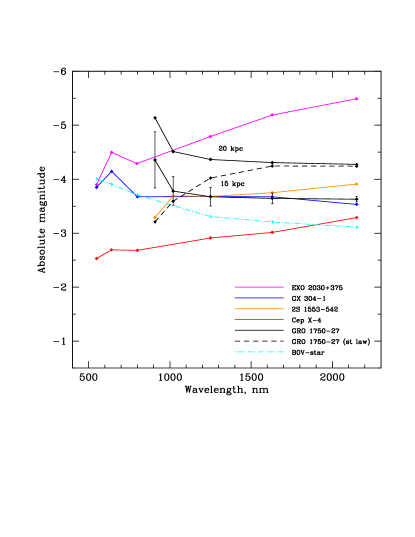
The obtained spectral energy distribution of GRO J175027 (Fig.7) is similar to SEDs of Be-systems GX 304-1 and 2S 1553-542, if GRO J175027 is located at distances around 15 kpc (the lower black points and solid curve). At the same time SED of the B0V star (cyan dashed-dotted curve) is also quite similar to SED of the GRO J175027 counterpart for the distance of 12 kpc. Note we do not see in SED of GRO J175027 an infrared excess, which is typical for Be-systems due to a circumstellar disk around the Be star. An absence of such an excess can be due to IR observations were performed in 2010-2013 when the system was in the low state. It is known that Be-stars can lose the disk and spectrometrically look similar to conventional B-stars (Clark et al., 2003; Wisniewski et al., 2010; Draper et al., 2014). So we cannot exclude such a situation for GRO J175027. Note, that a probable uncertainty in the extinction curve can change SED of the source, but the IR excess is difficult to reproduce (see dashed line in Fig.7 for the standard absorption law).
Finally, we conclude that the counterpart of GRO J175027 is a distant star ( kpc) of an early spectral class, probably a Be-star taking into account its transient behaviour. This distance estimate is in line with other estimates discussed above. Spectroscopic observations in the infrared waveband are required to obtain more robust spectral classification and spectrophotometric distance to the source.
7 Conclusions
In this work the detailed study of the accreting X-ray pulsar GRO J175027 using data of X-ray observatories Chandra, Swift, and Fermi, and the near-infrared survey VVV/ESO is presented.
We have measured, for the first time, accurate X-ray coordinates of GRO J175027 (J2000) R.A.= 17h49m12.99s, Dec.=-26∘38′38.5′′ and determined its infrared counterpart.
A comparison of the spectral energy distribution of GRO J175027 with those of known Be/X-ray binaries and early type stars has allowed us to estimate a lower distance limit to the source at kpc. Moreover, the analysis of the observed spin-up of the pulsar during the giant outburst in 2015 provides an independent distance estimate of kpc, and also allows to estimate the magnetic field on the surface of the neutron star as G.
Finally, the monitoring of the source with the Swift/XRT telescope revealed a rapid drop of the source flux in the end of the 2015 outburst, likely associated with the transition to the propeller regime. A detection of this transition gives an estimate of the magnetic field of the neutron star as G for distances to the system of 15-20 kpc, that is well agreed with above results from the infrared and spin-up analysis.
Acknowledgments
This work was supported by the Russian Foundation of Basic Research (grant 17-52-80139 BRICS-a). SST acknowledges the support of the Academy of Finland grants 309228, 316932 and 317552. V.D. thank the Deutsches Zentrum for Luft- und Raumfahrt (DLR) and Deutsche Forschungsgemeinschaft (DFG) for the support. Authors thank to Prof. Frederick Walter for comments and suggestions that allowed to improve the manuscript. The research has made use of Chandra data and software provided by the Chandra X-ray Center. We used also data supplied by the UK Swift Science Data Centre at the University of Leicester. Results are also based on data products from VVV Survey observations made with the VISTA telescope at the ESO Paranal Observatory.
References
- Alonso-García et al. (2017) Alonso-García J., et al., 2017, ApJLett, 849, L13
- Alves (2000) Alves D. R., 2000, ApJ, 539, 732
- Campana et al. (1998) Campana S., Stella L., Mereghetti S., Colpi M., Tavani M., Ricci D., Dal Fiume D., Belloni T., 1998, ApJLett, 499, L65
- Campana et al. (2001) Campana S., Gastaldello F., Stella L., Israel G. L., Colpi M., Pizzolato F., Orlandini M., Dal Fiume D., 2001, ApJ, 561, 924
- Campana et al. (2008) Campana S., Stella L., Kennea J. A., 2008, ApJLett, 684, L99
- Campana et al. (2018) Campana S., Stella L., Mereghetti S., de Martino D., 2018, A&A, 610, A46
- Cardelli et al. (1989) Cardelli J. A., Clayton G. C., Mathis J. S., 1989, ApJ, 345, 245
- Clark et al. (2003) Clark J. S., Tarasov A. E., Panko E. A., 2003, A&A, 403, 239
- Coe et al. (1997) Coe M. J., Buckley D. A. H., Fabregat J., Steele L. A., Still M. D., Torrejon J. M., 1997, A&AS, 126, 237
- Cui (1997) Cui W., 1997, ApJLett, 482, L163
- Dotani et al. (1995) Dotani T., Fujimoto R., Nagase F., Inoue H., 1995, IAU Circ., 6241
- Draper et al. (2014) Draper Z. H., Wisniewski J. P., Bjorkman K. S., Meade M. R., Haubois X., Mota B. C., Carciofi A. C., Bjorkman J. E., 2014, ApJ, 786, 120
- Evans et al. (2009) Evans P. A., et al., 2009, MNRAS, 397, 1177
- Filippova et al. (2017) Filippova E. V., Mereminskiy I. A., Lutovinov A. A., Molkov S. V., Tsygankov S. S., 2017, Astronomy Letters, 43, 706
- Gerhard & Martinez-Valpuesta (2012) Gerhard O., Martinez-Valpuesta I., 2012, ApJLett, 744, L8
- Ghosh & Lamb (1979) Ghosh P., Lamb F. K., 1979, ApJ, 234, 296
- Gontcharov (2017) Gontcharov G. A., 2017, Astronomy Letters, 43, 545
- Illarionov & Sunyaev (1975) Illarionov A. F., Sunyaev R. A., 1975, A&A, 39, 185
- Kalberla & Haud (2015) Kalberla P. M. W., Haud U., 2015, A&A, 578, A78
- Kalberla et al. (2005) Kalberla P. M. W., Burton W. B., Hartmann D., Arnal E. M., Bajaja E., Morras R., Pöppel W. G. L., 2005, A&A, 440, 775
- Karasev & Lutovinov (2018) Karasev D. I., Lutovinov A. A., 2018, Astronomy Letters, 44, 220
- Karasev et al. (2010) Karasev D. I., Lutovinov A. A., Burenin R. A., 2010, MNRAS, 409, L69
- Karasev et al. (2015) Karasev D. I., Tsygankov S. S., Lutovinov A. A., 2015, Astronomy Letters, 41, 394
- Kluźniak & Rappaport (2007) Kluźniak W., Rappaport S., 2007, ApJ, 671, 1990
- Koh et al. (1995) Koh T., Chakrabarty D., Prince T. A., Vaughan B., Zhang S. N., Scott M., Finger M. H., Wilson R. B., 1995, IAU Circ., 6222
- Krimm et al. (2013) Krimm H. A., et al., 2013, ApJS, 209, 14
- Lutovinov et al. (2016) Lutovinov A. A., Buckley D. A. H., Townsend L. J., Tsygankov S. S., Kennea J., 2016, MNRAS, 462, 3823
- Lutovinov et al. (2017) Lutovinov A. A., Tsygankov S. S., Krivonos R. A., Molkov S. V., Poutanen J., 2017, ApJ, 834, 209
- Meegan et al. (2009) Meegan C., et al., 2009, ApJ, 702, 791
- Negueruela & Okazaki (2001) Negueruela I., Okazaki A. T., 2001, A&A, 369, 108
- Nishiyama et al. (2009) Nishiyama S., Tamura M., Hatano H., Kato D., Tanabé T., Sugitani K., Nagata T., 2009, ApJ, 696, 1407
- Okazaki & Negueruela (2001) Okazaki A. T., Negueruela I., 2001, A&A, 377, 161
- Okazaki et al. (2013) Okazaki A. T., Hayasaki K., Moritani Y., 2013, PASJ, 65, 41
- Parfrey et al. (2016) Parfrey K., Spitkovsky A., Beloborodov A. M., 2016, ApJ, 822, 33
- Poutanen et al. (2013) Poutanen J., Mushtukov A. A., Suleimanov V. F., Tsygankov S. S., Nagirner D. I., Doroshenko V., Lutovinov A. A., 2013, ApJ, 777, 115
- Reig (2011) Reig P., 2011, Astroph.Sp.Sci., 332, 1
- Reig et al. (2014) Reig P., Blinov D., Papadakis I., Kylafis N., Tassis K., 2014, MNRAS, 445, 4235
- Revnivtsev et al. (2010) Revnivtsev M., van den Berg M., Burenin R., Grindlay J. E., Karasev D., Forman W., 2010, A&A, 515, A49
- Riquelme et al. (2012) Riquelme M. S., Torrejón J. M., Negueruela I., 2012, A&A, 539, A114
- Rouco Escorial et al. (2018) Rouco Escorial A., Wijnands R., Ootes L. S., Degenaar N., Snelders M., Kaper L., Cackett E. M., Homan J., 2018, arXiv e-prints, 1809.10264
- Scott et al. (1997) Scott D. M., Finger M. H., Wilson R. B., Koh D. T., Prince T. A., Vaughan B. A., Chakrabarty D., 1997, ApJ, 488, 831
- Shaw et al. (2009) Shaw S. E., Hill A. B., Kuulkers E., Brandt S., Chenevez J., Kretschmar P., 2009, MNRAS, 393, 419
- Stella et al. (1986) Stella L., White N. E., Rosner R., 1986, ApJ, 308, 669
- Tsygankov et al. (2016a) Tsygankov S. S., Mushtukov A. A., Suleimanov V. F., Poutanen J., 2016a, MNRAS, 457, 1101
- Tsygankov et al. (2016b) Tsygankov S. S., Lutovinov A. A., Doroshenko V., Mushtukov A. A., Suleimanov V., Poutanen J., 2016b, A&A, 593, A16
- Tsygankov et al. (2017a) Tsygankov S. S., Wijnands R., Lutovinov A. A., Degenaar N., Poutanen J., 2017a, MNRAS, 470, 126
- Tsygankov et al. (2017b) Tsygankov S. S., Doroshenko V., Lutovinov A. A., Mushtukov A. A., Poutanen J., 2017b, A&A, 605, A39
- Tsygankov et al. (2017c) Tsygankov S. S., Mushtukov A. A., Suleimanov V. F., Doroshenko V., Abolmasov P. K., Lutovinov A. A., Poutanen J., 2017c, A&A, 608, A17
- Wachter et al. (1979) Wachter K., Leach R., Kellogg E., 1979, ApJ, 230, 274
- Walter et al. (2015) Walter R., Lutovinov A. A., Bozzo E., Tsygankov S. S., 2015, A&ARv, 23, 2
- Wang (1995) Wang Y.-M., 1995, ApJLett, 449, L153
- Wegner (2000) Wegner W., 2000, MNRAS, 319, 771
- Wegner (2006) Wegner W., 2006, MNRAS, 371, 185
- Wegner (2007) Wegner W., 2007, MNRAS, 374, 1549
- Wegner (2014) Wegner W., 2014, Acta Astron., 64, 261
- Wegner (2015) Wegner W., 2015, Astronomische Nachrichten, 336, 159
- Wijnands & Degenaar (2016) Wijnands R., Degenaar N., 2016, MNRAS, 463, L46
- Wisniewski et al. (2010) Wisniewski J. P., Draper Z. H., Bjorkman K. S., Meade M. R., Bjorkman J. E., Kowalski A. F., 2010, ApJ, 709, 1306