11email: aakylas@noa.gr
The source number counts at high energies: SWIFT vs. NuSTAR
The hard X-ray sky at energies above 10 keV, has been extensively explored by the Swift/Gehrels and the NuSTAR missions in the 14-195 keV and the 3-24 keV bands respectively. The major population of the hard X-ray detected sources are Active Galactic Nuclei (AGN). A discrepancy has been reported between the number count distributions of the two missions in the sense that the extrapolation of the Swift/Gehrels number counts in the flux regime sampled by NuSTAR lies significantly below the NuSTAR counts. We explore anew this issue by comparing the number count distributions derived from the Swift/Gehrels 105-month catalogue with those from the serendipitous NuSTAR source catalogue. We use a novel number count distribution estimator which makes use of the C-statistic on the un-binned data. In the 14-195 keV band, the Swift/BAT counts follow a Euclidean slope with (90% confidence level). The NuSTAR counts in the 8-24 keV band present a steeper slope with , because of an upturn at fluxes below . The same upturn is observed in the soft (3-8 keV) NuSTAR number counts, which in overall also present a steep slope with . Only the bright part of the NuSTAR 3-8 keV counts agrees with the Chandra number counts in the 2-10 keV band while the fainter part (below ) of the soft NuSTAR counts is in marked disagreement with the Chandra counts.
Next, we compare the derived number counts in the different bands using our X-ray AGN population synthesis models. The comparison between the Chandra and the Swift/BAT number counts shows a very good agreement for the ’standard’ AGN spectrum with a power-law slope , a high energy cut-off at 130 keV and a 2-10 keV reflection component of 3%. On the other hand, using the above standard AGN spectral model, only the bright part of the NuSTAR 8-24 keV and 3-8 keV number counts, agree with the model predictions. Then it is most likely that the disagreement between the X-ray number counts in the different bands is because of the faint NuSTAR number counts. We discuss various possibilities for the origin of this disagreement.
Key Words.:
Surveys – X-rays: galaxies – X-rays: general1 Introduction
X-ray emission is a ubiquitous feature of Active Galactic Nuclei and X-ray surveys provide the most unbiased way for their detection. In contrast to the optical radiation, X-rays are not easily absorbed unless they encounter extreme hydrogen column densities of the order of . Moreover, X-rays suffer from negligible contamination from stellar processes unlike the infrared and the optical emission. Because of the above reasons, the X-ray surveys performed with Chandra and XMM-Newton in the 0.3-10 keV band, have mapped very efficiently the AGN population and its evolution (Brandt & Alexander, 2015). These surveys have resolved more than 80% of the integrated X-ray light, the X-ray background, to Active Galactic Nuclei (Luo et al., 2017). At harder energies 10 keV, where most of the X-ray background energy density is produced (Revnivtsev et al., 2003; Frontera et al., 2007; Churazov et al., 2007; Ajello et al., 2012) our picture is far less clear. This is mainly because of the lack of focusing X-ray instruments which could not allow for high sensitivity X-ray observations. Nevertheless, the coded-mask instruments of the INTEGRAL and Swift/Gehrels missions have probed AGN at low redshifts, typically (Malizia et al., 2009; Ajello et al., 2012; Vasudevan et al., 2013; Oh et al., 2018).
There is a drastic leap forward in our knowledge of the hard X-ray Universe with the launch of the NuSTAR mission Harrison et al. (2013). This mission observes the X-ray sky in the 3-80 keV band with an unprecedented sensitivity carrying the first X-ray telescope that focuses X-rays with energies above 10 keV. The large effective area and the excellent (52 arcsec half-power diameter) spatial resolution of NuSTAR allow the detection of faint X-ray sources up to two orders of magnitude fainter than the faintest Swift/Gehrels - BAT sources detected. The majority of the serendipitous NuSTAR sources in the 8-24 keV band, are associated with AGN at redshifts of (Lansbury et al., 2017). Although NuSTAR has an excellent sensitivity, its field of view has a moderate size (12 arcmin diameter). Then the Swift/Gehrels and the INTEGRAL missions are quite complementary to NuSTAR as only these can observe large swaths of the sky and hence large cosmological volumes.
Harrison et al. (2016) presented the NuSTAR X-ray numbers counts in the 8-24 keV band. These reach fluxes as faint as , resolving 33-39% of the X-ray background in this energy band. The measured NuSTAR counts lie significantly above a simple extrapolation with a Euclidean slope of the Swift/BAT number counts measured at higher fluxes. Harrison et al. (2016) assert that this may suggest strong AGN evolution between the average redshift of the BAT AGN () and the redshift of the NuSTAR sources (). Aird et al. (2015) derived the NuSTAR AGN luminosity function in the 8-24 keV band. They find an excess number of sources relative to the BAT luminosity function. In contrast, the luminosity function of Ueda et al. (2014) in the 2-10 keV band agrees well with the BAT luminosity function (Ajello et al., 2012) assuming a spectrum with a reflection parameter of (see Magdziarz & Zdziarski, 1995) which corresponds to a 5% fraction of reflected emission in the 2-10 keV band (e.g. Akylas et al., 2012). Aird et al. (2015) suggest that a way to bring in agreement the Ueda et al. (2014) and the NuSTAR luminosity function is to increase the reflection parameter to , corresponding to a reflection fraction of 10% in the 2-10 keV band. However, this leaves in disagreement the BAT with both the NuSTAR and the Chandra luminosity functions.
Here, we address anew this problem by deriving the number count distributions from the newly released 105-month BAT survey (14-195 keV) and the NuSTAR serendipitous source catalogue of Lansbury et al. (2017) in both the 3-8 and 8-24 keV bands. We compare these distributions using the X-ray population synthesis models of Akylas et al. (2012), assuming different AGN spectral models, namely spectral indices, reflection component and high energy spectral cut-off.
2 Data
2.1 Swift/Gehrels
The Swift Gamma-Ray Burst (GRB) observatory (Gehrels et al., 2004) was launched in November 2004 and has been continually observing the hard X-ray ( keV) sky with the Burst Alert Telescope (BAT). BAT is a large, coded-mask telescope, optimized to detect transient GRBs and is designed with a very wide field-of-view of 60100 degrees.
The data presented in this paper stem from the analysis of the sources detected in the 105 months of observations of the BAT hard X-ray detector on the Swift/Gehrels Gamma-Ray Burst observatory (Oh et al., 2018). The 105 month BAT survey is a uniform, hard X-ray, all-sky survey with a sensitivity of 8.40 ergs s-1 cm-2 over 90% of the sky and 7.24 ergs s-1 cm-2 over 50% of the sky, in the 14-195 keV band. The BAT 105 month catalog provides 1632 hard X-ray sources in the 14-195 keV band above the 4.8 significance level, with 422 new detections compared to the previous 70 month catalog release (Baumgartner et al., 2013). Our study is limited to the AGN population and therefore all Galactic and extended sources have been excluded. In particular, the following types of sources have been used: Seyfert I (379), Seyfert II (448), LINER (6), unknown AGN (114), multiple (10), beamed AGN (158) and unidentified (129). Most of the 129 unidentified sources are located outside the Galactic plane and therefore we expect that the majority of them are most likely AGN.
2.2 NuSTAR
The Nuclear Spectroscopic Telescope Array, NuSTAR , (Harrison et al., 2013) launched in June 2012, is the first orbiting X-ray observatory which focuses light at high energies (E 10 keV). It consists of two co-aligned focal plane modules (FPMs), which are identical in design. Each FPM covers the same 12 x 12 arcmin portion of the sky, and comprises of four Cadmium-Zinc-Tellurium detectors. NuSTAR operates between 3 and 79 keV, and provides an improvement of at least two orders of magnitude in sensitivity compared to previous hard X-ray observatories operating at energies E10 keV.
In our analysis, we use the data from the first full catalogue for the NuSTAR serendipitous survey (Lansbury et al., 2017). The catalogue contains data taken during the first 40 months of the NuSTAR operation, with an area coverage of 13 deg2. For this study we use the 163 sources detected in the 8-24 keV energy range and the 273 sources detected in the 3-8 keV band. We remove all the sources that are associated with the primary science targets and the Galactic sources. Moreover, in order to further achieve the minimum contamination of the sample from non AGN sources, all detections within —b—20 deg have been removed. The final hard X-ray sample (8-24 keV) contains 106 sources and the soft X-ray sample (3-8 keV) contains 171 sources.
3 Number Count distribution
In this section, we derive the number count distributions, for the BAT (14-195 keV) and the NuSTAR (both the 8-24 and the 3-8 keV bands) data. The area curves have been taken from (Oh et al., 2018) and Lansbury (priv. comm.) for the BAT and the NuSTAR observations respectively. We use a novel C-stat estimator which makes use of the un-binned data to fit the derived distributions. We compare our findings in the hard 8-24 keV band with previous NuSTAR estimates and in the soft 3-8 keV NuSTAR band with precise measurements of the Chandra number count distribution in the 2-10 keV band. Finally, we compare with the predictions of X-ray population synthesis models.
3.1 Methodology
In order to fit the number count distributions, we apply for the first time, the maximum likelihood statistic for Poisson data, given in Cash (1979). Normally, differential number count distributions are binned in order to obtain at least 15 sources in each bin to apply Gaussian statistics. However, the binning may result in a loss of information. Cash (1979) showed that the statistic estimator
| (1) |
allows bins to be picked in an almost arbitrary way, while , ( is the minimum value of the estimator), is distributed as with q degrees of freedom and the same technique for generation of confidence intervals could apply in the Poisson limit. In the equation above, N is the finite number of bins, is the expected number (predicted by the model) and is the observed number in the bin. When one takes a very fine mesh of bins, becomes zero or one and the statistic takes the form:
| (2) |
where E is the total expected counts from the experiment and the summation is now over each of the observed photons. We assume that the differential LogN-LogS distribution is described by a single power-law model, with slope i.e. and therefore we neglect the break of the number counts that normally appears around a 2-10 keV flux of (Georgakakis et al., 2008). Hereafter, we quote the slope of the integral number counts, , in order to facilitate the comparison with other results mentioned in the literature. The slope of the integral number counts is related to the slope of the differential number counts with the relation .
We calculate the minimum value of the C estimator (equation 2) using a very fine grid for the values of the slope and the normalization parameter k, to obtain the best fit solution. Then we calculate the 90 per cent confidence intervals for two interesting parameters by applying the criterion (Press et al., 2007).
| Mission | Energy band (keV) | slope | Reference |
|---|---|---|---|
| NuSTAR | 3-8 | 1.82 0.15 | this work |
| 1.81 0.08 | Harrison et al. (2016) | ||
| NuSTAR | 8-24 | 1.71 0.20 | this work |
| 1.76 0.10 | Harrison et al. (2016) | ||
| 1.36 0.28 | Zappacosta et al. (2018) | ||
| Swift/Gehrels | 14-195 | 1.51 0.10 | this work |
| 1.42 0.14 | Tueller et al. (2008) | ||
| Chandra | 2-10 | 1.52 | Georgakakis et al. (2008) |
3.2 Swift/Gehrels 14-195 keV
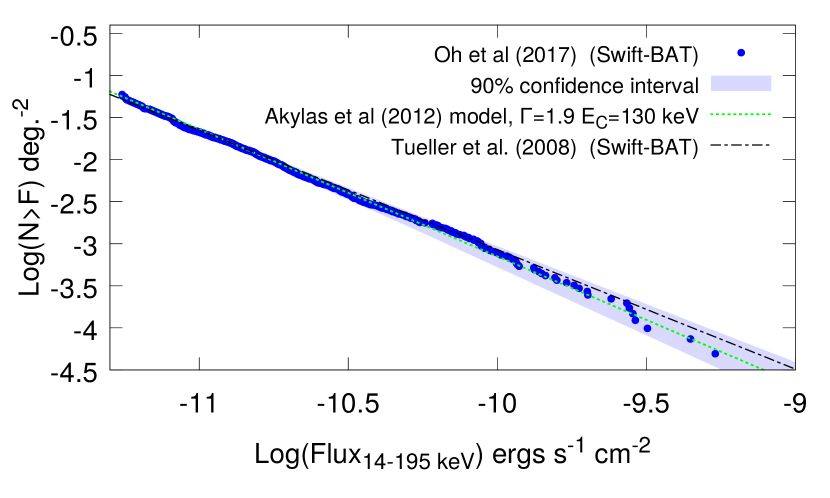
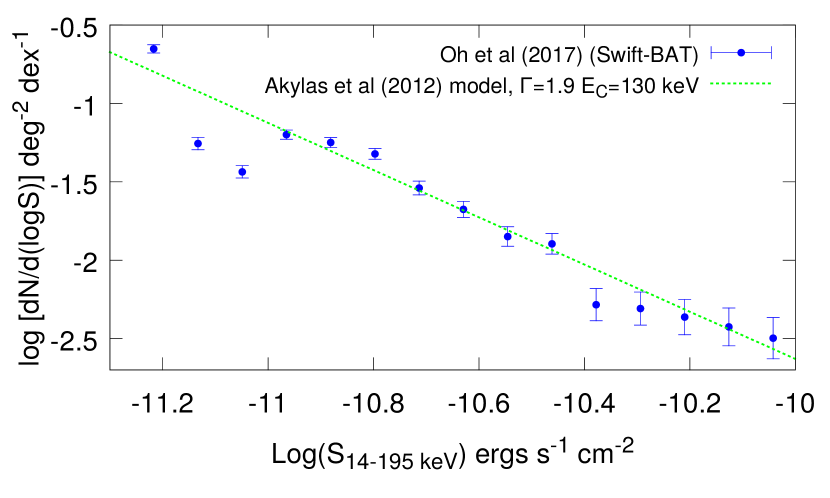
In Fig. 1 we plot the differential and the integrated number count distributions in the 14-195 keV band, for the BAT sample. The best fit slope of the derived LogN-LogS and its 90% uncertainty, is and the normalization . Similar findings have been presented in Tueller et al. (2008). These authors compiled a sample of 103 AGN from the first 9-month BAT survey. They fit a power-law to their logN-logS and found a slope of 1.420.14.
Next, we use the X-ray population synthesis models presented in Akylas et al. (2012), to estimate the average AGN spectral parameters that are consistent with the observed number count distribution. We create a set of logN-logS predictions letting the photon index, , and the high energy cut-off to vary freely, while we fix the amount of the reflected emission to 3% of the total 2-10 keV luminosity. The reflected emission has a small impact on the number count distribution of the total AGN population and the selected value of 3% is typical of those reported in the literature (e.g. Del Moro et al. (2017); Ricci et al. (2017); Zappacosta et al. (2018)). A characteristic model presented in Fig. 1 corresponds to and =130 keV and is consistent with the data at the 90% confidence level. This value of the cut-off is entirely consistent with the INTEGRAL observations of 41 type-1 Seyfert-1. Malizia et al. (2014) finds keV with a standard deviation of 46 keV. More recent work on the cut-off energy using NuSTAR data (Tortosa et al., 2018) is in overall agreement with our work. We note that when we adjust the reflection parameter to 1% and 5%, then a model consistent with the observed logN-logS, is obtained for and =200 keV or =80 keV respectively.
3.3 NuSTAR 8-24 keV
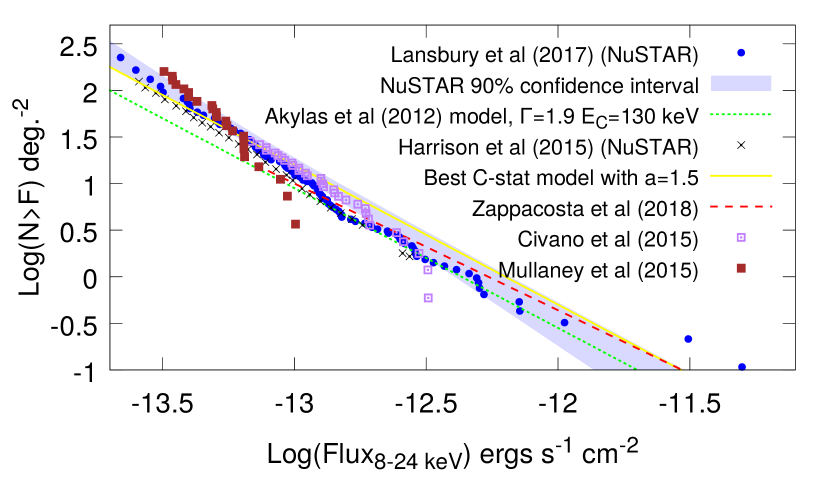
In Fig. 2, we plot the differential and the integrated number count distributions of the sources detected in the NuSTAR serendipitous catalogue in the 8-24 keV band. The best fit power-law slope and its 90% uncertainty is and the normalization . This result is marginally consistent with the canonical Euclidean value of 1.5. We compare our results with those presented in Harrison et al. (2016). These authors measured the 8-24 keV number count distribution by combining data from the following NuSTAR surveys: (a) serendipitous source catalogue, (b) COSMOS survey, Civano et al. (2015), (c) Extended Chandra Deep Field South, ECDFS, Mullaney et al. 2015 and (d) the Extended Groth Strip region (EGS, Aird et al in prep.). Their best-fit power-law, is very similar to our result with . Our estimates are 10 per cent higher in terms of the normalization, at the flux of 10-13 . Note however that in this work we consider the full serendipitous survey catalog presented in Lansbury et al. (2017), while Harrison et al. (2016) incorporated a smaller part of the survey. Their results are included in Fig. 2 for comparison.
In the same figure, we plot the prediction from the population synthesis model presented in Fig. 1 for the BAT observations, calculated now in the 8-24 keV band. There is a reasonable agreement between the model and the data in the bright part of the number count distribution ( ) while our model is way below the number count distribution at fainter fluxes. Recently, Zappacosta et al. (2018), analyzed a bright sample of 63 sources ( ) from the multi-tiered NuSTAR Extragalactic Survey program. Their estimates on the number count distribution suggest a flatter slope () but still consistent with the Euclidean slope of =1.5 within the errors. In Fig. 2 the red dashed line shows their results. There is a notable agreement between their estimates and our results. Finally, we give the best C-stat solution to the NuSTAR counts, with a slope fixed to 1.5, to enable the direct comparison of our predictions with the observed counts. In this case the normalisation of the logN-logS becomes about a factor of two higher than our model.
3.4 NuSTAR 3-8 keV
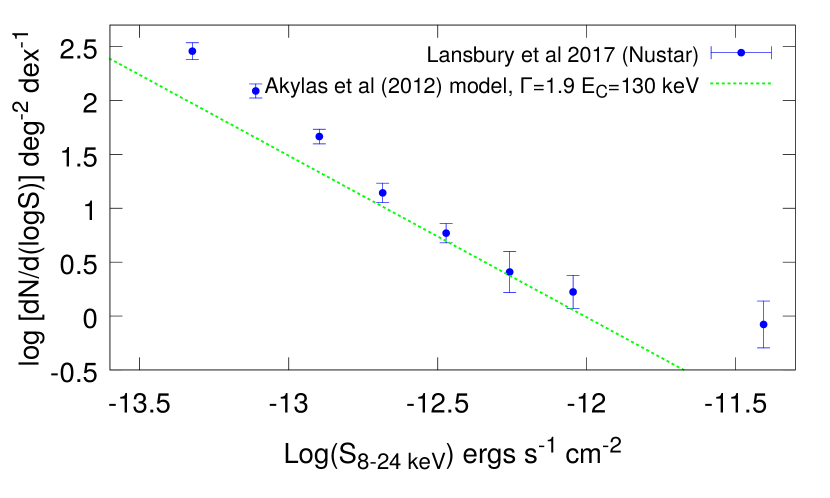
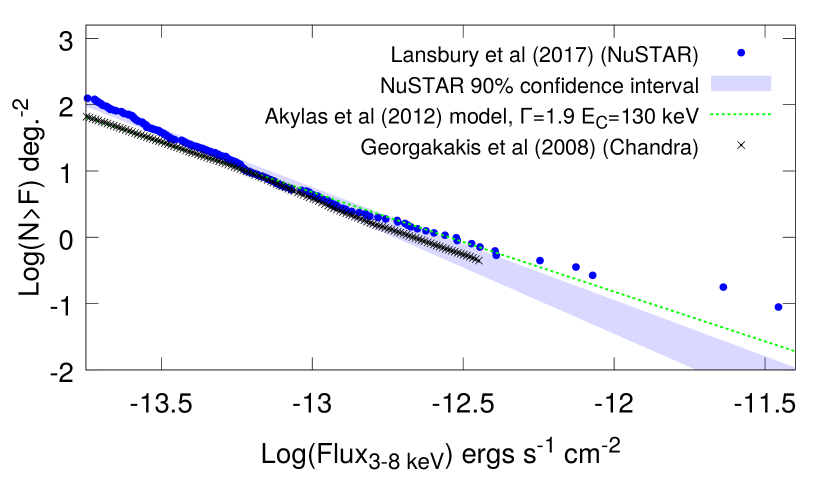
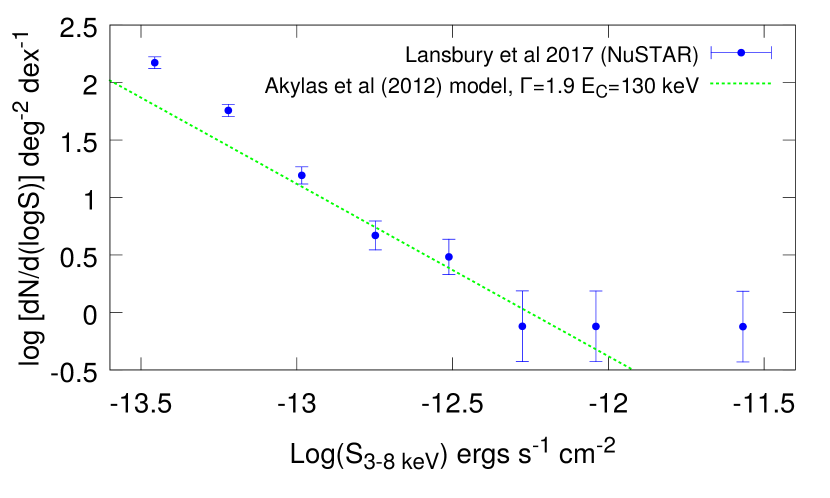
In Fig. 3 we plot the differential and the integrated number count distributions in the 3-8 keV band using the NuSTAR serendipitous source catalogue. The best fit slope of the distribution and its 90% uncertainty, is and the normalization . The observed distribution is consistent with the canonical Euclidean value of 1.5, at the 99.5% confidence interval. This estimate is also in excellent agreement with the slope found by Harrison et al. (2016), .
In the same figure we plot the model presented in Figs. 1 and Fig. 2 (green dotted line). Similarly to the NuSTAR results in the 8-24 keV band, there is a marked difference between our models and the NuSTAR data at faint fluxes ( ) while there is good agreement at brighter fluxes.
Next, we include in our comparison the 2-10 keV Chandra number counts presented in Georgakakis et al. (2008). These authors, used a novel technique which correctly accounts for the observational biases that affect the probability of detecting a source of a given X-ray flux. They estimated the X-ray source counts by combining deep pencil-beam and shallow wide-area Chandra observations. Their sample has a total of 6295 unique sources over an area of 11.8. The flux conversion from their 2-10 keV band to the 3-8 keV adopted here, has been made assuming a simple power-law model with . Because of the limited energy width of the bandpasses, the choice of the spectral slope has a small impact on the conversion from the 2-10 keV to the 3-8 keV band. Similarly to the 8-24 keV results, the NuSTAR number count distribution nicely matches the Chandra data only at the brighter fluxes. It is also evident from the plot that the Chandra number counts are consistent with the same standard model that also describes very well the BAT logN-logS.
4 Summary
The hard X-ray sky above 10 keV has been observed in unprecedented sensitivity with the NuSTAR mission. A difference between the BAT (14-195 keV) and the 8-24 keV NuSTAR counts has been reported in the literature in the sense that the former lies well below the latter. In the light of this disagreement, we estimate the number count distribution from the recently released 105-month Swift-BAT AGN catalogue, in the 14-195 keV band. For comparison we also derive the NuSTAR number counts from the serendipitous source catalogue of Lansbury et al. (2017). We use a novel approach for fitting the number count distribution, by applying the C-statistic estimator on the un-binned data. We compare the number count distributions between different bands using our X-ray AGN population synthesis models. The results are presented in Table 1, and can be summarized as follows:
1. The BAT logN-logS presents a Euclidean slope of . This result is consistent with earlier estimates of the BAT logN-logS (Tueller et al., 2008) which used considerably fewer sources.
We used our X-ray AGN population synthesis code (Akylas et al., 2012), to find physically motivated models that fit these observations. A ’standard’ AGN spectral model with a photon index 1.9, a high energy cut-off 130 keV, and reflected emission of 3 of the total 2-10 keV flux matches very well the BAT number count distribution.
We also compared the BAT number counts with the Chandra results in the softer, 2-10 keV band, obtained by Georgakakis et al. (2008) by estimating the above ’standard’ model in the 2-10 keV band. Again, there is a notable agreement between our population synthesis model predictions and the Chandra results. This demonstrates that reasonable assumptions on the spectral shape of AGN should lead to consistent modelling of the number count distributions in the Chandra and the BAT bands.
2. The NuSTAR number count distribution in the 8-24 keV band presents a slope of . This is steeper than the Euclidean slope but still consistent at the 90% confidence level. Therefore, in order to facilitate the comparison, we fix the slope to 1.5. Then it is evident that the NuSTAR number count distribution lies above the BAT counts by about a factor of two. It is evident from Fig. 2 that the same population synthesis model, that successfully describes both the BAT and the Chandra observations, agrees only with the bright end of the NuSTAR logN-logS. This result is further confirmed by recent findings of Zappacosta et al. (2018). Their estimates on the number count distribution of a bright sample ( ) from the NuSTAR Extragalactic Survey program, nicely agree with both our logN-logS and the predictions of our ’standard’ model in the 8-24 keV band.
3. The NuSTAR number count distribution in the soft 3-8 keV band presents a slope , significantly steeper than the Euclidean slope at the 99.5% confidence level. Similarly to the results in the 8-24 keV band, only the brightest part of the NuSTAR soft number count distribution is compatible with the Chandra results and the predictions of our ’standard’ model.
Instead of using the number count distributions, Aird et al. (2015) compared the luminosity function derived in the following bands: Chandra 2-10 keV, NuSTAR 8-24 keV and BAT 14-195 keV. Assuming a reflection fraction of 5% in the 2-10 keV band they find a good agreement between the BAT and the Chandra luminosity function, while NuSTAR is way above the previous two luminosity functions. When they assume a much stronger reflection component of 10%, the NuSTAR 8-24 keV and the Chandra luminosity functions come in agreement. However, this comes at the cost of the BAT luminosity function which remains way below the other two. Using our number count modelling instead, we suggest that this disagreement could be circumvented only by assuming a rather extreme AGN spectral model, with a power-law high energy cut-off of less than 50 keV and at the same time a strong reflection component (reflection fraction greater that 10% in the 2-10 keV band). This is because the increased reflection component significantly enhances the flux in both the 8-24 keV and the 14-195 keV bands, while the low energy cut-off cancels this gain only in the 14-195 keV band. Thus the net result is a considerable increase in the 8-24 keV band. However, even in this case, the major problem remains in the comparison between the NuSTAR 3-8 keV and the Chandra 2-10 keV number count distributions.
Interestingly, this does not appear to be only a problem of the serendipitous survey. The logN-logS in both the COSMOS and the CDFS fields also present an abrupt upturn albeit at different fluxes. The above findings may suggest that a fraction of spurious sources has been included at faint fluxes. However, this is not very likely given the high fraction of soft X-ray detected counterparts of the NuSTAR sources, which does not vary significantly with flux. Alternatively the NuSTAR area curve could be underestimated at faint fluxes i.e. near the centre of the field-of-view where the sensitivity is the highest. As can bee seen from Fig. 2, at the faintest flux bin the area curve in the 8-24 keV band should have been underestimated by a factor of about 2.5 . Finally, the possibility that the Eddington bias plays some role cannot be ruled out. It is unclear however why the Eddington bias affects fluxes a factor of four brighter than the survey’s flux limit, given that the flux errors are moderate i.e. of the order of 10%.
Acknowledgements.
We would like to thank the anonymous referee for many suggestions that helped to improve the paper. We are also grateful to George Lansbury and James Aird for many useful discussions.References
- Aird et al. (2015) Aird, J., Alexander, D. M., Ballantyne, D. R., et al. 2015, ApJ, 815, 66
- Ajello et al. (2012) Ajello, M., Alexander, D. M., Greiner, J., et al. 2012, ApJ, 749, 21
- Akylas et al. (2012) Akylas, A., Georgakakis, A., Georgantopoulos, I., Brightman, M., & Nandra, K. 2012, A&A, 546, A98
- Baumgartner et al. (2013) Baumgartner, W. H., Tueller, J., Markwardt, C. B., et al. 2013, ApJS, 207, 19
- Brandt & Alexander (2015) Brandt, W. N. & Alexander, D. M. 2015, A&A Rev., 23, 1
- Cash (1979) Cash, W. 1979, ApJ, 228, 939
- Churazov et al. (2007) Churazov, E., Sunyaev, R., Revnivtsev, M., et al. 2007, A&A, 467, 529
- Civano et al. (2015) Civano, F., Hickox, R. C., Puccetti, S., et al. 2015, ApJ, 808, 185
- Del Moro et al. (2017) Del Moro, A., Alexander, D. M., Aird, J. A., et al. 2017, ApJ, 849, 57
- Frontera et al. (2007) Frontera, F., Orlandini, M., Landi, R., et al. 2007, ApJ, 666, 86
- Gehrels et al. (2004) Gehrels, N., Chincarini, G., Giommi, P., et al. 2004, ApJ, 611, 1005
- Georgakakis et al. (2008) Georgakakis, A., Nandra, K., Laird, E. S., Aird, J., & Trichas, M. 2008, MNRAS, 388, 1205
- Harrison et al. (2016) Harrison, F. A., Aird, J., Civano, F., et al. 2016, ApJ, 831, 185
- Harrison et al. (2013) Harrison, F. A., Craig, W. W., Christensen, F. E., et al. 2013, ApJ, 770, 103
- Lansbury et al. (2017) Lansbury, G. B., Stern, D., Aird, J., et al. 2017, ApJ, 836, 99
- Luo et al. (2017) Luo, B., Brandt, W. N., Xue, Y. Q., et al. 2017, ApJS, 228, 2
- Magdziarz & Zdziarski (1995) Magdziarz, P. & Zdziarski, A. A. 1995, MNRAS, 273, 837
- Malizia et al. (2014) Malizia, A., Molina, M., Bassani, L., et al. 2014, ApJ, 782, L25
- Malizia et al. (2009) Malizia, A., Stephen, J. B., Bassani, L., et al. 2009, MNRAS, 399, 944
- Mullaney et al. (2015) Mullaney, J. R., Del-Moro, A., Aird, J., et al. 2015, ApJ, 808, 185
- Oh et al. (2018) Oh, K., Koss, M., Markwardt, C. B., et al. 2018, ApJS, 235, 4
- Press et al. (2007) Press, W. H., Teukolsky, S. A., Vetterling, W. T., & Flannery, B. F. 2007, Numerical Recipes: The Art of Scientific Computing, Third Edition (Cambridge University Press)
- Revnivtsev et al. (2003) Revnivtsev, M., Gilfanov, M., Sunyaev, R., Jahoda, K., & Markwardt, C. 2003, A&A, 411, 329
- Ricci et al. (2017) Ricci, C., Trakhtenbrot, B., Koss, M. J., et al. 2017, ApJS, 233, 17
- Tortosa et al. (2018) Tortosa, A., Bianchi, S., Marinucci, A., Matt, G., & Petrucci, P. O. 2018, A&A, 614, A37
- Tueller et al. (2008) Tueller, J., Mushotzky, R. F., Barthelmy, S., et al. 2008, ApJ, 681, 113
- Ueda et al. (2014) Ueda, Y., Akiyama, M., Hasinger, G., Miyaji, T., & Watson, M. G. 2014, ApJ, 786, 104
- Vasudevan et al. (2013) Vasudevan, R. V., Mushotzky, R. F., & Gandhi, P. 2013, ApJ, 770, L37
- Zappacosta et al. (2018) Zappacosta, L., Comastri, A., Civano, F., et al. 2018, ApJ, 854, 33