Partly burnt runaway stellar remnants from peculiar thermonuclear supernovae
Abstract
We report the discovery of three stars that, along with the prototype LP 40365, form a distinct class of chemically peculiar runaway stars that are the survivors of thermonuclear explosions. Spectroscopy of the four confirmed LP 40365 stars finds ONe-dominated atmospheres enriched with remarkably similar amounts of nuclear ashes of partial O- and Si-burning. Kinematic evidence is consistent with ejection from a binary supernova progenitor; at least two stars have rest-frame velocities indicating they are unbound to the Galaxy. With masses and radii ranging between 0.20–0.28 M☉ and 0.16–0.60 R☉, respectively, we speculate these inflated white dwarfs are the partly burnt remnants of either peculiar Type Iax or electron-capture supernovae. Adopting supernova rates from the literature, we estimate that 20 LP 40365 stars brighter than mag should be detectable within 2 kpc from the Sun at the end of the Gaia mission. We suggest that as they cool, these stars will evolve in their spectroscopic appearance, and eventually become peculiar O-rich white dwarfs. Finally, we stress that the discovery of new LP 40365 stars will be useful to further constrain their evolution, supplying key boundary conditions to the modelling of explosion mechanisms, supernova rates, and nucleosynthetic yields of peculiar thermonuclear explosions.
keywords:
star: individual: LP 40365 — supernova: general — white dwarfs — subdwarfs — Galaxy: kinematics and dynamics1 Introduction
LP 40365 (GD 492; Luyten, 1970; Giclas et al., 1970) is a high-velocity star unbound to the Galaxy with a unique composition: it has an O/Ne-dominated atmosphere sprinkled with the ashes of incomplete O- and Si-burning (Vennes et al., 2017). These authors have proposed LP 40365 as a partially burnt runaway white dwarf that survived disruption by a thermonuclear supernova, specifically a peculiar group that is suggested to experience pure deflagrations, leading to subluminous explosions that do not completely disrupt the white dwarf accretors (SN 2002cx-like, or SNe Iax; Li et al., 2003; Phillips et al., 2007; Jordan et al., 2012; Foley et al., 2013; Kromer et al., 2013, 2015; Fink et al., 2014; Jha, 2017). In Raddi et al. (2018b), hereafter Paper I, we presented supportive evidence for the formation of LP 40365 in a single-degenerate thermonuclear supernova by measuring a super-solar Mn abundance that is compatible with theoretical nucleosynthesis yields of near-Chandrasekhar-mass (MCh) explosions (Seitenzahl et al., 2013; Seitenzahl & Townsley, 2017), and it is also in agreement with the hypothesis of LP 40365 as SN Iax survivor (Vennes et al., 2017).
In Raddi et al. (2018a), hereafter Paper II, we used the precise parallax available in the Second Gaia Data Release (Gaia DR2; Gaia Collaboration et al., 2018) to estimate the radius of LP 40365 to be R☉, i.e. one order of magnitude larger than canonical white dwarf radii (Tremblay et al., 2017). We interpreted this finding with the star being currently inflated as a consequence of the supernova explosion (Jordan et al., 2012; Kromer et al., 2013; Shen & Schwab, 2017). The scenario of a post-explosion expansion is compatible with the low rotational velocity of the star ( km s-1; Vennes et al., 2017, Paper I). Studying the kinematics of LP 40365, we demonstrated it is gravitationally unbound from the Milky Way (see also Vennes et al., 2017), having a rest frame velocity of km s-1 that is about 1.5 times larger than the escape velocity at the corresponding Galactocentric radius. Considering that LP 40365 has benefitted from the Galactic rotation, we estimated it gained an ejection velocity of km s-1 at the moment of the supernova explosion. In the single-degenerate scenario, considering negligible contribution from asymmetric mass loss, this velocity could be achievable via the ejection from a compact binary ( hr orbital period), e.g. with a massive He-burning companion (Wang & Han, 2009; Wang et al., 2013).
Among many exciting discoveries, Gaia DR2 has led to another possible breakthrough in the field of thermonuclear supernova research with the identification of three new hyper-runaways with km s-1 (Shen et al., 2018b). These stars form a new, relatively homogeneous spectral class of subluminous, CO-rich objects likely connected to the explosion mechanism of supernovae Type Ia (SN Ia) that is known as dynamically driven double-degenerate double-detonation scenario (D6; Shen et al., 2018a).
LP 40365 is interpreted as the formerly accreting white dwarf in a single-degenerate mass-transferring binary (Vennes et al., 2017), also referred to as the bound remnant. On the other hand, the D6 stars are interpreted as the former compact donors in close, double-degenerate binaries. Also the D6 stars are suggested to have reached their rest-frame velocities by conserving their high orbital velocities at the moment of explosion. Like LP 40365, the D6 stars are currently thermally bloated; however, their expansion might be caused by the pre-explosion tidal forces and the interaction with the supernova ejecta (Shen & Schwab, 2017). Prior to Gaia DR2, a hyper-runaway He-rich subdwarf star, US 708 (Hirsch et al., 2005; Heber, 2016), was proposed as the fastest known star that may have been the former subdwarf donor in a thermonuclear supernova event (Justham et al., 2009; Geier et al., 2015). Following the identification of the D6 stars, Shen et al. (2018b) have suggested a connection with US 708, which they proposed as representative for a possible later stage on the way back towards the canonical white dwarf cooling sequence. All together, LP 40365, the D6 stars, and US 708 likely represent the first direct evidence of a wider class of binary progenitors for thermonuclear supernovae (Wang & Han, 2012; Maoz et al., 2014).
We have performed spectroscopic follow-up of candidate high-velocity stars, which we selected by mining Gaia DR2. Our search has successfully led to the identification of two additional stars that, along with LP 40365, we propose to form a distinct class of partly burnt, post-supernova runaway stars (hereafter, “LP 40365 stars"). Furthermore, by mining the Sloan Digital Sky Survey (SDSS) spectroscopic database (Smee et al., 2013; Abolfathi et al., 2018), we have identified two related objects: one is very likely also an LP 40365 star, while the other requires further follow-up observations.
In this manuscript, we present follow-up observations of the Gaia candidates, and the identification of the SDSS candidates. In Section 3, we detail the spectral analysis111The spectra analysed here are made available at the Open Fast Star Catalogue (https://faststars.space/), which is currently maintained by Douglas Boubert and James Guillochon. of the LP 40365 stars identified with Gaia, and we re-analyse LP 40365 itself including new Hubble Space Telescope (HST) near-ultraviolet (NUV) spectroscopy. We present the Galactic orbits of the new LP 40365 stars in Section 4. In Section 5, we discuss our results in a broader context, focusing on: i) the chemical composition, compared to theoretical simulations of white dwarfs that are predicted to survive peculiar thermonuclear explosions; ii) physical parameters (mass and radius); iii) evolutionary status, drawing a comparison with theoretical predictions; and iv) kinematics, birth places and binary progenitors. Finally, in Section 5.2, we model a population of LP 40365 stars to estimate the end-of-mission detection limits of Gaia within 2 kpc from the Sun, deriving the distribution of astrometric parameters. In our conclusions, we summarise the remarkable similarities among the observed stars.
2 Observations
2.1 Gaia DR2 selection
| Parameters | Symbols | J16036613 | J18253757 |
|---|---|---|---|
| Designation | Gaia DR2 5822236741381879040 | Gaia DR2 6727110900983876096 | |
| Right Ascension [hms] | 16:03:04.06 | 18:25:22.15 | |
| Declination [dms] | 66:13:26.9 | 37:57:26.1 | |
| Galactic longitude [deg] | |||
| Galactic latitude [deg] | |||
| Parallax [mas] | |||
| Proper motions [mas yr-1] | |||
| Fluxes [mag] | |||
| NUV | |||
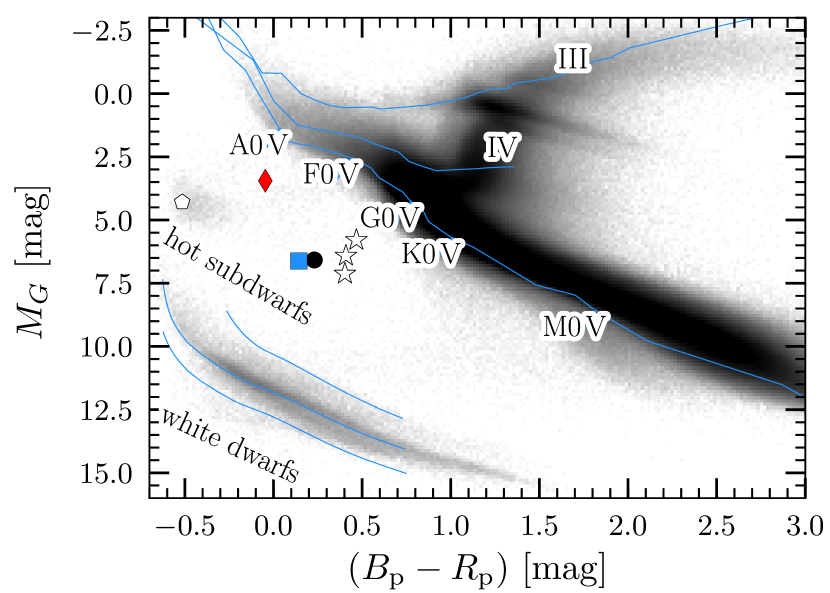
We searched for high-velocity-star candidates by selecting Gaia objects having relatively large transverse velocities ( km s-1) and falling within the extended colour space below the main sequence in the Gaia colour-magnitude Hertzsprung-Russell (HR) diagram (Fig. 1) that is occupied both by LP 40365 and the D6 stars, i.e. delimited by Gaia colours of and absolute magnitudes of . Limiting the parallax precision to , our criteria included LP 40365 and D–2, but excluded the two other D6 stars. The spectroscopic follow-up has led to the identification of several canonical hot subdwarfs and white dwarfs, which we will present elsewhere. Two stars stood out – Gaia DR2 5822236741381879040 and Gaia DR2 6727110900983876096 (hereafter shortened to J16036613 and J18253757, respectively, based on their equatorial coordinates) – as possessing peculiar spectra, clearly resembling that of LP 40365 (see Fig. 2). J16036613 was previously unknown, while we previously obtained a low-resolution spectrum of J18253757 (Fig. 2) on the base of which we had classified it as a likely hot subdwarf (Raddi et al., 2017). Follow-up observations are detailed in the next sections, and the journal of observations is listed in Table 2. The Gaia DR2 astrometry and photometry of the new stars are listed in Table 1.
J16036613 has an apparent magnitude that, combined with its parallax mas, corresponds to an absolute magnitude , which is similar to that of LP 40365. This new star is slightly bluer than LP 40365, suggesting it may be hotter. The Gaia colour excess factor might indicate some problems with the photometry, given that the star is observed in a relatively crowded field. We note an interstellar extinction in the -band – (Schlegel et al., 1998; Schlafly & Finkbeiner, 2011), i.e. about four times larger than the that along the LP 40365 sightline.
J18253757 is located closer to the Sun, having a parallax of mas. It is intrinsically bluer and about 3 mag brighter than LP 40365 and J16036613, implying it is both hotter and larger than the other two stars. The total interstellar extinction is comparable to that of J16036613.
| Mode | Instrument | LP 40365 | J16036613 | J18253757 |
|---|---|---|---|---|
| Spectroscopy | SOAR/Goodman | 2018 May 6 | ||
| VLT/X-shooter | 2018 Jul 9 | 2016 Sep 27 | ||
| HST/STIS | 2018 May 21, 25 | |||
| Photometry | SOAR/Goodman | 2018 May 10 | 2018 Jul 8 |
2.2 J16036613
2.2.1 Low-resolution spectroscopy
We first observed J16036613 on 2018 May 6 with the Goodman Spectrograph (Clemens et al., 2004) mounted on the 4.1 m Southern Astrophysical Research (SOAR) telescope at Cerro Pachón in Chile. We obtained 8 300 s consecutive spectra using a 930 line/mm grating with wavelength coverage between Å. We used a slit and bracketed our exposures with a 60 s Fe arc lamp, since no skylines exist in this spectral region for wavelength calibration. With a dispersion of 0.84 Å/pixel our resolution is roughly 2.8 Å.
The spectra were optimally extracted (Horne, 1986) using standard starlink routines (Currie et al., 2014), after applying bias and quartz-lamp flat corrections using the software pamela. We used the software package molly (Marsh, 1989) to wavelength calibrate the spectra, apply a heliocentric correction, and perform a final weighted average of the one-dimensional (1D) spectra, and used the spectrophotometric standard EG 274 for flux calibration. We did not detect any radial velocity shift between the exposures, within the precision of the wavelength calibration, and thus coadded all spectra to obtain a spectrum with a signal-to-noise ratio of per pixel, shown in Fig.2. Noting the striking similarity with LP 40365, we used the strongest lines to estimate the radial velocity with respect to the Sun via cross correlation with our synthetic model of LP 40365, obtaining km s-1 that confirmed J16036613 as a high-velocity star.
2.2.2 Intermediate-resolution spectroscopy
We followed up J16036613 again on 2018 July 9, with the multi-wavelength intermediate-resolution spectrograph X-shooter (Vernet et al., 2011), mounted at the Cassegrain focus of the ESO Very Large Telescope (VLT) UT2 in Cerro Paranál (Chile). We binned the detectors ( in the spatial and dispersion directions, respectively) and we used narrow slits of , , and , in the UVB, VIS, and NIR arms, respectively, taking six exposures in each arm and achieving total exposure times of 7320, 7500, and 7800 s, in order to reduce the impact of cosmic rays and to confirm the absence of radial-velocity variability. The mean seeing was of .
The data were reduced using the standard ESO pipeline Reflex (Freudling et al., 2013), and the molecfit software (Smette et al., 2015; Kausch et al., 2015) was used to remove the telluric absorption of Earth’s atmosphere. Again, we did not observe any significant radial-velocity variation over short timescales, so we coadded the individual exposures to obtain an average spectrum, confirming the same blue-shifted radial velocity. The coadded spectrum has a in the blue/visual spectral range, with resolving power , , and , in the UVB, VIS, and NIR arms, respectively.
2.2.3 Time-series photometry
We performed time-series photometry of J16036613 on the night of 2018 May 10 using the imaging mode of the Goodman spectrograph on SOAR. We used an exposure time of s and had a readout time of s, and observed for hr through a S8612 broad-bandpass, red-cutoff filter (3300–6200 Å). Seeing across the duration of the observation was fairly stable, averaging –.
Images were debiased and flat-fielded using an internal dome lamp. We extracted a light curve using standard circular aperture photometry, with a 4.5-px aperture surrounded by an 8-px annulus. The target light curve was normalised using a bright, nearby comparison star with no close companions, and we subtracted out a second-order polynomial to account for airmass changes. A Lomb-Scargle periodogram showed no significant peaks above per cent amplitude for periods between roughly – s. This lack of variability suggests that J16036613, like LP 40365, is consistent with not-having an unseen close companion.
2.3 J18253757
2.3.1 Intermediate-resolution spectroscopy
In Raddi et al. (2017) we published a low-resolution spectrum (8 Å) of J18253757 taken at the New Technology Telescope with the ESO Faint Object Spectrograph and Camera v.2 (NTT/EFOSC2; Buzzoni et al., 1984) at the La Silla observatory (shown in Fig.2). Although we classified this star as a likely hot subdwarf, its spectrum shows numerous unusually strong Mg i-ii lines and other ionised metals. The absence of H and He lines resembles the spectral appearance of LP 40365 and J16036613.
We followed up J18253757 on 2016 September 27 with VLT/X-shooter, taking single exposures of 521, 550, and 600 s in the blue, visual, and near-infrared arms, respectively. The instrument setup and data reduction steps were the same as those adopted for J16036613. The mean seeing during the observations of J18253757 was . The achieved resolving power were 4300, 7400, and 5400, in the UVB, VIS, and NIR, respectively. The extracted spectrum has a in the UVB/VIS arms and in the NIR arm.
2.3.2 Time-series photometry
We also observed J18253757 through a Bessel-V filter on the night of 2018 July 08 with the imaging mode of the Goodman spectrograph on SOAR. We collected s exposures, and each exposure had roughly 2.0 s of dead time from readout. Seeing was steady from –. As with J16036613 we bias- and flat-field corrected the photometry and extracted the light curve using a fixed 5.5 px circular aperture, and subtracted a second-order polynomial to account for airmass changes throughout the 2.2 hr run. We did not see any coherent variability at any period from - s, to a limit of at least 0.1 per cent amplitude, consistent with it currently being an isolated star.
2.4 LP 40365
2.4.1 HST spectroscopy
We observed LP 40365 with HST using the Space Telescope Imaging Spectrograph (STIS; Woodgate et al., 1998) on 2018 May 21 and 25, during Cycle 25, for three and two orbits, respectively. The total exposure time amounted to 15 253 s. We used the G230L grating and the NUV Multianode Microchannel Array (MAMA) detector with a aperture, which delivers a resolving power across the 1570–3180 Å wavelength range. We applied the wavelength and flux calibration via standard iraf calstis tasks (Katsanis & McGrath, 1998). We measured an average S/N from the reduced spectrum.
2.5 SDSS spectra
We also considered the possibility that similar stars may reside within the 4.9 million spectra of the SDSS database (Abolfathi et al., 2018), which could have been previously misclassified due to their unusual spectral features.
We adapted the template method of Hollands et al. (2017), which essentially fits all SDSS spectra against a library of spectral templates. We created a grid of synthetic LP 40365 spectra, i.e. with ranging from 5000 to 7000 K in steps of 500 K, and then up to 20 000 K in steps of 1000 K. In all cases the was fixed at 5 dex, and the abundances fixed to the average of the already identified stars (as justified by the results presented in Section 3). For each model, additional spectral templates were offset by fixed radial-velocity shifts ranging from to km s-1, in steps of 50 km s-1, resulting in a total of 1098 templates. Finally, we convolved each template with a Gaussian to match the SDSS spectral resolution of 2.7 Å. To filter other easily identifiable spectral types, we complemented the grid of LP 40365 templates with 1843 white dwarf templates (spectral classes DA, DB, DZ), and 1045 stellar templates of spectral types commonly observed by SDSS (see description in Hollands et al. 2017). For each SDSS spectrum, we interpolated all templates onto the SDSS wavelength scale, flux-scaled them to the data, and then evaluated their , adopting the template with the lowest as the best match. The scaling factor was the only free-parameter, whose optimal value was determined analytically (see eq. 1 in Hollands et al., 2017). The closest-matching template, the corresponding reduced (), and the mean spectral signal-to-noise (S/N) between 4500–6000 Å were recorded for each SDSS spectrum.
Out of the 3.1 million SDSS spectra with a mean , 1544 were best matched by a LP 40365 model. Even so, a closest match did not guarantee a good fit. In Figure 3, we show the of the best-matching templates vs. the SDSS spectrum mean S/N, with the template- indicated by the point-colours. Towards high S/N, the distribution in becomes bimodal. Points in the upper-branch correspond to spectra where all templates provided poor matches, but with one of the LP 40365 templates as the least bad. The lower-branch corresponds to more convincing matches to the templates. Notably, most of the points in the lower branch correspond to high- templates, as their metal-lines become weaker, and thus the number of false-positives increases. The red-dashed line indicates our cut in the -S/N plane. The spectra corresponding to the 349 objects below the cut were visually inspected and compared with their best fitting templates.
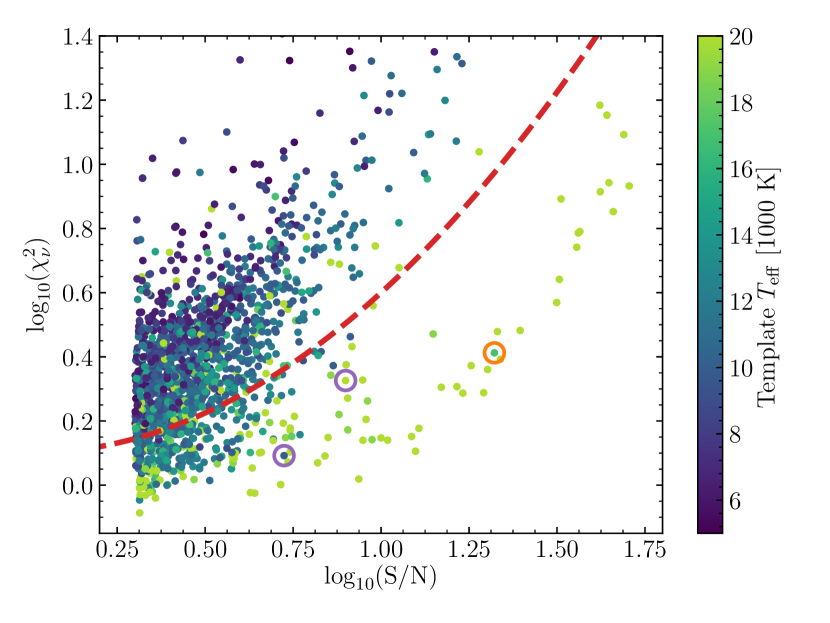
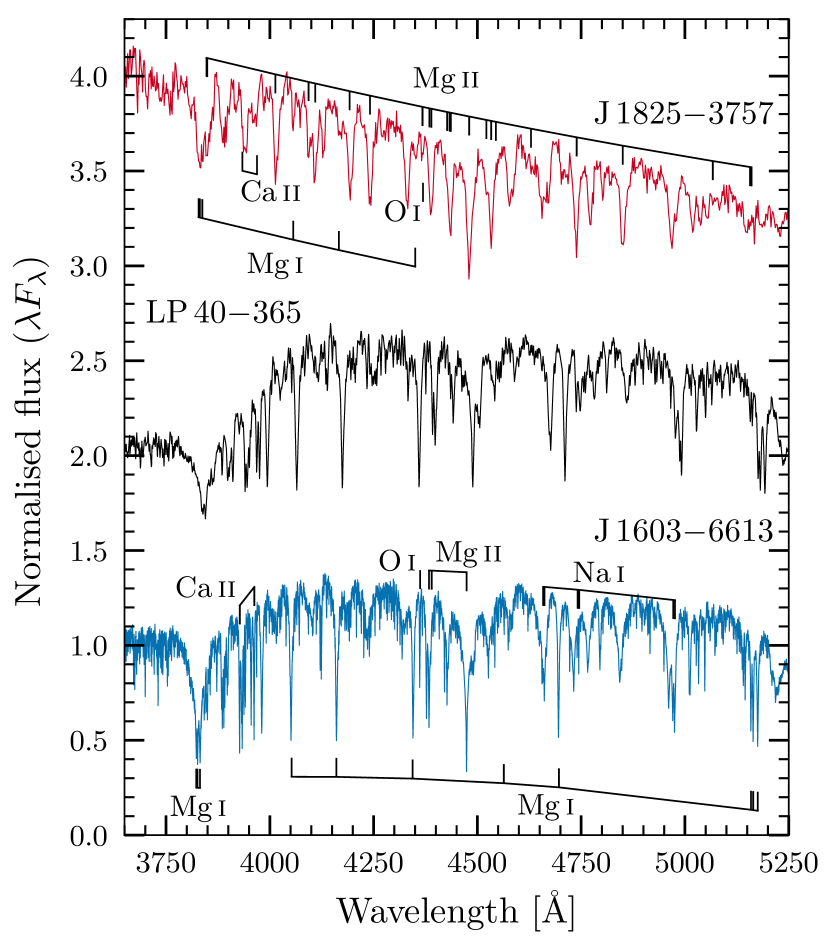
Following this visual inspection, three spectra showed convincing resemblance to their templates. One of these (Fig. 3, circled in orange) is the O-dominated atmosphere white dwarf (DOx), SDSS J124043.00671034.6 (hereafter J1240+6710; Kepler et al., 2016), where matches to Mg, O, and Si lines resulted in a favourable . The other two objects (Figure 3, circled in purple) are SDSS J090535.55251011.3 and SDSS J163712.21363155.9, (hereafter J0905+2510 and J1637+3631 respectively). The spectra of the two SDSS candidates, with their best-matching templates, are shown in Figure 4. Their astrometry and photometry are provided in Table 3.
| Parameter [units] | Symbol | J0905+2510 | J1637+3631 |
|---|---|---|---|
| Gaia Designation | Gaia DR2 688380457507044864 | Gaia DR2 1327920737357113088 | |
| Right Ascension [hms] | 09:05:35.55 | 16:37:12.21 | |
| Declination [dms] | 25:10:11.3 | 36:31:55.9 | |
| Galactic longitude [deg | 201.65 | 58.98 | |
| Galactic latitude [deg] | |||
| Parallax [mas] | |||
| Proper motions1 [mas yr-1] | |||
| Fluxes [mag] | |||
| NUV | |||
| Interstellar reddening [mag] | |||
| Photometric temperature [K] | |||
| Template parameters | [K] | ||
| RV [km s-1] | |||
| 1.24 | 2.12 | ||
| Spectrum S/N | 5.30 | 7.93 | |
| Plate-MJD-fiber | 2086-53401-0500 | 2185-53532-0360 | |
| Notes: 1The proper motions of J0905+2510 are taken from the Pan-STARRS–SDSS cross-match (Tian et al., 2017). | |||
2.5.1 J0905+2510
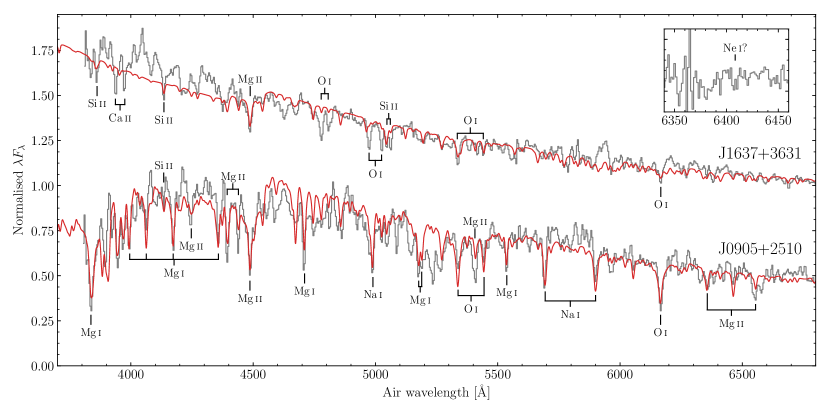
With a mean S/N of 5.3, a cursory inspection of the SDSS spectrum of J0905+2510 simply appears as a noisy blackbody. However, degrading the resolution to 8 Å (Figure 4, bottom) reveals lines of O i, Na i, Mg i/ii, and Si ii. The close agreement between the strong lines in the data and best-matching template indicates that this star also belongs to the class of “LP 40365 stars.” We also note some discrepancy near 5230 Å, corresponding to a feature, currently not accounted for by the models, that is also observed in LP 40365 as well as in J16036613 and LP 40365 which Vennes et al. (2017) attributed to a resonance in the photoionisation cross-section of Mg.
J0905+2510 has only a two-parameter astrometric solution (position) within the Gaia DR2 data. With , it is probable that a parallax will be available in a future Gaia data release. Assuming J0905+2510 has an absolute magnitude similar to LP 40365 and J16036613 (6.5 mag), the true distance is likely to be about kpc from the Sun. Given the proper motion of mas yr-1(Tian et al., 2017), the implied transverse velocity is about 500 km s-1, which is broadly consistent with the 300 km s-1 radial velocity.
To more accurately measure the , we fitted our LP 40365 model grid to GALEX NUV and SDSS photometry (interpolating amongst models for estimating intermediate to our grid-steps). We accounted for interstellar reddening, mag, (as estimated via the Pan-STARRS 3D dust-maps at a heliocentric distance of at 4 kp; Green et al., 2018), obtaining K. A full abundance analysis and comparison with the other members of this class necessitates higher-quality follow-up spectra.
2.5.2 J1637+3631
This star was first reported as a white dwarf with a C-rich, He-dominated atmosphere (DBQ spectral type) in the SDSS DR7 white dwarf catalogue of Kleinman et al. (2013). However, we neither see evidence for He nor C features. Beyond the general Rayleigh-Jeans slope, the main spectral features matched by the template (Figure 4, top) are the 4129 Å Si ii and 4481 Å Mg ii lines (rest wavelengths), although redshifted by about 300 km s-1. Transitions from O i and Ca ii appear stronger than in the template, indicating somewhat different abundances than assumed for our grid of models. The 6402 Å Ne i line is also tentatively detected in the unsmoothed SDSS spectrum (Figure 4, inset).
For J1637+3631, Gaia DR2 provides a full five-parameter astrometric solution, although rather poorly constrained. With a parallax of mas, we place a 3 lower limit of about 500 pc on the distance. The implied absolute magnitude is . Applying a smooth exponentially decreasing prior that accounts for the stellar density distribution in the Milky Way, Bailer-Jones et al. (2018) have estimated a distance of pc, which implies an intrinsic magnitude of . Both these distance estimates place J1637+3631 within the white dwarf sequence of Figure 1.
Of course J1637+3631 could be much further away and still remain consistent with the Gaia parallax. If we assume J1637+3631 is a LP 40365 star, and conservatively, like LP 40365 itself, has , the implied distance would be about 6 kpc. Given the 67 mas yr-1proper-motion (Table 3), the transverse velocity would be 2000 km s-1 – several times larger than theoretical predictions for SNe Iax survivors (Shen et al., 2018b).
Hence, a more likely explanation is that J1637+3631 could be the second representative of the DOx white dwarf class, after J1240+6710 (Kepler et al., 2016). This hypothesis can be tested with medium-resolution follow-up spectroscopy. One difference we note between these two stars is the intensity of the Ca ii H+K lines: they are plainly visible in the spectrum of J1637+3631, but only an upper-limit of Ca was determined for J1240+6710. Our photometric , determined from fitting GALEX and SDSS photometry ( K, Table 3), is cooler than the K measured by Kepler et al. (2016) for J1240+6710, which could explain the differences in Ca ii strength.
3 Spectral analysis
3.1 J16036613
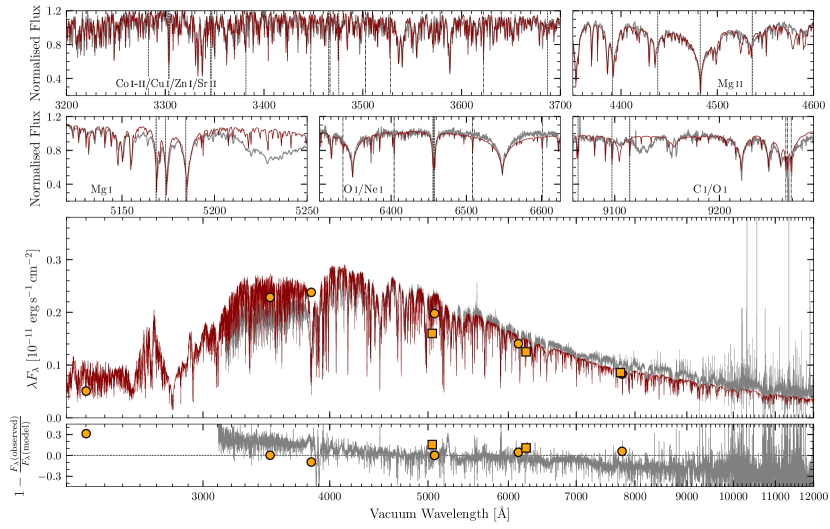
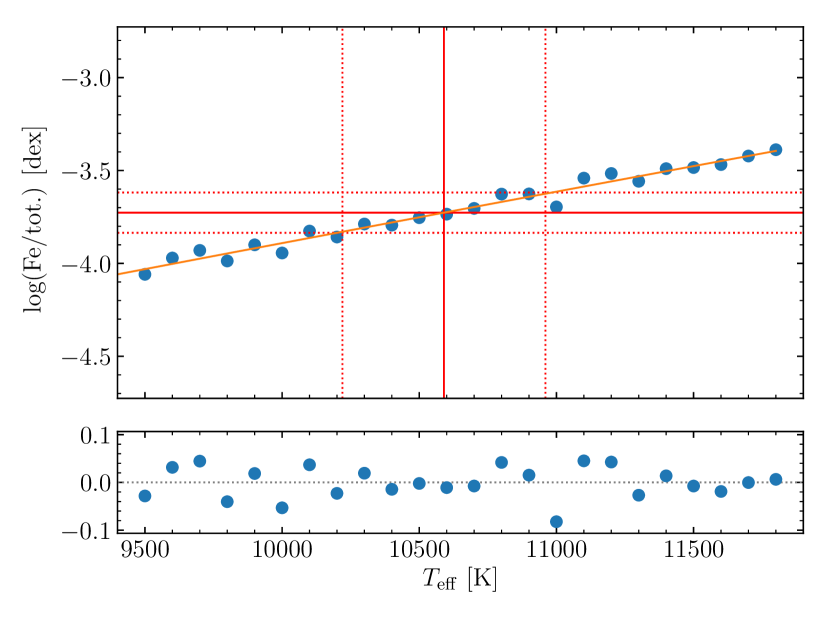
Fig. 2 shows that J16036613 has a spectrum remarkably similar to LP 40365, thus providing a natural starting point for the spectral analysis. Owing to the high S/N and resolution of the X-shooter spectrum, we searched for lines from other elements in addition to those previously identified in LP 40365. We identified new lines from Sc ii, Co i–ii, Zn i, Cu i, and Sr ii. C i lines were also found to be present at optical wavelengths. As with LP 40365, no evidence for H or He were seen, but with more stringent limits from the much higher S/N ratio and K hotter .
We precisely measured the blue-shift of J16036613 by fitting Lorentzian profiles to some of the strong, isolated O i and Mg i lines in the VIS arm of the X-shooter spectrum, obtaining km s-1, which confirms the estimate from the identification spectrum.
As previously noted in Paper I for LP 40365, a hotter clashes with the non-detection of He i absorption at 5877 Å. Given the similarity between the two stars, we reconsidered the feasibility of a ONe-dominated atmosphere, as found by Vennes et al. (2017) for LP 40365. Our model spectra were computed following the methods of Koester (2010), as already done in Paper I. We have made use of the most recent atomic data222The most relevant updates for the current project include new oscillator strengths and broadening constants from the atomic line databases NIST (National Institute of Standards and Technology; Kramida et al. 2019), VALD (Vienna Atomic Line Data; Ryabchikova et al., 2015; Kupka et al., 2000), and Robert Kurucz’s line lists for O i and Mg ii (http://kurucz.harvard.edu/). Also new is the inclusion of the absorption of the negative ions of Ne, O, Na (Liu & Starace, 1999; Liu, 1999; Robinson & Geltman, 1967; John, 1975a, b; John & Williams, 1975; John, 1996).. One important result is that also ONe-atmospheres develop relatively deep convection zones ( Mstar), which extend down to the bottom of the model atmosphere like for He-dominated atmospheres in the same temperature range. Although we could not estimate the size of the mixing zone below the atmosphere, we have estimated the diffusion timescales of the detected elements to be, at least, of the order of 10 Myr (this result will be relevant for the discussion in Section 5.1.2).
We initially approached the spectral analysis by fitting the X-shooter spectra alone. Given that O, Ne, and Mg, are the dominant elements and main contributors to the continuum opacity, their abundances are necessarily related to each other and coupled with . Hence, due to the inherent inaccuracy of flux calibration and the ill-constrained effect of interstellar reddening, the resulting atmospheric fit was strongly degenerate, in a way that adjustments in could be compensated for by changes in abundances, allowing for reasonable agreement with the data over a wide -range. We therefore tried a different approach.
Instead of allowing as a free parameter, we performed multiple least squares fits to the normalised spectra, but at fixed in steps of 100 K in the range 9500 K to 11 800 K. The optimal and abundances varied across the grid steps. We then used this model grid to fit SkyMapper and GALEX photometry (Table 1) with , the interstellar reddening and stellar radius as free parameters, and the Gaia parallax and its error used as a Gaussian prior. While Gaia photometry were also available, their quoted uncertainties do not include systematic errors, which are expected to be significantly larger than this. Thus, we chose to exclude these. The best-fit was achieved by calculating synthetic photometry in each bandpass and minimising the . This resulted in a of K and a radius of R☉. While the full line-of-sight reddening is about , our fit indicated a 99 per cent upper limit of with a mean value of in the posterior distribution, indicating the full line-of-sight extinction to be too high.
To obtain estimates for , abundances, and their errors, we fitted the dependence of the element, , with a 2nd-order polynomial. The standard deviation of the scatter around the polynomial was taken as , and the gradient determined at K. Finally, the uncertainty on was calculated as
| (1) |
where K. We show this graphically for Fe as an example (Fig. 6). We compare the observed spectrum and our best-fit model in Fig. 5. The atmospheric parameters and the element abundances are listed in Table 4.
3.2 J18253757
We confirmed the radial velocity of J18253757, obtaining km s-1 from Lorentzian fits to isolated O i, Mg ii, and Ca ii lines of the X-shooter spectrum.
Once again we searched the spectrum to identify all elements present in the stellar atmosphere. As inferred from the bluer colour, J18253757 is hotter than both LP 40365 and J16036613, and so the ionisation balance for each element is expected to be different. Apart from Cu (the higher does not permit detection of Cu i, and no strong optical lines of Cu ii are expected), all elements found at LP 40365 and J16036613 were re-identified. We note that several other elements populate higher ionisation states than found for the other two stars: Al iii was identified from doublets around 3610 Å and 5710 Å, Si iii from a doublet around 4560 Å, O ii at 4350 Å and 4650 Å, and S ii from a multitude of lines.
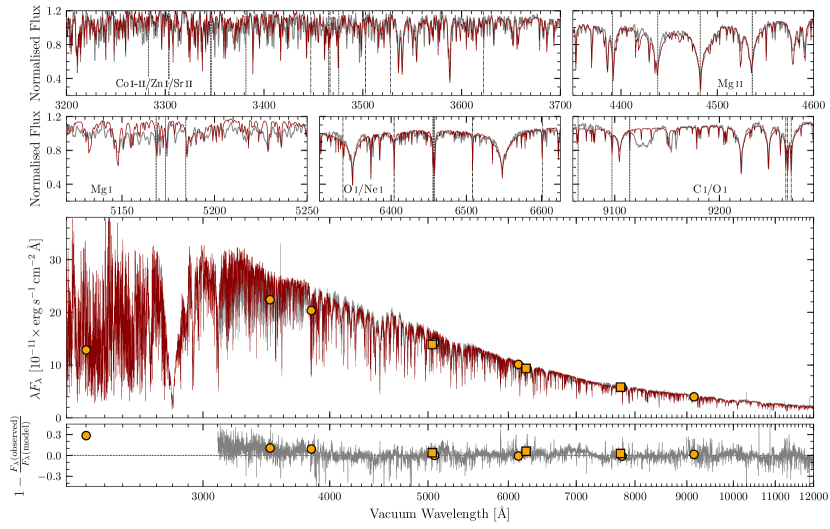
For the spectral analysis, we took a similar approach to that described for J16036613. We built a model grid between – K, in 100 K steps, with the surface gravity and abundances as free parameters. For the photometric fit we made use of the SkyMapper and 2MASS data (Table 1). We excluded GALEX photometry from our fit, because the NUV spectral region is expected to be more heavily line blanketed than found for the optical, and we cannot rule out unaccounted opacity sources, e.g. from elements presently unidentified. Using the Gaia parallax (Table 1) as a prior, we found K, , and .
The values and uncertainties on and abundances were calculated in the same manner as described for J16036613, and are given in Table 4. Note that, because of the higher , the upper-limits for hydrogen and helium are far more constraining than for LP 40365 and J16036613. This strongly affirms the ONe-dominated nature of these stars. We compare the observed spectrum and our best-fit model in Fig. 7.
A major difference in the results of J18253757 vs. LP 40365 and J16036613 is the surface gravity, which is more than one order of magnitude lower. This is not too surprising given the much larger radius we found for the photometric fit, implying the star is more inflated compared to the other two. This is discussed further in Section 5.1.3.
As a final comment, we examine the properties of the updated atomic data that have a more tangible effect in modelling the spectrum of J18253757. While our line list already included many thousands of transitions from the NIST and VALD3 databases, we noticed that the profiles of some of the weakest O i and Mg ii lines were poorly reproduced by our models. In particular, three moderately strong lines at 4014, 4094, and 4110 Å (rest-frame air wavelengths) were absent in our model. From their intensities and large line widths we concluded these are most likely higher members of the Mg ii series transitioning from the closely spaced 4d/f levels (93 311/93 800 cm-1, respectively), as confirmed from wavelengths tabulated by Moore (1959). We found the three missing lines (and some higher members of the series that are less obviously present) in Robert Kurucz’s line archive, which includes not only wavelengths and oscillator strengths, but also Stark, quadratic Stark, and van der Waals broadening constants. This update in our models shows a close agreement with the observed spectrum. However, we note that for the highest series members, the strengths are systematically under-predicted, likely owing to the proximity of the upper-levels to the ionisation limit, adversely affecting their estimated occupation numbers. Nevertheless, the Mg abundance was already precisely constrained by other well-known, stronger Mg II lines. The updated Mg ii lines are generally weaker in the spectra of J16036613 and LP 40365, because of their lower . Hence, their inclusion in the models leads to a minor improvement.
Although most of the strong lines are well determined in the literature, our concluding remark is that, because of their extreme photospheric composition, LP 40365 stars necessitate complete and accurate atomic data even for lines usually considered astrophysically irrelevant.
3.3 LP 40365
| Parameters | LP 40365 | J16036613 | J18253757 |
|---|---|---|---|
| [K] | |||
| [cgs] | |||
| [km s-1] | |||
| H | |||
| He | |||
| C | |||
| O | |||
| Ne | |||
| Na | |||
| Mg | |||
| Al | |||
| Si | |||
| P | |||
| S | |||
| Ca | |||
| Sc | |||
| Ti | |||
| V | |||
| Cr | |||
| Mn | |||
| Fe | |||
| Co | |||
| Ni | |||
| Cu | |||
| Zn | |||
| Sr |
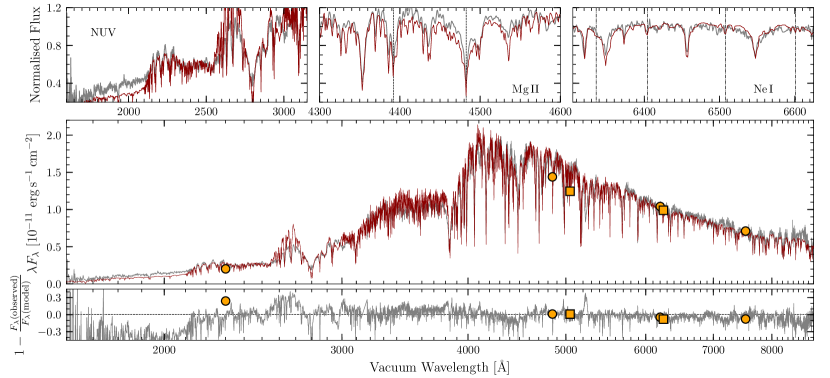
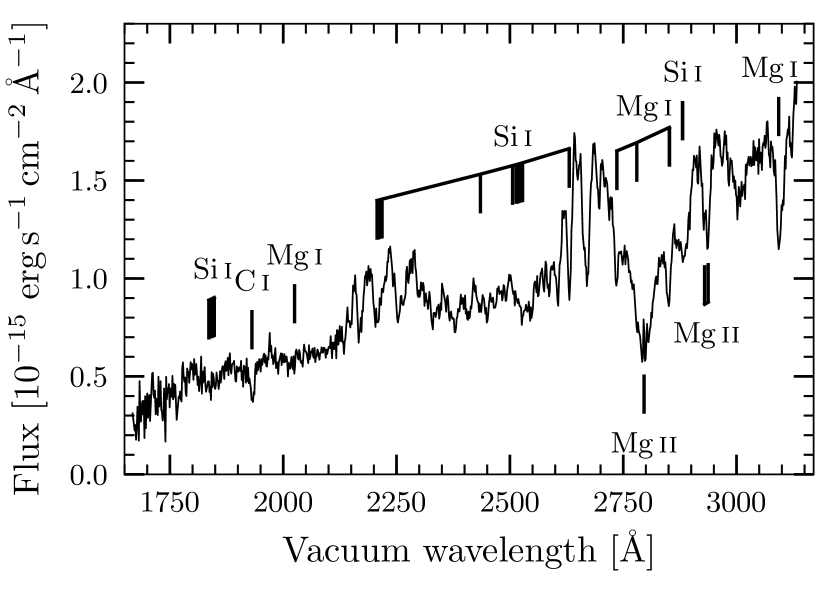
We re-analysed the prototype star, combining our new /STIS spectrum (Fig. 8) with the WHT/ISIS and Asiago 1.82-m Copernico/AFOSC spectra from Paper I. This combined, flux-calibrated spectrum has an average spectral resolution of – Å in the optical and NUV ranges, respectively. The 5350–5700 Å region, which is only covered by the Copernico/AFOSC data, has a 13 Å resolution. We scaled the optical spectrum to the Pan-STARRS magnitude (; Flewelling et al., 2016). Although the /STIS spectrum seamless matches the optical fluxes, we note it is 4 brighter than the GALEX NUV magnitude. The optical spectrum, instead, appears slightly bluer than the published Pan-STARRS and Gaia DR2 photometry, corresponding to a small colour term in the range of , which is comparable to the photometric uncertainties. In joining the spectra together, we transposed the optical region onto a vacuum wavelength scale to match the /STIS data (using the relation given in Morton, 2000). We corrected the combined spectrum for radial velocity shift of LP 40365 ( km s-1), which is confirmed by the redshift of the C i line at 1930 Å and other strong Mg i lines. Finally, we corrected the combined spectrum for the total interstellar reddening of (Schlegel et al., 1998), corresponding to and magnitudes of extinction in the Pan-STARRS and GALEX NUV bands, respectively, as estimated via the Fitzpatrick (1999) standard extinction law. The combined dereddened spectrum is displayed in Fig. 9.
From an initial appraisal of the combined spectrum, the NUV data indicate a hotter temperature with respect to the optical spectrum, for which we inferred K using a He-dominated atmosphere in Paper I. In the previous sections, we have shown the high-quality X-shooter spectra of J16036613 and J18253757 are well matched by synthetic spectra with ONe-dominated atmospheres. Especially from the analysis of J18253757, we have excluded the presence of He with a very stringent limit. Hence, these results favour an ONe-dominated atmosphere also for LP 40365, as found by Vennes et al. (2017).
As we did for J16036613 and J18253757, we built a grid of synthetic models in the – K range, with O, Ne, and Mg as dominating species. In view of the complex nature of the problem, we approached the analysis of LP 40365 by identifying a set of key spectral features to compare against, in order to evaluate the goodness of fit and to evaluate the impact of systematic uncertainties. These are: i) the level of NUV flux; ii) the spectral lines of Ne, O, and Mg; iii) the continuum slope in the optical range; iv) the Mg i jump near 3800 Å; and v) the ionisation equilibrium of Mg i/Mg ii. Because we did not find a solution that satisfies all the above criteria, we have relied more on the flux-calibrated NUV spectrum, obtaining a best-fit synthetic spectrum with K and that is shown in Fig. 9. This model approximately reproduces the NUV flux between 2200–3000 Å, the O i, Ne i, and Mg i lines, and the Mg i jump. The main defect of the synthetic spectrum is that it does not accurately reproduce the ionisation equilibrium of Mg i/Mg ii, over-predicting the intensity of Mg ii lines as shown in the top-centre panel of Fig. 9. In addition, we also note that the residuals between the observed and synthetic spectra, displayed in the lower panel of Fig. 9, suggest that the optical continuum of the synthetic spectrum is slightly too steep, whereas the flux below 2200 Å is per cent too low. As noted in Paper I, models with increasing lower incur in another problem, because they have stronger Ne i lines that overpredict the observed ones.
Based on the strong coupling between O, Ne, and Mg, we estimated a uncertainty of K, beyond which the absorption caused by these elements becomes too strong or too weak. The surface gravity cannot be constrained more precisely than dex, which is compatible with a R⊙ radius, as derived from the Gaia parallax and Pan-STARRS magnitude, and by assuming a plausible mass between – M☉ (a more detailed discussion, with reference to Paper I, is given in Section 5.1.2).
The /STIS observations have enabled a better overview of the composition of LP 40365, clarifying the incompatibility between a He-dominated atmosphere proposed in Paper I and an ONe-dominated atmosphere, as determined by Vennes et al. (2017). This result agrees with the analysis of J16036613 and J18253757. The /STIS data favour a best-fit model with K that is now more compatible with that determined by Vennes et al. (2017). We also note that the dominant elements of our best-fit model are in the ratio of O:Ne:Mg ::, compared to O:Ne:Mg :: determined by Vennes et al. (2017)
The NUV spectrum has allowed us to detect the C i 1930 Å line, enabling us to constrain the abundance of this element. Thus, we have determined abundances for 14 elements (C, O, Ne, Na, Mg, Al, Si, S, Ca, Ti, Cr, Mn, Fe, Ni). The abundances of detected trace elements were measured by iteratively altering them, one by one, and keeping the abundances of the other elements fixed. The mean values and errors are established from the means and standard deviations derived by fitting the strongest lines of each element. We have confirmed a remarkable similarity between element abundances for the three studied LP 40365 stars (more details are given in Section 5.1.1). Finally, accounting for the coupling between and element abundances, we estimated the systematic uncertainties affecting our abundance determinations. On one hand, slightly anti-correlates with , increasing by 0.05 dex for a 350 K decrease in temperature. On the other hand, strongly correlates with , decreasing by dex for a K variation. All the other trace elements follow a similar trend as Mg. This result implies their mutual number abundance ratios are almost unchanged with respect to Fe, although the overall bulk atmospheric composition is affected (see Section 5.1.2).
We have also estimated upper limits on H, He, P, V, Sc, Co, Cu, Zn, and Sr. We note that Sc, Co, Zn, and Sr are detected in J16036613 and J18253757, and Cu is detected in J16036613. The abundances with uncertainties or upper limits are listed in Table 4.
To conclude, as discussed in the previous sections and in Paper I, it is likely that important physics may be still missing from our models. In addition to the already mentioned atomic line data, we note the lack of absorption coefficients for the bound-free and free-free contribution of Mg-, Al-, and Si- ions could also explain unidentified spectral features.
4 Kinematic analysis
Following the procedure described in Paper II for LP 40365, we used Gaia DR2 astrometry and to trace, in a probabilistic fashion, the motion of J16036613 and J18253757 within the Milky Way potential. Using the python package for galactic dynamics, galpy (Bovy, 2015), we modelled the Milky Way’s potential with the standard module MWPotential2014, which includes a power-law density profile with exponential cut-off for the bulge, a Miyamoto-Nagai disc, and a dark matter halo (see details in Bovy &
Rix, 2013; Bovy, 2015).
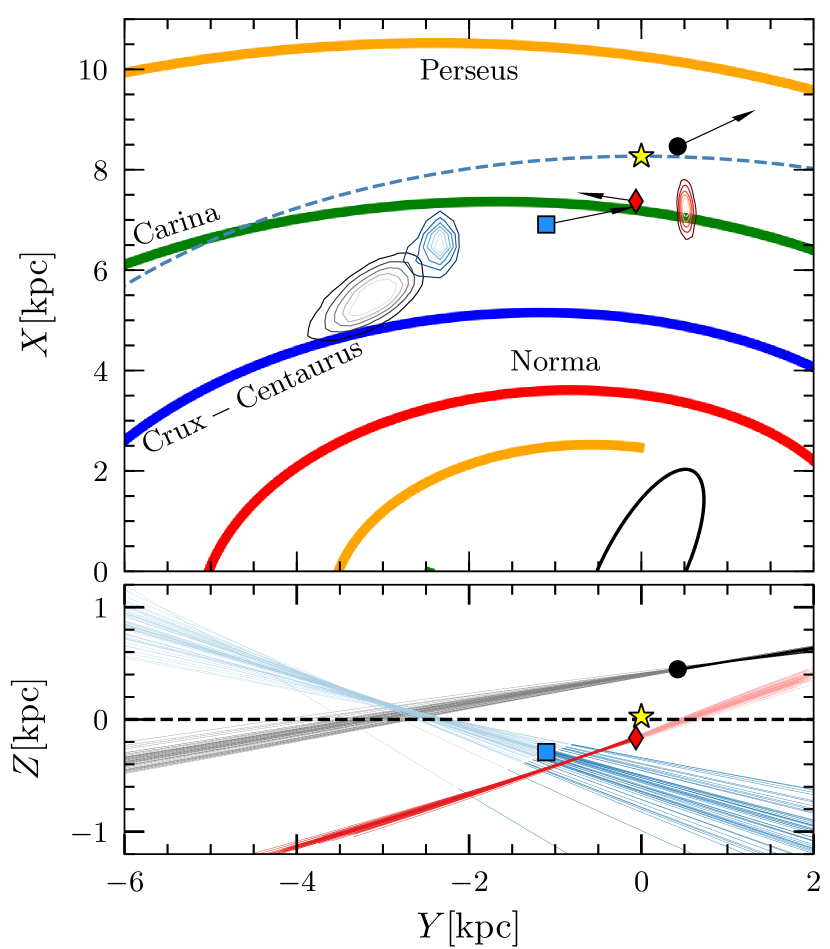
We imposed a Galactic disc rotation of km s-1, with the Sun located at kpc (Schönrich, 2012), accounting for a one-to-one correlation between and , and a peculiar motion as determined by Schönrich et al. (2010). We sampled 10 000 boundary conditions with a Monte Carlo method, by assuming Gaussian distributions for the Galactic parameters, the radial velocities, and the astrometric parameters of the two stars. For the latter we took into account the full covariance matrix as delivered in Gaia DR2. The orbital parameters of J18253757 and J16036613 are summarised in Table 5, where we also list those of LP 40365 for comparison.
Given the lack of or the low precision of Gaia parallaxes for the two SDSS stars, J0905+2510 and J1637+3631, we did not compute their detailed orbits. Nevertheless, we note that the radial and transverse velocities of J0905+2510, which we suggest to be another LP 40365 star (see Section 2.5 for details), deliver a rest-frame velocity of km s-1, making it likely unbound from the Milky Way.
4.1 The unbound trajectory of J16036613
Although the parallax of J16036613 is less precise than that of LP 40365, we can confirm it as unbound from the Milky Way with a rest frame velocity of km s-1, exceeding the escape velocity of km s-1 estimated with MWPotential2014 at the corresponding Galactocentric radius of kpc (cf with – km s-1 in the Solar neighbourhood; Piffl
et al., 2014; Williams et al., 2017). We show the Galactic trajectories of the three LP 40365 stars with precise Gaia parallaxes in Fig. 10. J16036613 is escaping from the Milky Way in the southern Galactic hemisphere, while LP 40365 is departing from the disc at positive latitudes. J16036613 has not yet reached its closest approach to the Sun; its spectrum is blue-shifted. Both stars move along the direction of the Galactic rotation, diverging from the tangential vectors by –26 deg on average. They also have grazing trajectories with respect to the plane ( and deg for LP 40365 and J16036613, respectively), which imply a significant contribution of the Galactic rotation to the rest-frame velocity.
| Parameters | Symbols | LP 40365 | J16036613 | J18253757 |
|---|---|---|---|---|
| Distance [kpc] | ||||
| Galactocentric radius [kpc] | ||||
| Elevation [kpc] | ||||
| Rest frame velocity [km s-1] | ||||
| Eccentricity | 1 | 1 | ||
| Vertical component of angular moment [kpc km s-1] | ||||
| Maximum elevation [kpc] | ||||
| Pericentre [kpc] | ||||
| Apocentre [kpc] | ||||
| Azimutal period [Myr] | ||||
| Escape probability [%] | 100 | 100 | <10 | |
| Flight time from plane crossing [Myr] | ||||
| Galactocentric radius at plane crossing [kpc] | ||||
| Distance at plane crossing [kpc] |
We note that the two unbound stars may have crossed the Galactic plane at mutually close locations, as displayed in Fig. 10, although with different flight times from the plane, . We computed the mutual separations between the past trajectories of LP 40365 and J16036613 as a function of time, finding that the minimum separation of 1 kpc might have occurred 1 Myr ago. The orbit integration confirms that their similar spectral appearance is a characteristic of the formation channel and its not related to a specific event that produced both stars at the same time.
4.2 J18253757 is on a Milky Way bound orbit
Combining the Gaia parallax and proper motions with the radial velocity of J18253757, we estimate a rest frame velocity of km s-1, which is slower than km s-1 estimated at kpc. This implies that J18253757 is currently gravitationally bound to the Milky Way. For this star, we followed the orbit evolution up to 10 Gyr from now, in order to estimate the average eccentricity (), the pericentre and apocentre, the azimuthal period, and the escape probability, which we estimate as the fraction of orbits reaching kpc. These and other relevant kinematic parameters are listed in Table 5.
We note that J18253757 is relatively close to the pericentre of the predicted orbits, and it is moving towards low Galactic coordinates, i.e. negative . It goes around the Milky Way once every Myr, moving on an eccentric (), halo-like orbit against Galactic rotation. If J18253757 had previously crossed the Galactic plane, it would have occurred Myr ago. Its relatively large but negative vertical component of the angular moment, kpc km s-1, is consistent with its orbit being rather flat ( kpc). We also note that the simulated orbits reach quite large large Galactic radii (apocentre at kpc). A small fraction of our simulated orbits ( per cent) imply a possible escape of J18253757 from the Milky Way in the next 10 Gyr.
5 Discussion
The evidence presented so far demonstrates that LP 40365, J16036613, J18253757, and likely J0905+2510, have unique – but mutually similar – spectral characteristics and peculiar kinematics, which make them clearly distinct from other classes of stars. Our new observations strongly support the interpretation that the new stars, like LP 40365, are the partly burnt white dwarf accretors that survived disruption from a thermonuclear supernova in a single-degenerate scenario (possibly a SNe Iax, as initially advanced by Vennes et al., 2017, and further reiterated in our \al@raddi18a,raddi18b; \al@raddi18a,raddi18b). In the following sections, we will discuss the properties that identify these stars as members of what appears to be a class of “LP 40365 stars.” We will focus on the three stars with precise Gaia parallaxes for which we performed a detailed spectral analysis, but our conclusions can be extended to J0905+2510, which just awaits Gaia to measure its parallax and proper-motions as well as a higher-quality spectrum for a detailed abundance analysis.
5.1 Physical properties
5.1.1 Atmospheric composition
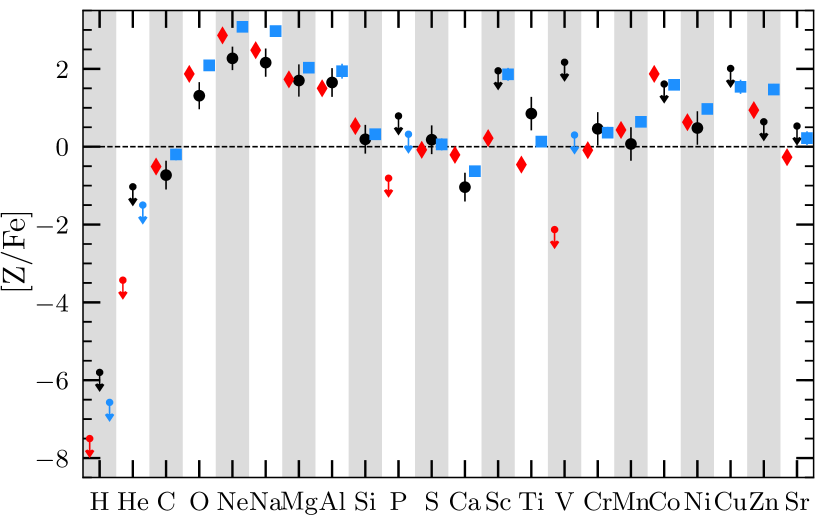
The comparison among the atmospheric composition of the three LP 40365 stars is displayed in Fig. 11, where we plot the number abundance and the upper limits of each detected element, Z, as , where the Solar reference abundances are derived from Asplund et al. (2009).
The remarkable similarity in the average abundance pattern of LP 40365 stars is confirmed by a typical dispersion in abundance of order 0.25 dex, which is of the order of the uncertainties, for most of the detected elements. We especially note the characteristic enhancement and moderately super-Solar abundances of the iron-peak elements Cr, Mn, and Ni. One element that is detected in both J16036613 and J18253757, Sc, shows the largest mutual scatter ( dex). Co and Zn, also detected in J16036613 and J18253757, have the largest super-Solar abundances among the iron-group elements. Cu was marginally detected in J16036613, also with a super-Solar abundance. As noted in Section 3.3, the systematic uncertainties, which we estimated from the analysis of LP 40365, affect the absolute scaling of trace metals, although they preserve the relative [Z/Fe]. The major effect is seen for O, Ne, and Mg, which are the bulk atmospheric constituents (see next section).
Our revised analysis of LP 40365 with respect to Paper I now indicates an abundance, , that is closer to the Solar reference. Although the uncertainties on the abundances of LP 40365 are relatively larger than those estimated for the other two stars (cf Section 3), it appears as the least Mn-rich of the three, with J16036613 and J18253757 having [Mn/Fe] = 0.43 and 0.63 dex, respectively. Given the super-Solar trend, we confirm the evidence in favour of Mn-enhancement for this group of stars. Three other elements, Cr-, Co- and Ni-to-Fe confirm a similar Super-solar trend, which strengthen the suggested connection with near-MCh thermonuclear explosions (Paper I). The nucleosynthesis of these elements is known to be enhanced by electron capture that is thought to occur when the conditions for nuclear statistical equilibrium are reached at the high central densities of near-MCh explosions ( g cm-3), which are expected to occur through mass-accretion from a non-degenerate companion, and not by exploding a sub-MCh white dwarf merger of M⊙ (Iwamoto et al., 1999; Seitenzahl et al., 2013).
Super-Solar detections of Cu and Zn also agree with the observations of normal stars, for which the abundance pattern of these elements is proposed to need a significant contribution from thermonuclear supernovae that previously enriched the interstellar medium with their nucleosyntheis yields (Matteucci et al., 1993). The close-to-Solar detection of the -nucleus, Sr, in J16036613 and J18253757 is also interesting, as this heavier element is expected to undergo significant production in the external layers of white dwarfs during thermonuclear explosions (Travaglio et al., 2011). Finally, we also note that ratios of iron-peak elements (e.g. Mn-to-Fe, Ni-to-Fe, and Mn-to-Cr mass fractions) deserve further investigation, as they could be age-estimators for the progenitors of LP 40365 stars (e.g. via element-ratio vs metallicity relations like those employed for the characterisation of supernova nebular remnants; Badenes et al., 2008; Yamaguchi et al., 2015).
5.1.2 Comparison with theoretical yields
In Paper I, we suggested that LP 40365 was unlikely to be the donor star in a binary supernova because its atmospheric composition, enriched with and iron-peak elements, is incompatible with the pollution from nucleosynthesis yields of both thermonuclear and core-collapse supernovae. Considering the scenario proposed by Vennes et al. (2017), in which LP 40365 could be the surviving white dwarf from a SN Iax explosion, in Paper I we compared its atmospheric composition to the bulk composition of theoretical “bound remnants” that form in three-dimensional hydrodynamic simulations of pure deflagrations of CO white dwarfs, which were performed by Kromer et al. (2013) and Fink et al. (2014) to reproduce the observed light curves and spectra of SNe Iax.
Although the abundance pattern of LP 40365 followed the general trend of nuclear yields computed by Fink et al. (2014), we noted two major conflicts with the predicted bulk-composition of bound remnants, concerning the He-dominated atmosphere and the non-detection of C (the latter was also previously noted by Vennes et al., 2017). Thanks to a more detailed analysis of LP 40365 with the inclusion of HST/STIS observations and the analysis of J18253757 and J16036613 (Section 3), we have now solved the first issue by discarding the He-dominated atmosphere.
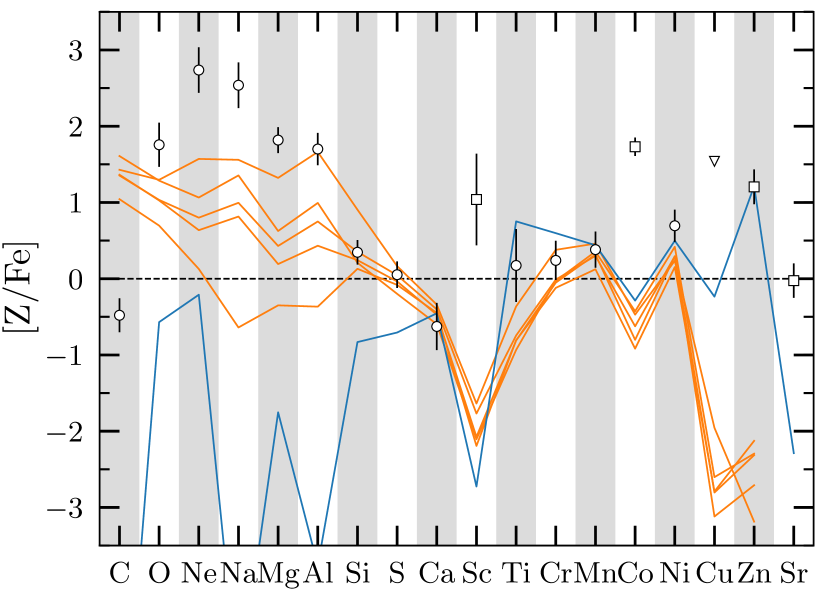
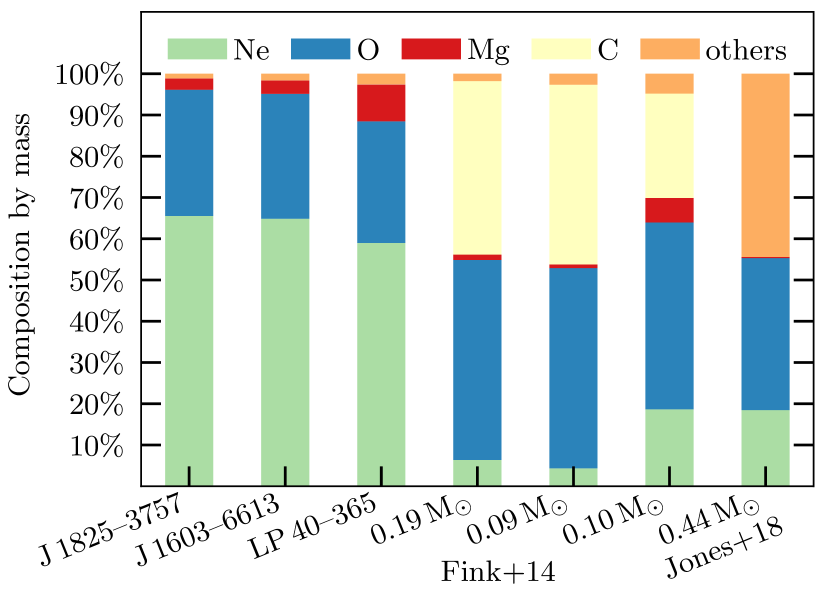
Given the similar abundance pattern of the three LP 40365 stars, in Fig. 12, we compare their average composition to those of bound remnants computed by Fink et al. (2014). The simulations performed by these authors account for a range of internal densities of white dwarfs and explosion intensities, which lead to a wide variety of light curves and bound remnant masses (i.e. weak explosions produce the most massive remnants and vice versa). Although the pure-deflagration models that form low-mass bound remnants were disfavoured by Fink et al. (2014), because their high energy output does not reproduce the observed SN Iax light curves and spectra, we find them to deliver the best match to the average composition of the LP 40365 stars (Fig. 12). The best match is obtained by a M☉ bound remnant, which corresponds to a progenitor with the highest central density ( g cm-3). However, we note that the observed abundances of the main atmospheric constituents (i.e. O, Ne, Mg) still exceed theoretical predictions by 0.5–1.5 dex. In contrast, C is at least dex less abundant than the theoretical curves. The number abundances of trace elements, excluding Sc, Co, Cu, and Zn, are roughly within of the locus defined by bound-remnant models.
Stressing once more the remarkably similar atmospheric composition of the three LP 40365 stars, we suggest that convection, which is predicted by our models, could play an important role. We expect the depth of convection zones of LP 40365 stars to be physically comparable to those of a He-dominated atmospheres of similar , and we estimated the diffusion timescales of the detected elements to be at least 10 Myr. Hence, we speculate that if SN-Iax bound remnant models realistically matched the abundance of Si-burning nucleosynthesis yields detected in LP 40365 stars, either most of the left-over C might have not settled in the bound remnant or C-burning should be more intense. This interpretation requires testing via hydrodynamical calculations, which cannot currently resolve the structure of bound remnants and the expansion of supernova ejecta at the same time (Kromer et al., 2013).
An alternative scenario proposed by Vennes et al. (2017) might also find a compromise between low C and high O, Ne, and Mg, abundances, in case the progenitors of LP 40365 stars were hybrid CONe white dwarfs. While the existence of hybrid CONe white dwarfts is still debated (Denissenkov et al., 2013; Denissenkov et al., 2015; Brooks et al., 2017a), one-dimensional computations performed by Bravo et al. (2016) showed that thermonuclear explosions of such stars could also form low-mass bound remnants that might represent LP 40365 stars. However, we also note that three-dimensional hydrodynamic simulations of pure deflagrations of hybrid CONe white dwarfs suggest that bound remnants would be typically more massive ( M☉; Kromer et al., 2015), in contrast with our observations (see next section).
In addition to the comparison with bound remnants from CO white dwarf explosions, we have considered the recent results obtained by Jones et al. (2016); Jones et al. (2019) for the explosion of mass-accreting ONe white dwarfs in binary systems. While these binaries are more frequently argued to form neutron stars via the accretion-induced collapse (Schwab et al., 2015; Brooks et al., 2017b; Schwab & Rocha, 2019), three-dimensional pure-deflagration simulations performed by Jones et al. (2016); Jones et al. (2019) have shown that the nuclear burning of O and Ne could lift the electron degeneracy and explode the star, leading to what is defined as a thermonuclear electron-capture supernova (tECSN). Under these conditions, tECSNe also lead to the formation of partly burnt bound remnants, instead of neutron stars. In their work, Jones et al. (2019) already noted an overwhelming discrepancy with the abundance of elements measured for LP 40365, in contrast to a good agreement with the iron-peak elements (Cr, Mn, Ni). Their result is confirmed via comparison with the average abundance pattern of the three LP 40365 stars in Fig. 12. Of the new detected elements, Sc, Co , Cu, and Sr, are discrepant with respect to the tECSN model. Zn, however, displays a good match. For tECSNe to be viable progenitors of LP 40365 stars, most of the iron-peak elements would need to be confined to the stellar interiors. This would be possible either if they were synthesised in the core of the exploded white dwarf or if they rapidly sunk after the explosion. Hence, atmospheric convection would still have a role in keeping the surface abundances as distinct as they are from the bulk composition. Furthermore, in this scenario, we note that LP 40365 stars might eventually be the progenitors of the predicted Fe-core white dwarfs (Isern et al., 1991).
To wrap up the comparison with theoretical SN-Iax and tECSN bound remnants, we plotted histogram bars representing the mass fraction of detected elements (Fig.13). The remarkable similarity among LP 40365 stars is once again evident, with Ne as the most abundant element by mass fraction (59–65 per cent), followed by O (29–31 per cent), and Mg (3–9 per cent). The remaining elements are just 1-2 per cent of the total mass. We note that, considering the systematic uncertainties estimated from the analysis of LP 40365, O and Ne would change by just a few per cent. However, adopting a 350 K cooler , the Mg mass fraction would drop to 2 per cent and all the trace elements would account for less than 1 per cent by mass. The results from theoretical simulations by Fink et al. (2014), instead, contain between 25–40 per cent of C and about 45 per cent of O. As noted before, the bulk compositions of theoretical bound remnants are slightly dependent on the explosion intensity and quite sensitive to central density of the accreting white dwarf. On the other hand, the bound-remnant simulated by Jones et al. (2019) contains 45 per cent of heavy metals, most of which are Fe and Ni.
| Parameters | Symbols | LP 40365 | J16036613 | J18253757 | |||
| 16–84 % | 5–95 % | 16–84 % | 5–95 % | 16–84 % | 5–95 % | ||
| Effective Temperature [K] | |||||||
| Surface gravity [cgs] | |||||||
| Luminosity [L☉] | 0.14–0.28 | 0.17–0.57 | 6.31–11.94 | ||||
| Radius [R☉] | 0.14–0.17 | 0.11–0.21 | 0.54–0.67 | ||||
| Mass [M☉] | 0.09–0.87 | 0.07–0.51 | 0.10–0.44 | ||||
Before concluding this section, we note that Zhang et al. (2019) have recently computed the evolutionary tracks and modelled the physical and spectral evolution of post-SN Iax bound remnants (named postgenitors by the authors). Taking the Kromer et al. (2013) SN Iax bound remnant composition as reference, Zhang et al. (2019) evolved the full stellar structure, including convection and diffusion. In contrast with our observations, their simulations, which considered a representative model of 0.6 M☉ with an envelope accounting for 10 per cent of the mass, showed that, at late times after the bound remnants have formed ( Myr), the atmosphere is radiative and contains about 70, 30, and 1 per cent of C, O, and Ne, respectively, while most of the heavy elements have sunk in to the stellar interiors. The authors suggested that similar results were obtained for other lower-mass models considered.
In conclusion, the interpretation of our results, compared to theoretical work, showed that, whether LP 40365 stars formed through either SNe Iax or tECSN explosion, it would be necessary that either C-burning was more intense than what is predicted by models of CO white dwarf deflagrations or, vice-versa, less C, O, and Ne were burned in a ONe white dwarf. In both cases, we stress that theoretical results for the bulk composition of bound remnants might not reflect the atmospheric abundances, given that initial segregation of nucleosynthetic yields, internal mixing due to gravitational settling, diffusion, and convection should definitely have a strong impact on their internal structure, atmospheric composition, and spectral evolution.
5.1.3 Masses and radii
Given the new spectral analysis of LP 40365 presented here, we have revised our previous estimates of its physical parameters. We estimated the radius as R☉, where and are the extinction corrected flux and the integrated Eddington flux, respectively, both considered in the Pan-STARRS -band. The luminosity is L☉, as determined via the Stefan-Boltzmann law. The radius is 11 per cent smaller than what estimated in Paper II, compensating for the 10 per cent increase in and a more realistic spectral modelling. Considering the , we inferred a mass of M☉ (24 per cent smaller than that of Paper II), where is the gravitational constant.
For J16036613, we adopted the radius inferred from the spectro-photometric fit presented in Section 3.2, R☉, which implies L☉. On the other hand, the smaller error on implies a more precisely constrained mass of M☉.
While LP 40365 and J16036613 are essentially spectroscopic twins, J18253757 is hotter and intrinsically brighter than the other two stars, and thus larger. The spectro-photometric fit delivered R☉, which corrsponds to L☉, i.e. times more luminous than the two cooler stars. The inferred mass of J18253757, M☉, matches the estimates for LP 40365 and J16036613.
The physical parameters of the three stars are listed in Table 6, which includes both the uncertainties and the 5–95 per cent ranges.
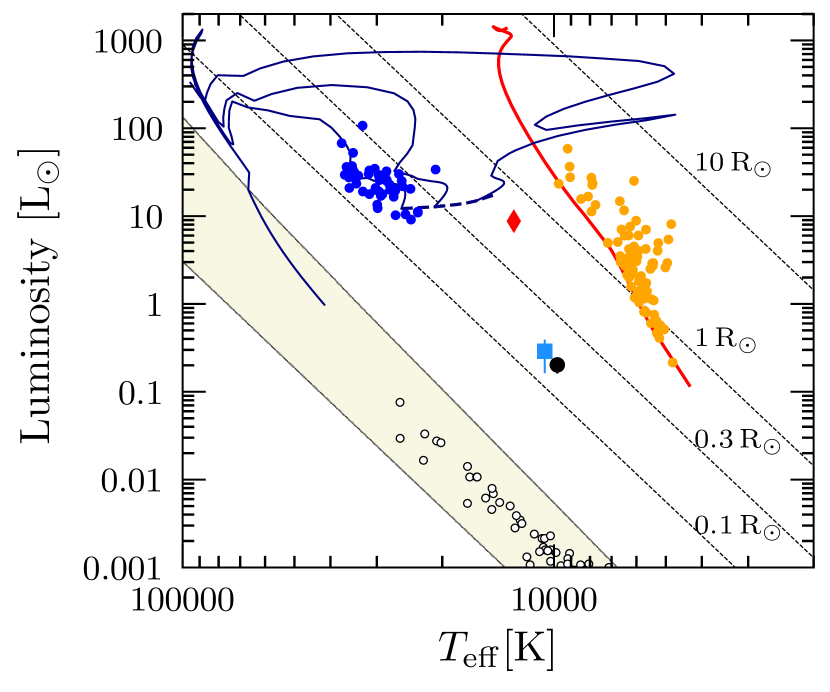
LP 40365, J16036613, and J18253757 are plotted in the theoretical HR diagram (Fig. 14), where we include other classes of stars for comparison. While their span just 2500 K, their luminosities cover two orders of magnitude (0.1–10 L☉). This large portion of the HR diagram is not occupied by any long-lived phase of stellar evolution, but it is occasionally scattered with (pre-) low-mass He-core white dwarfs, which are the products of binary interaction (Istrate et al., 2016), metal-poor A/F-type stars (Pelisoli et al., 2019), and short-lived evolutionary phases with stochastic behaviour, like cataclysmic variables or milli-second pulsar companions. J16036613 sits very close to LP 40365, as expected for two spectroscopically and photometrically similar stars. Although J18253757 appears closer to the zero-age extreme horizontal branch and the main sequence (note the log-log scale), it is K cooler but larger than equal-luminosity hot subdwarfs. Hence, it is at least an order of magnitude less luminous than equal- main sequence stars.
Given their unusual, “sub-luminous” location in the HR diagram and their small masses, which are below the typical mass of canonical white dwarfs (e.g. 0.621 M☉; Tremblay et al., 2016), we speculated that the interiors of LP 40365 stars may not be fully degenerate. We measured their average densities as , 240, and 4.5 g cm-3 for LP 40365, J16036613, and J18253757, respectively. Hence, we note that LP 40365 and J16036613 have average densities that are comparable to those of brown dwarfs (or hot subdwarfs), whereas the mean density of J18253757 is similar to that of the Sun.
Finally, as discussed in Paper I, we remark that the radii we measure for LP 40365 stars are in agreement with the observed low-rotation rates. We note that, even if their progenitors were tidally locked in a short period binary (see Section 5.1.5 and Fuller & Lai, 2012), we expect that mass loss and radius expansion caused by the supernova explosion could have both contributed to slow down a potentially fast-rotating star.
5.1.4 Evolutionary timescales
Given their rarity, the current location of the LP 40365 stars in the HR diagram of Fig. 14 is likely transitory and it is probably characterised by a relatively fast evolution, which could be shorter than the Galactic crossing time for the unbound stars (140 Myr for LP 40365; Paper II).
Shen & Schwab (2017) modelled the first 1000 yr of evolution for post-SNe Iax bound remnants. In this early phase, the stellar photosphere is initially inflated to R☉, the energy output is dominated by strong winds that are powered by the decay of radioactive 56Ni and 56Co, and the release of energy takes place over 10–100 yr timescales. More recent work by Zhang et al. (2019) covers the long-term evolution of post-SN Iax bound remnants, specifically discussing LP 40365 as one such star. These authors proposed that post-SN Iax bound remnants would initially cool down over relatively short time scales, and then heat up and brighten during an at-least 10 Myr-long timescale until they reach the white dwarf cooling sequence again. This mechanism would be regulated by convection and diffusion of iron-peak elements, which initially would settle in the atmosphere of the bound remnants for 10,000 yr during the early phase and would cause a large opacity. The long-lived brightening phase would be caused by a sharp decrease of iron-peak element abundances when the bound remnant becomes radiative and warms up again, after reaching its minimum luminosity and coolest temperature that depend on its mass and envelope size.
Despite finding a poor agrement with the atmospheric composition of LP 40365, Zhang et al. (2019) identified a good match between its location in the HR diagram and the evolutionary track computed for a 0.15 M☉ post-SN Iax bound remnant. This result is intriguingly close to the updated masses of LP 40365 and J16036613. Thus, Zhang et al. (2019) estimated for LP 40365 an age of 23 Myr, which corresponds to the peak of brightness of the long-lived phase. While J16036613 would have a similar age as LP 40365, it would seem that J18253757 is older than the other two stars by interpolating between the Zhang et al. (2019) tracks for 0.15–0.3 M☉ remnants. Hence, this star might be about to join the white dwarf cooling track over a relatively sort time.
The presence of iron-peak elements in the atmosphere of LP 40365 stars critically contrasts with the models of Zhang et al. (2019) and it could indicate that the decline of stellar luminosity is characterised by much longer timescales. Hence, the relative ages of the three LP 40365 stars could be inverted, i.e. J18253757 and would be the youngest of the three objects. For quantifying this, we estimated the Kelvin-Helmholtz timescales, , for the three LP 40365 stars that, in absence of internal sources of energy production, is a good estimator for the evolutionary timescales. Adopting the formulation , which holds for a wide range of objects with internal structure reproducible by a polytrope with index , and using the values from Table 6, we obtain , 12, 0.1 Myr for LP 40365, J16036613, and J18253757, respectively. The of LP 40365 and J16036613 are broadly compatible the evolutionary age estimated by Zhang et al. (2019). The of J18253757 suggests a much younger age that is, however, larger than the rapid cooling phase of the Zhang et al. (2019) models that is richer in atmospheric iron-peak elements (100–10,000 yr). We note that such a short is still compatible with the non-association of J18253757 with known diffuse nebulosity caused by young supernova.
5.1.5 Kinematics and birth places
The rest frame velocities of LP 40365 and J16036613 (–850 km s-1) are compatible with the two stars being unbound from the Milky Way. This condition implies that, in absence of a powerful birth kick, both stars took advantage of a large boost from the Milky Way rotation so that – km s-1, where and are the angles drawn by the ejection velocity vector, , with respect to the vertical direction and the Galactic rotation, respectively. Considering the almost-parallel alignment of the trajectories of LP 40365 and J16036613 in the plane (5–10 deg with respect to direction of the Galactic rotation in the plane, and 20–26 deg with respect to the vertical direction), we found the minimum possible ejection velocities in the range of – km s-1.
In order to achieve the smallest possible, obtainable with the maximum benefit from , the supernovae should have exploded at relatively close distances from the Galactic plane and not to far away from the centre (we note that is already 10 per cent slower above kpc, and it stays constant up to kpc; Williams et al., 2013; Huang et al., 2016). This condition is compatible with the prediction for runaway stars ejected by a disc-like distribution of supernova progenitors (Kenyon et al., 2014).
Adopting the Zhang et al. (2019) age estimate of 23 Myr as the flight time for both LP 40365 and J16036613, we could track their simulated trajectories back to the fourth and third Galactic quadrants, respectively. We note that the kpc estimated by Zhang et al. (2019) does not account for the past trajectory of LP 40365, and it is rather equivalent to the radial distance that would be covered in 23 Myr at 850 km s-1. Hence, properly tracing the Galactic orbits, we find that LP 40365 and J16036613 would have been ejected from possible birth sites at kpc and kpc, and kpc and kpc, respectively. These coordinates are roughly compatible with birth sites within the thick disc. Furthermore, we note the Galactocentric radii of the identified birth sites are close to the empirical determination for the edge of the Galactic disc, i.e where most of the star formation is seen to take place (within a –16 kpc cut-off, as observed from photometric surveys of the Milky Way Sale et al., 2010; Minniti et al., 2011). Thus, this result agrees with SN Iax observations, which are mostly seen in association with regions of recent or ongoing star formation (Foley et al., 2013; Jha, 2017; Lyman et al., 2018). On the other hand, if we wanted to impose birth sites that are nearer to the plane, say , to find a better match with the minimum km s-1, we would obtain , 8 kpc and , 7.5 Myr for LP 40365 and J16036613, respectively.
We previously noted that J18253757 is bound to the Milky Way. The fact that it moves in the opposite direction with respect to the Galactic rotation and it follows a fairly eccentric orbit strongly supports the supernova-ejection mechanism. Observing that the direction of motion of this star has an equally small inclination with respect to the Galactic plane (a few degrees) as the other two, and it is a 165 deg with respect to the Galactic rotation, we also estimated a minimum ejection velocity of km s-1. Finally, we note that if J18253757 is as young as Myr, it would have formed within the thin disc.
5.1.6 Binary progenitors
Given that we find similar for the three LP 40365 stars, it is reasonable to think they formed from the disruption of similar binary progenitors. In the ideal case of instantaneous mass loss and no interactions between accretor and donor stars (Hills, 1983), – km s-1 are lower limits on the orbital velocity at the moment of explosion. This condition could be met if the progenitors of LP 40365 stars were white dwarfs of M☉, which were orbited by –1.3 M☉ He-burning donor stars in hr (Paper II). This result is compatible with a single-degenerate scenario proposed for SN Iax (including progenitors with CO and hybrid CONe cores; Wang & Han, 2009; Wang et al., 2013, 2014), and may also be representative of accreting ONe white dwarfs that lead to tECSNe. We note that kicks due to asymmetric explosions and interactions with the both the donor star and supernova ejecta are expected to take place (Marietta et al., 2000; Jordan et al., 2012; Pan et al., 2012; Liu et al., 2013), adding complexity to this interpretation.
The rest frame velocities of the unbound LP 40365 stars contrasts with the much larger km s-1 of the other known hyper-runaway stars, i.e. the D6 stars (proposed as the former donor white dwarfs in double-degenerate supernova progenitors; Shen et al., 2018b) and the hot subdwarf star US 708 (proposed to be the former low-mass He subdwarf donor in a single-degenerate sub-MCh supernova; Geier et al., 2015). Hence, the kinematics of LP 40365 stars confirms their origin from a distinct class of binary progenitors, also exploding as thermonuclear supernovae, but possessing smaller orbital velocities than the D6 and US 708 progenitors.
5.2 Prospects for end-of-mission Gaia detections
Zhang et al. (2019) have estimated that four post-SN Iax stars would be detectable within 2 kpc from the Sun. In contrast, Shen et al. (2018b) estimated the number of D6 stars in Gaia as 14–40 within 1 kpc. The results obtained by these authors are comparable, considering that empirical SN Iax rates are typically estimated to occur as 1–30 per cent of the SN Ia rates (Foley et al., 2013; Li et al., 2011a; Graur et al., 2017; Jha, 2017). Although Zhang et al. (2019) considered LP 40365 stars as good candidates for the post-SN Iax bound remnants, they assumed these runaways to have km s-1. Such large velocities have only been measured for D6 stars and the hot subdwarf US 708. Given the smaller of LP 40365 stars, likely due to their different binary progenitors, we re-estimated their space density.
Assuming the progenitors of LP 40365 stars have a space density reflecting that of the Galactic thin disc, we distributed them according to an exponentially decaying profile (scale-height and scale-length of 0.3 and 3 kpc, respectively). We scaled the formation rate of LP 40365 stars to 10 per cent of the Galactic SN Ia rate of yr-1 M (Li et al., 2011b), as adopted by Shen et al. (2018b). This rate is compatible with the average of other estimates from the literature, which include a mix of progenitors from both the single- and double-degenerate channels (i.e. SNe Ia with a variety of delay times; Scannapieco & Bildsten, 2005; Mannucci et al., 2005; Mannucci et al., 2006; Aubourg et al., 2008; Ruiter et al., 2009; Maoz et al., 2011). Hence, considering a Galactic disc mass of M☉ (Bland-Hawthorn & Gerhard, 2016), we created 50,000 objects with birth-times that were uniformly distributed over a time interval of 100 Myr, . We assigned Gaussian-distributed initial velocities, , which we modelled on those we have inferred for the observed LP 40365. Finally, we used galpy to estimate the kinematic parameters after a flight time of Myr.
Running ten simulations to randomise the initial conditions, we counted objects within 2 kpc. Such an estimate included all objects with a Myr. However, we know that a large fraction of them might not be detectable for several reasons, one of which is the long-term evolution of their absolute magnitudes. If we considered that LP 40365 stars evolve as proposed by Zhang et al. (2019), i.e. they are 10–1000 times fainter than LP 40365 in their first Myr of life, we would expect that only those older than Myr (i.e. ) are detectable by Gaia with (assuming the absolute magnitude of LP 40365, , as a lower limit). Hence, we could expect to detect just 1–3 intrinsically fainter, younger LP 40365 stars in a smaller volume (e.g. kpc) down to .
The estimate of 63 stars might be optimistic, given that so far we have detected just three LP 40365 stars within 2 kpc, suggesting that the timescales proposed by Zhang et al. (2019) are too short. Following this interpretation, all the observed LP 40365 stars are still relatively young, having ages of the same order of magnitude or shorter than the Myr measured for LP 40365. In this case, we would expect LP 40365 stars. Although this estimate is still too large in comparison with the observed numbers, we note a better agreement with the predictions by Shen et al. (2018b), if we scale our estimate to the number of D6 stars within a smaller volume with a 1 kpc radius.
Given their relatively low , most of the LP 40365 stars could stay bound to the Milky Way, as we find that just 20 per cent of the simulated objects have . The fraction of stars achieving is just 4 per cent of the total. Typical proper motions of LP 40365 stars would also be relatively small, with an average value of mas, indicating that LP 40365 and J18253757 could be the rarest outliers in the distribution.
While we stress that these simulations are affected by several unknowns such as the confirmation of a cooling law and the variety of supernova rates, we note that they are sufficiently straightforward to motivate further spectroscopic follow-up of LP 40365 star candidates. We also note that the binary-supernova mechanism implies the existence of ejected donor stars, which may have similar kinematics, but different compositions.
Finally, we note that the results of this section can also be extended to the ONe white dwarfs that may explode as tECSNe, for which Jones et al. (2019) estimated a birth rate of yr-1 M, which is of the same order of magnitude of that adopted for SN-Iax bound remnants. Thus, tECSNe might lead to the formation of detectable LP 40365 stars within 2 kpc from the Sun.
6 Summary and conclusions
Through detailed spectroscopic, photometric, and kinematic analysis, we have gained further evidence in favour of the idea initially advanced by Vennes et al. (2017) and then reinforced in Paper I and Paper II that the high-velocity star LP 40365 could be a partly burnt white dwarf accretor that survived to a peculiar class of thermonuclear supernovae occurring in binary systems. Given the striking spectroscopic and kinematic similarity we found among LP 40365 and three new objects (J16036613, J18253757, J0905+2510), we propose this star as the namesake of its own spectral class that is defined both by spectroscopic, physical, and kinematic properties:
-
1.
Ne-dominated atmospheres, with O and Mg as the second- and third-most-abundant elements, respectively.
-
2.
Broadly homogeneous composition of detected trace elements (C, Na, Al, Si, S, Ca, Sc, Ti, Cr, Mn, Fe, Co, Ni, Cu, Zn, Sr).
-
3.
Low mass, below the canonical white dwarf mass.
-
4.
Ejection velocity in the range of – km s-1.
The atmospheric composition of LP 40365 stars is a strong indication of partial C-, O-, and Si-burning, likely connected to thermonuclear explosions that did not entirely disrupt their progenitors. Of significant note is the near-identical spectroscopic properties of both LP 40365 and J16036613, which strongly suggests a similar formation mechanism. We found some similarities with the simulations of pure deflagrations of CO and ONe white dwarfs, which could be representative of SNe Iax (Fink et al., 2014) and thermonuclear electron-capture supernovae (Jones et al., 2019), respectively. We noted that the models do not reproduce the main atmospheric components (O, Ne, Mg), perhaps because the bulk composition of bound remnants is not represented by the photosphere of these stars. Promising simulations by Zhang et al. (2019) describe, for the first time, the evolution of post-SN Iax stars. However, the temporal evolution does not well match those of the LP 40365 stars. New theoretical evolutionary models are required, which better account for the initial stratification of nucleosynthetic yields within bound remnants, internal mixing, convection, and diffusion, and also including the evolution of hybrid CONe white dwarfs.
The physical properties of LP 40365 stars are precisely constrained by our spectral analysis and Gaia parallaxes, indicating a relatively small range of masses (median masses between 0.20–0.28 M☉), which indicates they currently are (not fully degenerate) low-mass objects. The radii of these stars were likely inflated due to the large energy accumulated during and after the supernova explosion, growing to 0.16–0.60 R☉, roughly an order of magnitude larger than typical white dwarf radii. Such a large range is compatible with the stars being caught at different evolutionary stages. While the Zhang et al. (2019) models predicted the LP 40365 stars could be older than Myr, we speculated that LP 40365 stars could be still relatively unevolved and thus younger than the Kelvin-Helmholtz timescale of LP 40365 ( Myr), due to the large abundance of heavy metals in their atmospheres.
The kinematics of LP 40365 stars are also distinctive, indicative of their formation mechanism. We found that they can be either bound or unbound to the Milky Way, depending on whether the stars were ejected in the direction of Galactic rotation (as with LP 40365 and J16036613) or in the opposite direction (like J18253757). In order to obtain the observed kinematics, confined to small coordinates, the progenitors of LP 40365 stars likely resided in the Galactic disc, further constraining their ages to no more than a few 10 Myr. The ejection velocities required to reproduce the rest-frame velocity of the three LP 40365 stars are in the range of 550–600 km s-1, consistent with ejection from a relatively compact binary systems containing a the near-MCh white dwarf progenitor and a He-burning donor star of roughly 0.8–1.3 M☉ orbiting with a hr period. This result is at least compatible with one class of thermonuclear supernova progenitors, which are invoked to explain short-delay-time supernovae and subluminous classes like SNe Iax (Wang & Han, 2009; Wang et al., 2009a, b, 2013). Furthermore, we noted that the kinematic evidence characterising LP 40365 stars clearly distinguishes them from other groups of hyper-runaways, i.e. the D6 stars (Shen et al., 2018b) and the hot-subdwarf US 708 (Geier et al., 2015), which require even more compact progenitors to reach their rest frame velocities of km s-1.
We estimate that of the order 22 stars could be detectable by the end of the Gaia mission if LP 40365 stars are post-SN Iax stars, imposing the boundary conditions implied by the ejection velocities and flight times determined from our analysis. Although the results of our simulations were susceptible to large variations, e.g. the uncertainty of supernova rates and evolutionary timescales of LP 40365 stars, we stress they are compatible with the observed numbers and scale as 10 per cent of of predicted D6 stars (Shen et al., 2018b). We also noted that the results of our predictions for future Gaia detection are compatible with the possibility that LP 40365 stars could be bound remnants surviving to tECSNe.
The key message from our simulation of the population of LP 40365 stars within 2 kpc of the Sun is that most of them are likely gravitationally bound to the Milky Way and will possess relatively small proper motions. The confirmed LP 40365 stars may not represent the broader population yet to be discovered, suggesting that evolutionary “missing links” as well as their ejected donor stars are yet to be found. It is possible that more evolved LP 40365 stars would show different atmospheric compositions, if their heavy elements sink deeper into the atmosphere as the stars evolve with changing temperatures and radii. We anticipate interesting results from more advanced theoretical modelling, expanding the results presented by Fink et al. (2014), Kromer et al. (2015), and Jones et al. (2019) for the composition of bound remnants and Zhang et al. (2019) for the late cooling of SN Iax bound remnants.
Finally, we remark that the LP 40365 stars that remain bound to the Milky Way could revert back to the white dwarf cooling sequence, likely within a few 100 Myr, still displaying lower than canonical white dwarfs due to their smaller masses. These white dwarfs should have stratified atmospheres, containing mostly O, Ne, and Mg. Although not fully investigated, peculiar O-rich white dwarfs like J1240+6710 (Kepler et al., 2016) – as well as one of our SDSS candidates, J1637+3631 – could represent or be linked to one of the final evolutionary stages of the newly discovered class of LP 40365 stars.
Acknowledgements
We thank S. O. Kepler, R. Fisher, A. Rebassa-Mansergas, S. Toonen, M. Zhang, and C. Wheeler for their helpful feedback during EUROWD21 at the University of Texas at Austin, A. Irrgang for discussions on Galactic trajectories, and S. Jones for kindly providing his bound remnant compositions in machine-readable format.
RR and UH acknowledge funding by the German Science foundation (DFG) through grants HE1356/71-1 and IR190/1-1. Support for JJH was provided by NASA through Hubble Fellowship grant #HST-HF2-51357.001-A, awarded by the Space Telescope Science Institute, which is operated by the Association of Universities for Research in Astronomy, Incorporated, under NASA contract NAS5-26555. IP acknowledges support from DFG under grant GE 2056-12-1. JS acknowledges support from the Packard Foundation. The research leading to these results has received funding from the European Research Council under the European Union’s Horizon 2020 research and innovation programme no. 677706 (WD3D) and the European Union’s Seventh Framework Programme (FP/2007-2013) / ERC Grant Agreement no. 320964 (WDTracer). OFT and BTG were supported by the UK STFC grant ST/P000495.
This work has made use of data from the European Space Agency (ESA) mission Gaia (https://www.cosmos.esa.int/gaia), processed by the Gaia Data Processing and Analysis Consortium (DPAC, https://www.cosmos.esa.int/web/gaia/dpac/consortium). Funding for the DPAC has been provided by national institutions, in particular the institutions participating in the Gaia Multilateral Agreement. Based on observations made with the NASA/ESA HST, obtained at the Space Telescope Science Institute, which is operated by the Association of Universities for Research in Astronomy, Inc., under NASA contract NAS 5-26555. These observations are associated with program 15431. Based on observations made with ESO Telescopes at the La Silla Paranal Observatory under programme ID 093.D-0431, 097.D1029, and 0101.C0646. Based on observations obtained at the Southern Astrophysical Research (SOAR) telescope, which is a joint project of the Ministério da Ciência, Tecnologia, Inovações e Comunicações (MCTIC) do Brasil, the U.S. National Optical Astronomy Observatory (NOAO), the University of North Carolina at Chapel Hill (UNC), and Michigan State University (MSU). Also based on observations collected at Copernico telescope (Asiago, Italy) of the INAF – Osservatorio Astronomico di Padova. The William Hershel Telescope and its service programme are operated on the island of La Palma by the Isaac Newton Group of Telescopes in the Spanish Observatorio del Roque de los Muchachos of the Instituto de Astrofísica de Canarias (prog. ID: W/2017A/25, W/2017A/30, andSW2017a12).
Funding for the Sloan Digital Sky Survey IV has been provided by the Alfred P. Sloan Foundation, the U.S. Department of Energy Office of Science, and the Participating Institutions. SDSS-IV acknowledges support and resources from the Center for High-Performance Computing at the University of Utah. The SDSS web site is www.sdss.org.
This research made use of Astropy, a community-developed core Python package for Astronomy (Astropy Collaboration et al., 2018).
References
- Abolfathi et al. (2018) Abolfathi B., et al., 2018, ApJS, 235, 42
- Asplund et al. (2009) Asplund M., Grevesse N., Sauval A. J., Scott P., 2009, ARA&A, 47, 481
- Astropy Collaboration et al. (2018) Astropy Collaboration et al., 2018, AJ, 156, 123
- Aubourg et al. (2008) Aubourg É., Tojeiro R., Jimenez R., Heavens A., Strauss M. A., Spergel D. N., 2008, A&A, 492, 631
- Badenes et al. (2008) Badenes C., Bravo E., Hughes J. P., 2008, ApJ, 680, L33
- Bailer-Jones et al. (2018) Bailer-Jones C. A. L., Rybizki J., Fouesneau M., Mantelet G., Andrae R., 2018, AJ, 156, 58
- Bergeron et al. (2001) Bergeron P., Leggett S. K., Ruiz M. T., 2001, ApJS, 133, 413
- Bland-Hawthorn & Gerhard (2016) Bland-Hawthorn J., Gerhard O., 2016, ARA&A, 54, 529
- Bovy (2015) Bovy J., 2015, ApJS, 216, 29
- Bovy & Rix (2013) Bovy J., Rix H.-W., 2013, ApJ, 779, 115
- Boyajian et al. (2013) Boyajian T. S., et al., 2013, ApJ, 771, 40
- Bravo et al. (2016) Bravo E., Gil-Pons P., Gutiérrez J. L., Doherty C. L., 2016, A&A, 589, A38
- Brooks et al. (2017a) Brooks J., Schwab J., Bildsten L., Quataert E., Paxton B., 2017a, ApJ, 834, L9
- Brooks et al. (2017b) Brooks J., Schwab J., Bildsten L., Quataert E., Paxton B., 2017b, ApJ, 843, 151
- Buzzoni et al. (1984) Buzzoni B., et al., 1984, The Messenger, 38, 9
- Chambers et al. (2016) Chambers K. C., et al., 2016, preprint, p. arXiv:1612.05560 (arXiv:1612.05560)
- Choi et al. (2016) Choi J., Dotter A., Conroy C., Cantiello M., Paxton B., Johnson B. D., 2016, ApJ, 823, 102
- Clemens et al. (2004) Clemens J. C., Crain J. A., Anderson R., 2004, in Moorwood A. F. M., Iye M., eds, Proc. SPIEVol. 5492, Ground-based Instrumentation for Astronomy. pp 331–340, doi:10.1117/12.550069
- Currie et al. (2014) Currie M. J., Berry D. S., Jenness T., Gibb A. G., Bell G. S., Draper P. W., 2014, in Manset N., Forshay P., eds, Astronomical Society of the Pacific Conference Series Vol. 485, Astronomical Data Analysis Software and Systems XXIII. p. 391
- Denissenkov et al. (2013) Denissenkov P. A., Herwig F., Truran J. W., Paxton B., 2013, ApJ, 772, 37
- Denissenkov et al. (2015) Denissenkov P. A., Truran J. W., Herwig F., Jones S., Paxton B., Nomoto K., Suzuki T., Toki H., 2015, MNRAS, 447, 2696
- Dorman et al. (1993) Dorman B., Rood R. T., O’Connell R. W., 1993, ApJ, 419, 596
- Fink et al. (2014) Fink M., et al., 2014, MNRAS, 438, 1762
- Fitzpatrick (1999) Fitzpatrick E. L., 1999, PASP, 111, 63
- Flewelling et al. (2016) Flewelling H. A., et al., 2016, arXiv e-prints, p. arXiv:1612.05243
- Foley et al. (2013) Foley R. J., et al., 2013, ApJ, 767, 57
- Fontaine et al. (2001) Fontaine G., Brassard P., Bergeron P., 2001, PASP, 113, 409
- Freudling et al. (2013) Freudling W., Romaniello M., Bramich D. M., Ballester P., Forchi V., García-Dabló C. E., Moehler S., Neeser M. J., 2013, A&A, 559, A96
- Fuller & Lai (2012) Fuller J., Lai D., 2012, MNRAS, 421, 426
- Gaia Collaboration et al. (2018) Gaia Collaboration et al., 2018, A&A, 616, A1
- Geier et al. (2015) Geier S., et al., 2015, Science, 347, 1126
- Giammichele et al. (2012) Giammichele N., Bergeron P., Dufour P., 2012, ApJS, 199, 29
- Giclas et al. (1970) Giclas H. L., Burnham R., Thomas N. G., 1970, Lowell Observatory Bulletin, 7, 183
- Graur et al. (2017) Graur O., Bianco F. B., Modjaz M., Shivvers I., Filippenko A. V., Li W., Smith N., 2017, ApJ, 837, 121
- Green et al. (2018) Green G. M., et al., 2018, MNRAS, 478, 651
- Heber (2016) Heber U., 2016, PASP, 128, 082001
- Hills (1983) Hills J. G., 1983, ApJ, 267, 322
- Hirsch et al. (2005) Hirsch H. A., Heber U., O’Toole S. J., Bresolin F., 2005, A&A, 444, L61
- Hollands et al. (2017) Hollands M. A., Koester D., Alekseev V., Herbert E. L., Gänsicke B. T., 2017, MNRAS, 467, 4970
- Horne (1986) Horne K., 1986, PASP, 98, 609
- Huang et al. (2016) Huang Y., et al., 2016, MNRAS, 463, 2623
- Isern et al. (1991) Isern J., Canal R., Labay J., 1991, ApJ, 372, L83
- Istrate et al. (2016) Istrate A. G., Marchant P., Tauris T. M., Langer N., Stancliffe R. J., Grassitelli L., 2016, A&A, 595, A35
- Iwamoto et al. (1999) Iwamoto K., Brachwitz F., Nomoto K., Kishimoto N., Umeda H., Hix W. R., Thielemann F.-K., 1999, ApJS, 125, 439
- Jha (2017) Jha S. W., 2017, Type Iax Supernovae. Springer International Publishing, Cham, pp 375–401, doi:10.1007/978-3-319-21846-5_42
- John (1975a) John T. L., 1975a, MNRAS, 170, 5
- John (1975b) John T. L., 1975b, MNRAS, 172, 305
- John (1996) John T. L., 1996, MNRAS, 279, 859
- John & Williams (1975) John T. L., Williams R. J., 1975, MNRAS, 171, 7P
- Jones et al. (2016) Jones S., Röpke F. K., Pakmor R., Seitenzahl I. R., Ohlmann S. T., Edelmann P. V. F., 2016, A&A, 593, A72
- Jones et al. (2019) Jones S., et al., 2019, A&A, 622, A74
- Jordan et al. (2012) Jordan IV G. C., Perets H. B., Fisher R. T., van Rossum D. R., 2012, ApJ, 761, L23
- Justham et al. (2009) Justham S., Wolf C., Podsiadlowski P., Han Z., 2009, A&A, 493, 1081
- Katsanis & McGrath (1998) Katsanis R. M., McGrath M. A., 1998, Technical report, The Calstis IRAF Calibration Tools for STIS Data. STScI
- Kausch et al. (2015) Kausch W., et al., 2015, A&A, 576, A78
- Kenyon et al. (2014) Kenyon S. J., Bromley B. C., Brown W. R., Geller M. J., 2014, ApJ, 793, 122
- Kepler et al. (2016) Kepler S. O., Koester D., Ourique G., 2016, Science, 352, 67
- Kleinman et al. (2013) Kleinman S. J., et al., 2013, ApJS, 204, 5
- Koester (2010) Koester D., 2010, Mem. Soc. Astron. Italiana, 81, 921
- Kromer et al. (2013) Kromer M., et al., 2013, MNRAS, 429, 2287
- Kromer et al. (2015) Kromer M., et al., 2015, MNRAS, 450, 3045
- Kupka et al. (2000) Kupka F. G., Ryabchikova T. A., Piskunov N. E., Stempels H. C., Weiss W. W., 2000, Baltic Astronomy, 9, 590
- Li et al. (2003) Li W., et al., 2003, PASP, 115, 453
- Li et al. (2011a) Li W., et al., 2011a, MNRAS, 412, 1441
- Li et al. (2011b) Li W., Chornock R., Leaman J., Filippenko A. V., Poznanski D., Wang X., Ganeshalingam M., Mannucci F., 2011b, MNRAS, 412, 1473
- Lisker et al. (2005) Lisker T., Heber U., Napiwotzki R., Christlieb N., Han Z., Homeier D., Reimers D., 2005, A&A, 430, 223
- Liu (1999) Liu C.-N., 1999, PhD thesis, University of Nebraska - Lincoln, https://search.proquest.com/docview/304512496?accountid=10755
- Liu & Starace (1999) Liu C.-N., Starace A. F., 1999, Phys. Rev. A, 59, 3643
- Liu et al. (2013) Liu Z.-W., et al., 2013, ApJ, 774, 37
- Luyten (1970) Luyten W. J., 1970, Proper Motion Survey with the forty-eight inch Schmidt telescope. The zone +70_ to +75_.. Univ. Minnesota
- Lyman et al. (2018) Lyman J. D., et al., 2018, MNRAS, 473, 1359
- Mannucci et al. (2005) Mannucci F., Della Valle M., Panagia N., Cappellaro E., Cresci G., Maiolino R., Petrosian A., Turatto M., 2005, A&A, 433, 807
- Mannucci et al. (2006) Mannucci F., Della Valle M., Panagia N., 2006, MNRAS, 370, 773
- Maoz et al. (2011) Maoz D., Mannucci F., Li W., Filippenko A. V., Della Valle M., Panagia N., 2011, MNRAS, 412, 1508
- Maoz et al. (2014) Maoz D., Mannucci F., Nelemans G., 2014, A&ARv, 52, 107
- Marietta et al. (2000) Marietta E., Burrows A., Fryxell B., 2000, ApJS, 128, 615
- Marsh (1989) Marsh T. R., 1989, PASP, 101, 1032
- Matteucci et al. (1993) Matteucci F., Raiteri C. M., Busson M., Gallino R., Gratton R., 1993, A&A, 272, 421
- McMahon et al. (2013) McMahon R. G., Banerji M., Gonzalez E., Koposov S. E., Bejar V. J., Lodieu N., Rebolo R., VHS Collaboration 2013, The Messenger, 154, 35
- Minniti et al. (2011) Minniti D., Saito R. K., Alonso-García J., Lucas P. W., Hempel M., 2011, ApJ, 733, L43
- Moore (1959) Moore C. E., 1959, A multiplet table of astrophysical interest. Part 1. NBS Technical Note, Washington: US Department of Commerce
- Morrissey et al. (2007) Morrissey P., et al., 2007, ApJS, 173, 682
- Morton (2000) Morton D. C., 2000, ApJS, 130, 403
- Pan et al. (2012) Pan K.-C., Ricker P. M., Taam R. E., 2012, ApJ, 750, 151
- Pelisoli et al. (2019) Pelisoli I., Bell K. J., Kepler S. O., Koester D., 2019, MNRAS, 482, 3831
- Phillips et al. (2007) Phillips M. M., et al., 2007, PASP, 119, 360
- Pickles (1998) Pickles A. J., 1998, PASP, 110, 863
- Piffl et al. (2014) Piffl T., et al., 2014, A&A, 562, A91
- Raddi et al. (2017) Raddi R., et al., 2017, MNRAS, 472, 4173
- Raddi et al. (2018a) Raddi R., Hollands M. A., Gänsicke B. T., Townsley D. M., Hermes J. J., Gentile Fusillo N. P., Koester D., 2018a, MNRAS, 479, L96
- Raddi et al. (2018b) Raddi R., Hollands M. A., Koester D., Gänsicke B. T., Gentile Fusillo N. P., Hermes J. J., Townsley D. M., 2018b, ApJ, 858, 3
- Robinson & Geltman (1967) Robinson E. J., Geltman S., 1967, Phys. Rev., 153, 4
- Ruiter et al. (2009) Ruiter A. J., Belczynski K., Fryer C., 2009, ApJ, 699, 2026
- Ryabchikova et al. (2015) Ryabchikova T., Piskunov N., Kurucz R. L., Stempels H. C., Heiter U., Pakhomov Y., Barklem P. S., 2015, Physica Scripta, 90, 054005
- Sale et al. (2010) Sale S. E., et al., 2010, MNRAS, 402, 713
- Scannapieco & Bildsten (2005) Scannapieco E., Bildsten L., 2005, ApJ, 629, L85
- Schlafly & Finkbeiner (2011) Schlafly E. F., Finkbeiner D. P., 2011, ApJ, 737, 103
- Schlegel et al. (1998) Schlegel D. J., Finkbeiner D. P., Davis M., 1998, ApJ, 500, 525
- Schönrich (2012) Schönrich R., 2012, MNRAS, 427, 274
- Schönrich et al. (2010) Schönrich R., Binney J., Dehnen W., 2010, MNRAS, 403, 1829
- Schwab & Rocha (2019) Schwab J., Rocha K. A., 2019, ApJ, 872, 131
- Schwab et al. (2015) Schwab J., Quataert E., Bildsten L., 2015, MNRAS, 453, 1910
- Seitenzahl & Townsley (2017) Seitenzahl I. R., Townsley D. M., 2017, Nucleosynthesis in Thermonuclear Supernovae. Springer International Publishing, p. 1955, doi:10.1007/978-3-319-21846-5_87
- Seitenzahl et al. (2013) Seitenzahl I. R., Cescutti G., Röpke F. K., Ruiter A. J., Pakmor R., 2013, A&A, 559, L5
- Shen & Schwab (2017) Shen K. J., Schwab J., 2017, ApJ, 834, 180
- Shen et al. (2018a) Shen K. J., Kasen D., Miles B. J., Townsley D. M., 2018a, ApJ, 854, 52
- Shen et al. (2018b) Shen K. J., et al., 2018b, ApJ, 865, 15
- Smee et al. (2013) Smee S. A., et al., 2013, AJ, 146, 32
- Smette et al. (2015) Smette A., et al., 2015, A&A, 576, A77
- Tian et al. (2017) Tian H.-J., et al., 2017, ApJS, 232, 4
- Travaglio et al. (2011) Travaglio C., Röpke F. K., Gallino R., Hillebrandt W., 2011, ApJ, 739, 93
- Tremblay et al. (2016) Tremblay P.-E., Cummings J., Kalirai J. S., Gänsicke B. T., Gentile-Fusillo N., Raddi R., 2016, MNRAS, 461, 2100
- Tremblay et al. (2017) Tremblay P.-E., et al., 2017, MNRAS, 465, 2849
- Vallée (2008) Vallée J. P., 2008, AJ, 135, 1301
- Vennes et al. (2017) Vennes S., Nemeth P., Kawka J. R., Thorstensen J. R., Khalack V., Ferrario L., Alper E. H., 2017, Science, 357, 680
- Vernet et al. (2011) Vernet J., et al., 2011, A&A, 536, A105
- Wang & Han (2009) Wang B., Han Z., 2009, A&A, 508, L27
- Wang & Han (2012) Wang B., Han Z., 2012, New Astron. Rev., 56, 122
- Wang et al. (2009a) Wang B., Meng X., Chen X., Han Z., 2009a, MNRAS, 395, 847
- Wang et al. (2009b) Wang B., Chen X., Meng X., Han Z., 2009b, ApJ, 701, 1540
- Wang et al. (2013) Wang B., Justham S., Han Z., 2013, A&A, 559, A94
- Wang et al. (2014) Wang B., Meng X., Liu D.-D., Liu Z.-W., Han Z., 2014, ApJ, 794, L28
- Williams et al. (2013) Williams M. E. K., et al., 2013, MNRAS, 436, 101
- Williams et al. (2017) Williams A. A., Belokurov V., Casey A. R., Evans N. W., 2017, MNRAS, 468, 2359
- Wolf et al. (2018) Wolf C., et al., 2018, Publications of the Astronomical Society of Australia, 35, e010
- Wood (1995) Wood M. A., 1995, in Koester D., Werner K., eds, Lecture Notes in Physics, Berlin Springer Verlag Vol. 443, White Dwarfs. p. 41, doi:10.1007/3-540-59157-5_171
- Woodgate et al. (1998) Woodgate B. E., et al., 1998, PASP, 110, 1183
- Yamaguchi et al. (2015) Yamaguchi H., et al., 2015, ApJ, 801, L31
- Zhang et al. (2019) Zhang M., Fuller J., Schwab J., Foley R. J., 2019, ApJ, 872, 29