Cavities, shocks and a cold front around 3C 320
Abstract
We present results obtained from the analysis of a total of 110 ks Chandra observations of 3C 320 FR II radio galaxy, located at the centre of a cluster of galaxies at a redshift . A pair of X-ray cavities have been detected at an average distance of 38 kpc along the East and West directions with the cavity energy, age and total power equal to 7.71059 erg, 7107 yr and 3.51044 erg s-1, respectively. The cooling luminosity within the cooling radius of 100 kpc was found to be erg s-1. Comparison of these two estimates implies that the cavity power is sufficiently high to balance the radiative loss. A pair of weak shocks have also been evidenced at distances of 47 kpc and 76 kpc surrounding the radio bubbles. Using the observed density jumps of 1.8 and 2.1 at shock locations along the East and West directions, we estimate the Mach numbers () to be 1.6 and 1.8, respectively. A sharp surface brightness edge was also detected at relatively larger radius (80 kpc) along the South direction. Density jump at this surface brightness edge was estimated to be 1.6 and is probably due to the presence of a cold front in this cluster. The far-infrared luminosity yielded the star formation rate of 51 M⊙ yr-1 and is 1/4th of the cooling rate ( 192 M⊙ yr-1).
keywords:
galaxies: active, galaxies: general, galaxies: individual: 3C 320: intra, X-rays: galaxies: clusters1 Introduction
Detection of copious amount of X-ray emission from hot gas in the intra-cluster medium (ICM) suggests that the 45% (Sanderson et al., 2006) and 44% – 64% (Andrade-Santos et al., 2017) of cores of clusters appear to cool faster than the Hubble time in the local universe and are referred to as the cool core clusters. It is expected that the cooling ICM must fall on to the core at a rate up to 1000 M⊙ yr-1, thereby losing its energy in the form of radiation, mostly in the form of X-rays (Fabian, 1994). However, the observed star formation rates in the cores of such clusters are much lower than the cooling rates (O’Dea et al., 2008) leading to the cooling flow problem. Some kind of heating is, therefore, required to explain the observed low star formation rate in the cores of such clusters (Heinz et al., 2006; Conroy & Ostriker, 2008).
Recent understanding is that the Active Galactic Nucleus (AGN) residing at the core of the cluster releases the required amount of energy through the feedback and hence resolves the problem (Dunn & Fabian, 2006; Rafferty et al., 2006; McNamara & Nulsen, 2007). Such a feedback by the AGN has been evidenced in several of the clusters, in the form of X-ray deficient regions (cavities or bubbles) as the most discernible features of the interaction between the AGN and the ICM (Dong et al., 2010; Pandge et al., 2012, 2013; Sonkamble et al., 2015; Vagshette et al., 2016, 2017). These cavities are believed to be created due to the AGN outburst by injecting the relativistic plasma into the ICM (Bîrzan et al., 2004; Rafferty et al., 2006).
The powerful radio jets launched by the central AGNs also induce weak shocks in the ICM. Deep observations employing high resolution instruments onboard X-ray observatories such as Chandra and XMM-Newton have enabled us to detect large scale weak shocks around the powerful radio lobes in several of the galaxy clusters (Nulsen et al., 2005; McNamara et al., 2005; Fabian et al., 2006; Forman et al., 2007; Simionescu et al., 2009; Million et al., 2010; Gitti et al., 2011; Kraft et al., 2012; Vantyghem et al., 2014; Vagshette et al., 2016). These shocks are found to be weak with the Mach numbers in the range of 1.2 to 1.7, therefore heating due to such weak shocks is significant only at smaller radii (McNamara & Nulsen, 2012). Apart from shocks, several other substructures are also evident in the central region of the cool core clusters. One of such features is the cold front which is seen in several of the merging clusters (Markevitch et al., 2000; Vikhlinin et al., 2001b, a; Vikhlinin & Markevitch, 2002). These cold fronts e.g. cool and dense cores of merging subclusters, travel through the hot and shocked outer gas halo of the system, causing density and temperature discontinuities in their profiles and surface brightness edges in the X-ray images (Vikhlinin et al., 2001b). Simulation based studies have confirmed their origin through the interaction of two subclusters where gas halos of outer subclusters are shocked and stopped due to the inner low entropy gas, coupled with their host dark matter of sufficiently high density (Mathis et al., 2005; Markevitch & Vikhlinin, 2007). Cold fronts have been reported in several of the cool core clusters. Ghizzardi et al. (2010) carried out a sample survey of 45 galaxy clusters out of which 19 clusters with low redshift ( 0.2) were found to host such cold fronts. Using Chandra images, Owers et al. (2009) have detected cold fronts in several galaxy clusters at redshift of 0.05 to 0.3. There are several other cluster studies that report detection of such cold fronts in the core of galaxy clusters (Mazzotta et al., 2001; Owers et al., 2009, 2011; Hlavacek-Larrondo et al., 2011; Bourdin et al., 2013; Ogrean et al., 2016).
3C 320 is a classical FR II radio galaxy situated at the centre of a cluster (Spinrad et al., 1985) at a redshift of , positioned at RA=15h 31m 25.38s; DEC=+35d 33m 40.46s (Douglas et al., 1996). 3C 320 is a powerful radio galaxy and has been studied in several of the radio bands (Harvanek & Stocke, 2002; McCarthy et al., 1991; Roger et al., 1986; Saikia et al., 2001). The detection of X-ray cavities in the cluster environment as an outcome of the interaction with radio lobes has been reported by Massaro et al. (2013) . Using Very Large Array (VLA) X-band observations, Harvanek & Stocke (2002) have measured the angular size of the lobe (lobe to lobe distance) to be 15.3 arcsec, projected bending angle of 7 and the lobe length asymmetry of 1.2. Infrared study also confirmed the presence of dust in 3C 320 (Andreani et al., 2002). However, a thorough and detailed X-ray study of the cluster has not yet been carried out. In the present work, a comprehensive imaging and spectral study of 3C 320 FRII radio galaxy is attempted by using high spatial and spectral resolution data from Chandra X-ray observatory.
This paper present results obtained from systematic analysis of two Chandra observations of 3C 320 cluster for a total exposure of 110 ks. This paper is structured as: Section-2 describes observations and data analysis techniques, while Section-3 discusses the results obtained from X-ray imaging, spectral fitting and comparison with the radio maps. Section-4 briefly describes the cavity energetics, shocks and cold front detections and finally Section-5 summarizes results from the present study. Throughout this paper, we adopt a cosmology with = 0.3, =0.7 and = 70 km s-1 Mpc-1. Using these cosmological parameters and the cosmological relations111http://www.astro.ucla.edu/ Ewright/CosmoCalc.html, the angular size distance DA = 1007 Mpc corresponds to a scale of 4.9 kpc arcsec-1. All the errors quoted in this paper are at 68 (1) confidence limit, unless otherwise stated.
2 Observations and Data Reduction
The FR II galaxy 3C 320 was observed with the Chandra X-ray observatory at two epochs; (i) on 2014 May 11 (ObsID 16130) for a total exposure of 60 ks and (ii) on 2014 June 12 (ObsID 16613) for a total exposure of 50 ks. Both the observations were carried out in very faint mode (VFAINT) with 3C 320 centered on ACIS-S3 back-illuminated chip with other ACIS-2368 chips in switched-on mode. For the present study, data from both the observations were retrieved from the Chandra Data Archive (CDA222http://cda.harvard.edu/chaser) and were reprocessed from level-1 event files using ‘chandrarepro’ task of CIAO version 4.6 and CALDB version 4.6.2. Background event files were generated after excluding the hot pixels and bright sources from the observed event files from ACIS-S3 chip. Light curves in 2.5–7 keV range were extracted from these background event files by using ‘dmextract’ task of CIAO and the flaring events were removed by using ‘lcsigmaclip’ task of ChIPS plotting package. In both the observations of 3C 320, no significant flaring events were identified. Therefore, we used data with a net exposure of 110 ks for further analysis.

3 Results
3.1 Imaging analysis
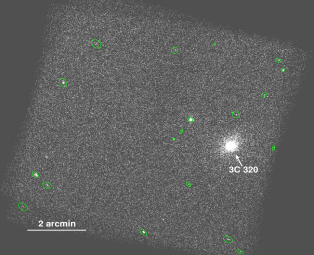
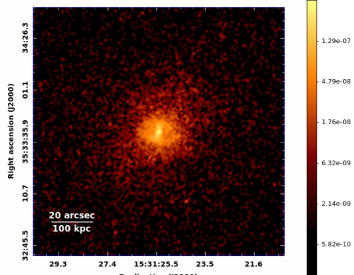
To improve the signal-to-noise ratio, the cleaned event data from both the observations were merged by using ‘mergeobs333http://cxc.harvard.edu/ciao/threads/combine/’. In the merged event data, several point sources were identified (Fig. 1) which were subsequently removed from the event files by using ‘wavdetect’ task. The resulting holes left behind were filled by using ‘dmfilth’ task and the resultant images were used for deriving unsharp mask image to delineate the substructures within surface brightness distribution of X-ray emission. Exposure corrected, point sources removed and subsequent refilled raw image of 3C 320 in 0.5-3 keV range is shown in Fig. 2.
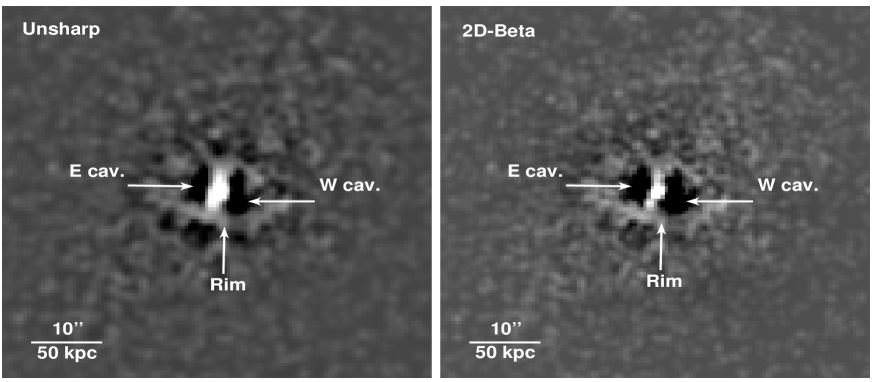
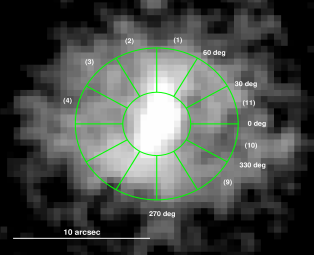
Identification of peculiar features such as cavities, shocks, etc. in this cluster were done by following unsharp and 2D -model subtracted residual imaging techniques (David et al., 2009; Dong et al., 2010). In unsharp mask imaging technique, a highly Gaussian smoothed image - 7 (1 = 0.5 arcsec) was subtracted from the lightly smoothed (1) image. In the second method, a smooth model image of the cluster emission was generated by 2D -model fitting by assuming spherical symmetry in the X-ray emission which was then subtracted from the original unsmoothed image. The best-fitted model yielded the core radius 9.0 arcsec, slope 1.3 and amplitude 1.6e-7 counts cm-2 arcsec-2 s-1. The residual images generated by using unsharp mask and 2D -model subtraction are shown in the left and right panels of Fig. 3, respectively. In both the panels, X-ray cavities along East and West directions of the X-ray centre (dark shades) of 3C 320, bright circular rims and nuclear clump (excess emission) regions are clearly discernible. The inflating cavities that push the infalling gas away are known to be the cause of the formation of bright rims and nuclear clump (part of the rim) gas in the core of 3C 320. These features are very similar to those seen in Cygnus A (Yaji et al., 2010), RBS 797 (Cavagnolo et al., 2011), MS 0735.6+7421 (McNamara et al., 2005) and 3C 444 (Vagshette et al., 2016). To substantiate the depressions in the X-ray emission along the cavity regions, we performed X-ray count statistics by extracting the counts from different sectors within the annular regions of 2-6 arcsec as shown in the left panel of Fig. 4. The right panel of the figure shows the variation of the X-ray counts against the sector numbers. In sectors 3 & 4 (E-cav) and 9, 10 & 11 (W-cav), we find appreciable decrement in the X-ray counts relative to the mean count value which was calculated by using counts from the non-deviated regions (sectors 2, 6, 7 and 8) and was found to be 18.3 counts arcsec-2 with a measurement uncertainty of 0.3 counts arcsec-2 and standard deviation 0.62 counts arcsec-2. The average counts in the regions covering the East and West cavity locations were 13 counts arcsec-2 and 12 counts arcsec-2, with uncertainties of 0.1 counts arcsec-2 and 0.9 counts arcsec-2 and standard deviations of 0.2 counts arcsec-2 and 1.6 counts arcsec-2, respectively. This count statistics delineates more than 3 level detection of cavities.
3.2 Spectral analysis
To investigate the thermodynamical properties of cluster emission, we performed spectral analysis of the data obtained from both the Chandra observations. As in imaging analysis, contributions from the point sources were excluded during the spectral analysis. Spectra from each of the observations were extracted independently by using ‘specextract’ task of CIAO. 3C 320 being a moderately redshifted ( = 0.342) cluster, it occupied smaller area on the chip. Considering this, we selected local background regions on the chip itself, far away from the source emission. Spectra extracted for corresponding features from both the observations were simultaneously fitted by using XSPEC version 12.9.0. During spectral fitting, the absorption due to equivalent hydrogen column density selected within 1 field of view was fixed at the Galactic value of 1.691020 cm-2 (Kalberla et al., 2005).
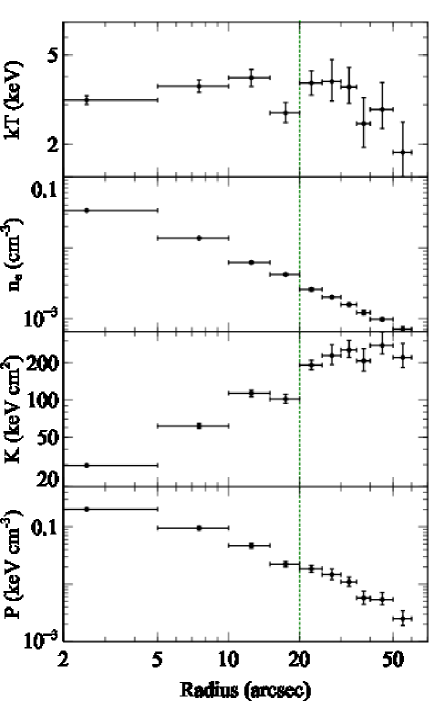
To carry out a systematic and thorough understanding of the thermodynamical properties in the ICM of the cluster, 0.5–7 keV spectra were extracted from concentric circular annuli of 5 arcsec width up to 40 arcsec radius, which was then increased to 10 arcsec between 40 to 60 arcsec. These spectra were then fitted with a single temperature collisional equilibrium plasma APEC model (Smith et al., 2001) allowing the temperature, abundance and normalization parameters to vary. Due to poor statistics for a few of the outer annuli, beyond 25 arcsrc, the abundance was fixed at 0.5 Z⊙ as the average abundance of the cluster. For spectral fitting, we used the angr (Anders & Grevesse, 1989) abundance table. Electron number density in each of the annulus was estimated from APEC normalization which is directly related to the emission integral (EI = ) (Smith et al., 2001; Böhringer & Werner, 2010). Here, the ratio between electron number density () and hydrogen number density () was assumed to be 1.2 for solar abundance (Gitti et al., 2012). The radial thermodynamical profiles e.g. azimuthally averaged projected temperature, electron density, electron entropy () and pressure () derived from this analysis are shown in Fig 5. The temperature profile remains almost constant up to 30 though it shows a small drop between 15-20 bin. The temperature in the central 5 bin is somewhat lower than the temperature in the 10–15 bin. The entropy profile exhibits a gradual rise from the central lower value while the density and pressure profiles exhibit gradual decrease from the centre and are in agreement with the observations in several other cool core clusters (Bîrzan et al., 2004; Forman et al., 2005; Rafferty et al., 2006; Dunn & Fabian, 2006; McNamara & Nulsen, 2007; Dunn & Fabian, 2008; Vagshette et al., 2016; Ghirardini et al., 2017; Su et al., 2017; Gendron-Marsolais et al., 2017). The vertical dotted line in the figure marks the position at which a sharp jump in temperature was observed. This temperature jump at 20 arcsec, far away from the cluster centre, indicated the presence of a cold front in the ICM. A detailed investigation on the cold front is presented in Section 4.3. Due to relatively short exposure of each of the Chandra observations of the source at a redshift of 0.342, it was difficult to obtain the sectoral thermodynamical profiles of the cluster emission.
The cooling time for this cluster was derived by using the relation
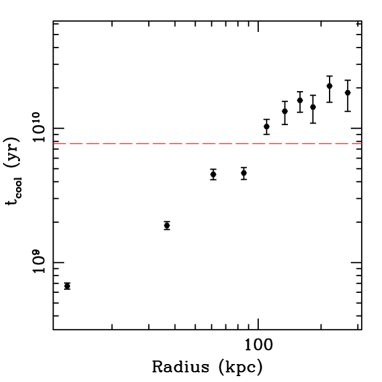
| (1) |
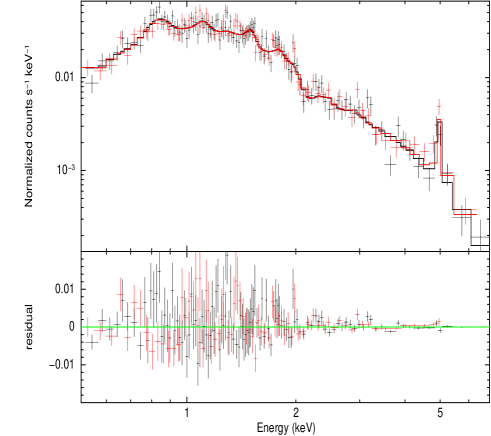
where ne, nH, and represent the electron and hydrogen number densities, temperature and the cooling function, respectively (Cavagnolo et al., 2009). Using this expression, cooling time profile was generated and is shown in Fig. 6. The horizontal dashed line in the figure represents the look-back time at 7.7 Gyr (Rafferty et al., 2006). The cooling radius Rcool, the radius at which cooling time corresponds to 7.7 Gyr, was estimated to be 100 kpc (20 arcsec). Eqn. 1 yields the cooling time of the gas in the core of this cluster to be 7 108 yr. Cooling luminosity of the ICM was also estimated by spectral fitting the data extracted from a circular region of 100 kpc radius from the core of the cluster centre. The 0.5–7 keV spectrum was fitted well with the same collisional equilibrium plasma (APEC) code modified with fixed Galactic absorption. The best-fit parameters obtained from the fit are – temperature = 3.41 keV and metal abundances = 0.480.07. The reduced for the best-fit model was 1.04 (/dof = 218.46/209). The cluster emission spectrum within the cooling radius and the best-fit model are shown in Fig. 7. The cooling power within the cooling radius was estimated in 2-10 keV band and was found to be Lcool = 8.48 erg s-1 .
3.3 Peculiar features in the cluster
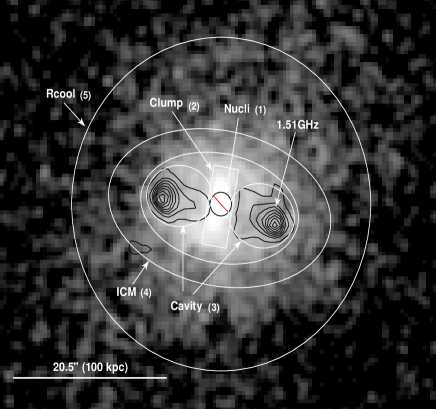
3C 320 galaxy shows various interesting features in its core region. For detailed investigation of these features, spectra were extracted from selective regions to examine the temperature and metal abundance distribution. The regions used for the selection are marked in Fig. 8. In this figure, the radio contours (black colour), generated from 1.51 GHz NRAO/VLA Archive Survey (Project ID: AG250), are overlaid on the 2 smoothed Chandra image. The lowest contour line of 1.51 GHz image is at 3 mJy/beam whereas the noise level (rms) is 80 Jy/beam. These contours appear to fill the X-ray cavities along East and West directions. Spectra for each of the selected regions in the figure were extracted separately. To study the spectral properties of the central point source in 3C 320, spectrum was extracted from a circular region of 1.5 arcsec radius, centered on the peak of the X-ray emission (RA=15h 31m 25.38s; DEC=+35d 33m 40.46s). The central source spectrum was fitted well with the APEC and power law model independently and the best fit parameters are given in Table 1. Spectra, extracted from other marked regions in Fig. 8 such as clumpy (excluding central nuclear) region marked as 2, cavity regions (marked as 3) and surrounding cavity (ICM) region (marked as 4) were also fitted with APEC model and the best-fit parameters are quoted in Table 1.
| Region | kT (keV) | Z (Z⊙) | ||
|---|---|---|---|---|
| ICM | 4.29 | – | (0.50) | 39.3636 |
| East Cavity | 3.74 | – | (0.50) | 36.1235 |
| West Cavity | 3.00 | – | (0.50) | 20.2122 |
| Clumpy region | 2.99 | – | (0.50) | 40.8335 |
| Nucleus | 3.27 | – | (0.50) | 22.2822 |
| – | 2.14 | – | 22.6922 |
4 Discussion
4.1 Cavity energetics
X-ray deficient regions (cavities) in the environment of galaxy clusters are known to be created due to the AGN outburst. Total outburst energy () of an AGN can be estimated by measuring the volume ‘’ of the cavities and the pressure (‘’) of surrounding ICM. Fig. 3 showed a pair of cavities in 3C 320 along the East and West directions associated with the central engine of the galaxy. These cavities are assumed to be ellipsoidal, symmetric about the plane of the sky, centres of which lie in the plane perpendicular to the line of sight (Cavagnolo et al., 2010). Using these assumptions, physical parameters of each of the cavity were estimated. The size of the cavities, marked with white ellipses in Fig. 8, were determined through visual inspection as done in other cases (Bîrzan et al., 2004; Cavagnolo et al., 2011; Vagshette et al., 2016). Radio lobes due to the AGN jets are known to fill the X-ray deficient regions (cavities) in the ICM. The energy stored in each of the cavity was estimated by using the relation (Bîrzan et al., 2004; Rafferty et al., 2006)
| (2) |
where represents the volume of the cavity given by = 4/3, and are the semi-major and semi-minor axes and is the thermal pressure exerted by radio bubbles on the surrounding ICM. Assuming that cavities are filled with the relativistic fluid, we chose =4/3. The cavity power () injected into the ICM was estimated by dividing the energy content of the cavity by its age (i.e. ), where cavity age was calculated by three different methods viz. buoyant rise time (), refill time () and sound crossing time () (McNamara et al., 2000; Bîrzan et al., 2004). Here, is the time taken by the bubble to rise buoyantly to attain terminal velocity, is the time to refill the volume which was displaced by the bubble and is the time required for the cavities to reach the present location from the centre, moving at the local sound speed. In the present study, we assume that provides good estimate of age of the cavity whereas and provide lower and upper limits, respectively. Table 2 presents the physical parameters of cavities, ages and their mechanical energy contents.
As described above, average pressure surrounding the radio bubble was found to be = 1.080.3110-10 erg cm-3. Using this value, the total cavity energy (sum of E-cav and W-cav energies) was derived to be = 7.702.201059 erg. The AGN feedback power was calculated by using the values of Ecav and tage. In this calculation, we assume that the provides good estimate of the cavity age while and gives the upper and lower limits, respectively. Here is taken to be the average age of E-cav and W-cav for all three estimations. Using these assumptions, the total AGN feedback power was estimated to be = 3.521044 erg s-1. The total mechanical power required to inflate the cavities is found to be approximately twice the cooling power, suggesting that the AGN hosted by this system delivers sufficient power to balance the radiative cooling loss of the ICM.
| Parameters | E-cavity | W-cavity |
|---|---|---|
| Semi-major axis (; in kpc) | 21.3 | 21.8 |
| Semi-minor axis (; in kpc) | 18.0 | 18.7 |
| Projected distance from centre (; in kpc) | 36.87 | 38.67 |
| Volume (in cm3) | 8.39 | 9.32 |
| E ( erg) | 3.61.1 | 4.01.2 |
| ( yr) | 3.50.18 | 3.70.19 |
| ( yr) | 6.72.32 | 7.12.45 |
| ( yr) | 12.88.90 | 13.49.26 |
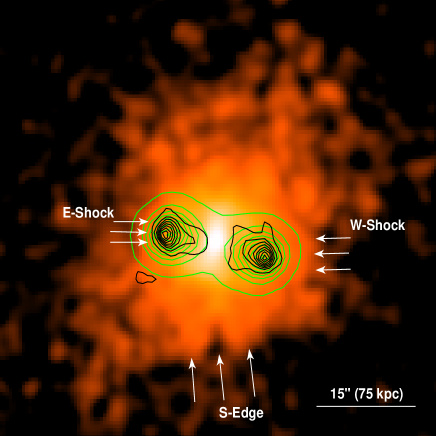
4.2 Shock around bubbles
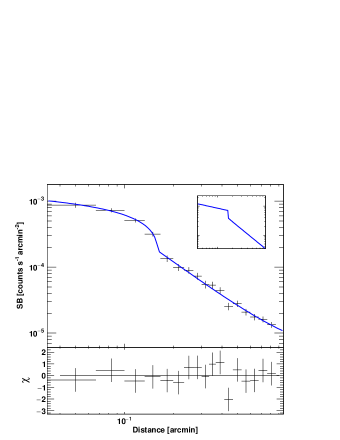
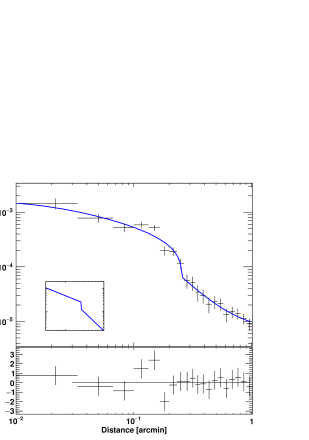
Figure 9 shows the 2 Gaussian smoothed 0.5–3 keV Chandra image overlaid with the 1.51 GHz in black (Project ID: AG250) and 1.55 GHz in green (Project ID: AG183) radio contours generated using NRAO/VLA Archive Survey of FR II 3C 320. Here, the lowest contour level of 1.55 GHz map is of 7.7 mJy/beam at the noise level (rms) of 25 Jy/beam. This figure provides a hint to the presence of shocks in front of the radio lobes along the East and West directions due to their interaction with the ICM. Detection of shocks associated with AGN outbursts are very rare and are seen in a few cases in deep Chandra observations (Nulsen et al., 2005; Gitti et al., 2011; Fabian et al., 2006; Simionescu et al., 2009; Vantyghem et al., 2014; Forman et al., 2007; Million et al., 2010; Kraft et al., 2012; Croston et al., 2011; Vagshette et al., 2017). To confirm the presence of shocks around the radio lobes in 3C 320, we generated 0.5–3 keV surface brightness profiles along the directions of radio lobes i.e. 110–200 degree and 340–400 degree angular regions in the East and West directions, respectively (Figure 10). The profiles were then fitted with the deprojected broken power law density model (bknpow) using PROFFIT (ver.1.4) package (Eckert et al., 2011). This model assumes spherically symmetric hydrodynamic model for shock produced due to point explosion at the nucleus (Nulsen et al., 2005). The best fit broken power law model along with the surface brightness profile towards the East and West are shown in Fig. 10. In our surface brightness profile fitting, the inner slope (1), outer slope (2), jump location (Rsh), density jump (C) and normalization (N0) were kept free. The resultant best-fit parameters for the profiles along the East and West directions are given in the first and second rows of Table 3. The density jump (C) obtained from fitting were then converted to the shock Mach numbers by using the adiabatic index = 5/3 and Rankine-Hugoniot jump condition for gas. The Mach numbers at corresponding jump locations were derived to be 1.50.38 and 1.80.66 along East and West directions, respectively. For further confirmation of the shock features along these directions, we tried to fit the profiles by using broken beta (bknbeta) model. In this case, the inner part of the profile was fitted with the beta model while the outer part was treated with a power law component. The results obtained from this analysis are given in Table 3 and are in agreement with those obtained from the broken power law (bknpow) fit analysis. These results confirm the presence of shocks at 10 (47 kpc) along the East and 16 (76 kpc) along the West directions. The locations of the shocks and cavities are very close to one another as apparent in Fig. 9, implying that the origin of shocks and cavities are either due to an AGN outburst or multiple episodes of the AGN outbursts. However, the multiple episodes of AGN outburst in this case are unlikely to happen due to the missing evidences of multiple cavities. Therefore, a single AGN outburst as the cause of origin of close locations of shocks and cavities is more appropriate.
| region-(model) | 1/ | rc | 2 | Rsh/Rfr | C | N0 | |
|---|---|---|---|---|---|---|---|
| (arcmin) | (arcmin) | () | |||||
| E-shock-(bknpow) | 0.380.16 | – | 1.420.11 | 0.160.005 | 1.800.19 | 356.90 | 13.72/13 |
| W-shock-(bknpow) | 0.670.13 | – | 1.580.53 | 0.260.020 | 2.060.64 | 10.392.0 | 14.98/13 |
| S-edge-(bknpow) | 1.360.04 | – | 1.310.04 | 0.280.016 | 1.600.06 | 3.50.14 | 11.04/9 |
| E-shock-(bknbeta) | 0.230.03 | 0.0130.009 | 1.520.12 | 0.170.002 | 1.570.18 | 880620 | 8.37/7 |
| W-shock-(bknbeta) | 0.230.06 | 0.030.01 | 1.730.4 | 0.240.01 | 1.830.47 | 28886 | 17.2/7 |
| S-edge-(bknbeta) | 0.490.003 | 0.050.005 | 0.510.004 | 0.280.004 | 1.780.03 | 61619 | 6.56/7 |
4.3 Cold fronts
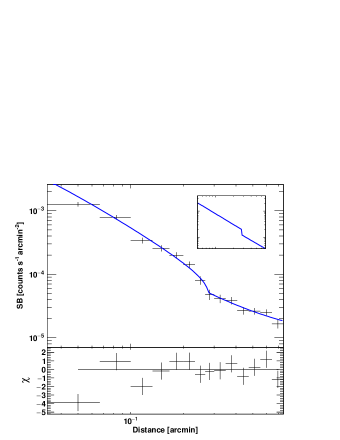
Sharp surface brightness edges (discontinuities in the surface brightness profile) forming arc-like structures in cool core clusters represent signatures of recent mergers (McNamara et al., 2000; Markevitch & Vikhlinin, 2007; Owers et al., 2009). Fig. 9 also revealed a surface brightness edge along the South (S) direction at radius of 16(82 kpc). To investigate this feature in detail, we extracted surface brightness profile in the direction of the edge e.g. S (250–310 degree sectoral region) which was then fitted with the deprojected broken power law (Fig. 11) and broken beta density model independently. This surface brightness profile confirmed a sharp density jump at 82 kpc and was found to be of 1.6–1.7. The best-fit parameters obtained from the broken power law and broken beta model fit are summarized in Table 3. Azimuthally averaged temperature profile (Figure 5) also showed temperature jump at approximately the same location (the small variation in radius may be due to 5″ binning). Due to poor statistics, spectral fitting to identify the temperature jumps along the edge direction is difficult. These features (detection of edge, density jump and temperature jump) are known to be associated with the contact discontinuities at the edge of gas clouds that are rapidly moving through the ambient gas (less dense and hot medium) called as “cold fronts” (Markevitch et al., 2000). Thus, the analysis indicates the possible detection of a cold front in the ICM of 3C 320. Such detections are very rare in the ICM in the systems at moderate redshifts. The possible detection of the cold front in the ICM of 3C 320 point towards the ongoing merger activity (Owers et al., 2009).
A careful search of literature revealed that the highest redshift cluster hosting such a cold front is MACS J1149.6+223 (=0.54; Ogrean et al. 2016), while all other detections are at low or moderate redshifts (0.2), 3C 320 (=0.342; present work), Abell 2744 (=0.308; Owers et al. 2011), 1ES0657-558 (=0.296; Owers et al. 2009), Abell 521 (=0.25; Bourdin et al. 2013), 4C+55.16 (=0.2412; Hlavacek-Larrondo et al. 2011), Abell 2163 (=0.201; Markevitch & Vikhlinin 2001). The non-detection of cold fronts at high redshifts is probably due to the lack of availability of deep high spatial resolution detectors till date.
4.4 Cooling and Star Formation
This cluster experiences radiative cooling in its core with cooling time 7 108 yr (Fig. 6) and cooling rate = 1923 M⊙ yr-1 (; McDonald et al. 2012). In 3C 320, the observed radio jets originating from the AGN feedback results in the formation of bubbles/cavities in the ICM. As the bubbles inflate, the cool, low entropy, metal-rich gas in the ICM is pushed outward forming the plume-like features around the bubbles/cavities (Hlavacek-Larrondo et al., 2011). It is also believed that these plume-like features around the bubbles/cavities can trigger star formation in the ICM. Therefore, we tried to estimate the star formation rate (SFR) by using the far-infrared 60 luminosity of the cluster 6.67 1044 erg s-1 (Andreani et al. 2002). The far-infrared luminosity was estimated by using the relation LFIR = 1.7 L60µm (Rowan-Robinson et al., 1997). Using this luminosity and the relation given by Rafferty et al. (2006), the SFR is given as,
| (3) |
This estimate provides the upper limit of star formation rate in 3C 320 as 51 M⊙ yr-1. Li et al. (2015) during the study of cool core clusters, estimate the SFR over a wide range (from 0 to few 100 M⊙ yr-1) with an average of 40 M⊙ yr-1. The measured SFR in the ICM of this cluster is in agreement with Li et al. (2015) and is found to be approximately 1/4th of the cooling rate.
5 Conclusions
We presented results obtained from the systematic analysis of a total of 110 ks Chandra observations of a moderate redshift (=0.342) galaxy cluster 3C 320. A pair of prominent X-ray cavities at an average distance of 38 kpc from its centre are detected along the East and West directions of 3C 320. The total outburst energy, age and cavity power were estimated to be 7.70 1059 erg, 7 107 yr and 3.5 1044 erg s-1, respectively. The cooling luminosity within the cooling radius of 100 kpc was found to be erg s-1, lower than the cavity power. This indicates that the cavity power is sufficient enough to balance the ICM cooling. AGN driven weak shocks at 47 kpc and 76 kpc from the cluster centre along the East and West directions, respectively, were also detected around the radio bubbles. Using the observed density jumps of 1.8 and 2.1 at the shock locations along the East and West directions, respectively, the Mach numbers were yielded to be 1.6 and 1.8. A surface brightness edge was also detected in the Chandra image along the South direction at 82 kpc from the centre. The density jump at the edge location was estimated to be 1.6 and is probably due to the presence of a cold font. 3C 320 is the second highest redshift cluster that hosts cold front. Using the FIR luminosity, the star formation rate was estimated to be 51 M which is 1/4th of the cooling rate.
6 Acknowledgments
The authors sincerely thank the anonymous referee for constructive comments and valuable suggestions on the paper. This work has made use of data from the Chandra, VLA and Gemini-South archive, NASA’s Astrophysics Data System(ADS), Extragalactic Database (NED), software provided by the Chandra X-ray Centre (CXC), HEASOFT for spectral fitting and Veusz plotting tools. NDV thanks to Science and Engineering Research Board (SERB), India for providing research fund (Ref.No.: YSS/2015/001413). NDV also thanks to S. Sonkamble for his help in obtaining few of the plots in this paper and also for scientific discussion.
References
- Anders & Grevesse (1989) Anders E., Grevesse N., 1989, Geochim. Cosmochim. Acta, 53, 197
- Andrade-Santos et al. (2017) Andrade-Santos F., Jones C., Forman W. R., Lovisari L., Vikhlinin A., van Weeren R. J., Murray S. S., Arnaud M., Pratt G. W., Démoclès J., Kraft R., Mazzotta P., et al. 2017, ApJ, 843, 76
- Andreani et al. (2002) Andreani P., Fosbury R. A. E., van Bemmel I., Freudling W., 2002, A&A, 381, 389
- Bîrzan et al. (2004) Bîrzan L., Rafferty D. A., McNamara B. R., Wise M. W., Nulsen P. E. J., 2004, ApJ, 607, 800
- Böhringer & Werner (2010) Böhringer H., Werner N., 2010, A&A Rev., 18, 127
- Bourdin et al. (2013) Bourdin H., Mazzotta P., Markevitch M., Giacintucci S., Brunetti G., 2013, ApJ, 764, 82
- Cavagnolo et al. (2009) Cavagnolo K. W., Donahue M., Voit G. M., Sun M., 2009, ApJS, 182, 12
- Cavagnolo et al. (2010) Cavagnolo K. W., McNamara B. R., Nulsen P. E. J., Carilli C. L., Jones C., Bîrzan L., 2010, ApJ, 720, 1066
- Cavagnolo et al. (2011) Cavagnolo K. W., McNamara B. R., Wise M. W., Nulsen P. E. J., Brüggen M., Gitti M., Rafferty D. A., 2011, ApJ, 732, 71
- Conroy & Ostriker (2008) Conroy C., Ostriker J. P., 2008, ApJ, 681, 151
- Croston et al. (2011) Croston J. H., Hardcastle M. J., Mingo B., Evans D. A., Dicken D., Morganti R., Tadhunter C. N., 2011, ApJ, 734, L28
- David et al. (2009) David L. P., Jones C., Forman W., Nulsen P., Vrtilek J., O’Sullivan E., Giacintucci S., Raychaudhury S., 2009, ApJ, 705, 624
- Dong et al. (2010) Dong R., Rasmussen J., Mulchaey J. S., 2010, ApJ, 712, 883
- Douglas et al. (1996) Douglas J. N., Bash F. N., Bozyan F. A., Torrence G. W., Wolfe C., 1996, AJ, 111, 1945
- Dunn & Fabian (2006) Dunn R. J. H., Fabian A. C., 2006, MNRAS, 373, 959
- Dunn & Fabian (2008) Dunn R. J. H., Fabian A. C., 2008, MNRAS, 385, 757
- Eckert et al. (2011) Eckert D., Molendi S., Paltani S., 2011, A&A, 526, A79
- Fabian (1994) Fabian A. C., 1994, ARA&A, 32, 277
- Fabian et al. (2006) Fabian A. C., Sanders J. S., Taylor G. B., Allen S. W., Crawford C. S., Johnstone R. M., Iwasawa K., 2006, MNRAS, 366, 417
- Forman et al. (2007) Forman W., Jones C., Churazov E., Markevitch M., Nulsen P., Vikhlinin A., Begelman M., Böhringer H., Eilek J., Heinz S., Kraft R., Owen F., Pahre M., 2007, ApJ, 665, 1057
- Forman et al. (2005) Forman W., Nulsen P., Heinz S., Owen F., Eilek J., Vikhlinin A., Markevitch M., Kraft R., Churazov E., Jones C., 2005, ApJ, 635, 894
- Gendron-Marsolais et al. (2017) Gendron-Marsolais M., Kraft R. P., Bogdan A., Hlavacek-Larrondo J., Forman W. R., Jones C., Su Y., Nulsen P., Randall S. W., Roediger E., 2017, ApJ, 848, 26
- Ghirardini et al. (2017) Ghirardini V., Ettori S., Amodeo S., Capasso R., Sereno M., 2017, A&A, 604, A100
- Ghizzardi et al. (2010) Ghizzardi S., Rossetti M., Molendi S., 2010, A&A, 516, A32
- Gitti et al. (2012) Gitti M., Brighenti F., McNamara B. R., 2012, Advances in Astronomy, 2012, 6
- Gitti et al. (2011) Gitti M., Nulsen P. E. J., David L. P., McNamara B. R., Wise M. W., 2011, ApJ, 732, 13
- Harvanek & Stocke (2002) Harvanek M., Stocke J. T., 2002, AJ, 124, 1239
- Heinz et al. (2006) Heinz S., Brüggen M., Young A., Levesque E., 2006, MNRAS, 373, L65
- Hlavacek-Larrondo et al. (2011) Hlavacek-Larrondo J., Fabian A. C., Sanders J. S., Taylor G. B., 2011, MNRAS, 415, 3520
- Kalberla et al. (2005) Kalberla P. M. W., Burton W. B., Hartmann D., Arnal E. M., Bajaja E., Morras R., Pöppel W. G. L., 2005, A&A, 440, 775
- Kraft et al. (2012) Kraft R. P., Birkinshaw M., Nulsen P. E. J., Worrall D. M., Croston J. H., Forman W. R., Hardcastle M. J., Jones C., Murray S. S., 2012, ApJ, 749, 19
- Li et al. (2015) Li Y., Bryan G. L., Ruszkowski M., Voit G. M., O’Shea B. W., Donahue M., 2015, ApJ, 811, 73
- Markevitch et al. (2000) Markevitch M., Ponman T. J., Nulsen P. E. J., Bautz M. W., Burke D. J., David L. P., Davis D., Donnelly R. H., Forman W. R., +13 authours, 2000, ApJ, 541, 542
- Markevitch & Vikhlinin (2001) Markevitch M., Vikhlinin A., 2001, ApJ, 563, 95
- Markevitch & Vikhlinin (2007) Markevitch M., Vikhlinin A., 2007, Phys. Rep., 443, 1
- Massaro et al. (2013) Massaro F., Harris D. E., Tremblay G. R., Liuzzo E., Bonafede A., Paggi A., 2013, ApJS, 206, 7
- Mathis et al. (2005) Mathis H., Lavaux G., Diego J. M., Silk J., 2005, MNRAS, 357, 801
- Mazzotta et al. (2001) Mazzotta P., Markevitch M., Vikhlinin A., Forman W. R., David L. P., van Speybroeck L., 2001, ApJ, 555, 205
- McCarthy et al. (1991) McCarthy P. J., van Breugel W., Kapahi V. K., 1991, ApJ, 371, 478
- McDonald et al. (2012) McDonald M., Bayliss M., Benson B. A., Foley R. J., Ruel J., Sullivan P., Veilleux S., Aird K. A., Ashby M. L. N., Bautz M., Bazin G., Bleem L. E., Brodwin M., Carlstrom J. E., Chang C. L., Cho H. M., Clocchiatti A., et. al. 2012, Nature, 488, 349
- McNamara & Nulsen (2007) McNamara B. R., Nulsen P. E. J., 2007, ARA&A, 45, 117
- McNamara & Nulsen (2012) McNamara B. R., Nulsen P. E. J., 2012, New Journal of Physics, 14, 055023
- McNamara et al. (2005) McNamara B. R., Nulsen P. E. J., Wise M. W., Rafferty D. A., Carilli C., Sarazin C. L., Blanton E. L., 2005, Nature, 433, 45
- McNamara et al. (2000) McNamara B. R., Wise M., Nulsen P. E. J., David L. P., Sarazin C. L., Bautz M., Markevitch M., Vikhlinin A., Forman W. R., Jones C., Harris D. E., 2000, ApJ, 534, L135
- Million et al. (2010) Million E. T., Werner N., Simionescu A., Allen S. W., Nulsen P. E. J., Fabian A. C., Böhringer H., Sanders J. S., 2010, MNRAS, 407, 2046
- Nulsen et al. (2005) Nulsen P. E. J., Hambrick D. C., McNamara B. R., Rafferty D., Birzan L., Wise M. W., David L. P., 2005, ApJ, 625, L9
- Nulsen et al. (2005) Nulsen P. E. J., McNamara B. R., Wise M. W., David L. P., 2005, ApJ, 628, 629
- O’Dea et al. (2008) O’Dea C. P., Baum S. A., Privon G., Noel-Storr J., Quillen A. C., Zufelt N., Park J., Edge A., Russell H., Fabian A. C., Donahue M., Sarazin C. L., McNamara B., Bregman J. N., Egami E., 2008, ApJ, 681, 1035
- Ogrean et al. (2016) Ogrean G. A., van Weeren R. J., Jones C., Forman W., Dawson W. A., Golovich N., Andrade-Santos F., Murray S. S., Nulsen P., Roediger E., Zitrin A., Bulbul E., Kraft R., +14 Authors ., 2016, ApJ, 819, 113
- Owers et al. (2009) Owers M. S., Nulsen P. E. J., Couch W. J., Markevitch M., 2009, ApJ, 704, 1349
- Owers et al. (2011) Owers M. S., Randall S. W., Nulsen P. E. J., Couch W. J., David L. P., Kempner J. C., 2011, ApJ, 728, 27
- Pandge et al. (2012) Pandge M. B., Vagshette N. D., David L. P., Patil M. K., 2012, MNRAS, 421, 808
- Pandge et al. (2013) Pandge M. B., Vagshette N. D., Sonkamble S. S., Patil M. K., 2013, Ap&SS, 345, 183
- Rafferty et al. (2006) Rafferty D. A., McNamara B. R., Nulsen P. E. J., Wise M. W., 2006, ApJ, 652, 216
- Roger et al. (1986) Roger R. S., Costain C. H., Stewart D. I., 1986, A&AS, 65, 485
- Rowan-Robinson et al. (1997) Rowan-Robinson M., Mann R. G., Oliver S. J., Efstathiou A., Eaton N., Goldschmidt P., Mobasher B., Serjeant S. B. G., Sumner T. J., Danese L., authors ., 1997, MNRAS, 289, 490
- Saikia et al. (2001) Saikia D. J., Jeyakumar S., Salter C. J., Thomasson P., Spencer R. E., Mantovani F., 2001, MNRAS, 321, 37
- Sanderson et al. (2006) Sanderson A. J. R., Ponman T. J., O’Sullivan E., 2006, MNRAS, 372, 1496
- Simionescu et al. (2009) Simionescu A., Roediger E., Nulsen P. E. J., Brüggen M., Forman W. R., Böhringer H., Werner N., Finoguenov A., 2009, A&A, 495, 721
- Smith et al. (2001) Smith R. K., Brickhouse N. S., Liedahl D. A., Raymond J. C., 2001, ApJ, 556, L91
- Sonkamble et al. (2015) Sonkamble S. S., Vagshette N. D., Pawar P. K., Patil M. K., 2015, Ap&SS, 359, 21
- Spinrad et al. (1985) Spinrad H., Marr J., Aguilar L., Djorgovski S., 1985, PASP, 97, 932
- Su et al. (2017) Su Y., Nulsen P. E. J., Kraft R. P., Forman W. R., Jones C., Irwin J. A., Randall S. W., Churazov E., 2017, ApJ, 847, 94
- Vagshette et al. (2017) Vagshette N. D., Naik S., Patil M. K., Sonkamble S. S., 2017, MNRAS, 466, 2054
- Vagshette et al. (2016) Vagshette N. D., Sonkamble S. S., Naik S., Patil M. K., 2016, MNRAS, 461, 1885
- Vantyghem et al. (2014) Vantyghem A. N., McNamara B. R., Russell H. R., Main R. A., Nulsen P. E. J., Wise M. W., Hoekstra H., Gitti M., 2014, MNRAS, 442, 3192
- Vikhlinin et al. (2001a) Vikhlinin A., Markevitch M., Murray S. S., 2001a, ApJ, 551, 160
- Vikhlinin et al. (2001b) Vikhlinin A., Markevitch M., Murray S. S., 2001b, ApJ, 549, L47
- Vikhlinin & Markevitch (2002) Vikhlinin A. A., Markevitch M. L., 2002, Astronomy Letters, 28, 495
- Yaji et al. (2010) Yaji Y., Tashiro M. S., Isobe N., Kino M., Asada K., Nagai H., Koyama S., Kusunose M., 2010, ApJ, 714, 37