Suppression of Shastry-Sutherland phase driven by electronic concentration reduction in magnetically frustrated Ce2Pd2Sn1-yIny alloys
Abstract
Shastry-Sutherland lattice was observed as alternative ground state in Rare Earth intermetallic with Mo2B2Fe and U2Pt2Sn anisotropic structures where magnetic frustration is favored. In the case of Ce2Pd2Sn, it was shown that such phase can be suppressed by the application of magnetic field and, in this work, its stability is studied as a function of the electronic concentration by doping the Sn(4+) lattice with In(3+) atoms. Magnetic and specific heat measurements show that around 50% substitution the Shastry Sutherland lattice vanishes in a critical point. This result confirms the strong dependence of that phase on the electron density because a recent investigation on the Pd rich solid solution Ce2+ϵPd2-ϵIn1-xSnx (with ) demonstrates that atomic disorder dominates the phase diagram at intermediate Sn/In concentration inhibiting magnetic frustration effects. In the alloys investigated in this work, the character stabilizes the ferromagnetic ground state all along the concentration, allowing the Shastry Sutherland lattice formation on the Sn rich side.
I Introduction
Intermetallic compounds with the formula (with rare earths, transition metals and Sn, In, Pb and Cd) have received considerable attention due to their varied behaviors, such as intermediate valence a , non-Fermi liquid b ; Yb2Sn/In and quantum phase transitions Yb2Sn/In ; d . Most of these compounds crystallize in the tetragonal Mo2FeB2-type Fourgeot , whereas a few of them are formed in a related variant U2Pt2Sn-type. Both structures consist of alternate -planes and –planes stacked along the axis. In the first layers, magnetic atoms form a network of triangles and squares (mimicking a pinwheel mosaic). This geometry provides the ideal conditions for magnetic frustration and the consequent formation of the Shastry-Sutherland phase as alternative ground state, provided that the interactions between next neighbors may form a square lattice of magnetic dimers. In fact, Shastry-Sutherland (ShSu) lattices ShSu were observed in intermetallic compounds like Yb2Pt2Pb Aronson ; Aronson2 crystallizing in the U2Pt2Sn-type and Ce2Pd2Sn Ce2Pd2Sn with the Mo2FeB2-type.
In the case of Ce2Pd2Sn the ShSu phase is detected between a temperature () at which neighboring Ce atoms form magnetic dimers distributed at the corners of a simple square 2D lattice and a FM transition () at which inter-plane interactions transform the system into a 3D magnet Ce2Pd2Sn . The magnetic stability of this phase in Ce2Pd2Sn was previously studied under magnetic field supress , detecting that it is suppressed at a critical field T.
In order to recognize the stability of that phase as a function of electronic concentration, the progressive substitution of tetravalent (4+) Sn atoms by trivalent (3+) In ones was investigated. The isotypic Ce2Pd2In is known to form in the same Mo2B2Fe-type structure Fourgeot . However, instead of a stoichiometric compound it was determined that it forms as a solid solution Ce2+ϵPd2-ϵIn 2000 around that concentration. Moreover, the low temperature magnetic properties were recognized to depend on the relative excess of Ce () or Pd () resulting in ferromagnetic (FM) or antiferromagnetic (AFM) ground states (GS) respectively 2000 ; ElectrConc . These two branches on the rich side allows to study the ShSu lattice stability within the Ce2Pd2Sn1-yIny alloys following to comparable trails, one pointing to a FM and the other to an AFM final GS.
Recently, the branch, i.e. starting from the AFM sate in Ce2Pd2(In1-xSnx), was reported InAFM to show relevant atomic disorder for that inhibits the formation of the ShSu lattice at higher Sn content. Such magnetic disorder is reflected in a broadening of the transition at that concentration. Complementary, in this work we report on the stability of the ShSu phase following the rich Ce, Ce2.15Pd1.95Sn1-yIny FM branch, i. e. with , that forms continuously along the full Sn/In composition and show well defined magnetic transitions.
II Experimental details and results
II.1 Sample Preparation and Characterization
The samples were prepared by weighing the proper amounts of elements, then arc melted in an Argon atmosphere on a water cooled copper hearth with a tungsten electrode. To ensure good homogeneity the buttons were turned over and remelted several times. Weight losses after melting were always smaller than 0.5 mass percent. Later, the samples were annealed at 750 oC for ten days and quenched in cold water. Scanning electron microscopy (SEM), and electron probe micro-analysis (EPMA) based on energy-dispersive X-ray spectroscopy were used to examine phase compositions. The compositional contrast was revealed in unetched samples by means of a backscattered electron detector (BSE). The composition values derived were usually accurate to 1 at%. X-ray diffraction (XRD) was performed on powder samples using a vertical diffractometer X-Pert with Cu Kα radiation. Lattice parameters slightly change along the concentration range from and , with a =0.5026 ratio of the mother compound Ce2Pd2Sn .
DC-magnetization measurements were carried out using a standard SQUID magnetometer operating between 1.8 and 320 K, and as a function of field up to 5 T. Specific heat was measured using a standard heat pulse technique in a semi-adiabatic He-3 calorimeter in the range between 0.5 and 20 K, at zero applied magnetic field.
II.2 Magnetic Properties
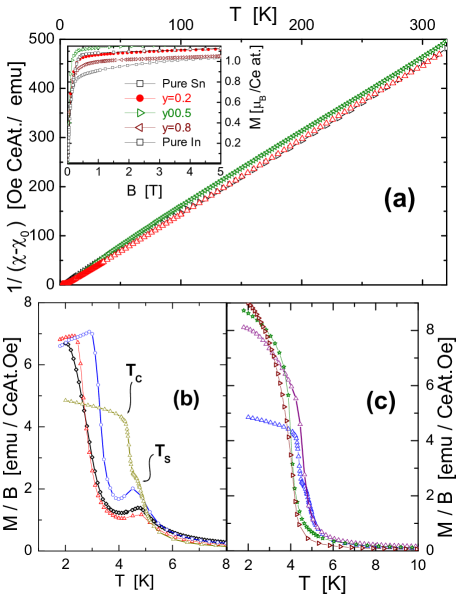
High temperature ( K) magnetic susceptibility results are properly described by a dependence, see Fig. 1a, where the first term corresponds to the temperature dependent Curie-Weiss contribution and the second to a Pauli-like contribution. This weak contribution is observed along the full concentration range with values ranging within emu/Ce at.Oe. From the inverse of one may extract the Curie constant (Cc) which indicates a large but not fully developed Ce3+ magnetic moment (i.e. per Ce atom). The paramagnetic temperature extrapolated from high temperature ( K) is notably weak K all along the concentration variation, excluding any relevant effect of local moments-conduction band hybridization or Kondo effect.
On the stoichiometric limit, the six fold degenerated state established by Hund’s rules for the angular momentum of Ce atoms is split by the crystal electric field (CEF) effect into three Kamer’s doublets with the excited ones at K and K Ce2Pd2Sn . Similar value ( K) was reported for the first excited doublet on the In side ElectrConc . This coincidence indicates that no relevant modification of the CEF occurs along the Sn/In substitution guaranteeing that the low temperature magnetic properties is governed by a pure doublet GS.
Magnetization curves at K are shown in the inset of Fig. 1a. The saturation values slightly increases from to between pure and limits, with a maximum value at the critical concentration of .
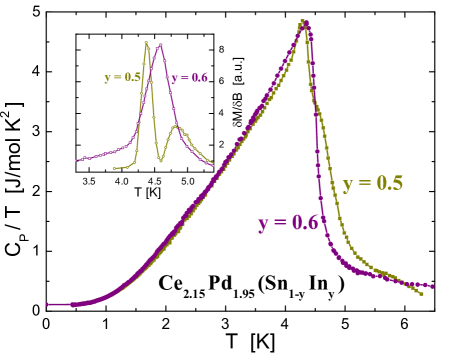
The low temperature magnetization normalized by field () is presented in Fig. 1b including the samples where both and transitions are clearly identified. Fig. 1c contains the FM magnetization of the samples.
II.3 Specific Heat
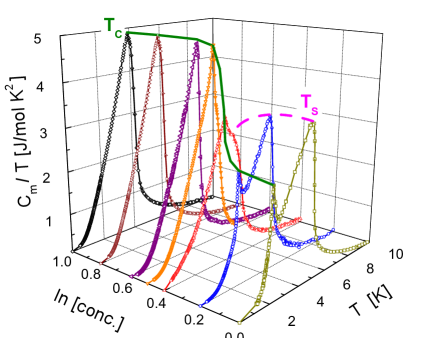
To extract the magnetic contribution () to the measured specific heat (), the La2Pd2In compound was used as a reference for the phonon subtraction Ce2Pd2Sn as . On the -rich side, the two magnetic transitions observed in magnetic measurements (see Fig. 1b) are reflected in corresponding jumps presented in Fig. 2. On the -rich side, the specific heat jump at the (dashed curve) transition between paramagnetic and ShSu phase exhibits a second order character, whereas the lower one () associated to the ferromagnetic phase shows the characteristic of a first order. However, above the critical concentration (), at which the ShSu phase is suppressed, the only transition becomes of second order keeping the tail originated in magnetic fluctuations arising above the transition.
Coincidentally with the previous study on stoichiometric Ce2Pd2Sn, the ShSu phase suppression by magnetic field, slightly changes in temperature with concentration K) whereas K increases from up to reach the critical point at K.
Notably, the height of at is clearly larger than for . This indicates that the transition at corresponds to an intermediate phase that involves a partial condensation of the available degrees of freedom which are then condensed into the FM phase at . On the contrary, the transition at for involves all magnetic degrees of freedom.
III Discussion
III.1 Magnetic phase diagram
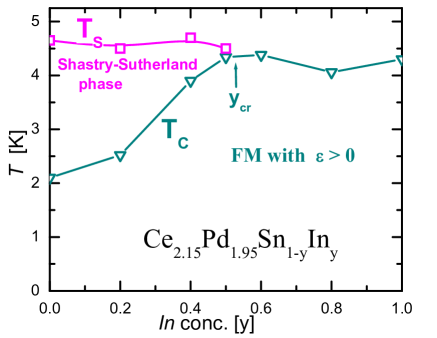
Based on magnetic and specific heat results, the evolution of the Shastry-Sutherland () and Curie () transitions can be traced as a function of increase (upper FM curves). One can see that the Shastry-Sutherland holds up to about 50% of substitution.
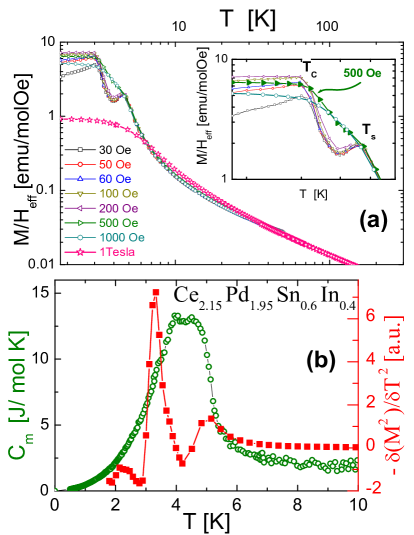
On the -rich side, the characteristics of the ShSu phase recognized in the Ce2Pd2Sn compound Ce2Pd2Sn can be traced up to the sample with 40% of In concentration. Although the difference between and in the specific heat measurements is observed as a structure in a unique anomaly, the dependence allows to better distinguish both transitions at that concentration, see Fig.4a. Both properties are better compared in the lower panel (Fig.4b), using as magnetic parameter the second derivative because in FM systems the internal magnetic energy and therefore .
Another identification of the ShSu phase can be done through its suppression by a magnetic field, which occurs at Oe, see the inset in Fig.4a. This behavior can be compared with the suppression of the ShSu phase of the stoichiometric compounds Ce 2Pd2Sn Ce2Pd2SnField , taking into account that .
III.2 Critical point
The full suppression of the ShSu phase by increasing concentration is observed slightly above the 50% of substitution, where the transition joints FM phase boundary. In Fig.5 the specific heat transitions of two neighboring concentrations, and , are compared making evident that the later does not show any structure around its maximum which is still detected in the one. Coincidentally, there is practically no difference between respective entropies collected up to the transition.
In the inset of Fig.5 the same comparison is performed on respective magnetization derivatives making the difference more evident. Notably, the first order type cusp in the sample fully disappears at the following concentration .
III.3 Physical behavior beyond the critical point
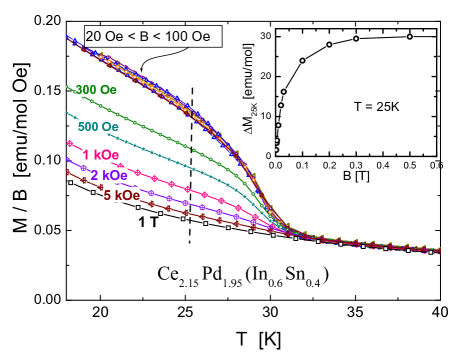
Between and 1, the typical FM dependence is observed, see Fig.1c, while shows the same behavior like for pure . Independently of these low temperature features, sample shows an unexpected ferromagnetic signal in the thermal dependence of its magnetic susceptibility arising at K, see Fig.6. This FM contribution was analyzed as a function of magnetic field at K reflected in an increase of the measured magnetization with field , see the inset in Fig.6. This FM signal is found to saturate at around 0.3 T. Such contribution cannot be explained by any foreign phase constituted by any combination of the four elements Ce-Pd-Sn-In, therefore it could be more likely related to the onset of spin density waves. A microscopic investigation on the nature of this anomaly is required to confirm its origin.
IV Conclusions
This study demonstrates that, contrary to the AFM ( ) branch of Ce2+ϵPd2-ϵ(In1-xSnx) alloys, the FM () one shows well defined transitions with irrelevant atomic disorder produced by Sn/In substitution. As a consequence the upper () and the lower () boundaries of the ShSu phase can be clearly traced up to of Sn/In substitution. The reduction of the electronic concentration driven by doping the Sn(4+) lattice with In(3+) atoms progressively weakens the stability of that phase reflected in the monotonous growing of the FM phase in detriment of the former and the consequent increase of . Magnetic field effect, analyzed at the edge of the critical concentration , shows that only 1/2 of field is required to suppress the ShSu phase in comparison to stoichiometric Ce2Pd2Sn.
Although Ce rich content () reduces atomic disorder effects allowing to extend the ShSu phase range, further decrease of electronic concentration after Sn/In substitution definitively suppresses the possibility of dimers formation on which simple square ShSu lattice builds up. Since this lattice forms within the Ce planes, one may expect that on the -rich side (i.e. ) interplane interactions arise making the system to behave like a 3D - FM as soon as the magnetic order parameter arises.
References
- (1) D. Kaczorowski, P. Rogl, K. Hiebl, in Magnetic behavior in a series of cerium ternary intermetallics: CeIn (T=Ni, Cu, Rh, Pd, Pt, and Au); Phys. Rev. B 54 (1996) 9891.
- (2) S.K. Dhar, R. Settai, Y. Ōnuki, A. Galatanu, Y. Haga, P. Manfrinetti, M. Pani, in Synthesis, crystal structure and magnetic properties of Yb8Ag18.5Al47.5, Yb2Pd2Cd and Yb1.35Pd2Cd0.65; J. Magn. Magn. Materials 308 (2007) 143.
- (3) E. Bauer, G. Hilscher, H. Michor, C. Paul, Y. Aoki, H. Sato, D. Adroja, J.-G. Park, P. Bonville, C. Godart, J. Sereni, M. Giovannini, and A. Saccone, J. Phys.: Condens. Matter 17, S999 (2005).
- (4) T. Muramatsu, T. Kanemasa, T. Kagayama, K. Shimizu, Y. Aoki, H. Sato, M. Giovannini, P. Bonville, V. Zlatic,T. Aviani, R. Khasanov, C. Rusu, A. Amato, K. Mydeen, K. Nicklas, H. Michor, E. Bauer, in Reentrant quantum criticality in Yb2Pd2Sn; Phys. Rev. B 83 (2011) 18.
- (5) F. Fourgeot, P. Gravereau, B. Chevalier, L. Fournès, J. Etourneau, in Effect of the chemical composition on the structural properties of the antiferromagnetic ternary stannides Ce2Pd2+xSn1−x (); J. Alloys Comp. 238 (1996) 102.
- (6) B. S. Shastry and B. Sutherland, Physica 108B (1981) 1069.
- (7) M.S. Kim and M.C. Aronson, in Heavy fermion compounds on the geometrically frustrated Shastry–Sutherland lattice; J. Phys.: Condens. Matter 23 (2011) 164204.
- (8) L.S. Wu, W.J. Gannon, I.A. Zaliznyak, A.M. Tsvelik, M. Brockmann, J.-S. Caux, M.S. Kim, Y. Qiu, J.R.D. Copley, G. Ehlers, A. Podlesnyak, M. C. Aronson; in Orbital-exchange and fractional quantum number excitations in an f-electron metal, Yb2Pt2Pb; Science 352 (2016) 1206.
- (9) J. G. Sereni, M. G-Berisso, A. Braghta, G. Schmerber, J. P. Kappler; Unstable Shastry-Sutherland phase in Ce2Pd2Sn, Phys. Rev. 80 (2009) 024428.
- (10) J. G. Sereni, M. Gomez Berisso, G. Schmerber, J. P. Kappler; Suppression of the Shastry-Sutherland phase in Ce2Pd2Sn at a field-induced critical point, Phys. Rev. B 81 (2010) 184429.
- (11) M. Giovannini, H. Michor, E. Bauer, and G. Hilscher, P. Rogl, T. Bonelli, F. Fauth, P. Fischer, T. Herrmannsdo, L. Keller, W. Sikora, A. Saccone and R. Ferro; in Effect of nonstoichiometry on the transition from ferromagnetism to antiferromagnetism in the ternary indides Ce1.95Pd2+2xIn1-x and Ce2+xPd1.85In1-x, Phys. Rev. B 61 (2000) 4044.
- (12) J.G. Sereni, M. Giovannini, M. Gomez Berisso, A. Saccone; in Electron concentration effects on the Shastry-Sutherland phase stability in Ce2−xPd2+yIn1−z solid solutions; Phys. Rev.B 83 (2011) 064419.
- (13) J.G. Sereni, J. Roberts, F. Gastaldo, M. G-Berisso, M. Giovannin; Shastry-Sutherland phase formation in magnetically frustrated Ce2Pd2In1-xSnx alloys. Materials Today: Proceedings (Elsevier), 2018, in presss.
- (14) M. G- Berisso, J. G. Sereni, A. Braghta, G. Schmerber, B. Chevalier, J.P. Kappler, Field suppression of the modulated phase of Ce2Pd2Sn; Physica B 404 (2009) 2930.